Abstract
The green algae Dunaliella salina offers great potential for the food industry due to its high β-carotene content. To guarantee the economic profitability of cultivation, growth conditions must be improved. Therefore, the effects of pH and salinity on the cultivation of the green alga D. salina were investigated and optimized. The simplex method was applied to find the optimum of these two parameters to maximize the biomass and the cell number of D. salina. The optimum pH was found at 7 and 8 at a salt content of 50 g/L, with a biomass content of 1.09 and 1.11 g/L, respectively. The highest biomass was found at a salinity of 50 g/L, with a final biomass of 1.11 g/L. However, by using the simplex method, an optimum product yield was found at a salinity of 64 g/L and an initial pH value of 7.2. Thus, a biomass of 1.23 mg/mL was achieved. In the single observation of both parameters, 14 experiments were conducted to obtain a satisfactory result, whereas eight runs only were required with the simplex method. This leads to the conclusion that using the simplex method is a useful way to drastically reduce the number of required experiments.
1. Introduction
Due to continuous population growth, new sources of food must be found to prevent malnutrition of broad population groups in the future. Owing to the high cell division rate of algae and the possibility of using areas that provide hostile conditions for other organisms, algae offer high potential as food supplements [1]. In countries with large wasteland areas, algae cultivation has enormous economic value, particularly in North America, followed by European, Asia–Pacific and LAMEA regions [2,3].
The algae Dunaliella salina is a unique type of green, halophilic eukaryote that is free of a cellular wall [4,5] Furthermore, it is a biflagellate microalga that is surrounded by a flexible membrane and enclosed by a mucous layer, enabling the cell to change its shape and volumetric size according to the osmotic stress surrounding the cell. Thus, it can adapt with quick and rapid changes in light intensity and availability of nutrients [6,7]. Moreover, the reproduction in D. salina occurs by longitudinal cell division or merging of two cells to form a zygote [6].
There are wide applications of D. salina, which is mainly known as the highest source for the production of β-carotene. β-carotene is a natural C40 carotenoid pigment that has essential pharmaceutical characteristics, as it restrains certain types of tumors cancers. Furthermore, it is an essential component to preventing vitamin A deficiency and has a significant result in reducing the risk of some cardiovascular diseases [8,9,10,11]. Furthermore, it is used in cosmetics and pigmentation [12]. In addition, D. salina is used to produce glycerol, which is considered as an osmoregulatory substance for concentrated salt content in the surrounding medium [13]. Moreover, its biomass is utilized in wastewater treatment and is a nutrition source for humans and animals [12].
According to the German Society for Nutrition, a daily requirement of approximately 4.65 mg β-carotene is recommended for adults [14]. Based on a population growth of 0.84 percent per year [15], the demand for β-carotene is constantly growing. Due to the wide applications of β-carotene, it is being produced on a large scale by algae cultivation in many countries [16].
The microalgae D. salina lives in hypersaline aqua cultural environments and can tolerate a board range of salinities up to 4.5 M NaCl [5]. However, several types of culturing systems have been constructed and developed as a culture system for the microalgae to grow and increase the biomass content, such as open and closed systems. The open system includes large ponds stirred by winds and stirred raceway ponds, where the closed systems are represented with bioreactors. It is worth noting that the main difference between them is how the operating parameters are being controlled and the size of cultivation [6].
Although natural/organic β-carotene is preferred by consumers, the biological production of β-carotene is in direct competition with the synthetic production, as it is well established [8]. Therefore, highly efficient processes are required to maximize the growth rate and minimize the production costs [17]. For this reason, the algae D. salina has already been extensively researched, and many different process parameters have been optimized regarding the β-carotene content [18,19]. It has been discovered that D. salina produces an increased β-carotene content, especially under stressful conditions [20].
Like all types of microalgae, D. salina requires specific conditions for optimum growth. Several studies reported that algal growth, biomass and products are a function of physical and chemical parameters, including temperature, light intensity, nutrients, carbon concentration and pH [21]. Moreover, bubble size and mixing that is characterized by rotations per minute (rpm) are important factors, as they affect the mass transfer inside the medium [4,22,23] of D. salina. In intensive industrial cultivation, the algae must endure completely different stress conditions than in nature. One of these stress conditions is hydromechanical stress caused by gasification and mixing of the cell suspension [24]
The global market for carotenoids is projected to reach USD 2.1 billion by 2030 [25]. The market is very competitive due to the large number of production options. Although synthesized carotenoids dominate in the market, naturally produced carotenoids obtained from living organisms and microorganisms are preferred due to their higher medical properties and lower potential toxic effects. Moreover, the chemical route of production is not considered as economically friendly, as they generally come from petrochemical sources. The production of carotenoids from biological sources is derived from bacteria, yeast, fungi or algae [26]. The market of carotenoids in 2022 is USD 2.0 billion, and it is expected to reach USD 2.7 billion by 2027 [27]. The main carotenoid species that are produced on industrial scales are astaxanthin and β-carotene. Astaxanthin had a market of approximately USD 0.7 billion in 2021 and is expected to raise by 62% in 2027, whereas β-carotene has a market worth around USD 0.5 billion, which is projected to rise to USD 0.8 billion in 2033 [28,29].
In order for β-carotene to have greater opportunities on the market, highly efficient processes are required for the algal production of β-carotene. During the production of β-carotene by D. salina, a binary step of cultivation is often used to maximize the biomass initially and raise the β-carotene content afterwards by stressing the cells, as the stress conditions lead to a significant decline in the growth rate, and the economy of the process is not possible [30].
There are many different methods to optimize operating conditions. The disadvantage of most of these methods is that only one parameter can be varied, while the other parameters remain constant, and these interdependent parameters can only be optimized inadequately. Because of the interdependency of many parameters in biotechnology, the single observation of one parameter without changing other parameters is not possible. A lot of experiments are necessary to find the optimum of different parameters, due to this simultaneous effect [31].
In contrast to conventional methods, using simplex caused a large reduction in the number of required experiments [32], i.e., the required experiments were reduced from 540 (if factorial design is used) to only 38 runs in order to find the optima of the yeast growth conditions (i.e., temperature and pH). The simplex method allows for the optimization of both interdependent and independent parameters at the same time. The basic idea behind the simplex method is that a geometrical figure that has a number of vertexes equal to one more than the number of parameters is stretched in a k-dimensional space. The vertex that leads to the worst results is then eliminated and replaced by a new one by reflecting the eliminated vertex on the centroid of residual vertexes. This iterative process is repeated until an optimum area has been found [33]. Moreover, simplex method can optimize multiple parameters at the same time. Furthermore, the details of using the simplex method can be found in [32,34,35].
Optimizing growth conditions is necessary to run further studies. For instance, to be able to analyze the influence of the hydromechanical stress on D. salina, the cultivation conditions concerning salinity, pH, media and inoculation volume have to be optimized. Therefore, in this study, the application of the simplex algorithm is compared with the single observation of two parameters to reduce the number of experiments, saving both time and costs. In this way, the cultivation conditions of D. salina such as pH and salinity are optimized to increase the biomass content, which means improving the growth of D. salina in the best cultivation conditions. Moreover, the relation between the biomass and absorbance of D. salina is determined. The novelty of this study is the use of the simplex method in optimizing the cultivation conditions of algae growth instead of using conventional methods.
2. Materials and Methods
2.1. Organism and Medium
D. salina 19/18 was taken from Hutt Lagoon, a hypersalinelagoon, located in Western side of Australia. It was provided by the “Culture Collection of Algae and Protozona (CCAP)” of the Scottish Marine Institute, Oban, UK.
For the cultivation, an “f/2” medium was used, and the stock solutions were supplied by CCAP. Seawater was collected from Athaiba beach, which is located in Oman; was used as solvent and was tested by a “U-50 Multiparameter Water Quality Meter” to define its properties, which are provided in Table 1.

Table 1.
Properties of Seawater from Athaiba in Oman.
The solvent was filtered through 0.45 µm filter paper before being added to the medium. The recipe of the f/2 medium is shown in Table 2. An amount of 100 mL stock solution of NaNO3 was prepared and dissolved in sterile distilled water. However, NaH2PO4 H2O was not available in the lab. Instead, 100 mL stock solution of NaH2PO4 was used in the media preparation. The molar concentration of both compounds should be the same. Thus, given the molar concentration of NaH2PO4 H2O in the recipe of the media, the amount of NaH2PO4 was determined as shown below.
where NaH2PO4—molar concentration of NaH2PO4 (mol/L), Lmedia—Volume of final Media (L) and Lsolution—Volume stock solution (L)

Table 2.
Recipe of media.
As it is necessary to prepare 100 mL, the final amount of NaH2PO4 added is
For preparation of 100 mL stock solution of NaNO3, the concentration of the stock solution is given as 75 g/L dH2O. Thus, to prepare 100 mL, the amount needed is calculated from the following equation:
The media preparation started with adding NaNO3 and NaH2PO4 to 950 mL of filtered seawater. Afterwards, the solution was placed in the microwave for 5 min as a pre-sterilization step. Both metal and vitamin solutions provided in Table 3 and Table 4 were added as supplements to the mixture, which was filled with the solvent until the solution reached a final quantity of 1 L. F/2 medium usually contains silica. Nevertheless, as D. salina does not have a cellular wall, the medium was prepared without silica, as it is not required for this species.

Table 3.
Metal solution.

Table 4.
Vitamin solution.
After the seawater was filtered through a 45 µm filter, sodium nitrate and monosodium phosphate stock solutions were added, and the pH was adjusted to 8.3 by adding HCl or NaOH. Afterwards, the mixture was autoclaved at 15 psi and 121 °C for 15 min. After autoclaving, the mixture was cooled to the room temperature. Then, filtered trace elements and vitamins were added to this mixture, and the pH was adjusted at 8 ± 0.02. All procedures were conducted under a safety cabinet to prevent contamination.
2.2. Biomass and Cell Number
The optical density (OD) of different cultures was determined by measuring the absorbance under the wavelength of 660 nm using a GENESYS 10S UV-Vis spectrophotometer. A sample of 1 mL was taken from the flask and placed in microtubes. This step was performed 3 times, and the average was taken for accuracy. After that, each sample was slowly mixed in the microtube using a micropipette before being transferred to the cuvette for OD detection. The idea of spectrophotometer is to give an indication of cell density and concentration of pigments inside the cells when the selected wavelength matches to the chromophore absorption. Therefore, other particles and colors should be removed from the measurement. This step is performed by making the media of the culture as a blank. Hence, the machine will consider the media as zero or the reference starting point. The value of the blank solution is deducted from the sample measurement and finally reported. Both blank and sample should be mixed very well and placed directly into the cuvette inside the spectrophotometer to have a uniform distribution of the cells and obtain a better estimation for the cell content in the culture. In addition, placing the cuvette sample inside the cells should be fast, as the cells will settle down, and the absorbance measurement will not be precise.
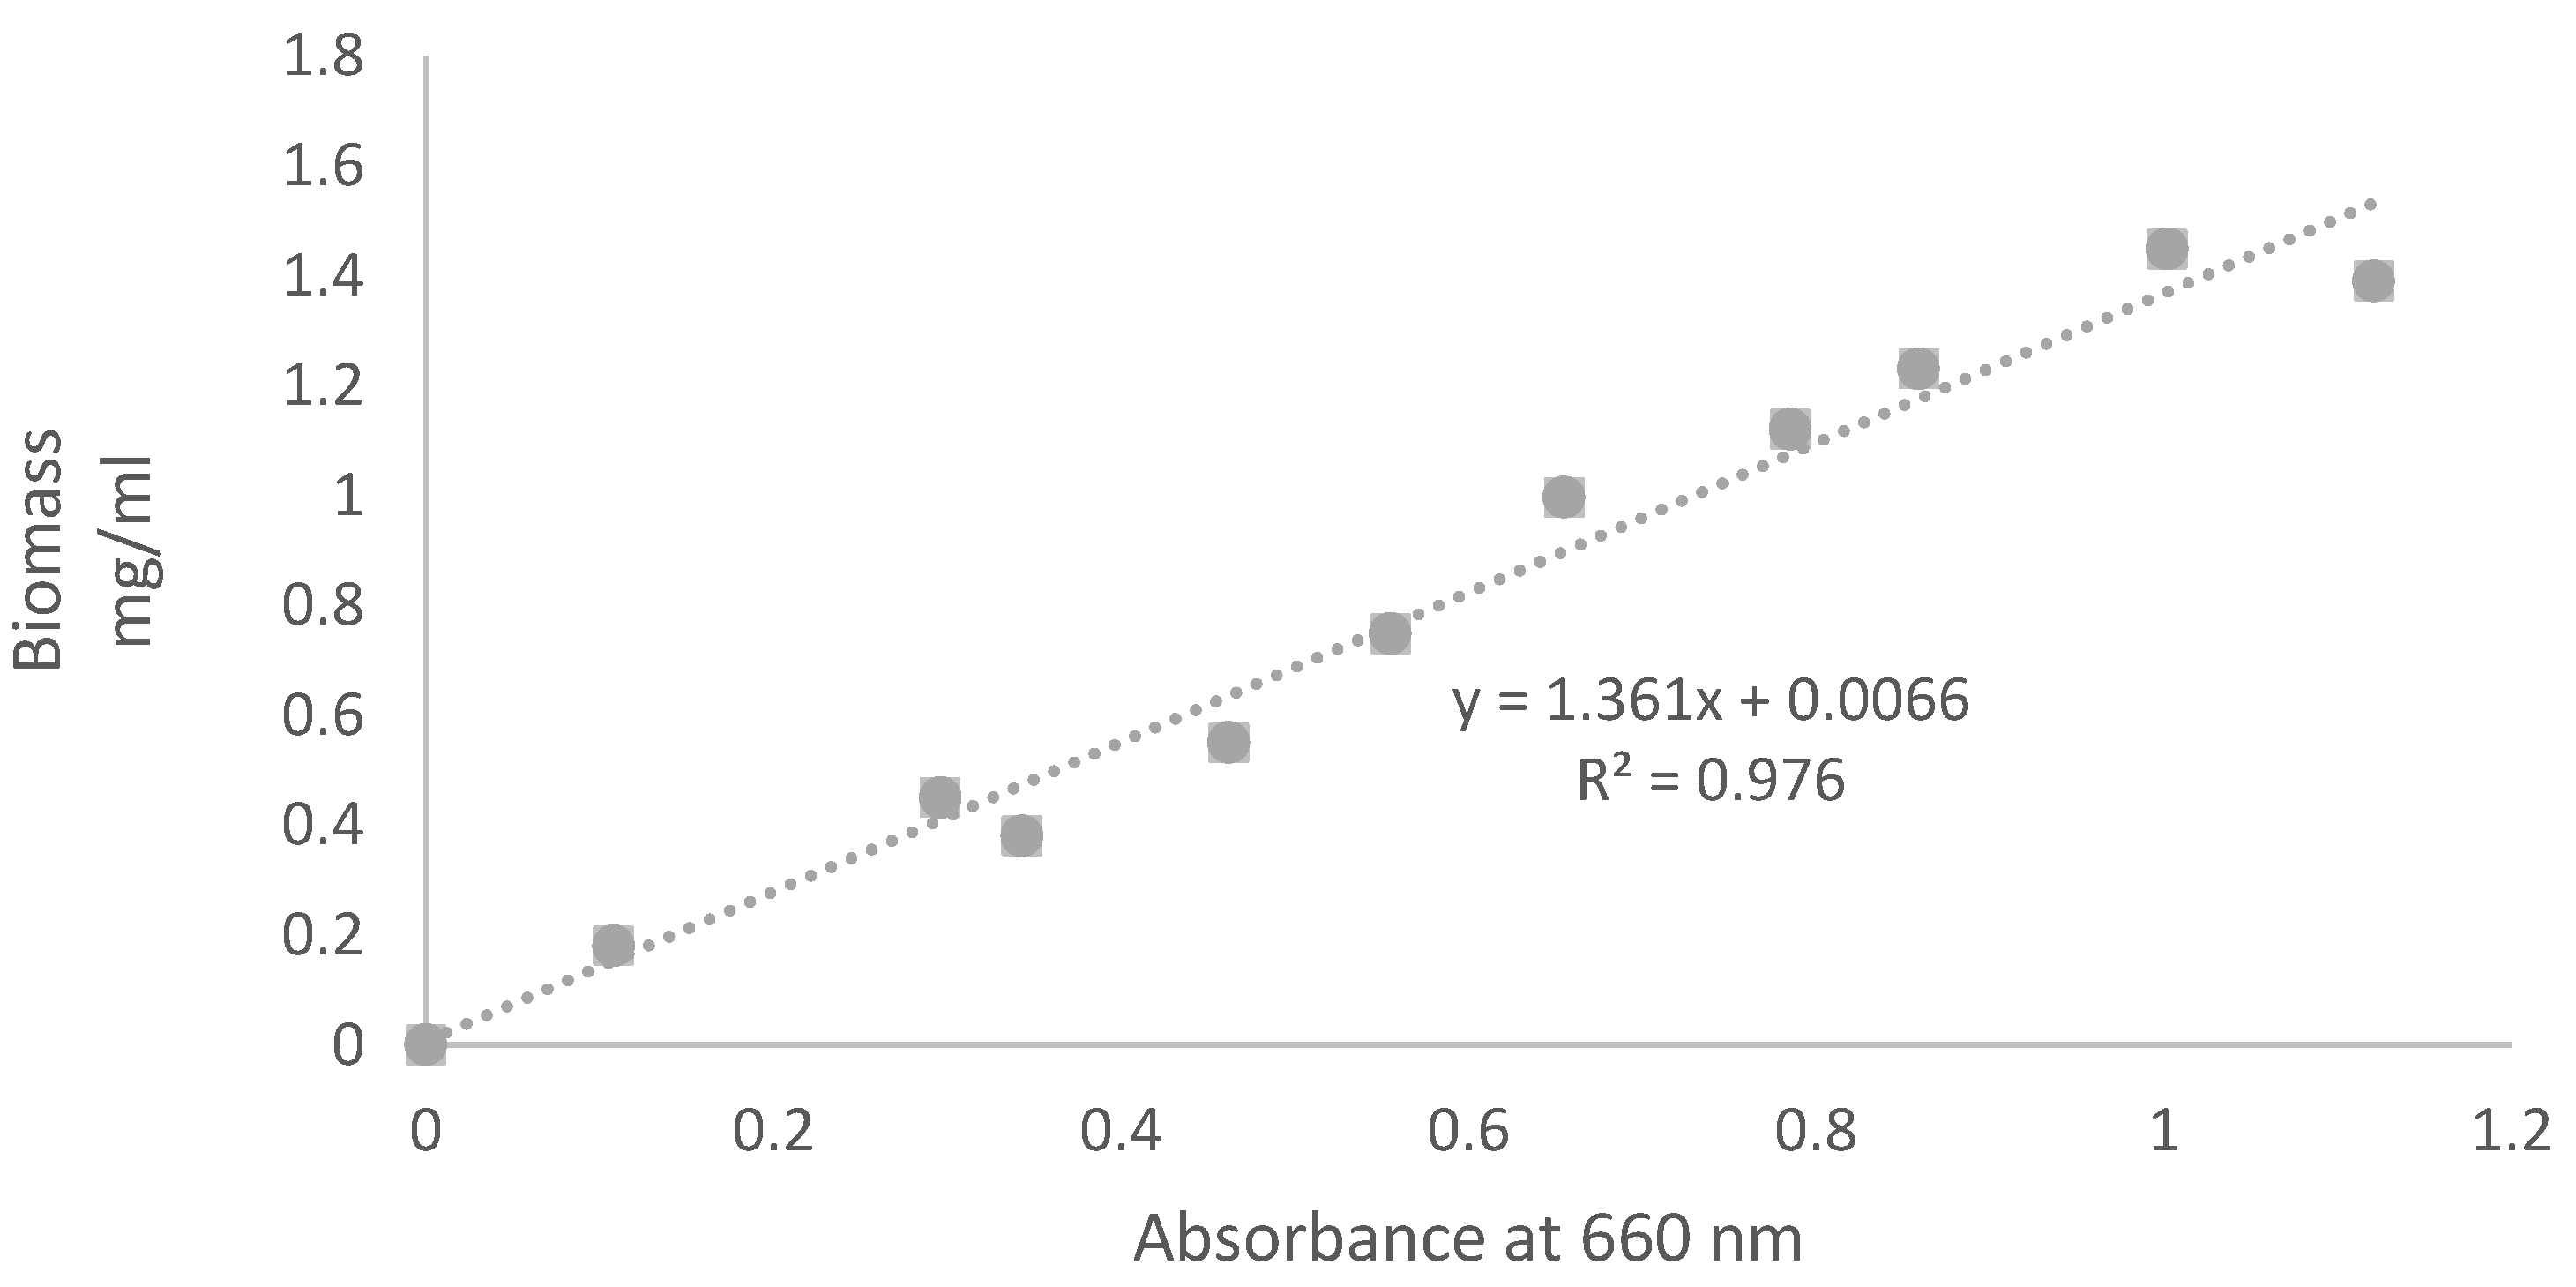
To determine the biomass and to prepare a calibration curve between biomass and absorbance, the original sample of D. salina with salinity of 50 g/L was diluted into different concentrations. The OD of 1 mL from each sample was determined using the same procedure at wavelength of 660 nm. Thus, 10 mL of the culture were taken and centrifuged at 5000 rpm for 15 min [36]. The supernatant was carefully removed from the centrifuge tubes. Afterwards, the biomass pellet was washed with distilled water and centrifuged again. The supernatant was removed, the pellet washed again and centrifuged. The biomass was dried at 105 °C and weighed until a constant weight was reached. The final weight of biomass was plotted against the absorbance. Figure 1 shows the calibration curve between biomass and absorbance.
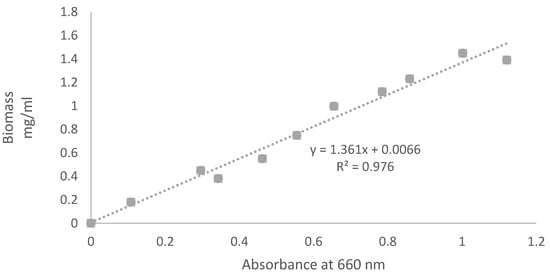
Figure 1.
Calibration curve between algae biomass and absorbance at 660 nm.
A Neubauer improved hemocytometer was used to determine the cell number of the sample. To simplify cell counting and achieve higher accuracy, the cells were fixed with the addition of formaldehyde. An amount of 10 µL was taken from the sample and placed in each side of the hemocytometer. The number of cells was counted in the 4 chambers in the corner. Then, the average was taken and multiplied by the dilution factor and 104 to obtain the real value of cell counting.
2.3. Inoculation and Cultivation Conditions
For pre-cultivation, 100 mL f/2 media was added to a 250 mL flask. Afterwards, the flask was inoculated with 10 mL of D. salina strain culture. The flask was placed in the incubator shaker at 27 °C and a rotation speed of 55 rpm until the stationary growth phase was reached. Then, the preculture was used according to the following equation to inoculate the experiments.
VInokulum = (ODInitial × Vworking volume)/ODprecultivation
After the readjustment of the initial optical density, the same starting conditions for the experiments could be guaranteed. An initial optical density of 0.050 ± 0.004 was chosen. The average light intensity in the incubator was 3000 LUX.
2.4. Experiment Set-Up Downhill Simplex
The primary steps of the downhill simplex method are identical to the one size simplex method. The vertexes of the first experiment series are ranked in decreasing order of response from best to worst. In the next step, a new simplex is formed by reflecting the worst vertex through the centroid of the remaining vertexes. The new vertex is calculated and evaluated. Four different situations may arise depending on the value of the new vertex, such as reflection, expansion and two different contractions [33]. This allows for the rapid determination of the parameters to obtain the best results. The pH level and the salt content has a great influence on the lag phase and the final biomass. These two parameters are independent of each other but are nevertheless suitable for the simplex method to shorten the lag phase and maximize the biomass. Therefore, the cultivation flasks with different starting conditions were prepared. It is possible to start the experiment at any point within the desired range of the parameters e.g., pH 4, 7 or 9 with salinities of 50 g/L or 100 g/L. During the application of the simplex algorithm, the following points were analyzed, as shown in Table 5. Unfortunately, the vertex pH 11,100 g/L could not be adequately analyzed because a lime was precipitated at this pH value. Therefore, the cells died during inoculation under these conditions. The simplex algorithm was applied until an optimum was found. The algorithm was stopped as soon as no significant differences could be found in the final biomass. Simplex algorithm codes were written with Java (detailed steps are not shown)

Table 5.
Vertexes of the simplex method.
2.5. Adjusting pH
The initial pH values were adjusted between 3 to 10, with pH increments of 1 each time by using the 1M HCl and 1M NaOH solution. The medium was set to 50 g NaCl per liter. During the application of the simplex method, the most promising pH values were analyzed with varying salt content. To avoid contamination, 2 mL were taken daily, and the pH value was determined from it to indicate the effect of D. salina on the pH values of the culture over a period of 15 days.
2.6. Adjusting Salinity
To analyze the influence of salinity on D. salina, the salinity was adjusted to different values with NaCl. Salinities of 35 g/L, 50 g/L 100 g/L, 150 g/L, 200 g/L and 250 g/L were chosen, and the influence of salt content was tested in flasks The pH was adjusted to pH value of 9.
During the application of the simplex method, the most promising salinity values were analyzed with varying pH values.
2.7. Specific Growth Rate of D. salina
The kinetic model of the growth rate during the exponential phase has been determined. It has been calculated as a first order chemical reaction to obtain the number of generated cells with time and obtain the doubling time of the cell. The specific growth rate was calculated as follows:
where X is final number of cells, X0 is the initial number of cells, µ is the specific growth rate, and t is the time interval between the final number of cells and the initial number of cells.
Μ = ln(X/X0)/t
3. Results
3.1. Single Observation Experiments
3.1.1. Salinity
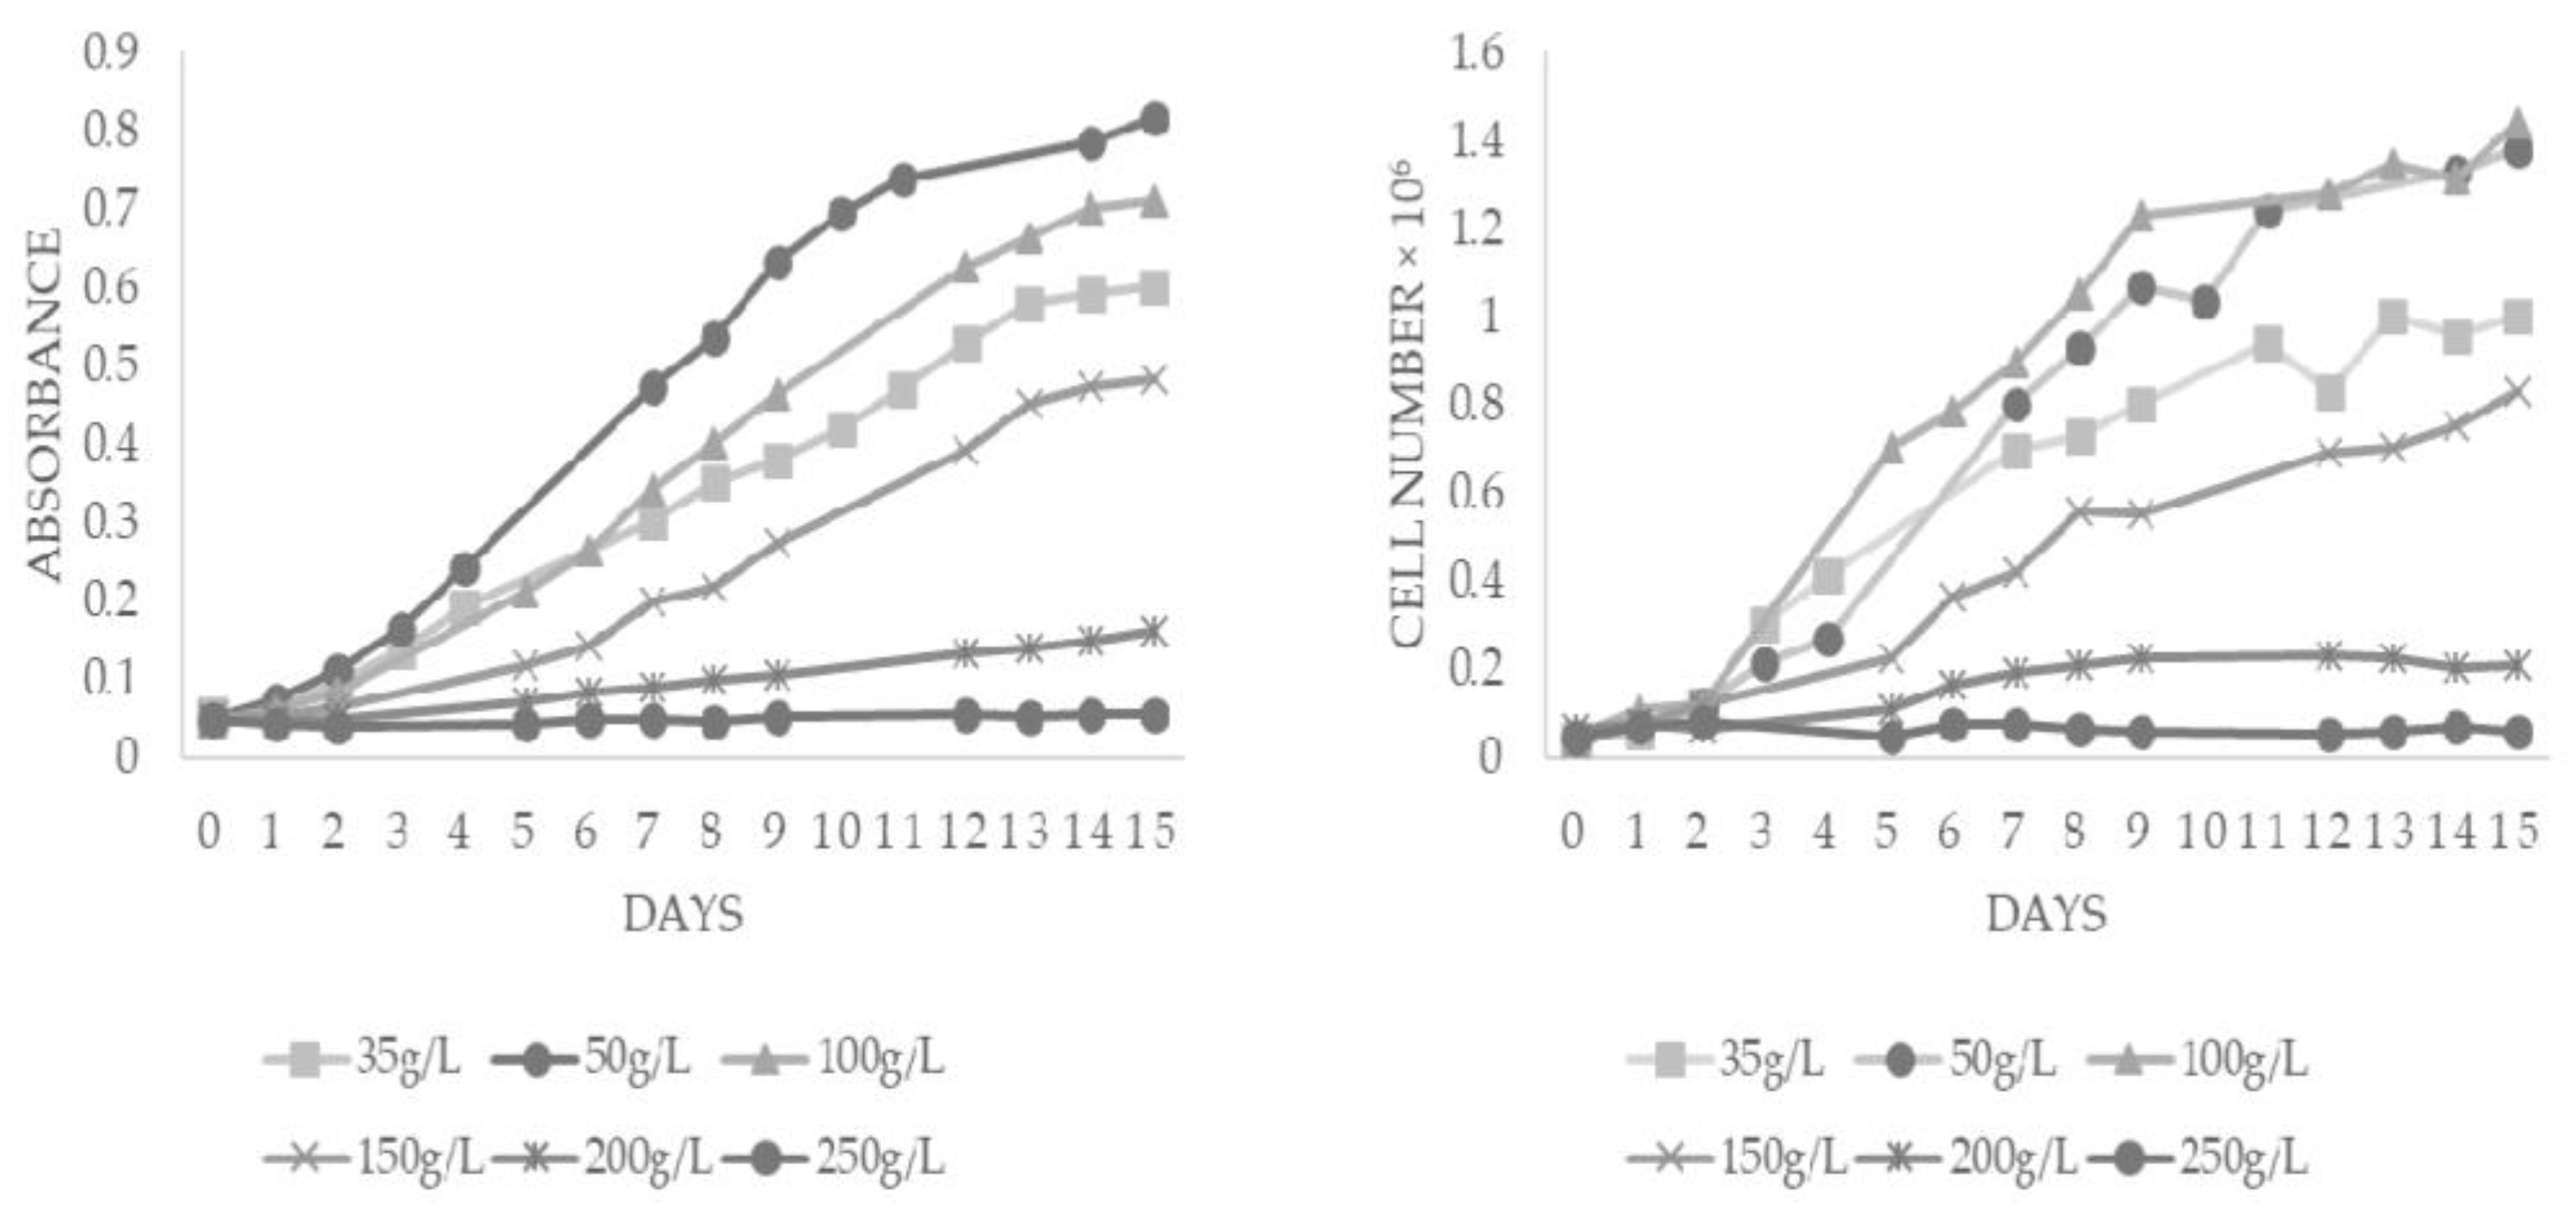
The results of different salinity-level experiments showed that the salinity has a great influence on both the lag phase and the final biomass concentration. Neither too high nor too low salt content is conducive to growth. As can be seen in Figure 2, the highest final absorbance of 0.817 can be achieved at a salt concentration of 50 g/L, while the salinity of 35 g/L causes a decline in the growth behavior. However, with a further increase in salinity above 50 g/L, the final biomass decreased again. Thus, at 100 g/L, a final absorbance of 0.711 was reached. Furthermore, at 150 g/L, only 0.488 absorbance was achieved. Moreover, if the NaCl content exceeded 250 g/L, the growth of D. salina was no longer noticeable. Similar behavior was observed by counting the cell number (per mL), as shown in Figure 2.
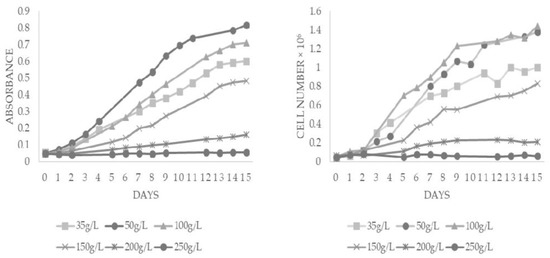
Figure 2.
Influence of different salinities between 35 and 250 g/L on growth of D. salina with light intensity of 3000 LUX and initial pH 9. The cultivation conditions were constant at 27 °C. (left) Absorbance at 660 nm and (right) cell number per mL.
3.1.2. pH
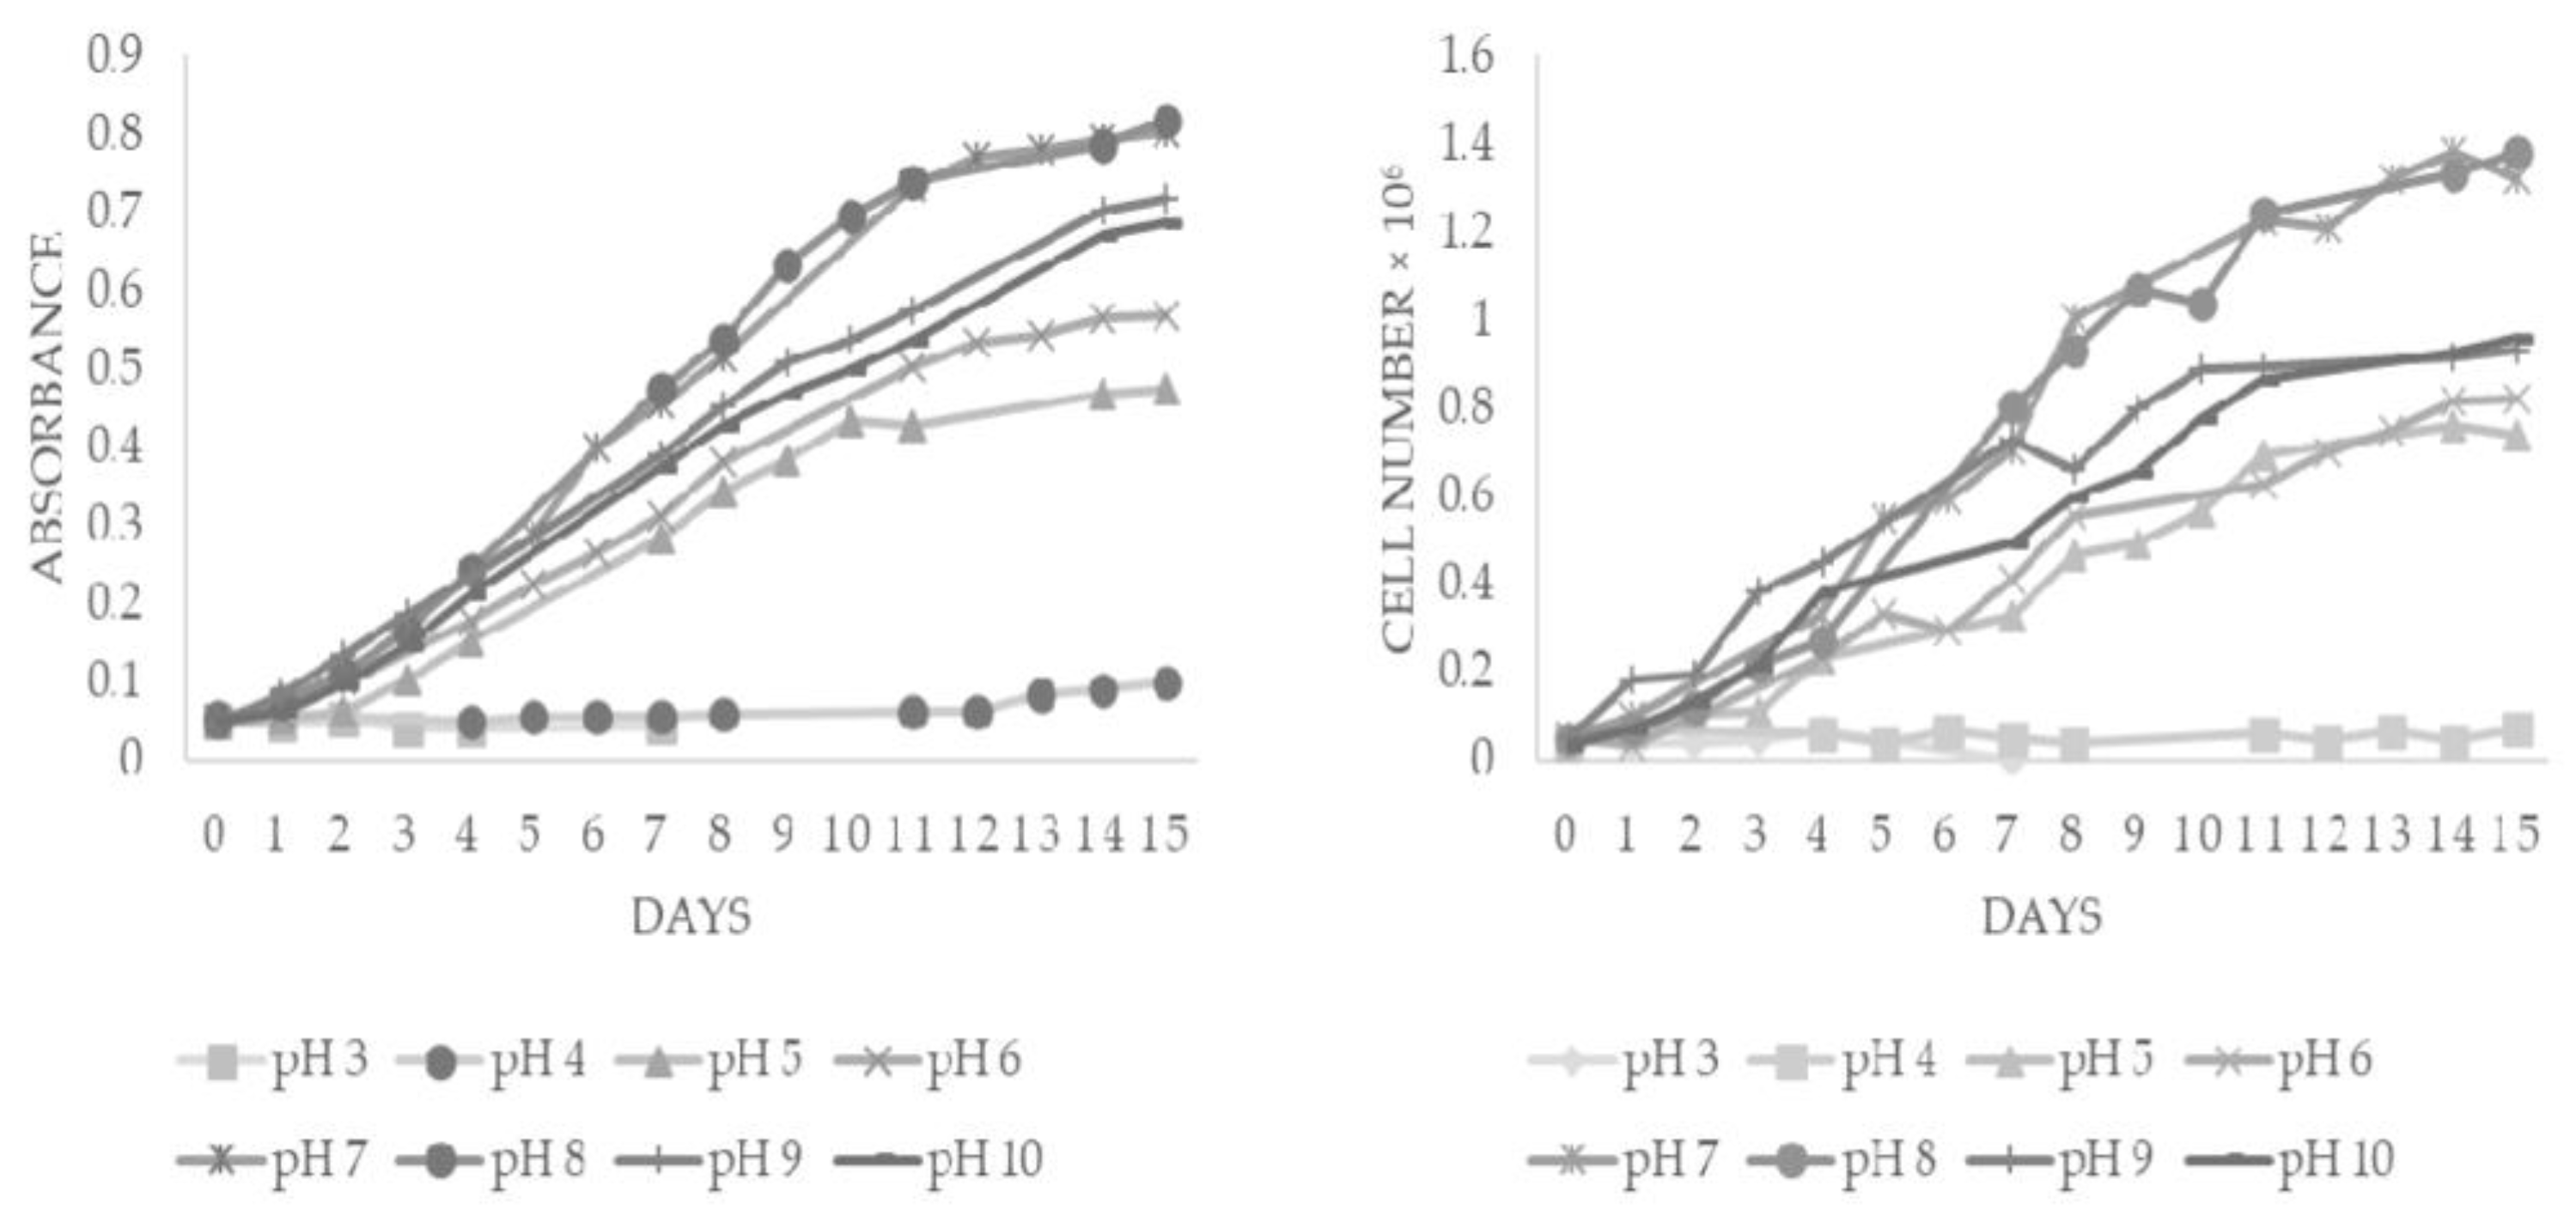
The influence of different initial pH values between 3 and 10 on the growth of D. salina with light intensity of 3000 LUX and 50 g/L NaCl was studied. The pH at the beginning of the cultivation has a profound influence on the final biomass and cell number. As shown in Figure 3, the highest biomass could be reached by adjusting the initial pH of the cultivation medium to 7 or 8. These pH values resulted in a final absorbance of 0.801 and 0.817, respectively. However, a pH value of 9 guarantees a higher biomass than pH 10.
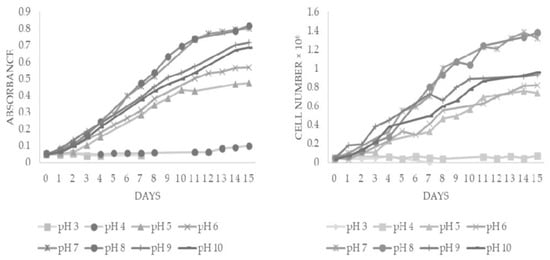
Figure 3.
Influence of different initial pH values between 3 and 10 on growth of D. salina at light intensity of 3000 LUX and 50 g/L NaCl. The cultivation conditions were constant at 27 °C. (left) Absorbance at 660 nm and (right) cell number per mL.
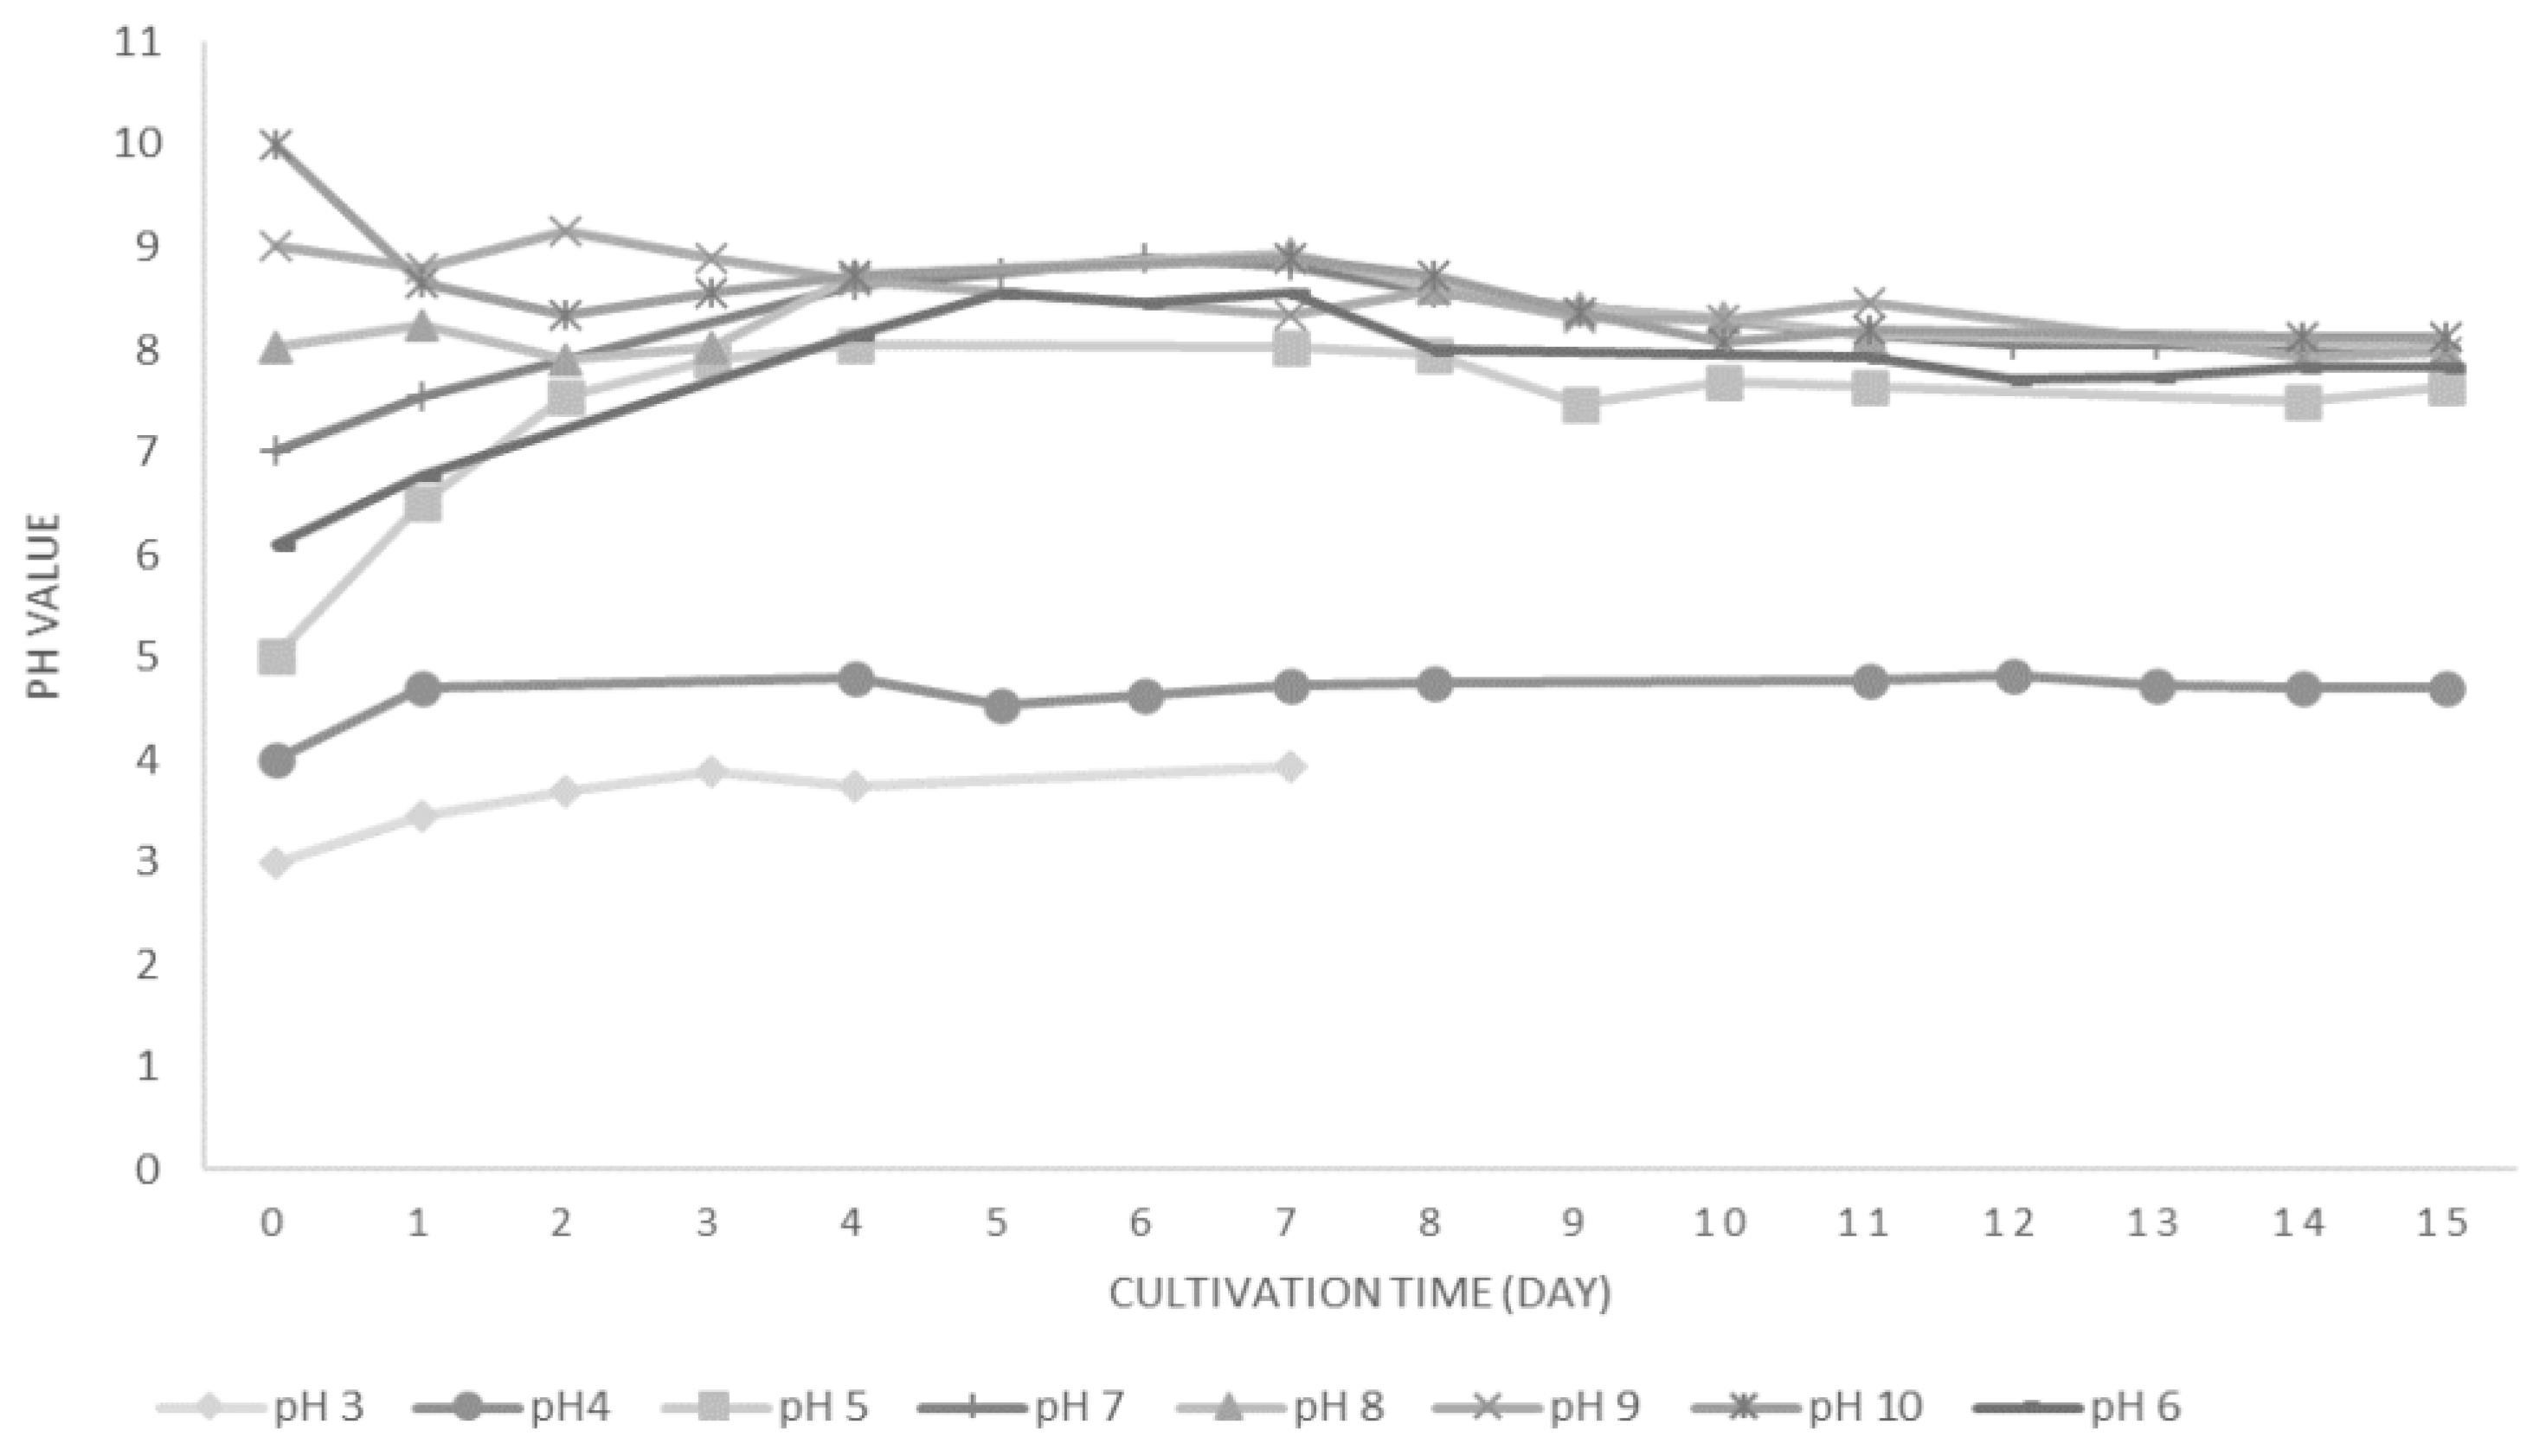
The development of the pH value at different initial pH values when cultivating D. salina with light intensity of 3000 LUX and 50 g/L NaCl was investigated. Figure 4 shows that starting with a pH value higher than 4 causes the pH to be around the same range after four days. However, for the growth of algae at different pH values such as (5, 6, 7 and 8), a slight increase in the growth, before it reaches a pH of around 8, can be observed.
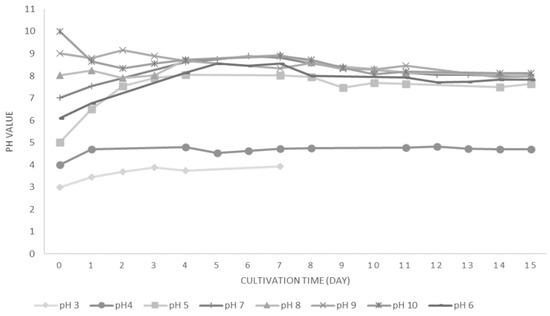
Figure 4.
Development of the pH value at different initial pH values when cultivating D. salina at light intensity of 3000 LUX and 50 g/L NaCl.
3.2. Downhill Simplex
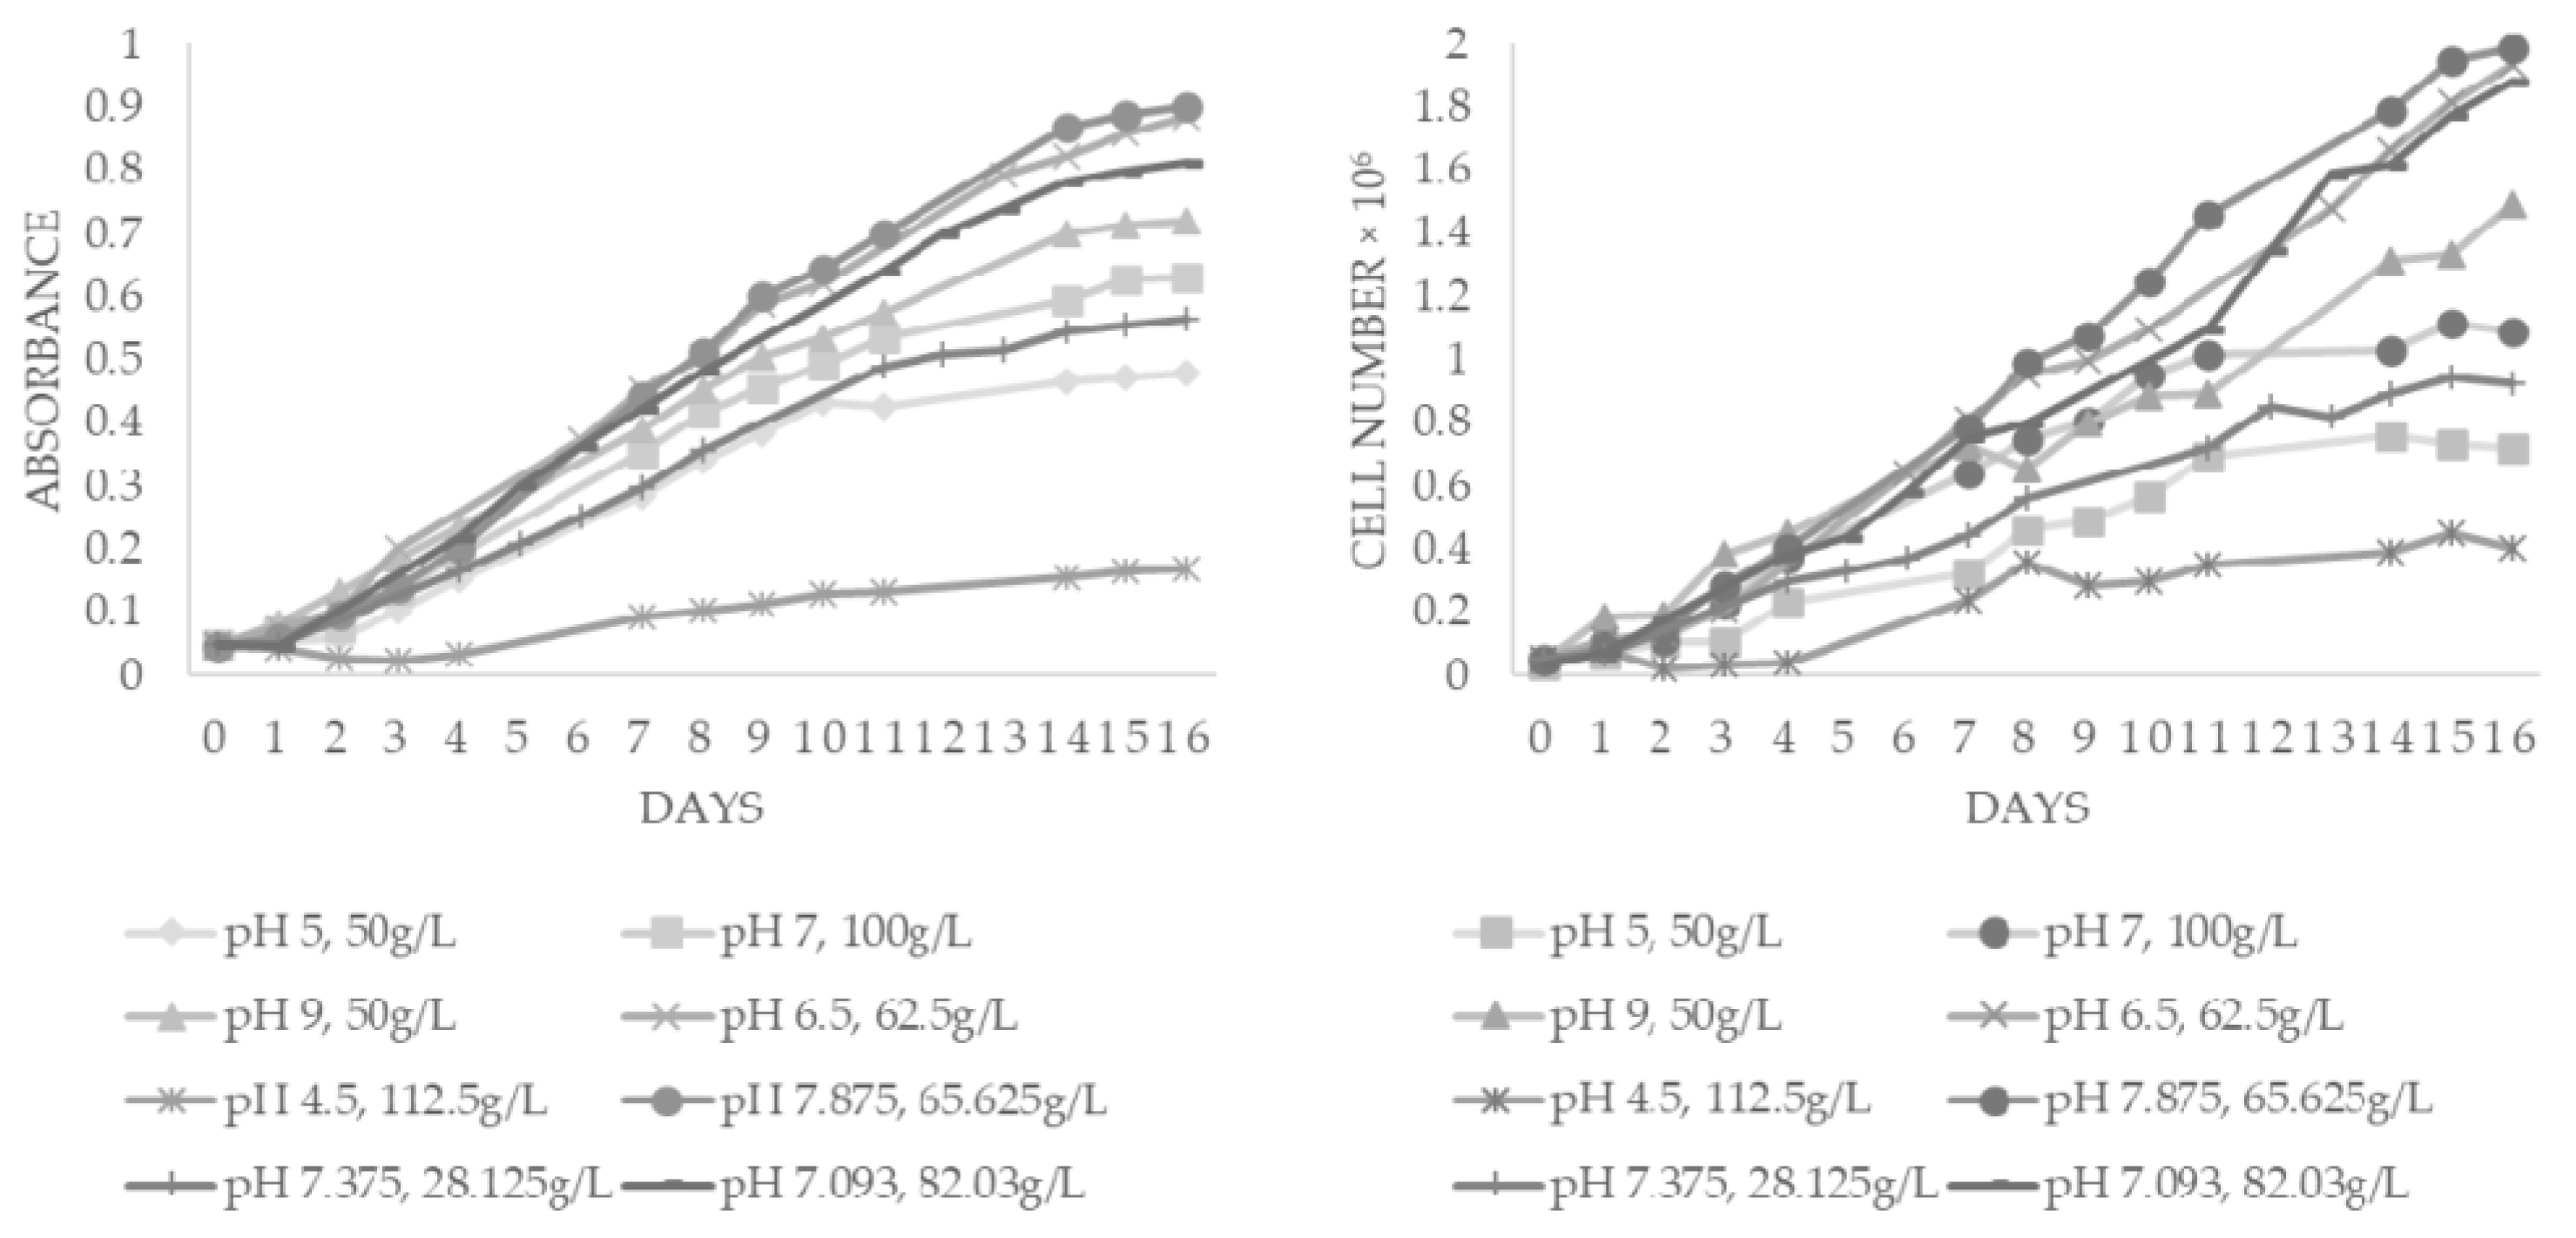
The optimization of the salt content and the initial pH level led to an optimum near the expected range found in the single observation of these parameters. As shown in Figure 5, the vertexes pH 6.5/salinity 62.5 g/L and pH 7.875/salinity 65.625 g/L led to the best result. The final absorbance at these two points was 0.901 and 0.885. All other points resulted in lower finals absorbances. The results of the tests in Figure 3 and Figure 4 are confirmed; these results suggest an optimum pH value between 7 and 8 and an optimum salt content between 50 g/L and 100 g/L.
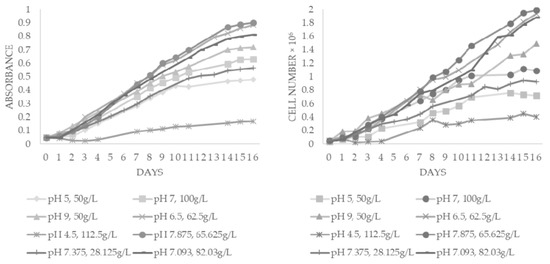
Figure 5.
Optimization of pH and salinity using simplex method with constant light intensity of 3000 LUX against days. The cultivation conditions were constant at 27 °C. (left) Absorbance at 660 nm and (right) cell number per mL.
4. Discussion
For the economic cultivation of D. salina, a large biomass must be generated in a short time. It was observed that different salinities and pH levels have a big influence on both the lag phase and the final biomass. An optimum of the salt content was assumed to be between 50 g/L and 100 g/L, and an optimum of the pH value was assumed to be between 7 and 8. This assumption was confirmed by the simplex method, in which both the pH value and the salt content were varied simultaneously. An average of the two best points showed an optimal result at 64 g/L and pH 7.2.
The results indicate that a certain ion concentration and osmotic pressure are optimal for growth. This optimum seems to be located between 50 g/L and 100 g/L. This result is confirmed by Farhat et al., who found an optimum between 17% and 21% of saturation (65–75 g/L) [37]. The NaCl content affects the water activity, ionic strength and osmotic pressure. Photosynthesis of algae is inhibited by osmotic stress. Although the ability to respond immediately to a change in the osmotic environment is a prerequisite that enables the algal cells to survive the change, the next step is the ability of the cells to adapt and establish a new steady state of growth [38]. D. salina can withstand high salinity by increasing the glycerol composition in the cell [39]. It was found that glycerol forms up to 50% of the dry weight when it is cultivated in high salinity conditions [7]. The β-carotene content also increases [38], which also became visible during cultivation in the flask due to a color change to deep red.
The results showed that a pH of 6 leads to a better biomass in comparison to pH of 5, whereas no growth was appreciable when the cultivation of D. salina was at a pH of 4. The cells died after 7 days if the initial pH of the medium was 3. The initial pH especially affects the lag phase. For instance, at a pH of 9, no lag phase is recognizable, but at a pH value of 4, the algae remained in the lag phase. The lag phase lasts 1 day at a pH of 6, 7, 8 and 10. Nevertheless, lag phase of 2 days was observed when the D. salina was cultivated at a pH value of 5 or 2. These results can be shown in Figure 3.
Figure 4 demonstrates the final pH will be almost the same for cultures that started with different pH values (e.g., above pH = 4). This can be explained by the fact that algae absorb CO2, and the pH increases as a result [40]. This effect occurs mainly in the log phase, in which a substantial amount of CO2 is absorbed. The reason why the initial pH of 10 falls so fast is that CO2 dissociates into the liquid. Low pH values are stressful for D. salina. When starting with a pH of 5, the final biomass is lower than at higher pH values. However, at the end of cultivation, the pH is almost the same as indicated in Figure 3. D. salina changes the pH value by glycerol production [38]. At the beginning of cultivation, enzymes are synthesized that can impede the growth in the log phase. According to [41], the behavior can be explained by the fact that microorganisms are inhibited by free -H+ ions and undissociated acids. Undissociated acids can pass through the lipid-containing membrane and enter the interior of the microorganisms. Its inhibitory effect is based on acidification of the cell interior and/or inhibition of metabolic processes and metabolic transport [41]. A further explanation is the difference of the carbon source at different pH values. With increasing pH value, the dissolved carbon form changes from CO2 to HCO3- to CO3.The preferred inorganic carbon source is different for each alga. However, CO2 is more advantageous in terms of energy efficiency [41].
The obtained results agree with those of [41], who found an optimal pH value between seven and eight. However, they disprove the statement of [38], who claims that D. salina survives pH values from 0 to 11. This phenomenon could be due to the fact that it makes a difference whether the algae are slowly brought to extreme pH values step by step or whether one shocks them directly from neutral pH values.
Regarding the downhill simplex method, it must be mentioned that there was often convergence in unfavorable areas. For example, the algorithm converts two times to the edge regions at pH value of 11 and pH value of 4.5), where it was obvious in advance that these both pH values produce unsatisfactory results. Nonetheless, the algorithm converged to a maximum at the end.
Figure 5 reveals that although there is such a large difference between 6.5 and 7.875 and the salinity only differed by 3.125 g/L, nearly the same final absorbance was obtained. This result may be because the salt content reaches a threshold value which causes an ionic strength or osmotic pressure, which has a negative effect on the cell. To examine this assumption, further investigations from biological aspects have to be followed up.
Moreover, the results of the simplex method confirm the results shown in Figure 3 and Figure 4, i.e., an optimum pH value between 7 and 8 and an optimum salt content between 50 g/L and 100 g/L. The result found corresponds also to that of other references. Dubinsky and Rotem [42] found an optimum for pH at 7 for D. salina. The results found using the simplex method indicate an optimum between 6.5 and 7.875. This equals the mean value 7.19. Farhat et al. lists 65 to 75 g/L as the optimum salt content [37]. The found results using the simplex method indicate an optimum between 62.5 and 65.625 g/L. This equals the mean value of 64 g/L. The results obtained come remarkably close to the results of other scientists and confirm them [7,37].
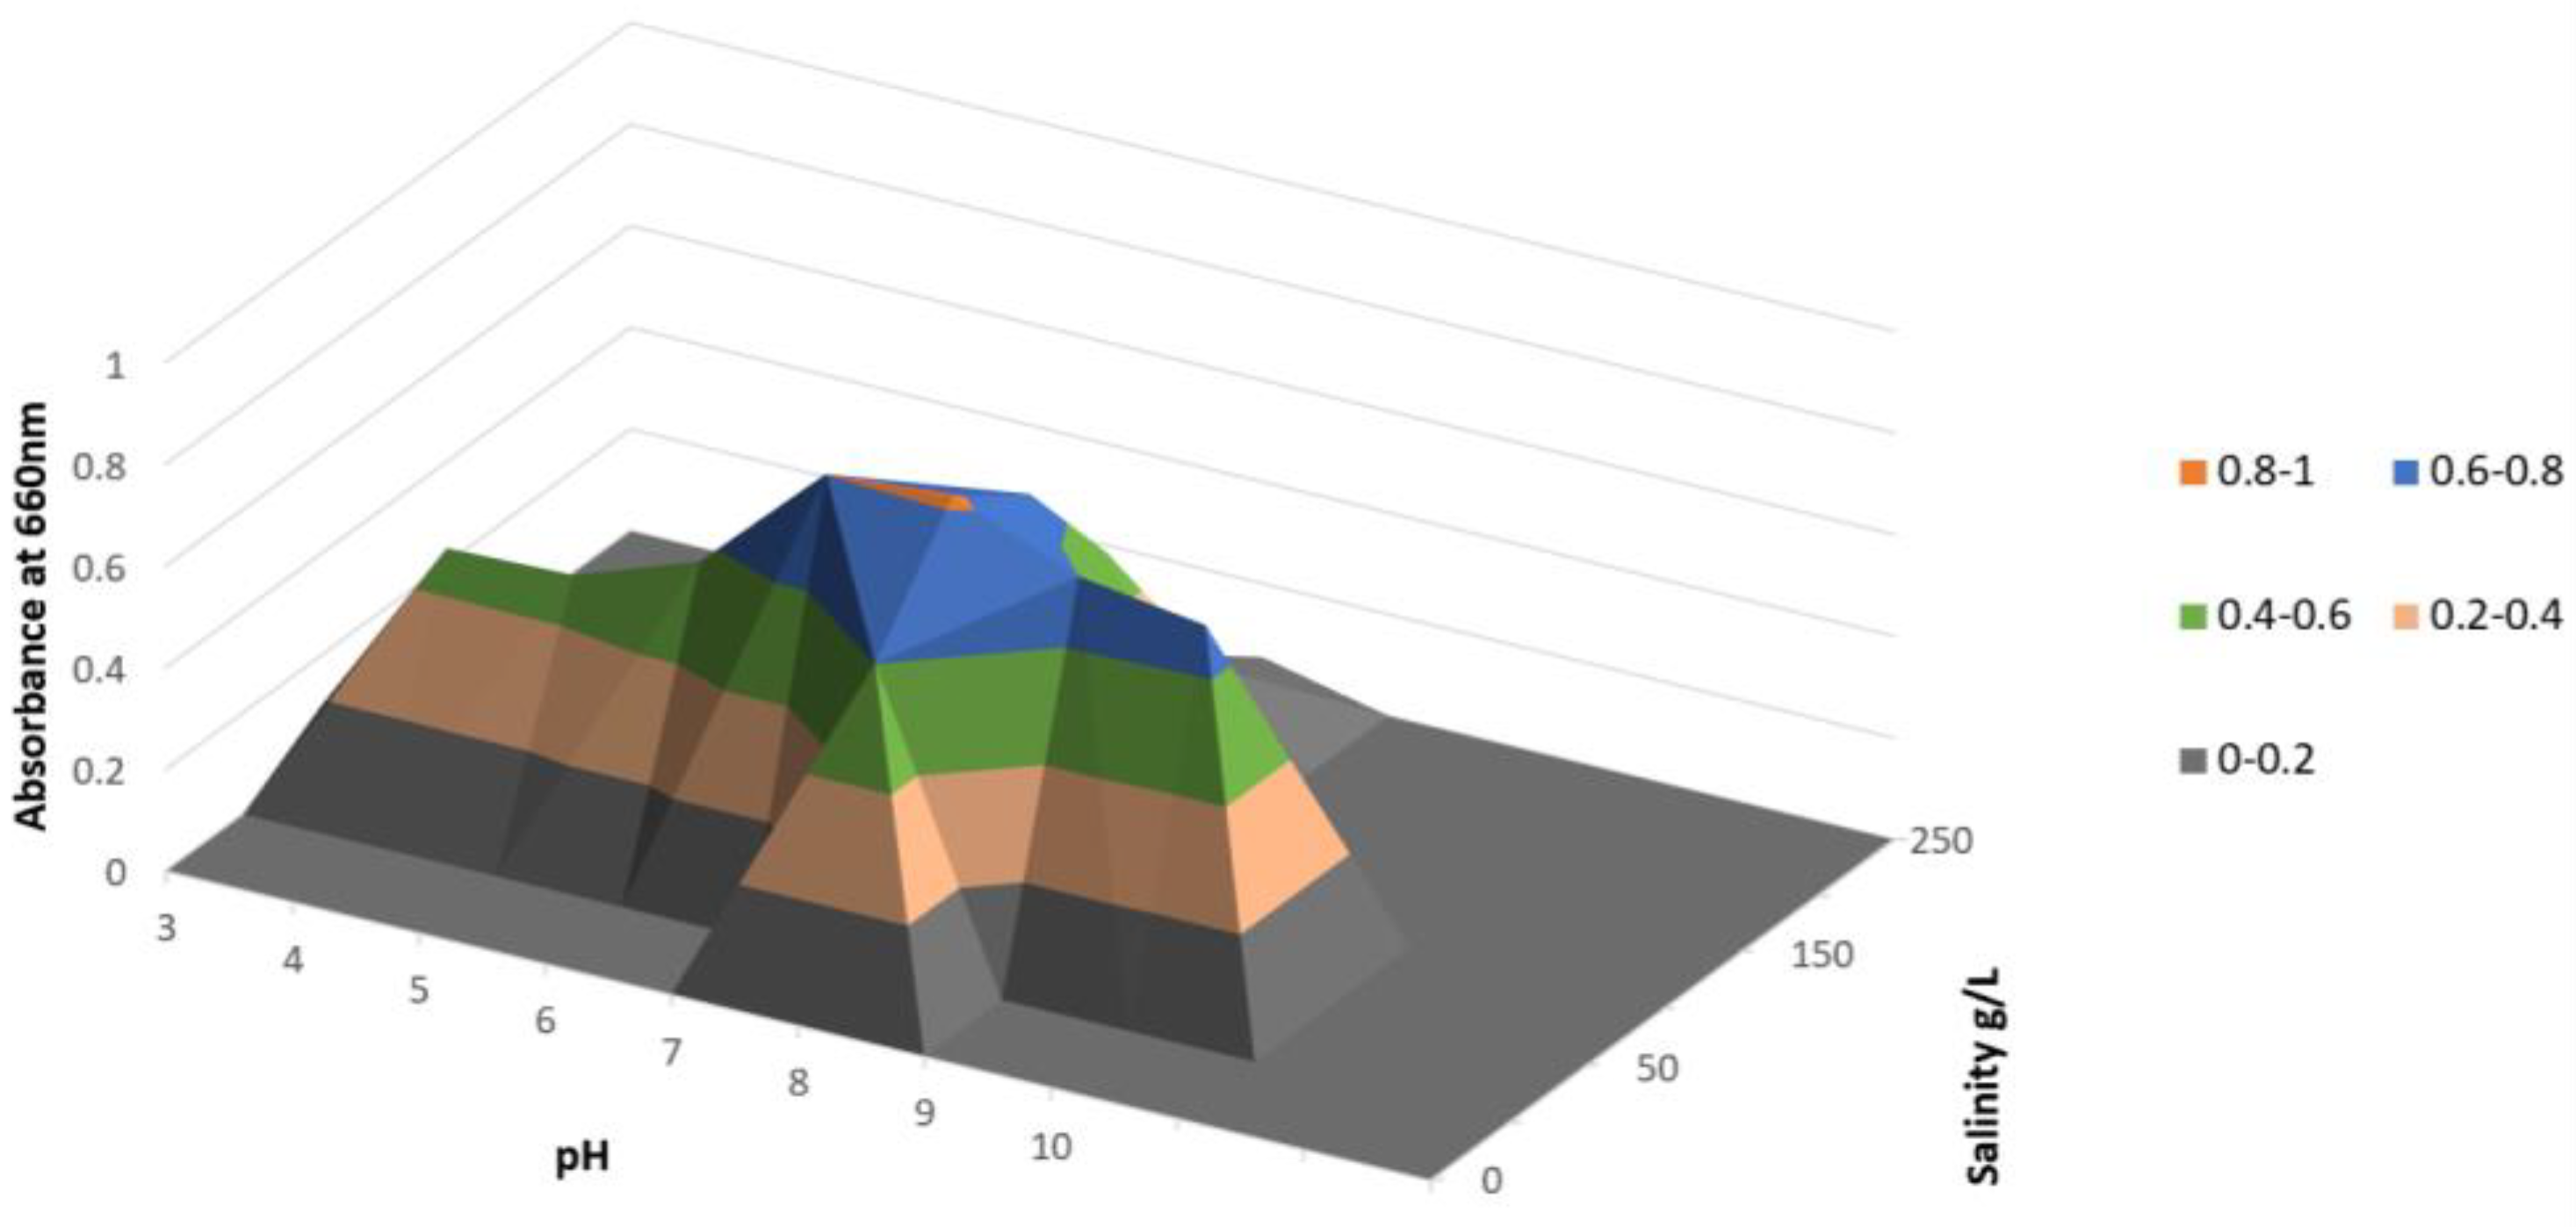
This leads to the conclusion that even with independent parameters, the simplex method leads to a satisfactory result and drastically reduces the number of required experiments. In the single observation of both parameters, 14 experiments were necessary, whereas only eight runs were required to find the optima by using the simplex method. Figure 6 shows the results of experiments by using the simplex method.
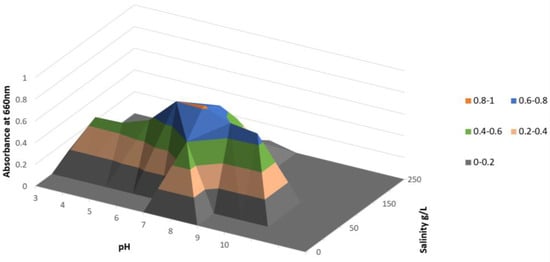
Figure 6.
pH and salinity optimization by using simplex method at constant light intensity of 3000 LUX and constant cultivation temperature of 27 °C.
The large fluctuations when the hemocytometer was used indicate that biomass determination by spectrophotometer is much more reliable and should be preferred.
To achieve optimal growth, a pH value between 7 and 8 should be aimed for. To reduce contamination, extreme pH values such as 3 can be used at times but for not longer than 7 days.
It is remarkably difficult to vary one parameter while others remain constant in biotechnology. The simplex method has, therefore, proved to be advantageous. The large diversity of the phenotypes makes reliable prediction difficult. The extent to which the results obtained prove to be successful in scale-up must now be further researched.
Author Contributions
Conceptualization, supervision, review, editing, project administration, N.A.-M.; methodology, investigation, writing—original draft preparation, M.P. and L.A.S. All authors have read and agreed to the published version of the manuscript.
Funding
This research received no external funding.
Data Availability Statement
The research demonstrates experimental data that can be found in the tables and figures presented in this manuscript.
Acknowledgments
The authors would like to thank GUtech for supporting this study.
Conflicts of Interest
The authors declare no conflict of interest. The funders had no role in the design of the study; in the collection, analyses, or interpretation of data; in the writing of the manuscript, or in the decision to publish the results.
References
- Matos, P.; Novelli, E.; Tribuzi, G. Use of algae as food ingredient: Sensory acceptance and commercial products. Front. Food Sci. Technol. 2022, 2, 1–8. [Google Scholar] [CrossRef]
- Ullmann, J.; Grimm, D. Algae and their potential for a future bioeconomy, landless food production, and the socio-economic impact of an algae industry. Org. Agric. 2021, 11, 261–267. [Google Scholar] [CrossRef]
- Aniket, K.; Roshan, D. Algae Products Market. 2022. Available online: https://www.alliedmarketresearch.com/algae-products-market (accessed on 15 September 2022).
- Pourkarimi, S.; Hallajisani, A.; Alizadehdakhel, A.; Nouralishahi, A.; Golzary, A. Factors affecting production of beta-carotene from Dunaliella salina microalgae. Biocatal. Agric. Biotechnol. 2020, 29, 101771. [Google Scholar] [CrossRef]
- Polle, J.E.; Roth, R.; Ben-Amotz, A.; Goodenough, U. Ultrastructure of the green alga Dunaliella salina strain CCAP19/18 (Chlorophyta) as investigated by quick-freeze deep-etch electron microscopy. Algal Res. 2020, 49, 101953. [Google Scholar] [CrossRef]
- Castellanos-Huerta, I.; Gómez-Verduzco, G.; Tellez-Isaias, G.; Ayora-Talavera, G.; Bañuelos-Hernández, B.; Petrone-García, V.M.; Fernández-Siurob, I.; Garcia-Casillas, L.A.; Velázquez-Juárez, G. Dunaliella salina as a Potential Biofactory for Antigens and Vehicle for Mucosal Application. Processes 2022, 10, 1776. [Google Scholar] [CrossRef]
- Tafreshi, A.H.; Shariati, M. Dunaliella biotechnology: Methods and applications. J. Appl. Microbiol. 2009, 107, 14–35. [Google Scholar] [CrossRef]
- Xu, Y.; Ibrahim, I.M.; Wosu, C.I.; Ben-Amotz, A.; Harvey, P.J. Potential of New Isolates of Dunaliella Salina for Natural β-Carotene Production. Biology 2018, 7, 14. [Google Scholar] [CrossRef]
- Novoveská, L.; Ross, M.E.; Stanley, M.S.; Pradelles, R.; Wasiolek, V.; Sassi, J.-F. Microalgal Carotenoids: A Review of Production, Current Markets, Regulations, and Future Direction. Mar. Drugs 2019, 17, 640. [Google Scholar] [CrossRef]
- Cheng, J.; Balbuena, E.; Miller, B.; Eroglu, A. The Role of β-Carotene in Colonic Inflammation and Intestinal Barrier Integrity. Front. Nutr. 2021, 8, 660. [Google Scholar] [CrossRef]
- Anand, R.; Mohan, L.; Bharadvaja, N. Disease Prevention and Treatment Using β-Carotene: The Ultimate Provitamin A. Rev. Bras. Farm. 2022, 32, 491–501. [Google Scholar] [CrossRef]
- Çelebi, H.; Bahadır, T.; Şimşek, I.; Tulun, Ş. Use of Dunaliella salina in Environmental Applications. In Proceedings of the 1st International Electronic Conference on Biological Diversity, Ecology and Evolution, Online, 15–31 March 2021. [Google Scholar] [CrossRef]
- Roy, U.; Nielsen, B.; Milledge, J. Antioxidant Production in Dunaliella. Appl. Sci. 2021, 11, 3959. [Google Scholar] [CrossRef]
- Deutsche Gesellschaft für Ernährung e.V. 2020. Available online: https://www.dge.de/wissenschaft/referenzwerte/vitamin-a-b-carotin/ (accessed on 2 October 2022).
- Worldometer. 2022. Available online: https://www.worldometers.info/world-population/ (accessed on 5 October 2022).
- Wolf, L.; Cummings, T.; Müller, K.; Reppke, M.; Volkmar, M.; Weuster-Botz, D. Production of β-carotene with Dunaliella salina CCAP19/18 at physically simulated outdoor conditions. Eng. Life Sci. 2020, 21, 115–125. [Google Scholar] [CrossRef] [PubMed]
- Harvey, P.J.; Ben-Amotz, A. Towards a sustainable Dunaliella salina microalgal biorefinery for 9-cis β-carotene production. Algal Res. 2020, 50, 102002. [Google Scholar] [CrossRef]
- Zarandi-Miandoab, L.; Hejazi, M.-A.; Bagherieh-Najjar, M.-B.; Chaparzadeh, N. Statistical Optimization of The Four Key Factors on β-Carotene Production by Dunaliella salina Under Laboratory Conditions Using Response Surface Methodology. Iran. J. Pharm. Res. 2019, 18, 1566–1579. [Google Scholar] [CrossRef]
- Morowvat, M.H.; Ghasemi, Y. Culture medium optimization for enhanced β-carotene and biomass production by Dunaliella salina in mixotrophic culture. Biocatal. Agric. Biotechnol. 2016, 7, 217–223. [Google Scholar] [CrossRef]
- Paniagua-Michel, J. Microalgal Nutraceuticals. In Handbook of Marine Microalgae; Academic Press: Cambridge, MA, USA, 2015; pp. 255–267. [Google Scholar] [CrossRef]
- Wu, Z.; Duangmanee, P.; Zhao, P.; Juntawong, N.; Ma, C. The Effects of Light, Temperature, and Nutrition on Growth and Pigment Accumulation of Three Dunaliella salina Strains Isolated from Saline Soil. Jundishapur J. Microbiol. 2016, 9, e26732. [Google Scholar] [CrossRef]
- Ying, K.; Gilmour, D.J.; Shi, Y.; Zimmerman, W.B. Growth Enhancement of Dunaliella salina by Microbubble Induced Airlift Loop Bioreactor (ALB)—The Relation between Mass Transfer and Growth Rate. J. Biomater. Nanobiotechnol. 2013, 4, 1–9. [Google Scholar] [CrossRef]
- Munir, N.; Imtiaz, A.; Sharif, N.; Naz, S. Optimization of growth conditions of different algal strains and determination of their lipid contents. J. Anim. Plant Sci. 2015, 25, 546–553. [Google Scholar]
- Lüders, S.; David, F.; Steinwand, M.; Jordan, E.; Hust, M.; Dübel, S.; Franco-Lara, E. Influence of the hydromechanical stress and temperature on growth and antibody fragment production with Bacillus megaterium. Appl. Microbiol. Biotechnol. 2011, 91, 81–90. [Google Scholar] [CrossRef]
- [Latest] Global Carotenoids Market Size/Share Worth USD 2.1 Billion by 2030 at a 3.5 CAGR: Custom Market Insights (Analysis, Outlook, Leaders, Report, Trends, Forecast, Segmentation, Growth, Growth Rate, Value, Analysis, Outlook), GlobeNewswire. 2022. Available online: https://www.globenewswire.com/en/news-release/2022/11/08/2551182/0/en/Latest-Global-Carotenoids-Market-Size-Share-Worth-USD-2-1-Billion-by-2030-at-a-3-5-CAGR-Custom-Market-Insights-Analysis-Outlook-Leaders-Report-Trends-Forecast-Segmentation-Growth-G.html (accessed on 10 October 2022).
- Martínez-Cámara, S.; Ibañez, A.; Rubio, S.; Barreiro, C.; Barredo, J.-L. Main Carotenoids Produced by Microorganisms. Encyclopedia 2021, 1, 1223–1245. [Google Scholar] [CrossRef]
- Staff, B.P. The Global Market for Carotenoids, BCC Res. 2022. Available online: https://www.bccresearch.com/market-research/food-and-beverage/the-global-market-for-carotenoids.html (accessed on 10 October 2022).
- Astaxanthin Market: Global Industry Trends, Share, Size, Growth, Opportunity and Forecast 2022–2027, IMARC. n.d. Available online: https://www.imarcgroup.com/astaxanthin-market (accessed on 12 October 2022).
- Beta Carotene Market Analysis by Source (Fruits & Vegetables, Algae, Synthetic, Yeast, Fungi, and Bacteria); by Product Type (Synthetic, and Natural); by Form (Powder, and Liquid); and by End User (Food & Beverages, Pharmaceuticals, Cosmetics, Animal Feed, Res. Nester. n.d. Available online: https://www.researchnester.com/reports/beta-carotene-market/267 (accessed on 14 October 2022).
- Richmond, A. Handbook of Microalgal Culture; Blackwell Science, Blackwell Publishing Company, Iow: Hoboken, NJ, USA, 2004. [Google Scholar]
- Storhas, W. Bioverfahrensentwicklung, 2nd ed.; Wiley: Hoboken, NJ, USA, 2013. [Google Scholar]
- Almhanna, N.; Huebner, H.; Buchholz, R. Optimization of Parameters Growth Conditions of Yeast Biomass during Single Cell Protein Production by Using Simplex Method. Chem. Eng. Trans. 2010, 21, 475–480. [Google Scholar] [CrossRef]
- Walters, F. Sequential Simplex Optimization—An Update. Anal. Lett. 1999, 32, 193–212. [Google Scholar] [CrossRef]
- Rao, S.S. Engineering Optimization Theory and Practice, 4th ed.; John Wiley & Sons Inc.: Hoboken, NJ, USA, 2009; pp. 694–702. [Google Scholar]
- Nelder, J.A.; Mead, R. A Simplex Method for Function Minimization. Comput. J. 1965, 7, 308–313. Available online: http://citeseerx.ist.psu.edu/viewdoc/download?doi=10.1.1.144.5920&rep=rep1&type=pdf (accessed on 17 October 2022). [CrossRef]
- Jesus, S.S. Modeling Growth of Microalgae Dunaliella Salina under Different Nutritional Conditions. Am. J. Biochem. Biotechnol. 2010, 6, 279–283. [Google Scholar] [CrossRef]
- Farhat, N.; Rabhi, M.; Falleh, H.; Jouini, J.; Abdelly, C.; Smaoui, A. Optimization of Salt Concentrations for A Higher Carotenoid Production in Dunaliella Salina (Chlorophyceae)1. J. Phycol. 2011, 47, 1072–1077. [Google Scholar] [CrossRef] [PubMed]
- Kirst, G.O. Salinity Tolerance of Eukaryotic Marine Algae. Annu. Rev. Plant Physiol. Plant Mol. Biol. 1990, 41, 21–53. [Google Scholar] [CrossRef]
- Oren, A. A hundred years of Dunaliella research: 1905–2005. Saline Syst. 2005, 1, 2. [Google Scholar] [CrossRef]
- Borowitzka, M.A. Commercial production of microalgae: Ponds, tanks, and fermenters. Biotechnology 1999, 35, 313–321. [Google Scholar] [CrossRef]
- Dubinsky, Z.; Rotem, J. Relations between algal populations and the pH of their media. Oecologia 1974, 16, 53–60. [Google Scholar] [CrossRef]
- Hejazi, M.A.; de Lamarliere, C.; Rocha, J.M.S.; Vermuë, M.; Tramper, J.; Wijffels, R.H. Selective extraction of carotenoids from the microalga Dunaliella salina with retention of viability. Biotechnol. Bioeng. 2002, 79, 29–36. [Google Scholar] [CrossRef]
Disclaimer/Publisher’s Note: The statements, opinions and data contained in all publications are solely those of the individual author(s) and contributor(s) and not of MDPI and/or the editor(s). MDPI and/or the editor(s) disclaim responsibility for any injury to people or property resulting from any ideas, methods, instructions or products referred to in the content. |
© 2023 by the authors. Licensee MDPI, Basel, Switzerland. This article is an open access article distributed under the terms and conditions of the Creative Commons Attribution (CC BY) license (https://creativecommons.org/licenses/by/4.0/).

