Article

Study on Phase Change Flow and Heat Transfer Characteristics of Microalgae Slurry in the Absorber Tube of a Parabolic trough Solar Collector

School of Energy and Power Engineering, Northeast Electric Power University, Jilin City 132012, China
*
Authors to whom correspondence should be addressed.
Processes 2023, 11(11), 3107; https://doi.org/10.3390/pr11113107
Submission received: 26 September 2023 / Revised: 19 October 2023 / Accepted: 24 October 2023 / Published: 30 October 2023
(This article belongs to the Special Issue Advances in Bioprocess Technology)

Abstract

:
The study of gas–liquid two-phase flow and heat transfer in non-Newtonian fluids is of great significance for the research and development of refrigeration and energy storage. In this paper, the characteristics and influencing factors of the phase change reaction in microalgae slurry were studied by numerical simulation and experimental verification. In order to further study the rheological and heat transfer characteristics of gas–liquid two-phase flow in the collector, the effects of wall heat flux, inlet velocity and microalgae slurry concentration on the phase change reaction in microalgae slurry were studied. The results show that when the boundary conditions of microalgae slurry with the same concentration change, the phase transition of microalgae slurry is different. The higher the wall heat flux, the more forward the phase transition occurs, and the smaller the flow rate, the more forward the phase transition occurs. When the boundary conditions remain unchanged, the phase transition point of microalgae slurry with different concentrations is the same, and the concentration of microalgae slurry will not be affected. However, the deviation between the fluid temperature and the thermal conductivity of high-concentration fluid after phase change is larger than that of low-concentration fluids. The deviation in the fluid temperature reaches approximately 10 K, and the deviation in thermal conductivity reaches approximately 0.025 W/(m·K). Therefore, the change in the fluid temperature and heat transfer intensity after phase change in microalgae slurry is more intense than that of Newtonian fluids.

1. Introduction

In recent years, with the depletion of global energy and increasing environmental pollution, people pay increasing attention to the development and application of renewable energy. Biomass energy is a type of renewable energy with good development prospects, and it is being increasingly applied. Algal biomass is a unicellular organism, with a high yield per unit area and easy automatic control of reproduction, and does not compete with food crops. It is a biomass raw material with great potential [1,2,3]. At present, the main ways to produce biofuel from microalgae biomass include pyrolysis, thermochemical gasification, hydrothermal liquefaction and anaerobic digestion [4,5,6,7]. Among them, anaerobic digestion can use anaerobic microorganisms to directly degrade microalgae biomass, with mild reaction conditions and a high conversion rate of organic matter. The conversion of microalgae biomass requires direct contact between microorganisms and biomass, but the dense cell wall of microalgae cells impedes the conversion and utilization of organic matter in cells by microorganisms. Therefore, slurry pretreatment before microalgae biomass conversion is extremely important. The commonly used slurry pretreatment methods include mechanical pretreatment, chemical pretreatment, enzymatic pretreatment and hydrothermal pretreatment [8]. Among them, hydrothermal pretreatment is more efficient than other methods, omits the drying and crushing processes of microalgal biomass, and does not need to add other biological or chemical reagents, so it has the prospect of large-scale industrial application [9,10]. According to the study of Yoo et al. [11], the energy required for hydrothermal liquefaction of microalgae is much higher than that for pyrolysis. Therefore, an energy cost reduction in the pretreatment has become an urgent critical issue of concern, especially from the view of heat enhancement [12,13,14,15]. Solar energy is potential energy for hydrothermal pretreatment of microalgae biomass, which has been widely used in biomass pyrolysis and gasification. Chao Xiao et al. [8] designed a device for hydrothermal pretreatment using solar energy as a heat source, using a trough collector to collect solar energy to heat microalgae slurry, thus significantly reducing the cost. However, the efficiency of the collector will be affected by the rheological properties of the working fluid and thermal resistance. It is worth noting that microalga slurry is a pseudoplastic fluid with shear thinning characteristics. Zhang Hong et al. [16] found that pseudoplastic fluid viscosity declined with the rise in shearing speed at a constant temperature. When the shear rate was constant, the viscosity increased first and then declined with the rise in temperature. Fu Qian et al. [17] explored the effect of shearing speed, temperature and volume percent on the viscosity of the working substance, analyzed the heat exchange characteristics of the parabolic trough collectors under non-uniform heating conditions, and numerically simulated the natural convection driven by temperature gradient. As mentioned above, microalgae slurry has complex flow and heat transfer properties due to its rheological properties, which has a big impact on heat exchange efficiency and hydrothermal pretreatment.
The phase change in the fluid will affect its rheological properties, thus affecting heat and mass exchange. Therefore, it is of great significance to study the phase transition process and characteristics of the fluid for engineering practices. The gas–liquid flow heat transfer process had been widely explored in different application fields, such as condensation and boiling phenomena, which are crucial in the design of refrigeration and air conditioning equipment. In addition, energy exchange that does not come from boiling heat transfer in two-phase flow also has important research value in chemical process, petroleum industry, air lift system, solar collector, nuclear reactor and other fields. Huang et al. [18] established a new air–liquid heat and mass transfer model. The effects of the flow rate of two-phase flow and working substance inlet temperature on the humidifier were studied, and the heat and mass exchange process was theoretically analyzed. The results show that heat and mass exchange of the moistening apparatus increase with the increase in the air–liquid flow rate and working substance inlet temperature. The positive effect of working substance temperature on mass transfer is more significant than that of other parameters. The distribution of the heat mass transfer rate is mainly affected by the driving factors. The intermittent fluctuation of the heat and mass exchange coefficient only affects the local characteristics of heat exchange rate and has little effect on the overall change trend. Shi et al. [19] improved the convection computing procedure of isovector geometric reconstruction arithmetic. They realized the phase interface capture of compressible two-phase flow and established a numerical method to express the energy, mass and momentum transfer of phase transition in the process of solving the governing equations of flow field. The results show that the modeling results match well with experimental data. This method considers that the influence of gas compressibility has high precision in predicting gas–liquid flow, capturing phase interface change characteristics and predicting phase change heat. Odumuyiwa et al. [20] adopted a numerical simulation to study flow boiling heat exchange in a wavy micro-tube, and then compared and analyzed the wavy and straight microchannels to study the influence of the main dimensionless number on wall heat exchange and the bubble growth rate. The results show that the undulation structure of the micro-tube has a great influence on wall heat exchange and bubble growth in the microchannel. With the increase in micro-tube waviness, the bubble grows faster due to bubble deformation caused by the corrugated channel, and moves faster due to expansion. The disturbance caused by the bubble in the flow enhances heat exchange. At present, most of the research on gas–liquid flow is focused on Newtonian fluids, while there are few studies on non-Newtonian fluids. Compared with Newtonian fluids, non-Newtonian fluids have more extensive applications in industrial production and energy development and utilization. Therefore, it is of great engineering significance to study the phase change reaction and multiphase flow of non-Newtonian fluids. The behavior of bubbles in non-Newtonian fluids is very different from that in Newtonian fluids. Sadra et al. [21] explored the correlation between the final velocity and resistance in dilatant, Newtonian and pseudoplastic fluids in a classical bubble size range of 2–6 mm. The results show that 2 mm and 4 mm bubbles do not show shape changes and reach the final velocity in all types of liquids. In medium- and low-viscosity liquids, the shape of a 6 mm bubble fluctuates perfectly between the semisphere and the disk, resulting in a stable periodic oscillation of the bubble velocity near a constant average. Petros et al. [22] simulated blood test fluid with gas–liquid flow, and then studied the influence of non-Newtonian fluids on porosity and bubble diameter distribution. The results show that the increase in bubble size and the decrease in porosity are mainly due to the characteristics of non-Newtonian liquids, rather than the rise in dynamic viscosity.
In the present work, a solar-driven heat collector for microalgae slurry was proposed. The working substance was continuously injected into the heat exchanger to initially simulate the microenvironment in the termite intestine. The absorption tube was used to collect and absorb light radiation energy, and the hydrolyzed working substance was directly heated. The characteristics and influencing factors of the phase change reaction of microalgae slurry in the collector were studied by numerical simulation and experiment. The effects of solar irradiation intensity, microalgae biomass concentration and the microalgae slurry flow rate on the phase change reaction of microalgae slurry in the collector were studied by using the control variable method. The main goal of this paper is to study the phase change characteristics and flow and heat transfer characteristics of microalgae slurry, and to analyze the influence of different factors. Compared with the research of other scholars [8,10], who did not use experimental verification, nor did they give the analysis of the influence of various factors on the phase transition process of non-Newtonian fluids, this paper studies the phase change process of microalgae slurry by combining numerical simulation with experimental observation, and analyzes the influence of various factors on phase change and heat transfer in detail. This research method is more practical and reliable in the world. The research results of this paper have important guiding significance for the in-depth study of the augmentation of heat transfer of air–liquid flow in non-Newtonian fluids. It provides an important theoretical basis for the design and optimization of solar collectors in hydrothermal pretreatment systems, and also establishes an important foundation for the research and design of bionic bioreactors.

2. Physical and Computational Models

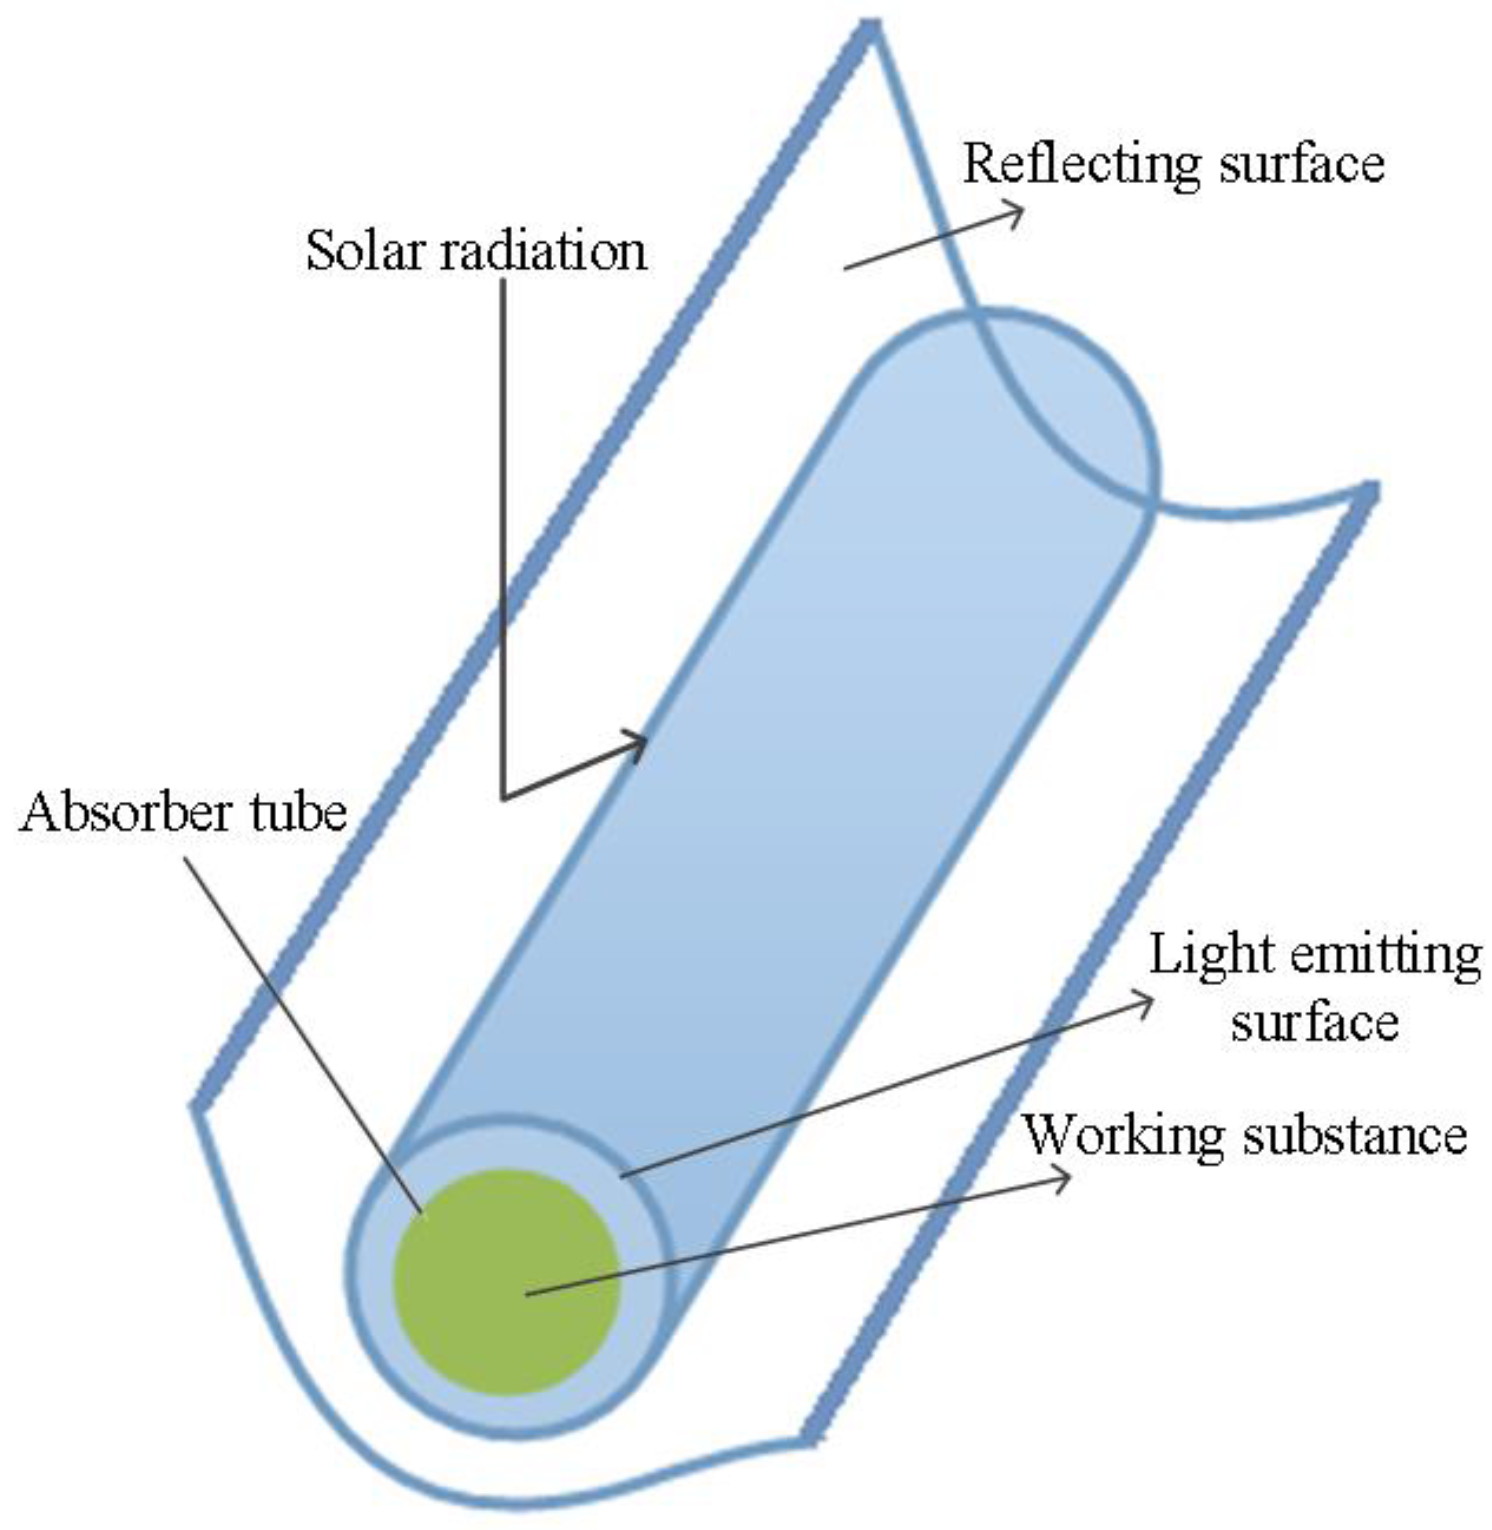
2.1. The Physical Model

Figure 1 is a schematic diagram of the collector and its physical model is a parabolic trough structure, which was employed in the previous work [8]. The length of the absorption pipet is 6 m (L), and its inner diameter is 32 mm (D). This collector converges solar radiation energy through the reflector, so the heat distribution of the absorber tube along the peripheral direction is non-uniform, which belongs to inhomogeneous heating. Because the fluid heat transfer flow under inhomogeneous heating is more complicated, and the secondary flow phenomenon will be generated, which will introduce additional impact on heat transfer of two-phase flow. Therefore, the uniform heating condition is used for analysis in this paper, and the wall heat flux under inhomogeneous heating is converted into the equivalent heat flux under even heating. The direct normal irradiation (DNI) were transformed into uniform heat fluxes of 9930, 11,100, and 13,000 W/m2. In this paper, the microalgae slurry is used as the working substance. The concentrations (φ) of microalgae slurry are 5 wt.%, 10 wt.%, and 15 wt.%, respectively. Density (ρms) and specific heat capacity (Cρms) of the working substance were computed by Equations (1)–(2) and the thermal conductivity (λms) should be computed in two cases. When the working substance is assumed to be a liquid with suspended particles, Formula (3) can be used for calculation [23]. Moreover, Formulae (4)–(6) another calculation method of thermal conductivity, which is obtained by fitting the empirical formula. These formulae have been obtained in previous studies [24], corresponding to the working substance concentration of 5 wt.%, 10 wt.%, and 15 wt.%, respectively.
ρ m s = φ ρ s + 1 φ ρ w
C ρ m s = φ C ρ s + 1 φ C ρ w
( λ m s / λ s 1 ) / ( λ w / λ s 1 ) = λ m s / λ w 1 / 3 1 φ
λ m s = 6.9 5.6 × 10 2 T + 2 × 10 4 T 2 2 × 10 7 T 3
λ m s = 1 + 3 × 10 2 T 8 × 10 5 T 2 + 7 × 10 8 T 3
λ m s = 4.4 2.1 × 10 2 T + 7 × 10 5 T 2 8 × 10 8 T 3
where ρs, Cps and λs are the density (kg/m3), thermal capacity (kJ/(kg·K)) and heat-conducting coefficient (W/(m·K)) of microalgae cells; ρw, Cpw and λw are the density, thermal capacity and heat-conducting coefficient of water; T is the thermodynamic temperature of the working substance (K).
The power-law viscosity model (Equation (7)) was used to describe the rheological characteristics of the working substance.
η = k γ n 1
where η is the viscosity of the working substance (Pa·s), γ is shear rate(s−1), n is the power law index, and k is the consistency index (Pa·s). The coefficients of the viscosity of the working fluid are obtained by fitting the experimental data [16].
The Nusselt number (Nu) and heat convection coefficient (h) were defined as follows:
N u = h D k
h = q T w c T m c
where h is the coefficient of convective heat exchange, D is equivalent diameter of channel, q is the average heat flux, Tw−c and Tm−c are the average wall temperature and the average fluid temperature, respectively. The Reynolds number of the working fluid in the absorber tube conforms to laminar flow before boiling, and conforms to turbulent flow after boiling phase transition. The k-epsilon turbulence model was used to calculate the model. The concentration of the working medium is less than or equal to 15 wt.% and the stirring is uniform. According to the research findings of Hao et al. [9], the influence of solid particles on this study is not considered.

2.2. Governing Equations

Microalgae slurry can be regarded as homogeneous, steady and incompressible fluid in the physical model. Meanwhile, the simulation process mainly considers laminar convection heat exchange. The governing equations (Equations (10)–(12)) were defined as follows:
x j ρ m s u j = 0
x j ρ m s u i u j = p x i + x j η u i x j ρ m s g i
x j ρ m s u j C ρ m s T = x j λ m s T x j
where gi and p are the acceleration of gravity normal and pressure, ui and uj are the component of velocity.

2.3. Boundary Conditions and Numerical Method

The inner wall of the channel adopted non-slip boundary condition and a constant heat flux of 9930, 11,100, and 13,000 W/m2 were applied to the absorber tube in numerical simulation. The mass fraction of the working substance was set as 5 wt.%, 10 wt.%, 15 wt.% and the channel inlet volume flow were set as 40 L/h, 50 L/h and 60 L/h, respectively. The import temperature of the working substance was set as 313.15 K under all conditions. The boundary condition at the outlet of the channel is set to outflow.
The finite volume method was used to deal with the controlling equations and SIMPLE algorithm was used to realize the pressure-velocity coupling. Furthermore the convective item were discretized by second-order upwind scheme. The condition of convergence was set that the maximum residuals of continuity, momentum and energy were less than 10−3, 10−6 and 10−6, respectively.

2.4. Grid Independence Checking and Model Validation

According to the actual size of channel, a two-dimensional geometric model is constructed. And three grids were used in the computational domain to validate the precision of numerical calculation. The results were shown in Table 1. Case 1, 2 and 3 represent grids with 44,520, 72,880 and 103,260, respectively. Because there was no obvious difference in the calculation results of three grids according to the results, so the mesh system of 72,880 cells was adopted in follow-up research to insure the precision and economy of the calculation. In order to ensure the accuracy of the experimental results, the accuracy of the experimental equipment itself and the standard deviation in multiple measurement results were taken into account (Table 2).
In order to validate the exactitude of model, the simulated export temperature of channel was compared with the experimental data [8]. The export temperature of channel obtained by simulation was match well with the experimental value and the maximum deviation was 0.7%, which can be seen from Table 3. So, the model is validated.

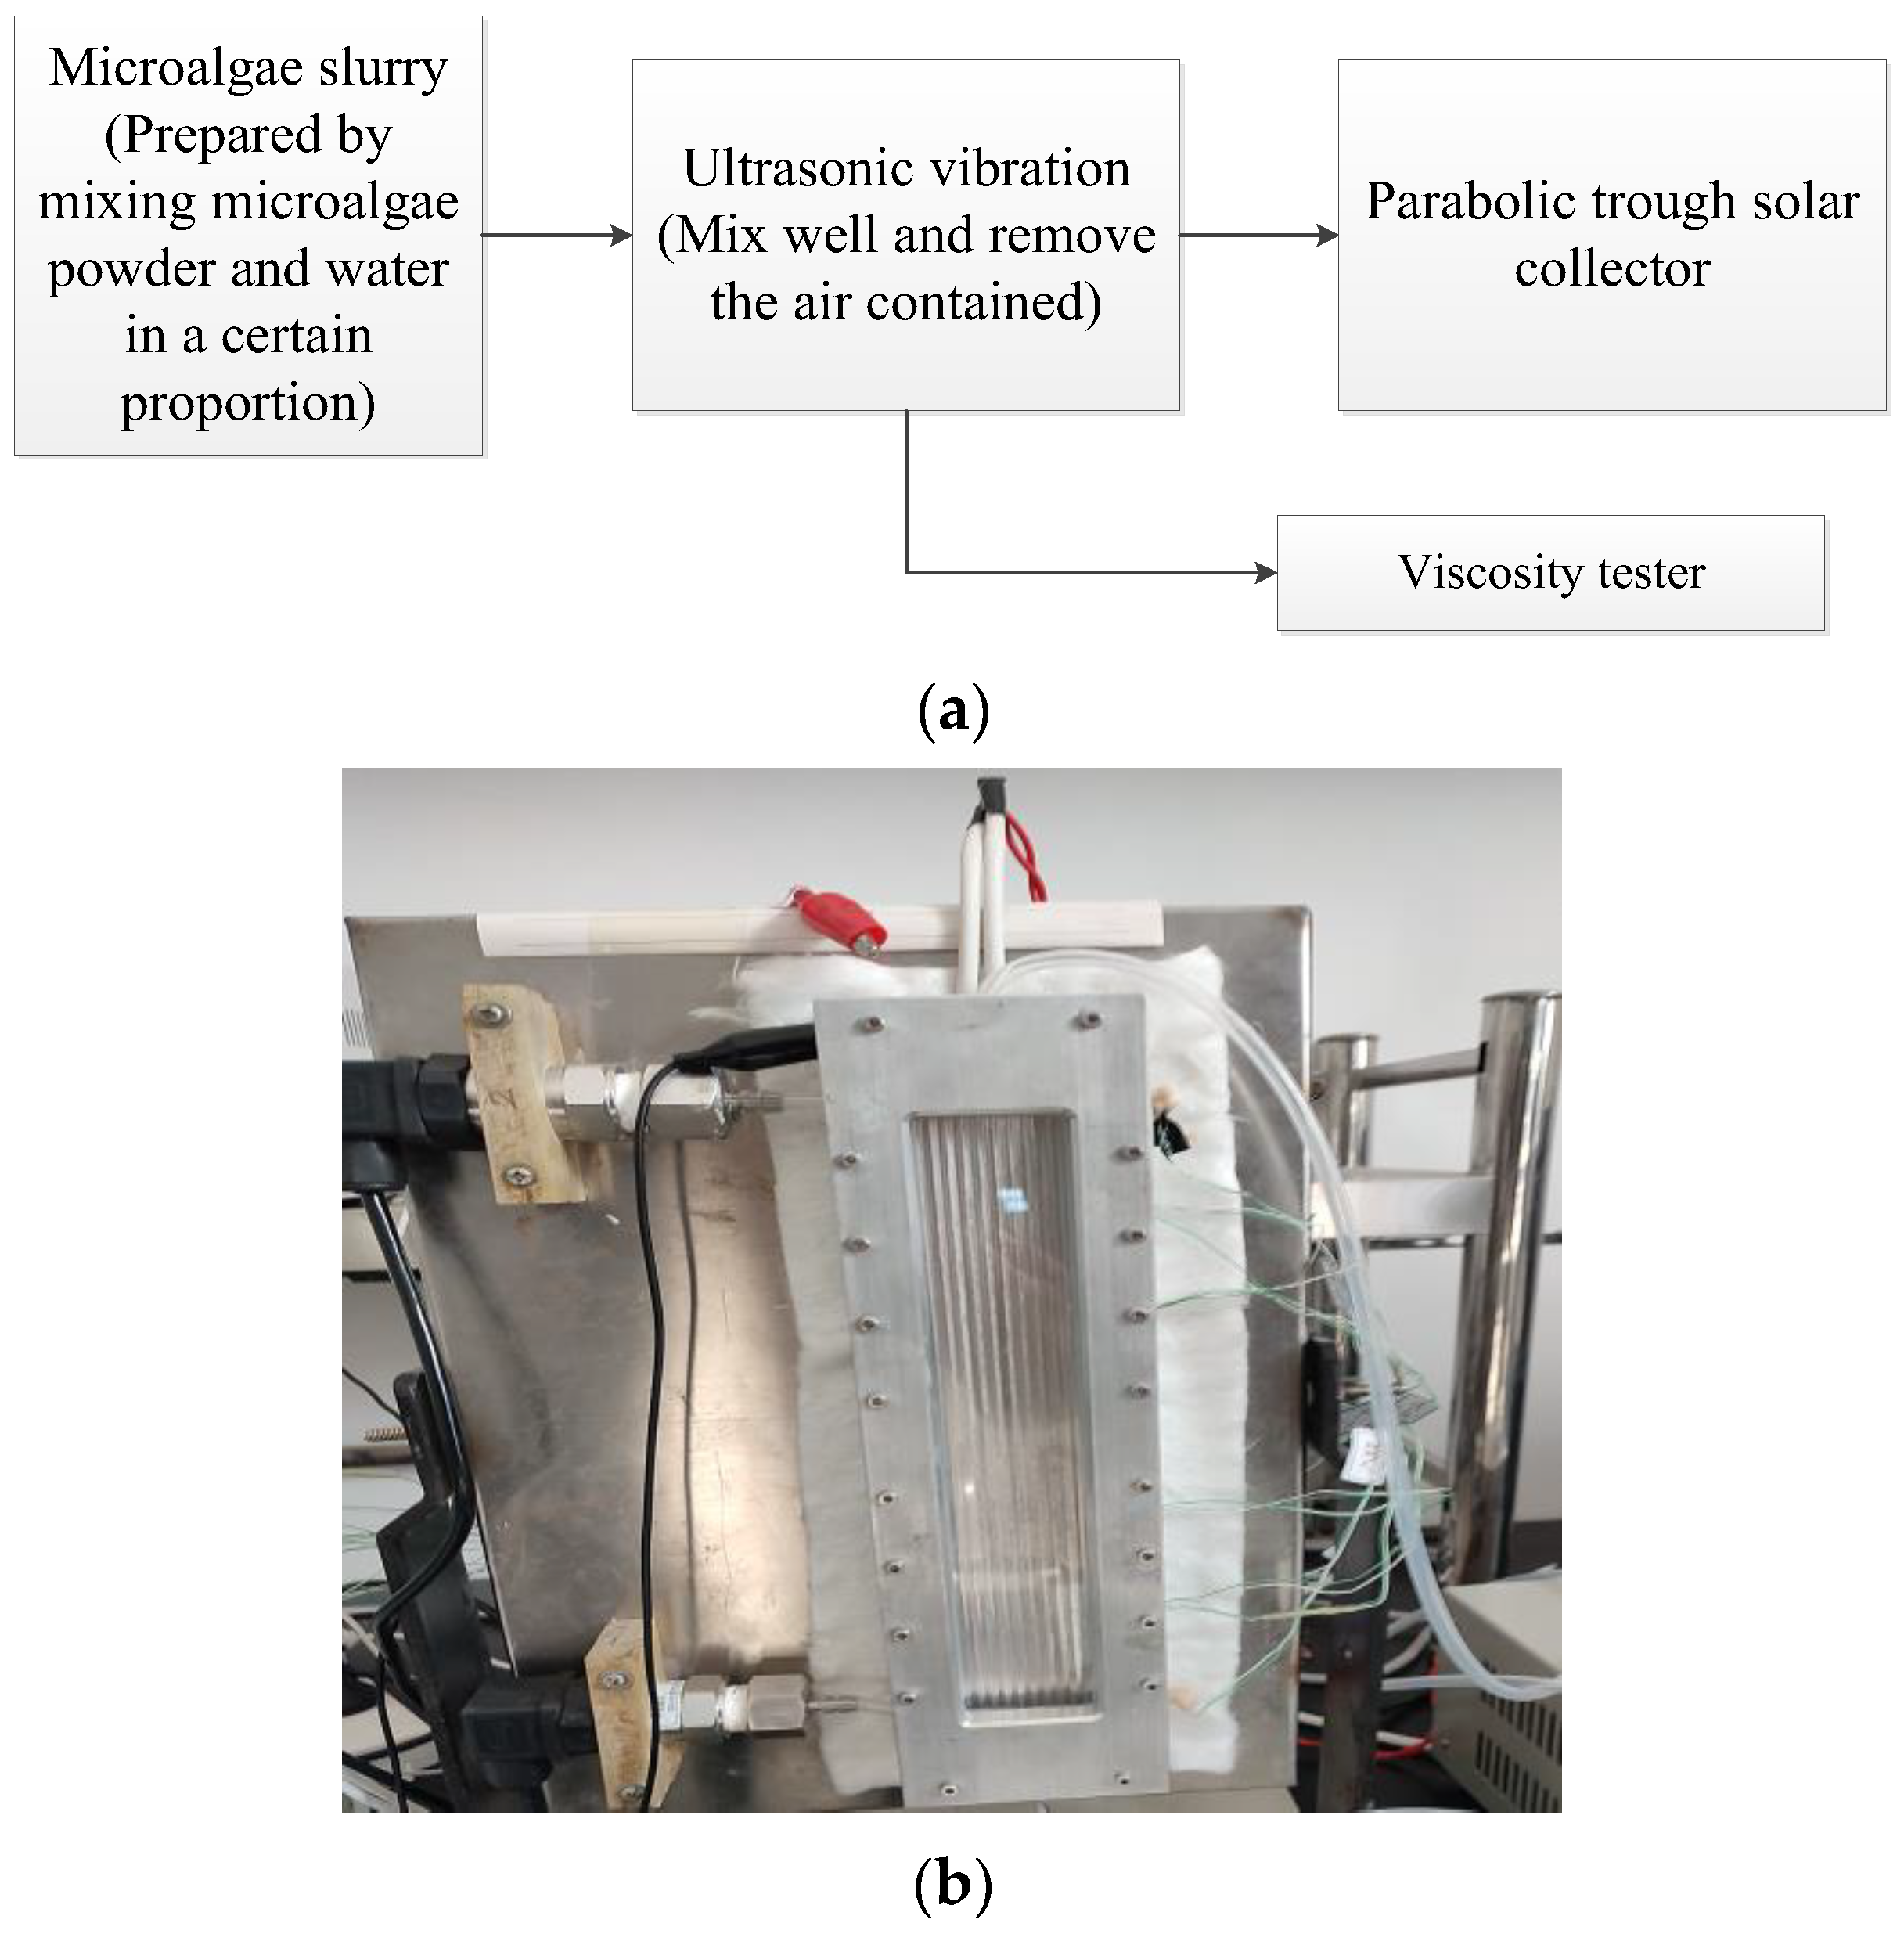
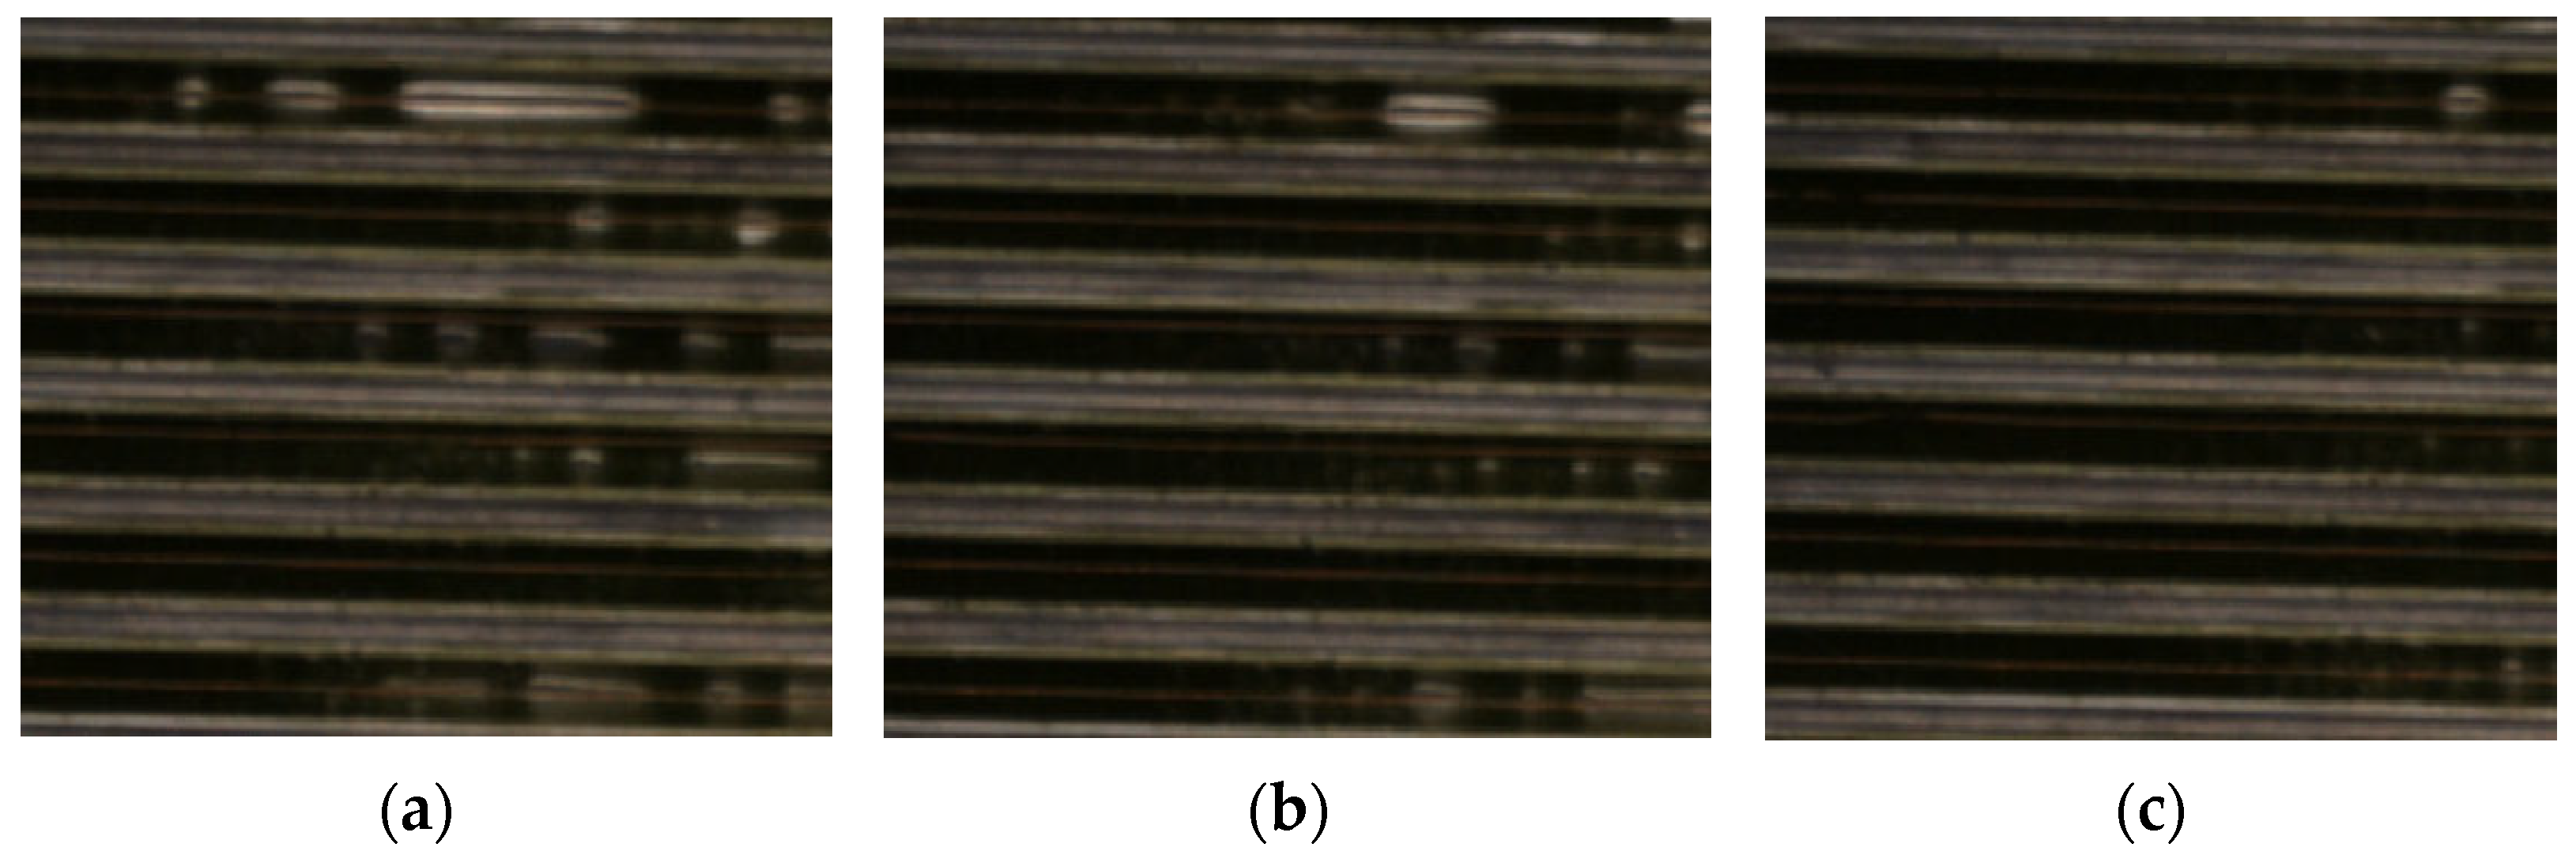
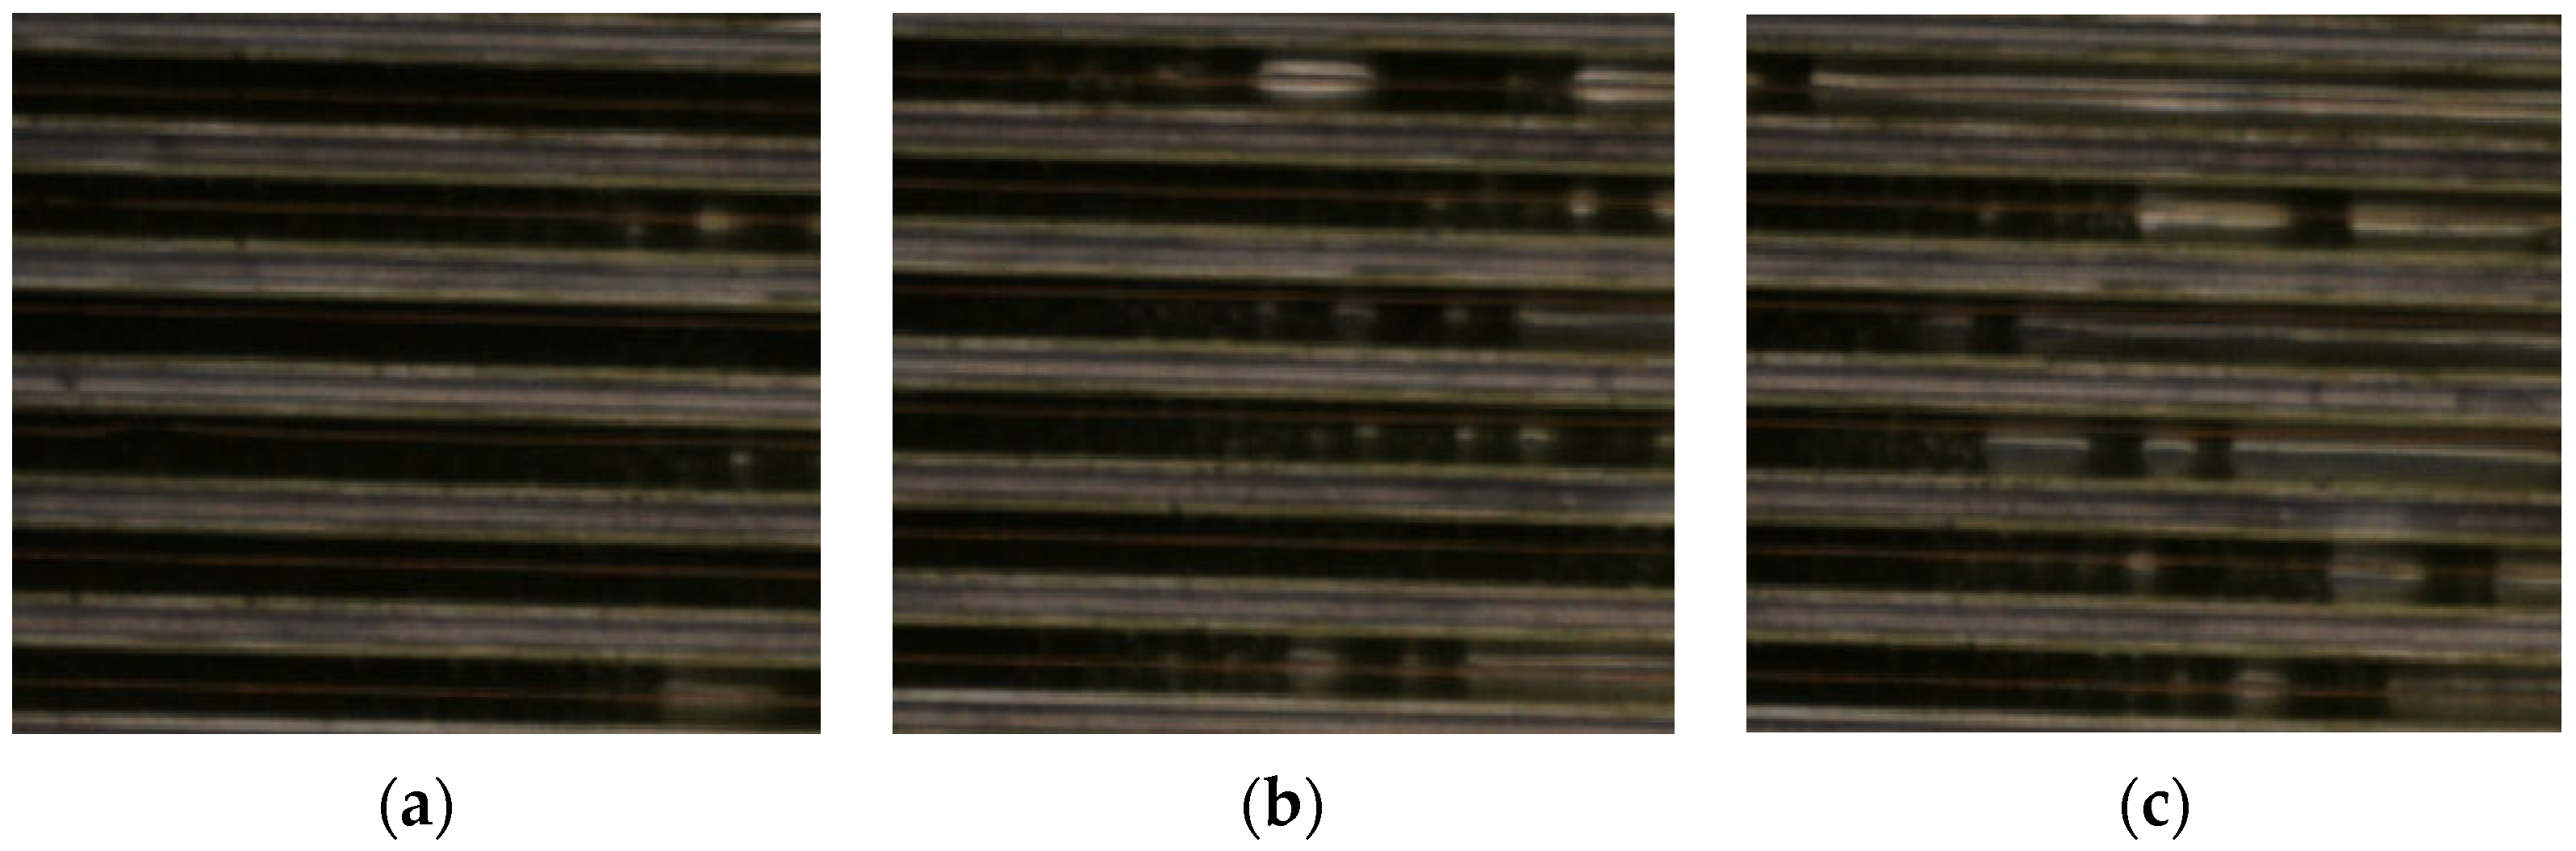
2.5. Experimental Flow Chart and Phase Change Process Observation Device

Figure 2 shows the experimental flow chart (Figure 2a) and phase change process observation device (Figure 2b) of this study. Microalgae slurry was prepared by mixing microalgae powder and water in a certain proportion. Then, input the ultrasonic oscillation device to fully mix and remove the air contained therein. Finally, a part of the working fluid was taken out to input the viscometer to measure the viscosity, and the remaining working fluid was input into the collector for testing. The phase change process observation device (Figure 2b) was used to observe the characteristics of phase transition process. The device has multiple parallel channels, and any one of the channels is the same as the diameter of the collector model in Figure 1. The only difference is that the tube length is 0.5 m. Therefore, the observation section intercepted in the experiment is based on the inlet and outlet temperature of the simulation section. By increasing the inlet temperature of the experiment to 353.15 K, the inlet and outlet temperatures of the experimental interception section and the simulated corresponding section are matched to verify the simulation results.

3. Results and Discussion

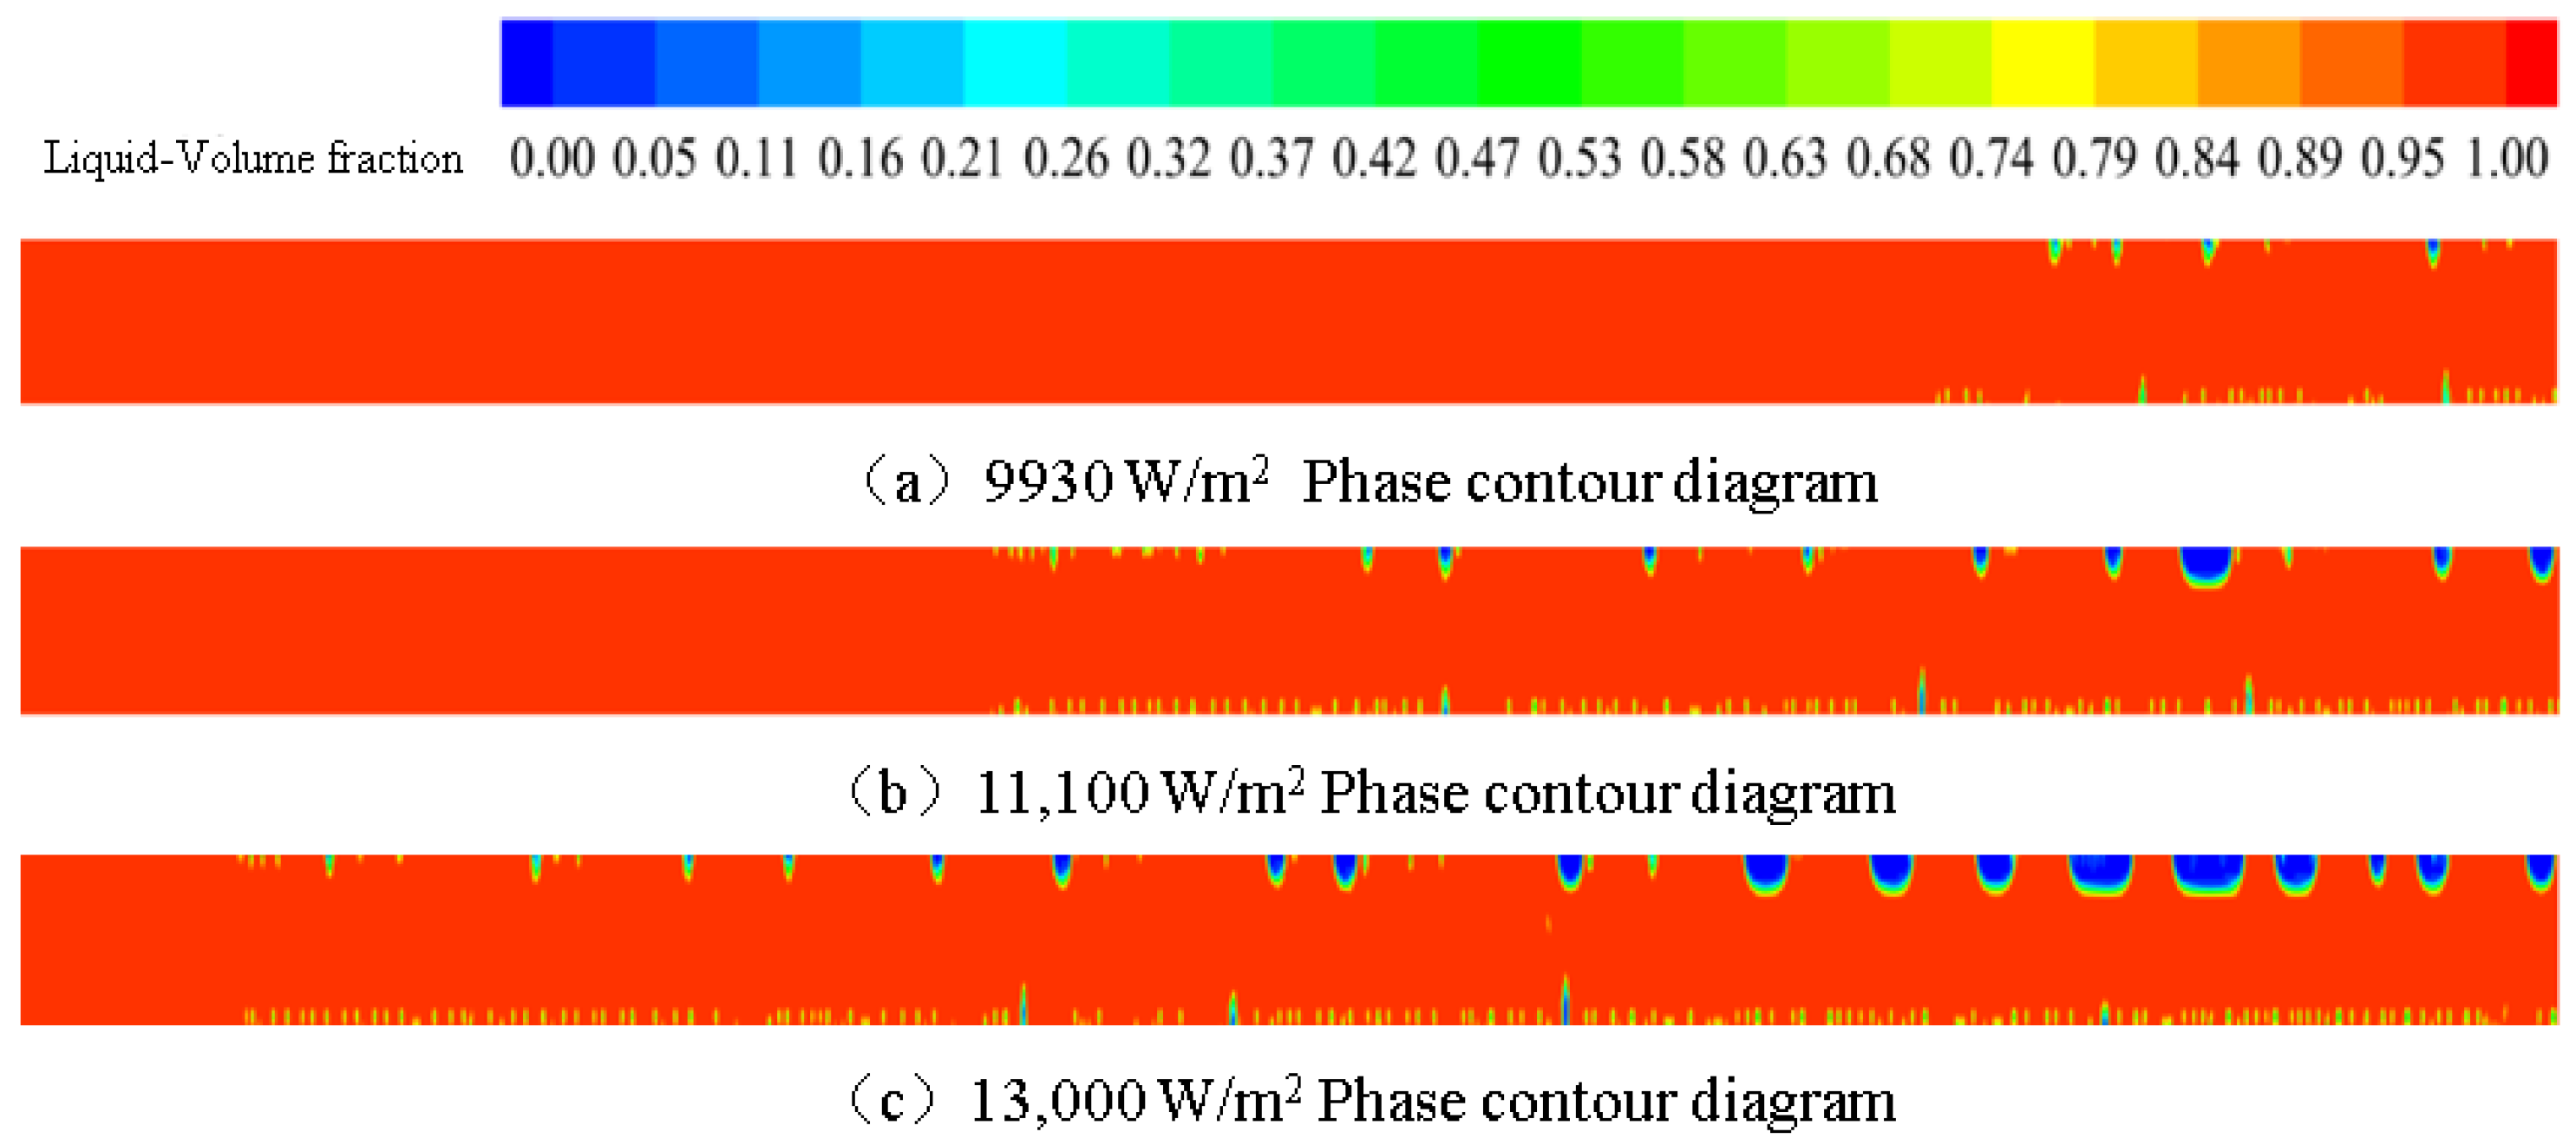
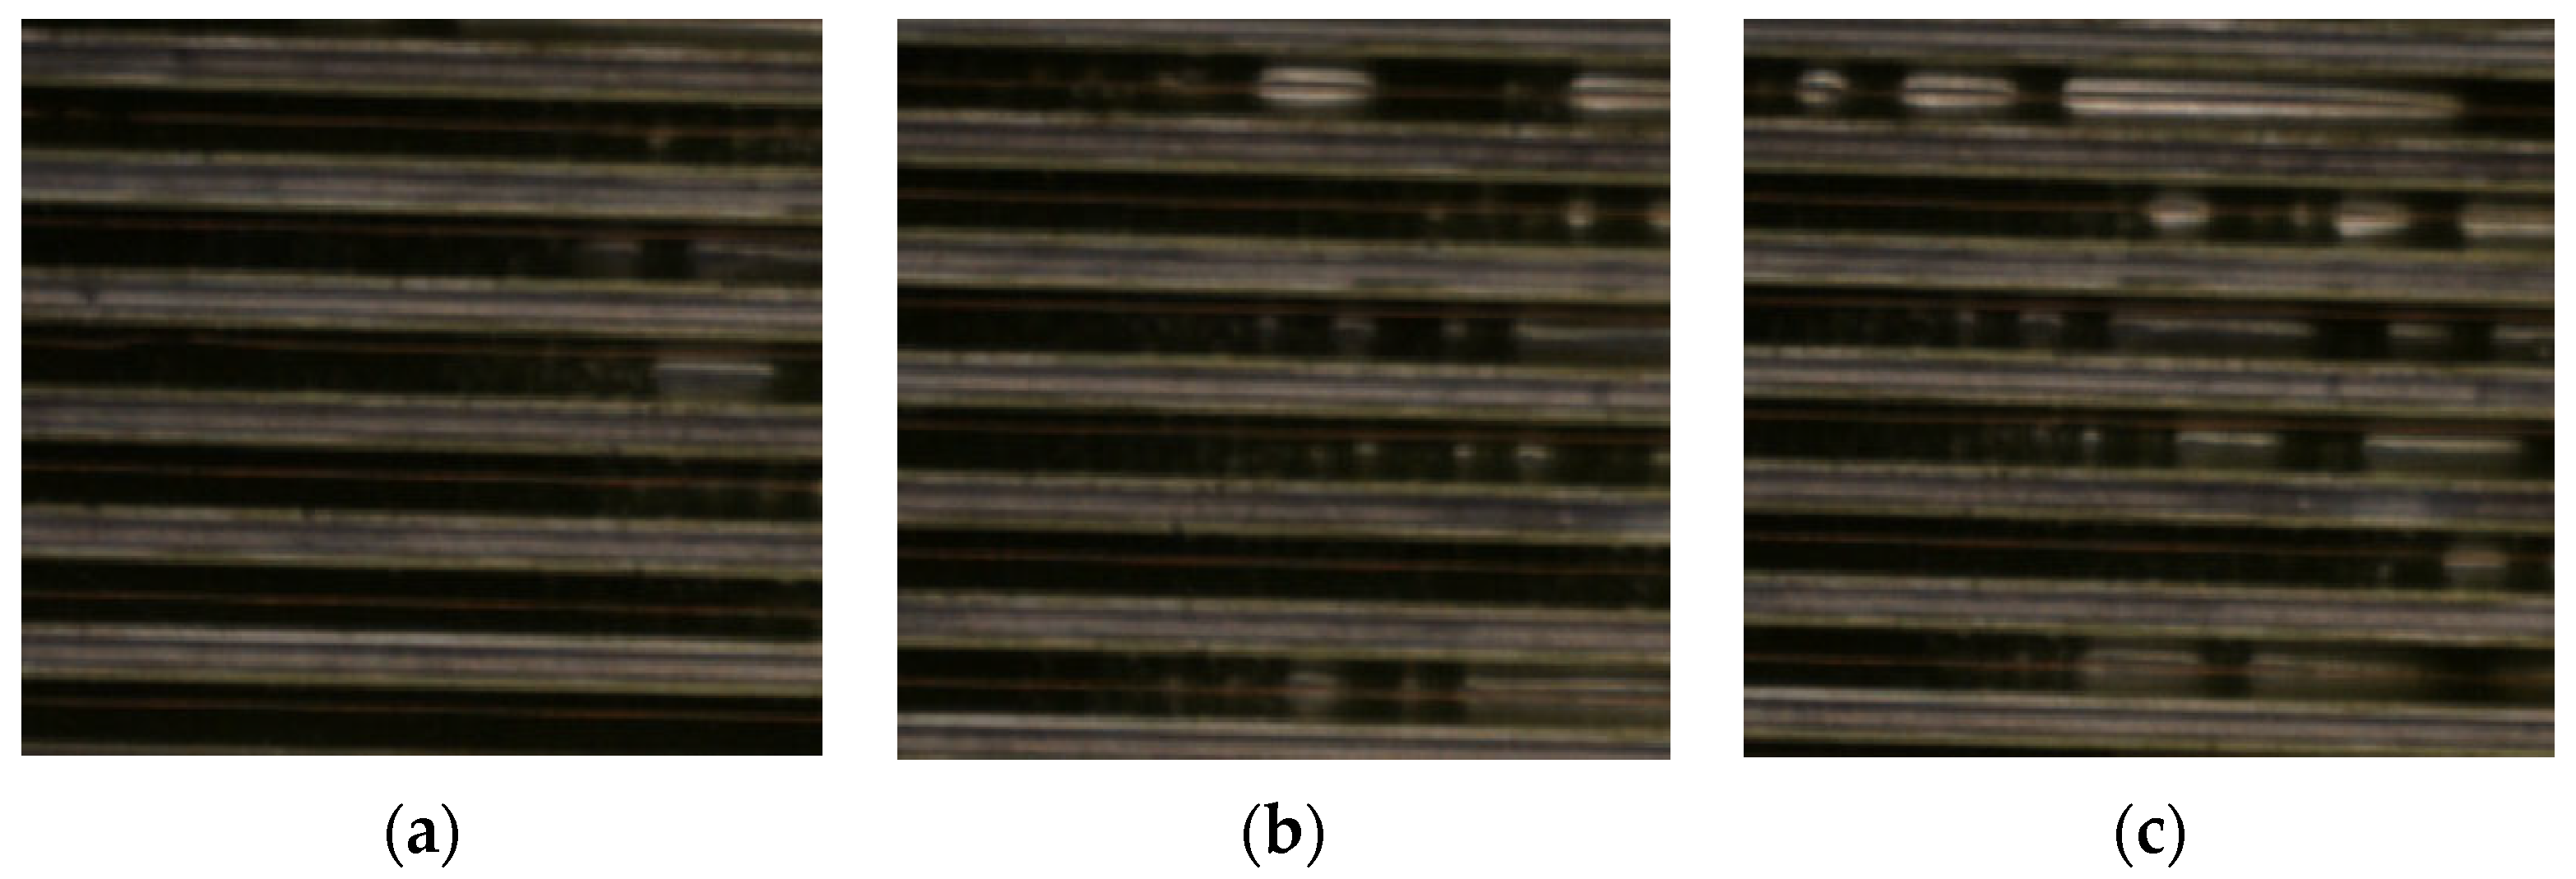
3.1. Effect of Wall Heat Flux on Phase Change Flow and Heat Transfer

The velocity contour diagram and phase contour diagram of microalgae slurry in the pipeline under different wall heat fluxes were shown in Figure 3 and Figure 4. The figures (a), (b) and (c) diagrams in Figure 3a–c and Figure 4a–c represent the velocity and phase contours of the wall heat flux of 9930 W/m2, 11,100 W/m2 and 13,000 W/m2, respectively. The microalgae slurry flow rate (60 L/h corresponds to the inlet velocity of 0.0207 m/s) and the concentration (10 wt.%) remain constant. From the results of velocity perturbation, the position of bubbles moves forward with the rise in heat flux. This is because when the inlet flow rate of the pipeline is consistent, for the same concentration of algae slurry, the temperature rise with the increase in the incoming heat. Therefore, with the increase in heat flux, the higher heat makes the microalgae slurry in the pipe reach the saturation temperature faster and the phase transition occurs earlier. For the laminar flow before the phase change in the algae slurry, the velocity distribution is more uniform, and the flow rate of the working fluid near the center of the pipeline is faster. This is due to the decrease in the viscous transfer process of the algae slurry at the pipe wall. As the heat flow increases, the area of high-speed fluid at the center of the pipeline is also larger. For the fluid velocity after phase change, it can be seen that with the increase in heat flux, the disturbance of algae slurry velocity is more intense. This is because the amount of bubbles also rise with the increase in heat. The more bubbles in the pipeline, the more complex the gas–liquid phase movement. Figure 4 is the experimental phase diagram under different wall heat fluxes. Figures (a), (b) and (c) in Figure 5a–c represent the experimental phenomena at wall heat fluxes of 9930 W/m2, 11,100 W/m2 and 13,000 W/m2, respectively. It can be seen that simulation results are close to experimental results. The changes in the fluid temperature (Figure 6a) and thermal conductivity (Figure 6b) under different wall heat fluxes are shown in Figure 6. Figure 6 captures the significant change section of each parameter after the phase transition. After the phase transition, part of the heat input to the pipeline is used to absorb the latent heat of vaporization of the algae slurry, which makes the fluid temperature lower than before, and gradually approaches the saturation temperature of 373.15 K, but slightly lower than the saturation temperature. The reason for this change is that we use the method of mass average calculation for the average temperature of the working substance in the pipeline. The high temperature gas generated during the phase change process has a large difference in the order of magnitude between its density and the density of the algae slurry, so the calculation process of the fluid temperature will not be affected. And the temperature of the fluid in the pipeline shows a gradient distribution on the axial section, which ultimately makes the average temperature of algae slurry at the lateral section slightly lower than the saturation temperature. From the temperature change curve, it can also be seen that the location of the phase change in the algae slurry begins to decrease with the increase in wall heat flux. Before the phase change, the thermal coefficient of the fluid at the same cross section decreases with the rise in wall heat flux. After the phase change, the temperature of the fluid decreases, and according to the description of the thermal coefficient in Equation (5), the thermal coefficient is negatively correlated with the temperature. Therefore, when the temperature decreases, the thermal conductivity increases under different wall heat fluxes. Therefore, we obtained the influence of wall heat flux on the phase change reaction of microalgae slurry in the collector by analyzing Figure 3, Figure 4, Figure 5 and Figure 6.

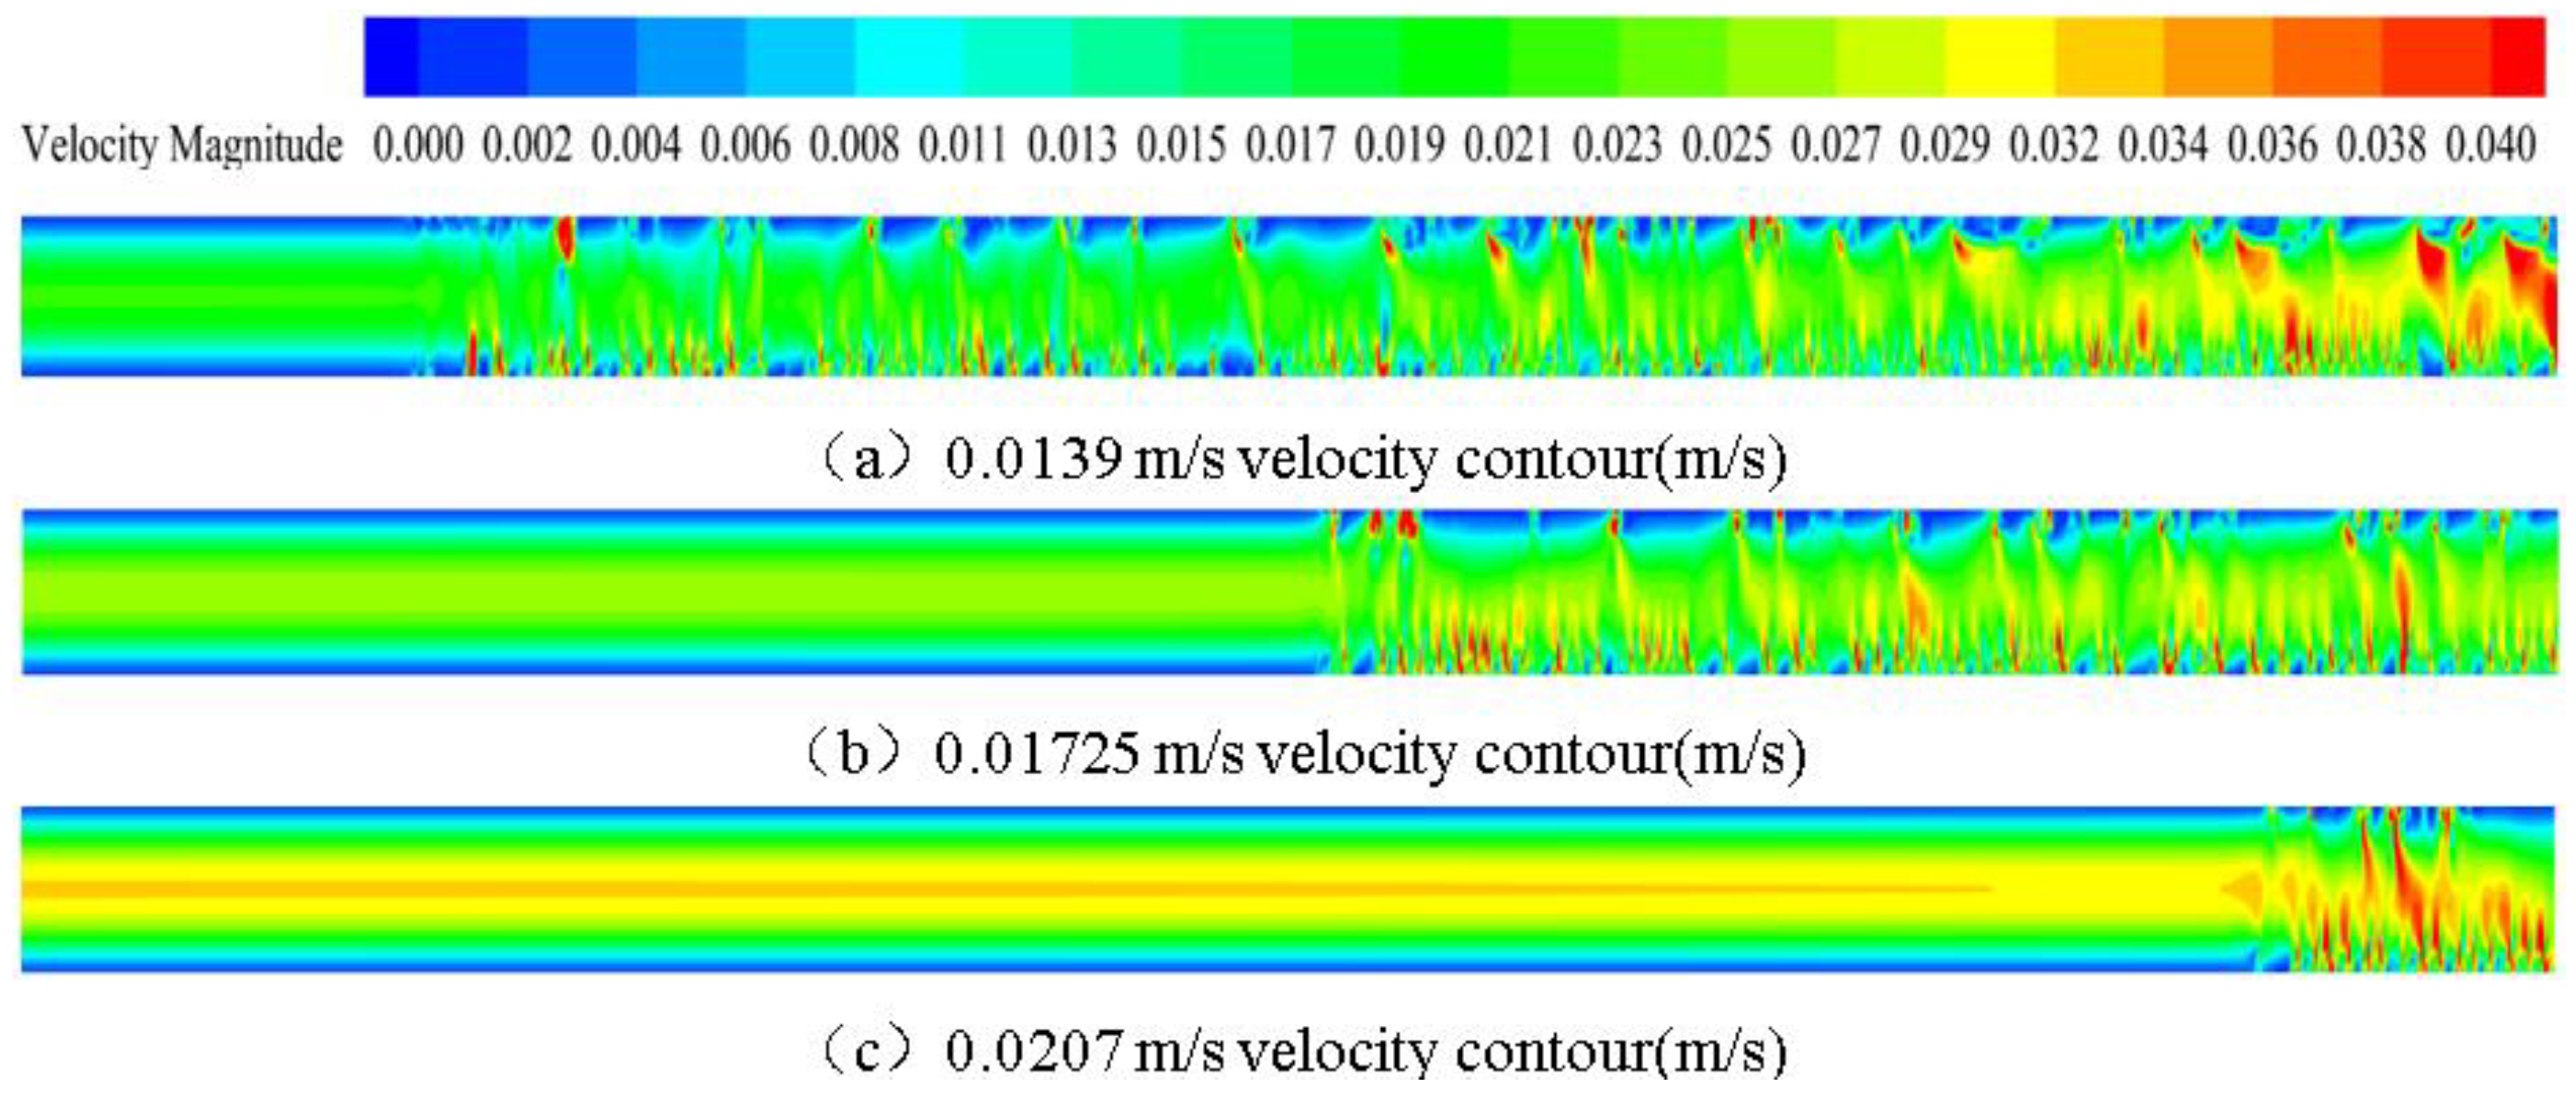
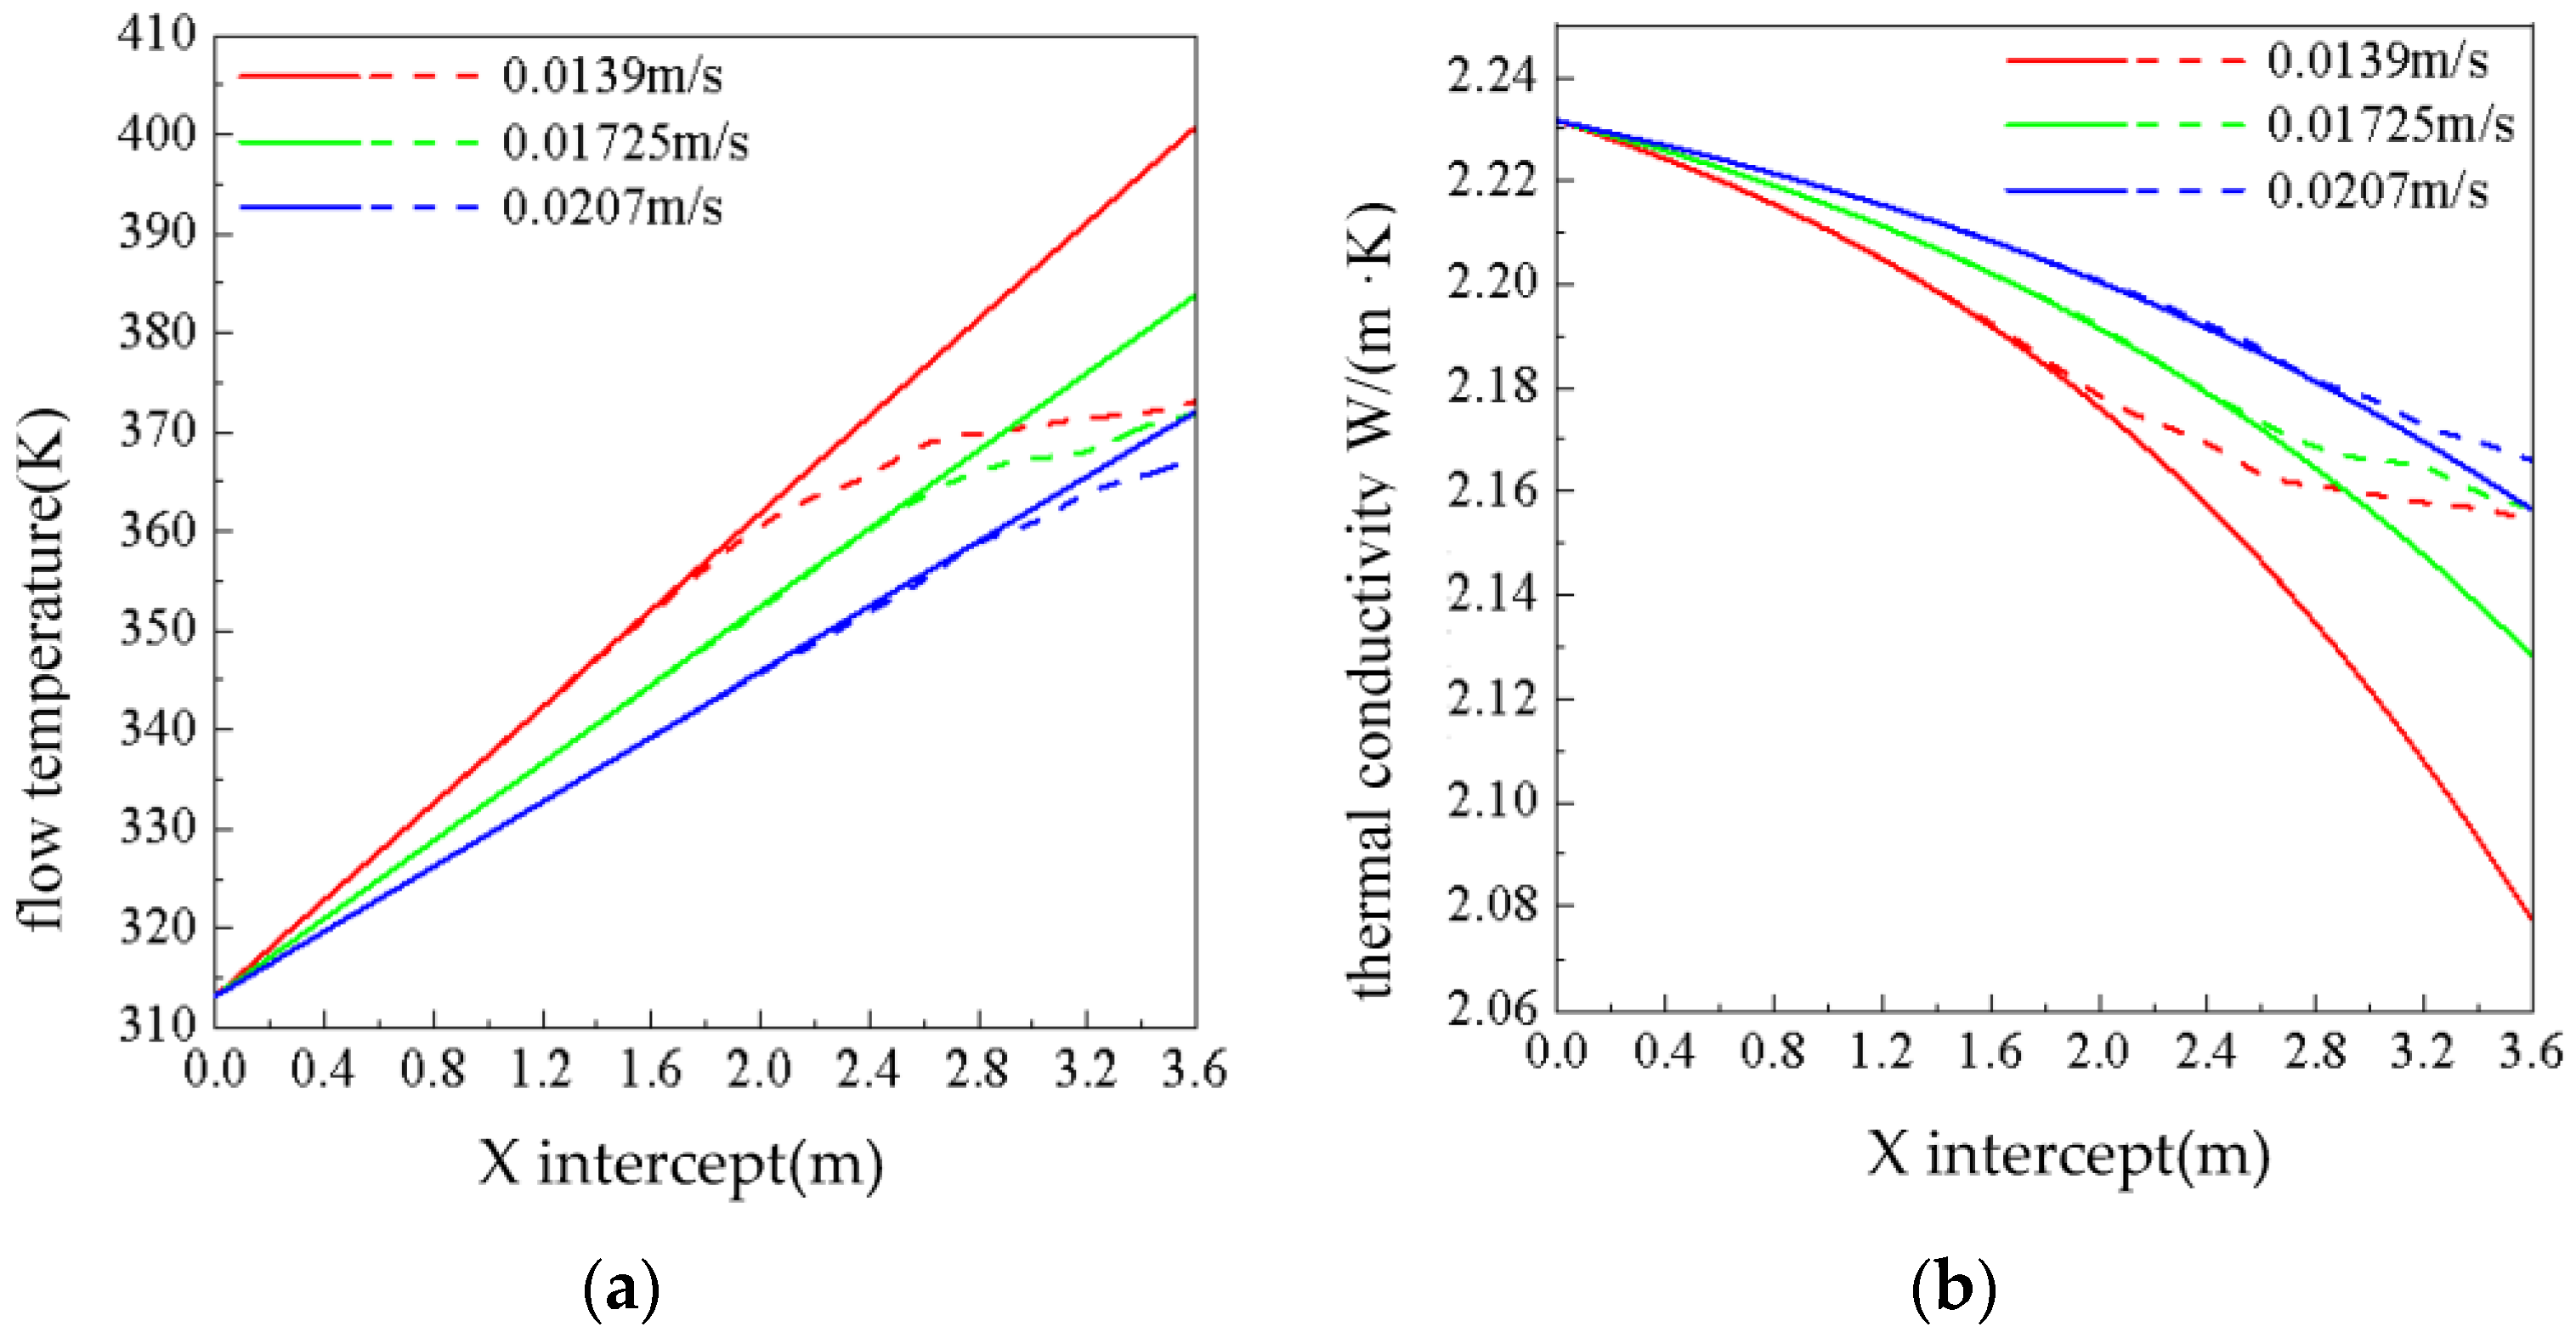
3.2. Effect of the Flow Rate on Phase Change Flow and Heat Transfer

The velocity contour diagram and phase contour diagram of microalgae slurry in the pipeline at different flow rates are shown in Figure 7 and Figure 8. The figures (a), (b) and (c) diagrams in Figure 7a–c and Figure 8a–c represent the velocity and phase contours of microalgae slurry under the inlet flowrate of 0.0139 m/s, 0.01725 m/s and 0.0207 m/s, respectively. The microalgae slurry concentration (10 wt.%) and wall heat flux (11,100 W/m2) remain unchanged. At different inlet flow rates, the phase change position of algae slurry is different. This is because for the same concentration of algae slurry, when the input heat is constant, the temperature rise and temperature rise rate will increase with the decrease in the fluid flow rate. Therefore, as the flow rate of algae slurry decreases, the temperature of algae slurry increases faster. It can be seen from the diagram that with the rise in the flow rate of algae slurry, the flow state in pipeline after the phase change is more disordered, and the disturbance to the fluid is more severe. Figure 9 is the experimental phase diagram under different flow rates. Figures (a), (b) and (c) in Figure 8a–c represent the experimental phenomena at flow rates of 0.0139 m/s, 0.01725 m/s and 0.0207 m/s, respectively. It can be seen that simulation results are close to experimental results. The curves of the fluid temperature (Figure 10a) and thermal conductivity (Figure 10b) under different inlet flow rates in the case of phase change and no phase change are shown in Figure 10. Figure 10 captures the significant change section of each parameter after the phase transition. The solid line represents the change before the phase transition of the algae slurry, and the dashed line represents the change after the phase transition. When the temperature of the algae slurry reaches the saturation point, the fluid temperature is lower than before due to the partial heat acting on the latent heat of vaporization. The phase change position point of the algae slurry in the curve diagram is compared with the velocity contour diagram. The lower the velocity is, the closer the phase change position point of the algae slurry is to the 0 point, and the smaller the intercept on the X axis is. At the beginning of the phase transition, the temperature curve gradually deviates from the lower, the temperature rise becomes slower, and as the speed of the algae slurry increases, the smaller the deviation. In the curve of thermal conductivity, the fitting curve of the thermal conductivity of fluid descent with the rise in temperature. Therefore, at different velocities, when the temperature of the algae slurry decreases after the phase change, the thermal coefficient increases compared with the non-phase change. The deviation position increases with the rise in the inlet velocities, and the deviation difference also increases with the rise in the heating rate. Therefore, we obtained the effect of the flow rate on the phase change reaction of microalgae slurry by analyzing Figure 7, Figure 8, Figure 9 and Figure 10.

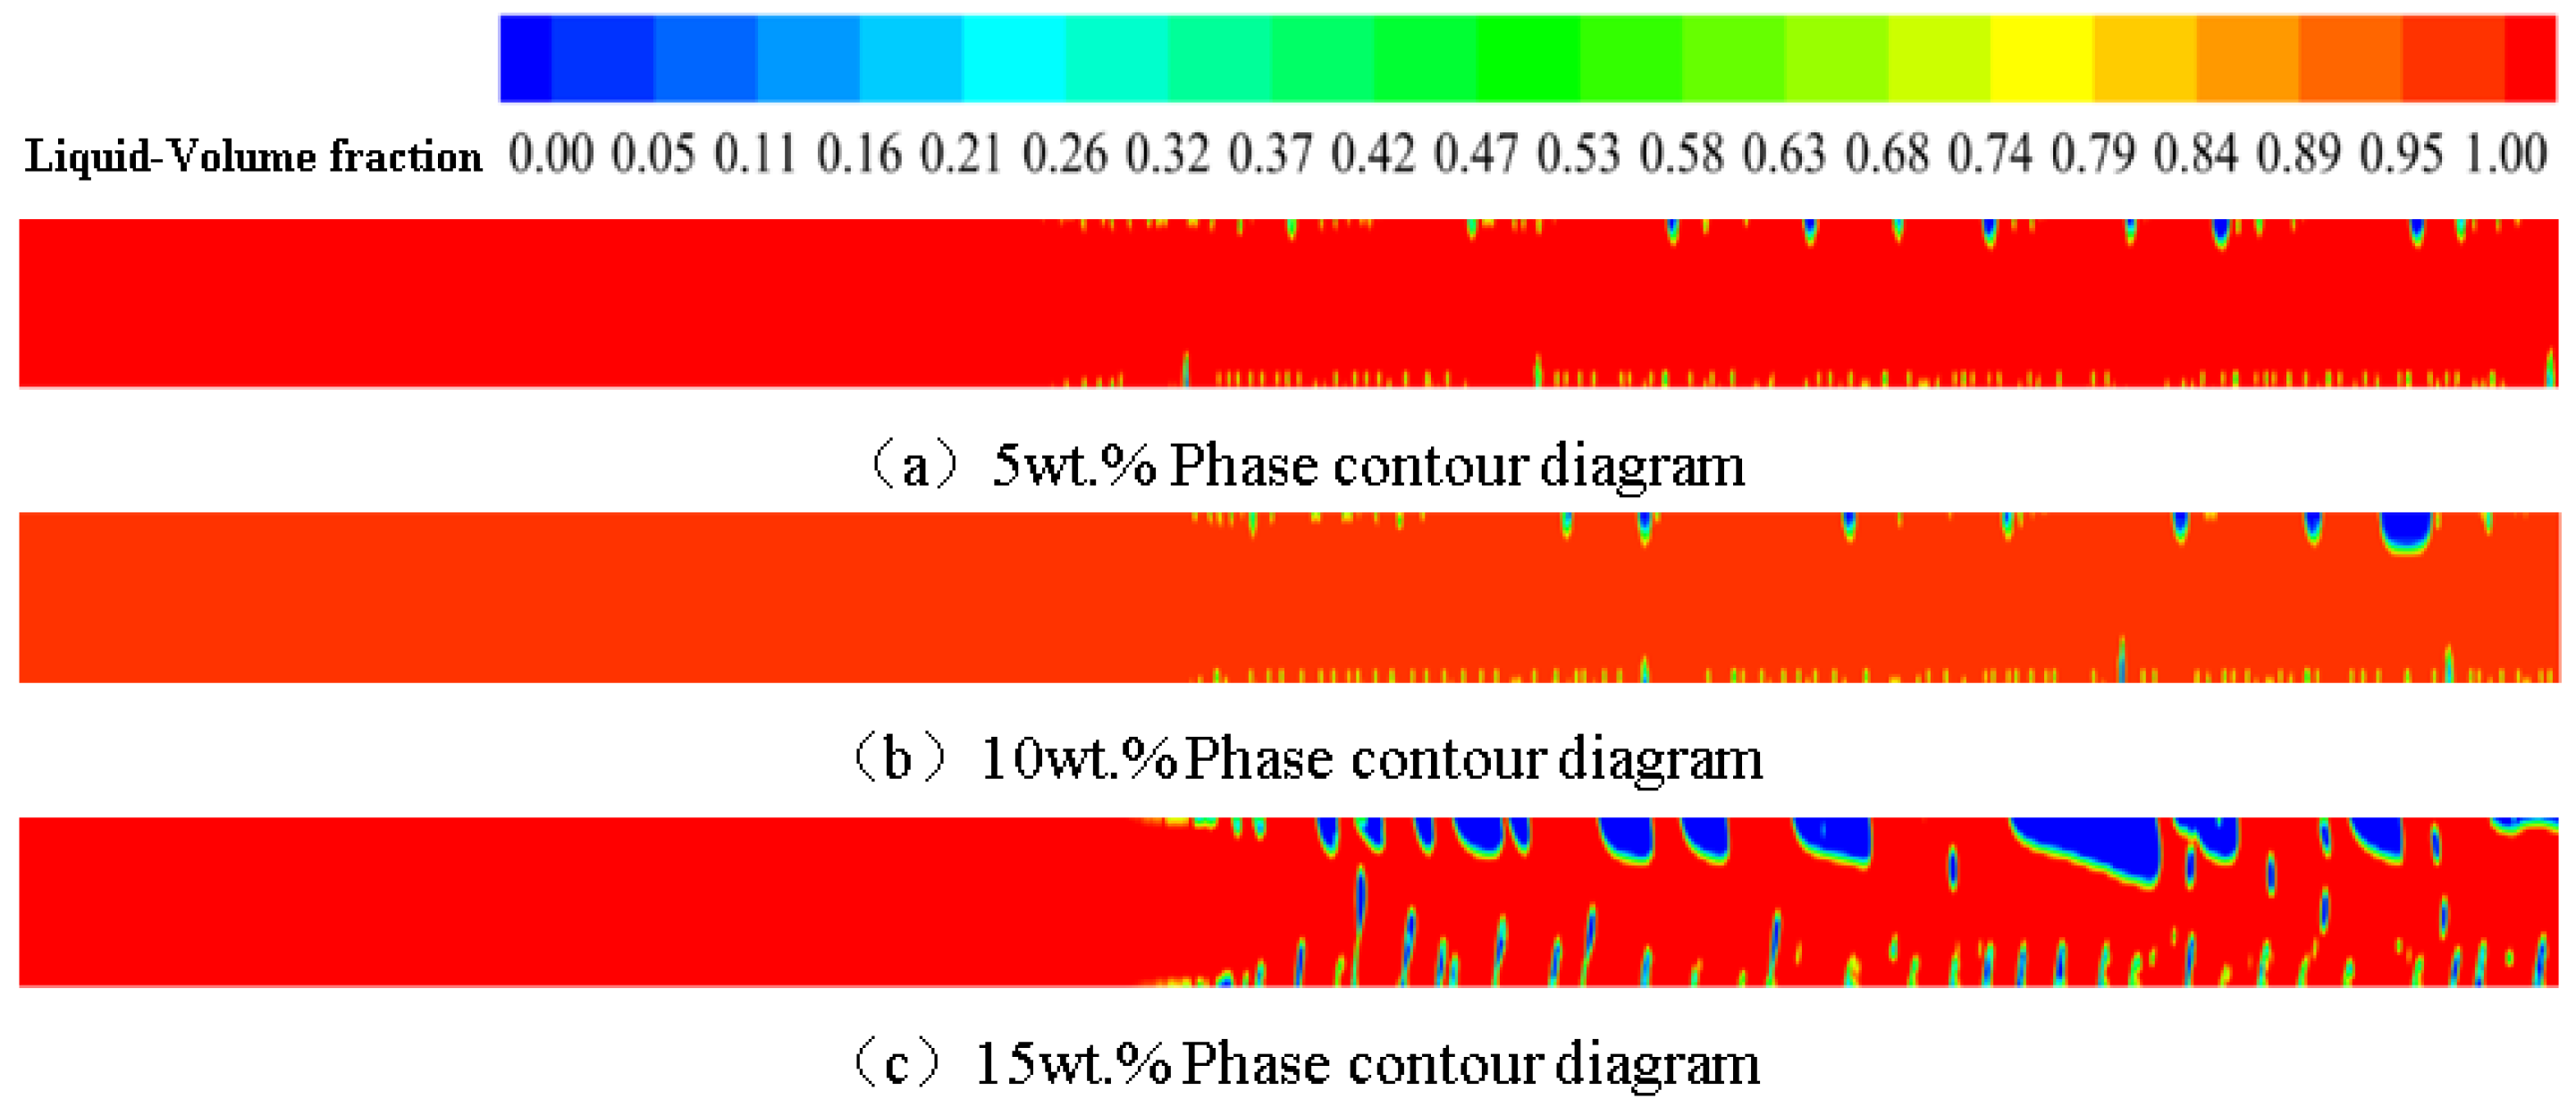
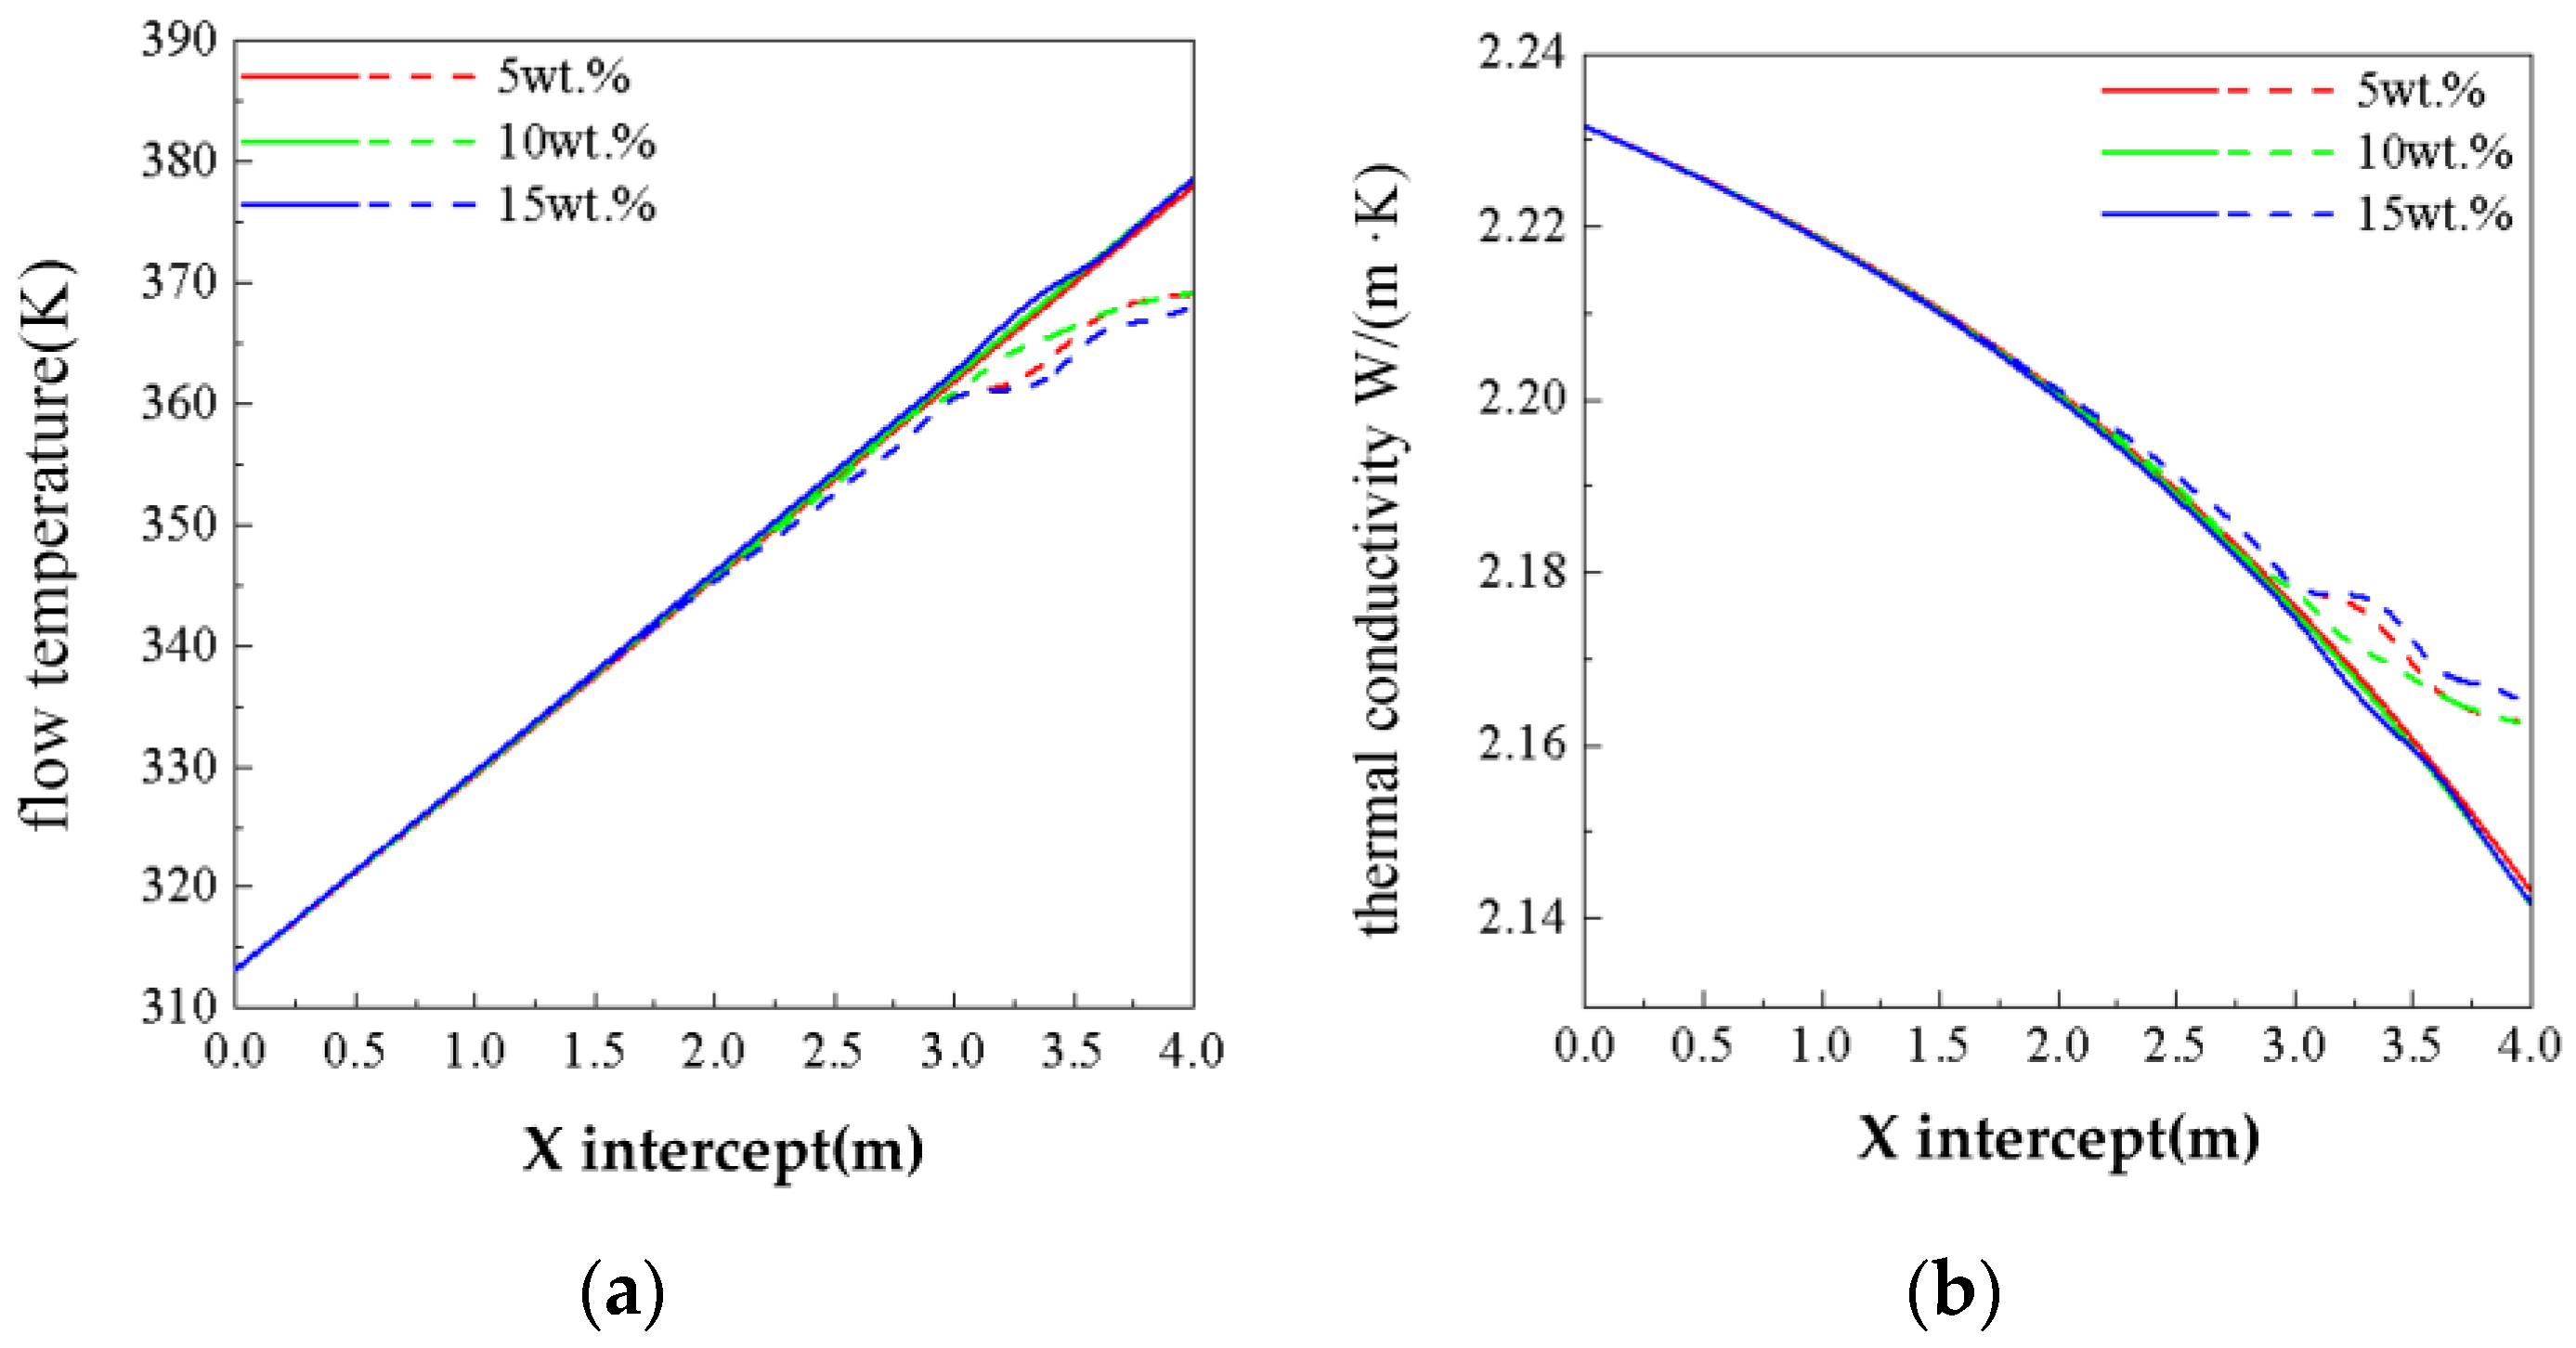
3.3. Effect of Concentration on Phase Change Flow and Heat Transfer

The velocity contour diagram and phase contour diagram of microalgae slurry at different concentrations were shown in Figure 11 and Figure 12. The figures (a), (b) and (c) diagrams in Figure 11a–c and Figure 12a–c represent the velocity and phase contours of the concentrations of 5 wt.%, 10 wt.% and 15 wt.%, respectively. The microalgae slurry inlet velocity (0.0207 m/s) and wall heat flux (11,100 W/m2) remain unchanged. The algae slurry with different concentrations makes a stable laminar flow before the phase change occurs, and the thickness of the velocity boundary between the high-speed region in the center of the pipe and the wall rise with the increase in the concentration of algae slurry. After the phase change occurs, the velocity of 5 wt.% and 10 wt.% algae slurry is disturbed by bubbles in the pipe, and the low-speed region at the bottom of the wall becomes discontinuous due to the rise in bubbles, while the 15 wt.% algae slurry is affected by bubbles because of its large center height area. The high-speed region shows an upward trend, resulting in a thinning of the low-speed region on the upper wall, while the low-speed region on the lower wall is disturbed, and the overall region becomes larger. It can be seen from the figure that for different concentrations of algae slurry, the position of phase transition is the same, because its density and specific heat capacity are not much different, and its temperature rise is the same under the same conditions. Figure 13 is the experimental phase diagram under different concentrations. Figures (a), (b) and (c) in Figure 13a–c represent the experimental phenomena at the concentrations of 5 wt.%, 10 wt.% and 15 wt.%, respectively. It can be seen that simulation results are close to experimental results. The curves of temperature (Figure 14a) and thermal conductivity (Figure 14b) with different concentrations in the case of phase change and no phase change are shown in Figure 14. The temperature of algae slurry with different concentrations remained basically the same before and after the phase transition under the same conditions, and because the location of the phase transition was at 2.7 m, the temperature of the three concentrations of algae slurry began to deviate after 2.7 m, and the temperature was lower than that before the phase transition. The thermal conductivity of the fluid also has similar changes. Because it is a negative correlation function with temperature, when the temperature of the algae slurry decreases, the thermal conductivity increases from the point of phase change, which deviates from the thermal conductivity curve without phase change. Therefore, we obtained the effect of microalgae slurry concentration on the phase change reaction of microalgae slurry in the collector by analyzing Figure 11, Figure 12, Figure 13 and Figure 14.

4. Conclusions

In this paper, the effects of different wall heat flux, the pipe inlet flow rate and microalgae biomass concentration on the phase change reaction of microalgae slurry in the collector were studied by numerical simulation and experiment. The simulation phenomenon is similar to the experimental phenomenon, and its accuracy is verified. The results show that the phase transition of the working substance is different when the boundary conditions of the working substance with the same concentration change. The higher the wall heat flux, the more forward the phase transition occurs, and the smaller the inlet velocity, the more forward the phase transition occurs. When other boundary conditions remain unchanged, the phase transition points of microalgae slurry with different concentrations are the same, and the concentration of microalgae slurry has no effect. However, the deviation between the fluid temperature and the thermal conductivity of high-concentration fluid after phase change is larger than that of low-concentration fluids. The deviation in the fluid temperature reaches approximately 10 K, and the deviation in thermal conductivity reaches approximately 0.025 W/(m·K). Therefore, the change in the fluid temperature and heat transfer intensity after phase change in microalgae slurry is more intense than that of Newtonian fluids. The research results of this paper have important guiding significance for the in-depth study of the flow and heat transfer characteristics of gas–liquid two-phase flow in non-Newtonian fluids. It provides an important theoretical basis for the design and optimization of solar collectors in hydrothermal pretreatment systems, and also establishes an important foundation for the research and design of bionic bioreactors. The limitation of this study is that it is based on uniform heating, which is different from the non-uniform heating of solar collectors. Future research should further analyze the effects of secondary flow caused by non-uniform heating.

Author Contributions

Conceptualization, W.H. and N.D.; methodology, W.H.; software, W.H.; validation, W.H., N.D. and Q.C.; formal analysis, W.H.; investigation, W.H.; resources, W.H.; data curation, W.H.; writing—original draft preparation, W.H.; writing—review and editing, W.H.; visualization, W.H.; supervision, W.H.; project administration, W.H.; funding acquisition, N.D. All authors have read and agreed to the published version of the manuscript.

Funding

This research was funded by the National Natural Science Foundation of China (Nos. 51836001, 52076033).

Data Availability Statement

Data available on request due to restrictions e.g., privacy or ethical. The partial data presented in this study are available on request from the corresponding author.

Conflicts of Interest

The authors declare no conflict of interest.

References

  1. Berenguer, C.V.; Perestrelo, R.; Pereira, J.A.; Câmara, J.S. Management of Agri-Food Waste Based on Thermochemical Processes towards a Circular Bioeconomy Concept: The Case Study of the Portuguese Industry. Processes 2023, 11, 2870. [Google Scholar] [CrossRef]
  2. Verdelho Vieira, V.; Cadoret, J.-P.; Acien, F.G.; Benemann, J. Clarification of Most Relevant Concepts Related to the Microalgae Production Sector. Processes 2022, 10, 175. [Google Scholar] [CrossRef]
  3. Velmozhina, K.; Shinkevich, P.; Zhazhkov, V.; Politaeva, N.; Korablev, V.; Vladimirov, I.; Morales, T.C. Production of Biohydrogen from Microalgae Biomass after Wastewater Treatment and Air Purification from CO2. Processes 2023, 11, 2978. [Google Scholar] [CrossRef]
  4. Liu, P.; Zhuang, H.; Qian, Y.; Yang, J.; Pan, Y.; Zhou, Z.; Jia, L.; Qi, F. Recent advances in mass spectrometric studies on the reaction process of biomass pyrolysis. Fuel Process. Technol. 2022, 237, 107473. [Google Scholar] [CrossRef]
  5. Romero-Borbón, E.; Oropeza-González, A.E.; González-García, Y.; Córdova, J. Thermochemical and Enzymatic Saccharification of Water Hyacinth Biomass into Fermentable Sugars. Processes 2022, 10, 210. [Google Scholar] [CrossRef]
  6. Encinas-Vazquez, I.A.; Carrillo-Pérez, E.; Mártin-García, A.R.; Del-Toro-Sánchez, C.L.; Márquez-Ríos, E.; Bastarrachea, L.J.; Rodríguez-Figueroa, J.C. Effects of High-Intensity Ultrasound Pretreatment on the Exopolysaccharide Concentration and Biomass Increase in Cheese Whey Kefir. Processes 2023, 11, 1905. [Google Scholar] [CrossRef]
  7. Lee, D.; Nam, H.; Seo, M.W.; Lee, S.H.; Tokmurzin, D.; Wang, S.; Park, Y.K. Recent progress in the catalytic thermochemical conversion process of biomass for biofuels. Chem. Eng. J. 2022, 447, 137501. [Google Scholar] [CrossRef]
  8. Xiao, C.; Liao, Q.; Fu, Q.; Huang, Y.; Chen, H.; Zhang, H.; Xia, A.; Zhu, X.; Reungsang, A.; Liu, Z. A solar-driven continuous hydrothermal pretreatment system for biomethane production from microalgae biomass. Appl. Energy 2019, 236, 1011–1018. [Google Scholar] [CrossRef]
  9. Chen, H.; Fu, Q.; Liao, Q.; Zhang, H.; Huang, Y.; Xia, A.; Zhu, X. Rheological properties of microalgae slurry for application in hydrothermal pretreatment systems. Bioresour. Technol. 2017, 249, 599–604. [Google Scholar] [CrossRef]
  10. Eshgarf, H.; Afrand, M. An experimental study on rheological behavior of non-Newtonian hybrid nano-coolant for application in cooling and heating systems. Exp. Therm. Fluid Sci. 2016, 76, 221–227. [Google Scholar] [CrossRef]
  11. Yoo, G.; Park, M.S.; Yang, J.W. Lipid content in microalgae determines the quality of biocrude and Energy Return On Investment of hydrothermal liquefaction. Appl. Energy 2015, 156, 354–361. [Google Scholar] [CrossRef]
  12. Luo, W.; Han, H.Z.; Yu, R.T.; Cai, L.; Gao, R.C. Numerical Study on Flow and Heat Transfer Characteristics of the Annular Side for Eccentric Helically Coiled Tube in Tube Heat Exchanger. J. Northeast. Electr. Power Univ. 2021, 6, 53–60. [Google Scholar]
  13. Zhang, X.; Ma, D.; Xia, G. Numerical Study of Enhanced Heat Transfer with locally Denser Sinusoidal Wavy Microchannels. J. Northeast. Electr. Power Univ. 2021, 4, 43–51. [Google Scholar]
  14. Zhang, L.; Li, J.; Xu, X.; Liu, F.; Guo, Y.; Yang, Z.; Hu, T. High spatial granularity residential heating load forecast based on Dendrite net model. Energy 2023, 269, 126787. [Google Scholar] [CrossRef]
  15. Zhang, L.; Hu, T.; Zhang, L.; Yang, Z.; McLoone, S.; Menhas, M.I.; Guo, Y. A novel dynamic opposite learning enhanced Jaya optimization method for high efficiency plate–fin heat exchanger design optimization. Eng. Appl. Artif. Intell. 2023, 119, 105778. [Google Scholar] [CrossRef]
  16. Zhang, H.; Liao, Q.; Fu, Q.; Chen, H.; Huang, Y.; Xia, A.; Zhu, X.; Reungsang, A.; Liu, Z.; Li, J. Rheological properties of microalgae slurry under subcritical conditions for hydrothermal hydrolysis systems. Algal Res. 2018, 33, 78–83. [Google Scholar] [CrossRef]
  17. Fu, Q.; Zhang, H.; Chen, H.; Liao, Q.; Xia, A.; Huang, Y.; Zhu, X.; Reungsang, A.; Liu, Z. Hydrothermal hydrolysis pretreatment of microalgae slurries in a continuous reactor under subcritical conditions for large–scale application. Bioresour. Technol. 2018, 266, 306–314. [Google Scholar] [CrossRef] [PubMed]
  18. Huang, X.; Chen, H.; Ling, X.; Liu, L.; Huhe, T. Investigation of heat and mass transfer and gas–liquid thermodynamic process paths in a humidifier. Energy 2022, 261, 125156. [Google Scholar] [CrossRef]
  19. Shi, X.; Zheng, K.; Yin, B. Numerical method for gas-liquid two-phase flow with phase change heat transfer considering compressibility using OpenFOAM. Int. J. Therm. Sci. 2023, 188, 108195. [Google Scholar] [CrossRef]
  20. Odumosu, O.A.; Xu, H.; Wang, T.; Che, Z. Growth of elongated vapor bubbles during flow boiling heat transfer in wavy microchannels. Appl. Therm. Eng. 2023, 223, 119987. [Google Scholar] [CrossRef]
  21. Mahmoudi, S.; Hemmatian, F.; Dahkaee, K.P.; Hlawitschka, M.W.; Kantzas, A. Detailed study of single bubble behavior and drag correlations in Newtonian and non-Newtonian liquids for the design of bubble columns. Chem. Eng. Res. Des. 2022, 179, 119–129. [Google Scholar] [CrossRef]
  22. Gkotsis, P.K.; Evgenidis, S.P.; Karapantsios, T.D. Influence of Newtonian and non-Newtonian fluid behaviour on void fraction and bubble size for a gas-liquid flow of sub-millimeter bubbles at low void fractions. Exp. Therm. Fluid Sci. 2019, 109, 109912. [Google Scholar] [CrossRef]
  23. Hao, C. Investigation on Flow, Heat Transfer and Hydrothermal Hydrolysis of Microalgae Slurry in a Tubular Reactor; Chongqing University: Chongqing, China, 2020; pp. 45–50. [Google Scholar]
  24. Hong, Z. The Heat Transfer and Hydrothermal Hydrolysis Properties of Microalgae Slurry in a Circular Tube; Chongqing University: Chongqing, China, 2018. [Google Scholar]
Figure 1. Heat collector schematic diagram.
Processes 11 03107 g001
Figure 2. Experimental flow chart (a) and phase change process observation device (b).
Processes 11 03107 g002
Figure 3. (X = 2.2–3.4 m) Microalgae slurry velocity contour diagram.
Processes 11 03107 g003
Figure 4. (X = 2.2–3.4 m) Microalgae slurry phase contour diagram.
Processes 11 03107 g004
Figure 5. Experimental test diagram under wall heat fluxes of 9930 W/m2 (a), 11,100 W/m2 (b), 13,000 W/m2 (c).
Processes 11 03107 g005
Figure 6. (X = 0–4 m) The change curve of the fluid temperature (a) and thermal conductivity (b) before and after phase change under different wall heat fluxes.
Processes 11 03107 g006
Figure 7. (X = 1.6–2.8 m) Microalgae slurry velocity contour diagram.
Processes 11 03107 g007
Figure 8. (X = 1.6–2.8 m) Microalgae slurry phase contour diagram.
Processes 11 03107 g008
Figure 9. Experimental test diagram under flow rates of 0.0139 m/s (a), 0.01725 m/s (b), 0.0207 m/s (c).
Processes 11 03107 g009
Figure 10. (X = 0–3.6 m) The change curve of the fluid temperature (a) and thermal conductivity (b) before and after phase change under different flow rates.
Processes 11 03107 g010
Figure 11. (X = 2.1–3.3 m) Microalgae slurry velocity contour diagram.
Processes 11 03107 g011
Figure 12. (X = 2.1–3.3 m) Microalgae slurry phase contour diagram.
Processes 11 03107 g012
Figure 13. Experimental test diagram under concentrations of 5 wt.% (a), 10 wt.% (b), 15 wt.% (c).
Processes 11 03107 g013
Figure 14. (X = 0–4 m) The change curve of the fluid temperature (a) and thermal conductivity (b) before and after phase change under different concentrations.
Processes 11 03107 g014
Table 1. Grid independence checking.
CaseVolumetric Flowrate
L/h
Heat Flux
W/m2
Inlet Temperature
K
Simulated Outlet Temperature
K
Error
%
16011,100313.15412.110.097
26011,100313.15411.71Baseline
36011,100313.15411.580.032
Table 2. Accuracy of experimental equipment and standard deviation in measurement results.
CaseVolumetric Flowrate
L/h
Experimental Inlet Temperature
K
Thermometer Error
(Inlet Temperature)
K
Experimental Outlet Temperature
K
Experimental
Standard Deviation (Outlet Temperature)
K
150353.15±1377.520.87
260353.15±1365.450.72
Table 3. Comparison of simulation and experimental results.
CaseVolumetric Flowrate
L/h
Heat Flux
W/m2
Inlet Temperature
K
Experimental Outlet Temperature
K
Simulated Outlet Temperature
K
Error
%
15011,100353.15377.52379.980.7
26011,100353.15365.45366.670.3
Disclaimer/Publisher’s Note: The statements, opinions and data contained in all publications are solely those of the individual author(s) and contributor(s) and not of MDPI and/or the editor(s). MDPI and/or the editor(s) disclaim responsibility for any injury to people or property resulting from any ideas, methods, instructions or products referred to in the content.

