Article

Fabrication of Strong Self-Reinforced Polyethylene Terephthalate Composites through the In Situ Nanofibrillation Technology

Multifunctional Composites Manufacturing Laboratory (MCML), Department of Mechanical and Industrial Engineering, University of Toronto, Toronto, ON M5S 3G8, Canada
*
Author to whom correspondence should be addressed.
Processes 2023, 11(5), 1434; https://doi.org/10.3390/pr11051434
Submission received: 10 April 2023 / Revised: 4 May 2023 / Accepted: 8 May 2023 / Published: 9 May 2023

Abstract

:
Fabrication of self-reinforced polyethylene terephthalate (PET) has been achieved through the in situ generation of PET fibrils via a spun bond process. The reinforcement fibrils created from the PET with higher Tm are made from a unique in situ processing method. As a result, the fibrils are well dispersed and distributed in the lower Tm PET matrix. The high degree of molecular similarity affords perfect interfaces between the matrix and dispersed phase, leading to excellent stress transfer from the matrix to the dispersed fibrils. While the extremely large interfaces from the nanofibrillation process can maximize the advantage of the excellent molecular similarity of the self-reinforced polymeric composites, few studies have been conducted to research nanofibrillar self-reinforced polymeric composite systems. Hence, as a proof of concept, this work provides new insight into an approach for developing a self-reinforced polymeric system with a nanofibrillation process. This process increases the tensile strength of PET composites by up to 15% compared to composites made by a simple blending process and 47% higher than neat PET. Furthermore, extensional viscosity measurements show a strain-hardening behavior in the fibrillated PET composites not observed in the neat PET and showed minimal behavior in un-fibrillated PET composites. The foam process results reveal that the presence of PET fibrils in PET improves the expansion ratio as well as the cell density of the PET composites. Specifically, compared to the PET composite foams without the fibrillation process, fibrillated PET composite foams showed up to 3.7 times higher expansion ratios and one to two orders of magnitude higher cell densities. In thermal conductivity measurements, fibrillated PET composite foams achieved thermal conductivity of as low as 0.032 W/mK.

1. Introduction

Due to the high energy consumption in the 21st century, sustainable materials and thermal insulation play important roles in alleviating heat waste by managing and using energy efficiently [1]. The negative environmental impact of the continuously increasing use of plastic and composite materials requires the promotion of new combinations of materials with reduced environmental harm. In this crisis, self-reinforced polymeric composite materials are an alternative approach to conventional heterogeneous polymer composite systems, which limit the further application of the recycling process [2]. Self-reinforced polymeric composite uses the same family of polymers in both the reinforcing and the matrix phases. Unlike conventional composites, self-reinforced composites can be completely remelted when their life as a product ends for recycling into polymer feedstock which can be manufactured for future applications [3]. The advantages of self-reinforced polymeric composite material include in addition to high recyclability, thermoformability, high stiffness, and high tensile strength [4,5,6]. The high degree of molecular similarity in self-reinforced systems allows for excellent interfaces between polymer phases, leading to great stress transfer from the matrix to the dispersed phases.
Since Capiati and Porter [7] initially developed a self-reinforced composite, the concept of a self-reinforced polymer composite gained wide interest along with various polymer materials such as polyethylene (PE) [7,8,9], polypropylene (PP) [10,11,12,13], polylactic acid (PLA) [14,15], and polyethylene terephthalate (PET) [2,16,17]. Various processing methods, such as hot compaction, film stacking, co-extrusion, and melting impregnation, are used for manufacturing self-reinforced polymer composites [4,5]. The major issue with these manufacturing methods is that when melting the matrix polymer during the forming process, the reinforcement fibers tend to be damaged. In order to maximize the benefit of the perfect interfaces of the self-reinforced composites, they need to be heated enough for the interfacial bonding between the reinforcement and the matrix to be formed. However, excessive heating causes the relaxation of fiber orientation, resulting in a decrease in the reinforcement effect of the minor phase. While some studies [8,18,19] successfully controlled a narrow temperature-processing window to fabricate self-reinforced polymeric composites with limited versatility of the processing route, material sets that maximize the melting temperature difference between the matrix and reinforcement phases are desired.
Herein, a commercial low melting temperature PET copolymer was used in order to develop self-reinforced PET composites. In this work, we conducted the nanofibrillation process using two PET resins with widely different melting temperatures to investigate the effect of dispersed phase structure on mechanical and viscoelastic properties, which led to improved foaming and thermal properties [20,21,22]. Numerous studies have shown that the presence of flexible fibrils with a high aspect ratio creates supplemental improvements to the solid and viscoelastic properties of a matrix polymer by forming an entangled physical network structure [23,24,25]. Conventional methods for enhancing foam properties, such as crosslinking [26], introducing long-chain branching [27], and dispersion of inorganic nanoparticles [28,29], may cause loss of recyclability and increase material costs. Self-reinforced nanofibrillation technology, on the other hand, effectively improves the melt strength and strain hardening behavior, which enhances foaming properties without losing recyclability [30]. The result showed that it improves the tensile properties of the solid composites and foaming ability, as well as thermal conductivity. To be specific, the fibrillation process increased the tensile strength of PET composites by up to 15% compared to the composites made with simple blending processes and 47% higher than neat PET. Compared to the PET composite foams without the fibrillation process, fibrillated PET composite foams showed up to 3.7 times higher expansion ratios and one to two orders of magnitude higher cell densities. In thermal conductivity measurements, fibrillated PET composite foams achieved thermal conductivity as low as 0.032 W/mK.

2. Materials and Methods

2.1. Materials

The matrix polymer employed in this study is copolymer PET elastomer (ePET) grade (Hytrel 4056) received from Dupont, Wilmington, Delaware, USA with a melt volume–flow rate (MVR) of 5 cm3/10 min (at 190 °C/2.16 kg). For the reinforcement material, homopolymer PET (hPET) grade (HOT) from Lotte Chemical, Seoul, South Korea with an intrinsic viscosity of 0.78 dL/g was used. The melting points of the PETs were 152.0 °C and 257.7 °C, respectively, as determined with differential scanning calorimetry (DSC). For foaming experiments, carbon dioxide (CO2) was purchased from Messer Group GmbH, Mississauga, Ontario, Canada with more than 99% purity for the physical blowing agents.

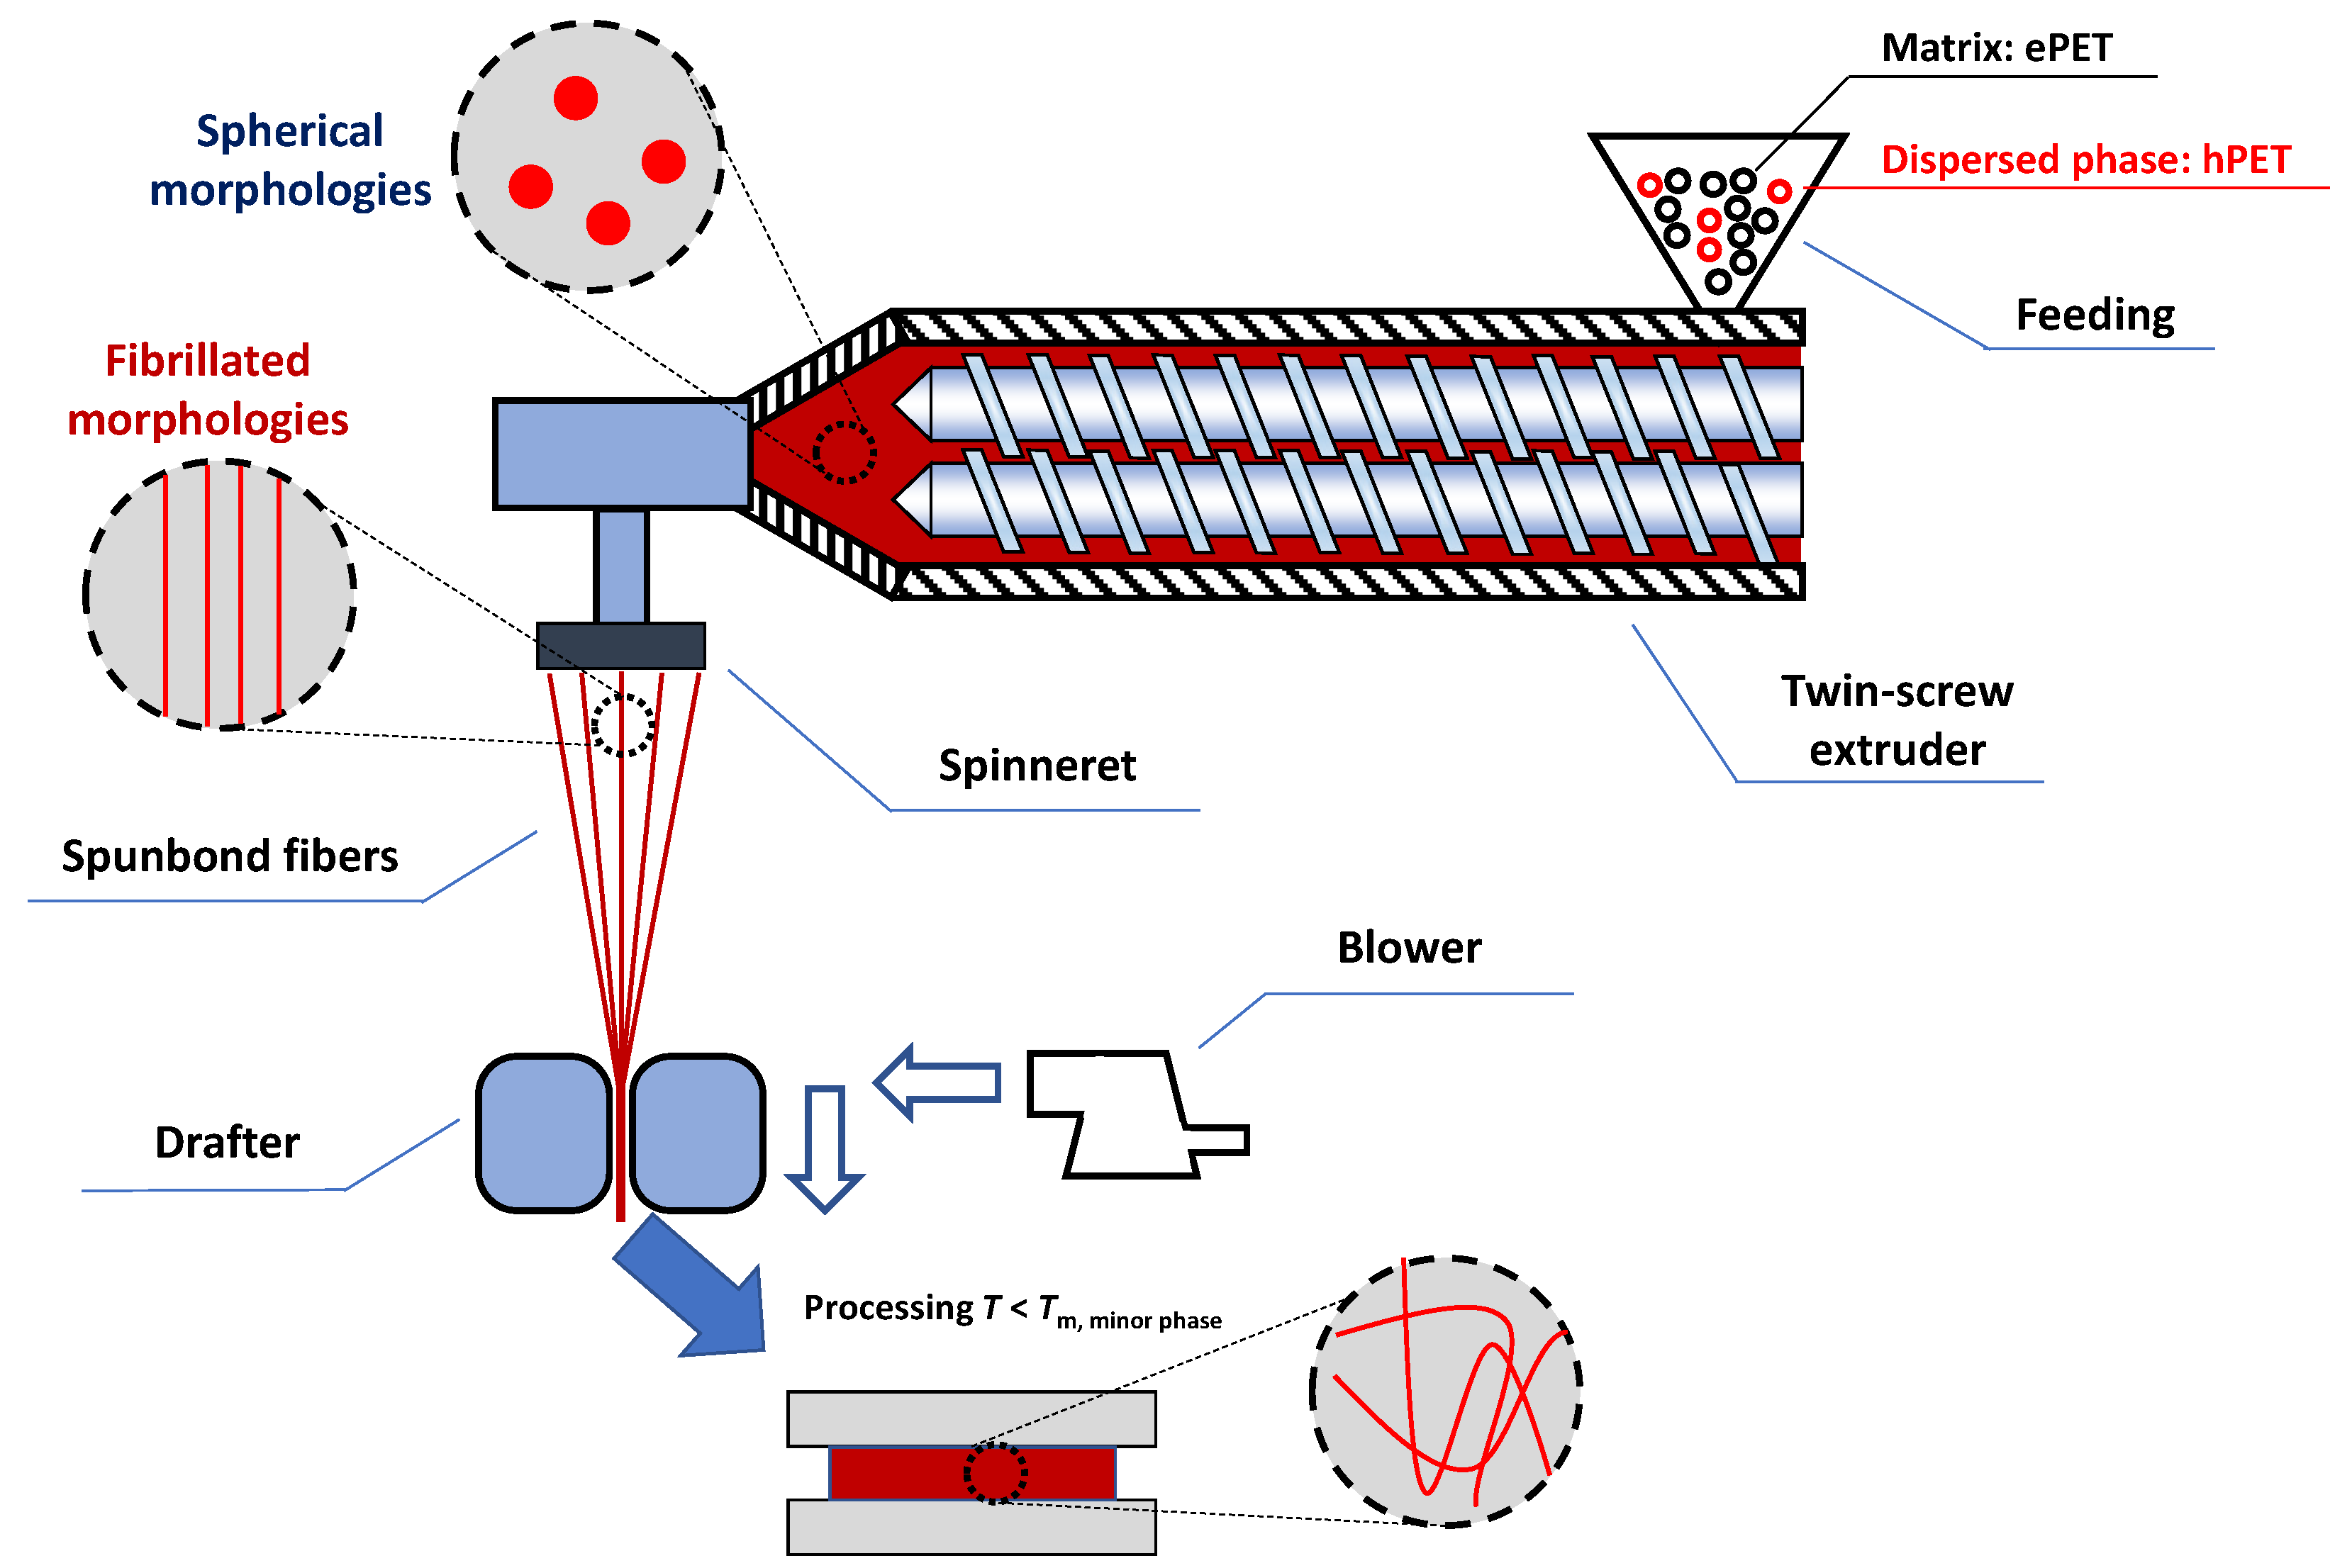
2.2. Polymer Blend Compounding and Spun Bond

The schematic of the spun bond process is shown in Figure 1. This equipment has a 22 mm twin-screw extruder with an L/D ratio of 32. The screw rotation speed was set to 100 rpm, and the airspeed was set to 45 m/s in this study. The throughput rate of the extruder was measured at 14 g/min. The blends that passed through the twin-screw extruder were transferred to a spinneret with 90 holes with a diameter of 600 µm. The blends that passed through the spun bonding spinneret were drawn and fibrillated with an intensive air flow blown through a drafter located 1.5 m below the spinneret [31].
Prior to the process, ePET and hPET were vacuum dried at 70 °C for at least 12 h. Next, dry-mixed PETs with ratios of 100:0 (i.e., neat ePET), 99:1, 97:3, 95:5, and 90:10 were prepared. The hand-mixed PETs were then fed into the hopper of the twin screw extruder. The temperature zone of the twin screw extruder was set at 240–260 °C as the set temperatures gradually increased over the zones. The spinneret temperature was also set at 260 °C. As a result of this spun bonding, the PET blend was drawn into microfibers at a thickness of 30 µm. Samples produced via this procedure will be referred to as F samples (i.e., fibrillated domains of hPET) throughout the manuscript. Non-fibrillated blended samples, as well as the neat ePET samples, were prepared with the same procedure but without the air drawing to have an identical thermal history with the fibrillated samples. The blended samples with no air drawing process will be referred to as S samples (i.e., spherical domains of hPET) throughout the manuscript. The composition and nomenclature of the composites made in this process are elaborated in Table 1.
Differential scanning calorimetry (DSC, TA Instruments DSC 200, New Castle, DE, USA) was performed to analyze the crystalline behaviors of blended/fibrillated samples. Each sample in Table 1 was compression molded at 180 °C for 3 min, then cut to 5–8 mg for DSC analysis. During the heating process, the sample was heated to 180 °C to selectively melt the ePET matrix while maintaining the minor phase. On the subsequent cooling ramp to 30 °C with a cooling speed of 10 °C/min, the nucleation and growth of ePET crystals in the presence of hPET minor phases were observed. The crystallinity (Xc) was calculated as the following equation:
X c = H c W f × H m 0 × 100
where, H c is the enthalpy of crystallization, W f is the weight fraction of ePET in the composites, and H m 0 is the inferred enthalpy value corresponding to the melting of a 100 crystalline sample which was taken as 117.6 J/g [32]. The melt temperature (Tm), crystallization temperature (Tc) and H c measured by DSC and calculated X c of all samples are elaborated in Table 1.
As shown in Figure 2, Tc increased with the fibrillated minor phase ratios. For example, the Tc of ePET was 121.7 °C, but as the amount of the hPET nanofibrils increased to 10 wt%, Tc increased up to 136.2 °C. With the presence of the hPET nanofibrils, the ePET chains were less mobile and formed into crystals earlier compared to the ePET without hPET or with hPET spherical domains. Moreover, the heterogeneous nucleation area formed by the large surface of hPET fibrils resulted in increasing the Tc. It is noted from Table 1 that the presence of hPET nanofibrils contributed to the enhancement of the ePET crystallization due to the heterogenous crystal nucleation effect [33]. Specifically, the crystallinity of ePET increased from 6.91% to 12.55% as the 3 wt% of the fibrillated domains of hPET was added, whereas the same amount of the spherical domains of hPET increased the crystallinity of ePET to 7.83%. However, the crystallinity of ePET decreased when the amount of hPET nanofibrils increased further. This may be because the ePET chain mobility was restricted by hPET nanofibrils [33].

2.3. Tensile Properties Measurement

The Xplore micro injection molder was used to make tensile test specimens (Type V dogbones) according to ASTM D638. The as-spun fibers drawn from the spun bond process were put in the machine barrel and melted for 3 min at a temperature of 175 °C. The barrel with molten blends was placed in the equipment, and the blends were injected by the piston into the pre-heated mold at a temperature of 110 °C with an injection pressure of 0.3 MPA. The pressure was held for 30 s to continue filling the mold during shrinkage while the temperature dropped. The tensile tests were conducted using an Instron Universal Testing System, Norwood, MA, USA (model 5965) with a tensile test fixture at a crosshead speed of 5 mm/min. Tests were conducted 5 times for each sample.

2.4. Rheological Behavior Characterization

Extensional viscosity measurements were performed using an ARES G2 rheometer with a sentmanat extensional rheometer fixture (SER, TA Instruments, New Castle, DE, USA). The samples were tested at strain rates of 0.1 s−1 and an environment temperature of 160 °C. To determine the linear viscoelastic properties, oscillatory shear experiments were conducted using the identical rheometer and the environment temperature, with the parallel plate fixture of 25 mm diameter. Frequency sweeps from 0.1 to 500 rad/s were performed at strains within the linear viscoelastic range.

2.5. Foaming and Characterization

The foaming samples were prepared using a hot press with a size of 3 mm × 3 mm × 10 mm. The foaming experiments were performed on a custom-made batch foaming system at temperatures ranging from 142 to 158 °C. CO2 was used as a physical blowing agent. The chamber was pre-heated to a set temperature, and then the sample was placed in the chamber. Then, the pressurized CO2 from the syringe pump was injected into the chamber until the pressure reached 13.8 MPa. The saturation time for each sample was consistent for 15 min. Then, the pressure was quickly released at the pressure drop rate of 100 MPa/s. The chamber was then quenched with cold water to stabilize the foam structure of the sample.
The expansion ratio (∅) of each foamed sample was calculated from the ratio between the density of the solid sample and that of the foam. A water displacement method based on ASTM D792-00 was used to measure the density of the foam. To determine the cell nucleation density (N), cell morphology, and cell size distribution, microscopy images were analyzed by calculating the number of cells (n) in a certain area (A). The cell nucleation density was calculated as the following:
N = n A 3 2 ×

2.6. Characterization of Thermal Conductivity

A hot disk thermal constants analyzer (TPS 2500 S, Them Test Inc., Holmerskulle, Sweden) was used to measure the thermal conductivity of foamed samples [34]. A sensor of 1.5 mm diameter was used for the measurement. The TPS power output was set to 4 mW with a test time of 4 s. The measurement was conducted 5 times for each condition.

3. Results and Discussion

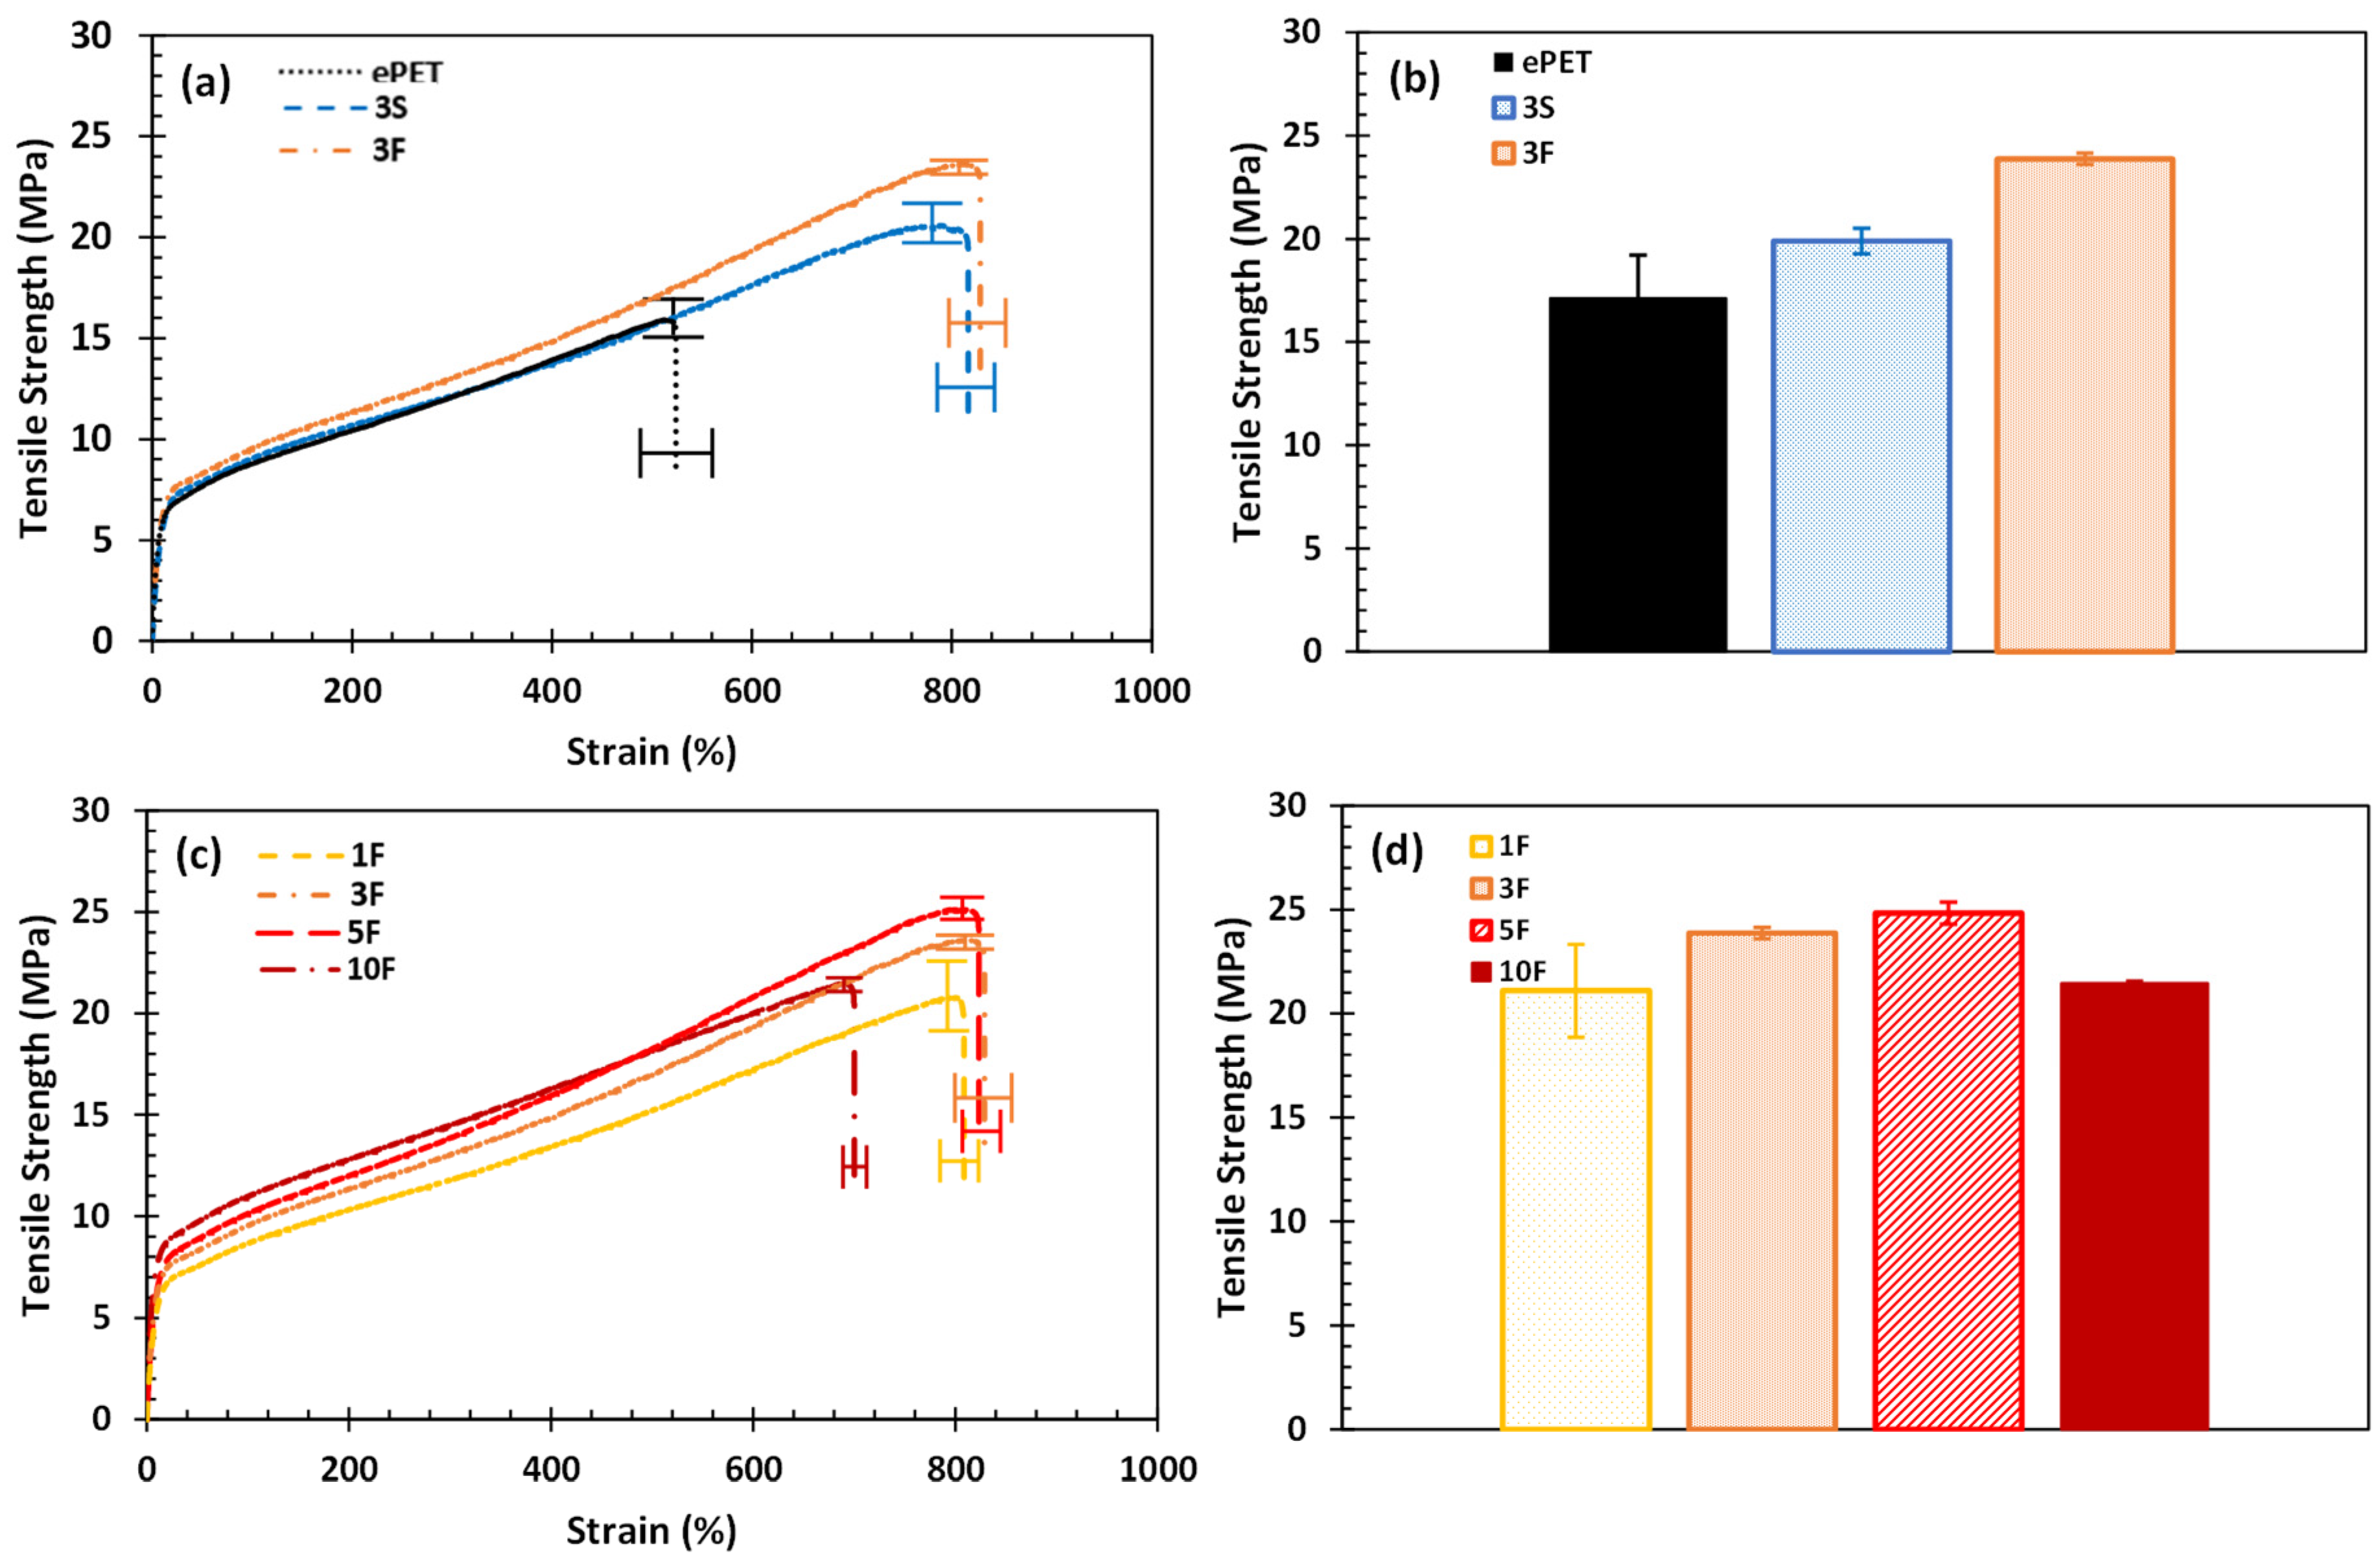
3.1. Tensile Properties of Composites

Figure 3 shows the tensile stress–strain properties of fibrillated, spherical, and ePET samples. Figure 3a plots the tensile stress–strain curves of the ePET, 3S, and 3F. The ePET samples exhibited a strain of 520% with a tensile strength of 16 MPa. In contrast, 3S and 3F showed significant plastic deformation before break, with a strain of 800%. This indicates that the presence of hPET can greatly enhance the tensile ductility of ePET with further plastic deformation before break. Furthermore, fibrillated hPET inside the ePET increased the tensile strength more than spherical hPET [35]. From Figure 3b, it can be found that the 3F exhibited enhanced tensile strength compared to 3S and ePET. Notably, the tensile strength of the 3F is 15% higher than 3S and 47% higher than ePET. In Figure 3c,d, the effect of fibrillated hPET ratios in tensile properties is displayed by exhibiting the stress–strain curves and tensile strengths. Within the studied ratio of 5 wt%, the tensile strength increased with the presence of fibrils with high surface area, improving the stress transfer between the matrix and fibers. This is because dispersed hPET fibrils can effectively reduce stress concentration and avoid crack generation and propagation. Fibrillations in the composites, therefore, improved the ductility and toughness of the samples [36]. At 10 wt%, as in Figure 3c,d, the sample may have been too stiffened, causing a decrease in strain and tensile strength. The tensile test results of S samples are plotted in the supporting document (Figure S1).

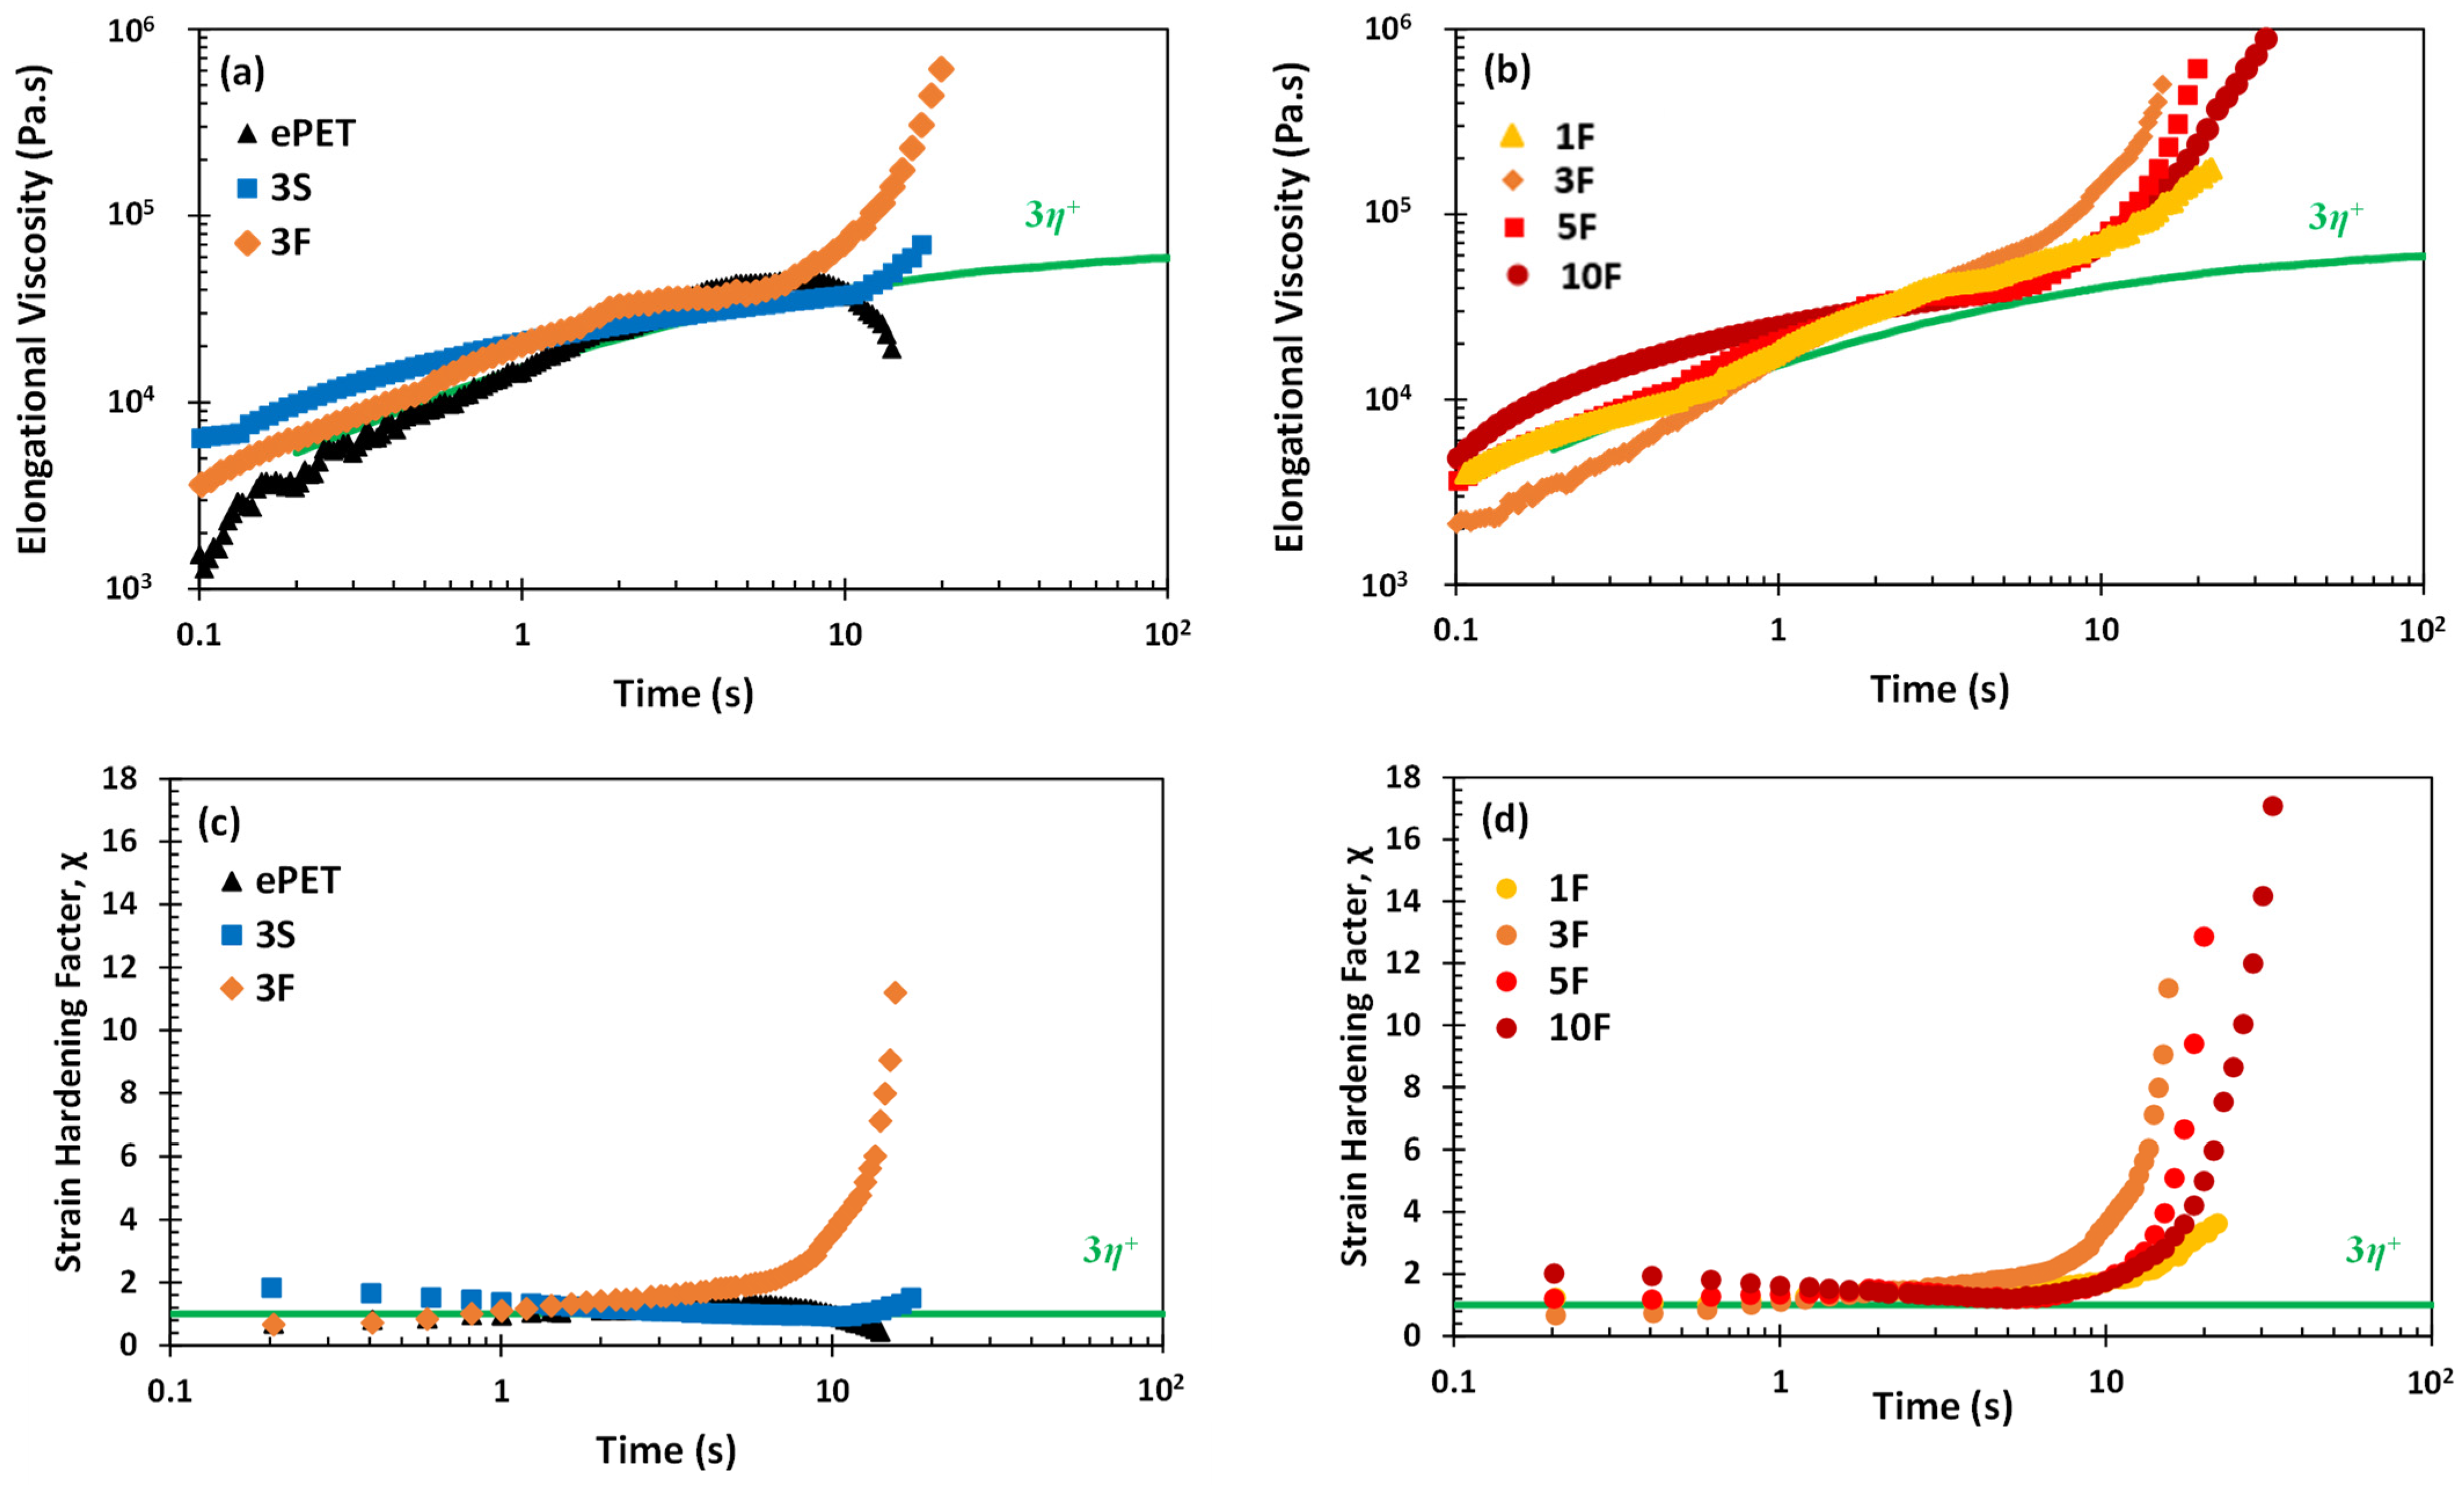
3.2. Rheological Properties of Composites

Figure 4a,b illustrates the extensional viscosity at extensional strain rates of 0.1 s−1 under different minor phase morphologies and fibril ratios, respectively. A measuring temperature of 160 °C was selected so the ePET melts but hPET domains remain in the solid state during the experiments. The extensional flow behavior of ePET showed no strain-hardening behavior, while the S samples showed minimal improvement (Figure S1). In contrast, the F samples exhibited a pronounced strain-hardening behavior increase with the weight ratios of hPET in the extensional viscosity measurements. Moreover, the strain hardening can be tuned by controlling the fibril ratios. The magnitude of strain hardening can be calculated [37,38].
χ = η E + 3 η + ( t )
where χ is the strain-hardening factor of the extensional flow and the 3η+(t) is the 3-fold linear viscoelasticity. The strain-hardening factors of the data in Figure 4a,b were compared in Figure 4c,d. We believe that this divergence of strain-hardening factors occurs due to an entangled network structure formed by hPET fibrils. Under an extensional flow, the network structure of hPET fibrils prevents the matrix from disentangling fast enough to follow the deformation, resulting in strain-hardening behavior [39,40,41]. The physical network may not be sufficiently developed when spherical hPET is in the matrix.
Figure 5a illustrates the storage (G’) and loss (G”) modulus as a function of frequency (ω) for the ePET, 3S, and 3F. ePET exhibits the polymeric melt with liquid-like properties that G” exceeds G’ over the studied frequency range. The 3S shows similar slopes of G’ and G” although the curves are higher. The 3F exhibits different rheological behavior, especially at low ω that G’ reach a plateau value, indicating a transition from liquid-like to gel-like viscoelastic behavior. This resulted from the formation of a network of hPET fibrils in the ePET matrix.
Figure 5b exhibits the G’ vs. G” curves for all fabricated samples. The slopes decrease at low ω as the minor phase ratio increases, and this trend is more pronounced with F samples. This is attributed to the increase in a percolated structure originating from the topological interactions between the hPET fibrils. As the number of fibrils increases, more fibrils form entangled network structures, and more solid-like behavior is exhibited. Spherical hPET domains may not form as much network structure as the fibrillated domains.

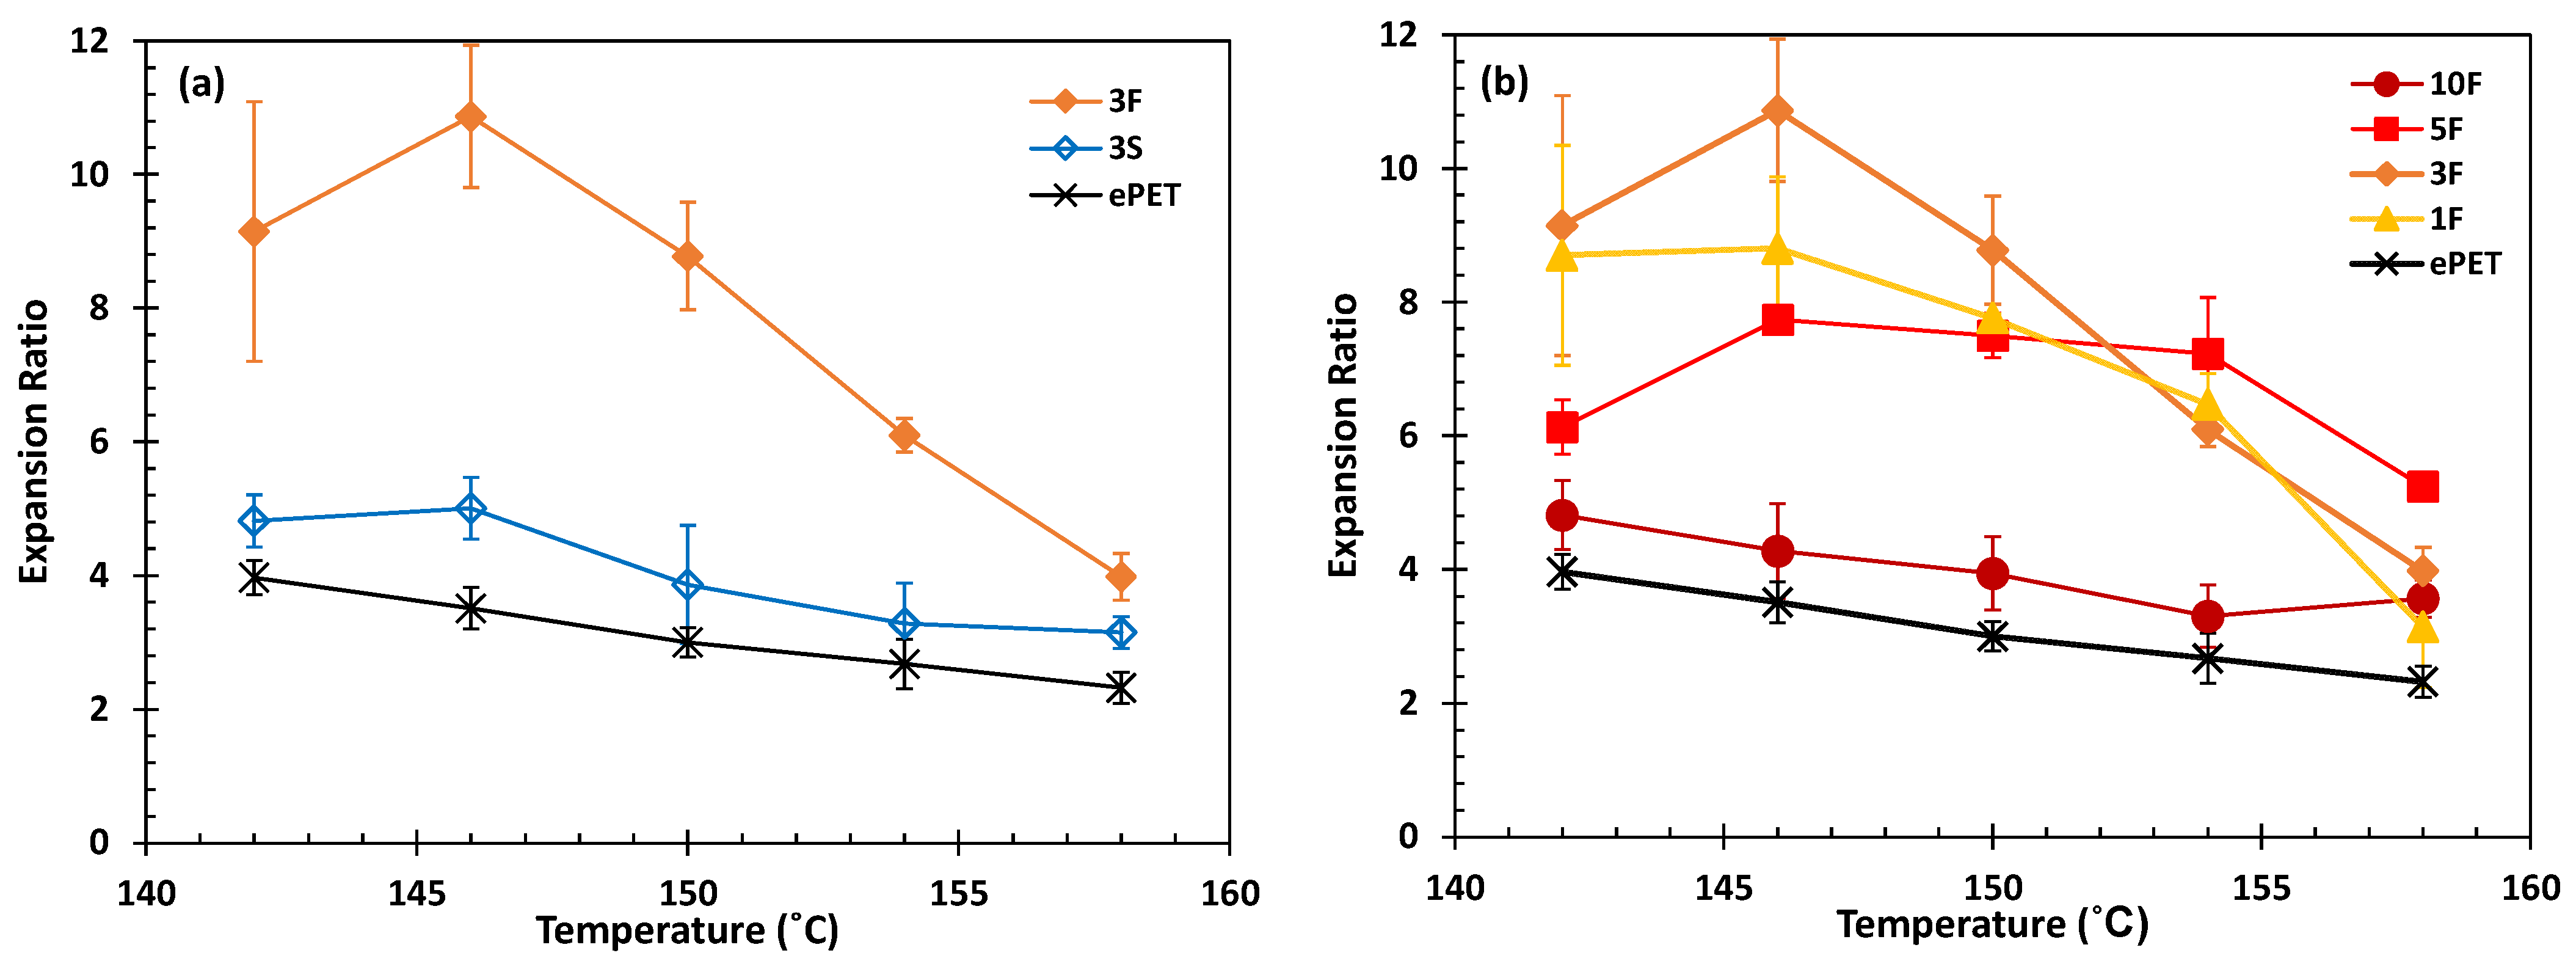
3.3. Foaming and Foam Characterization

Foaming was conducted on the ePET, S, and F samples. In this manuscript, the foams processed using S samples and F samples will be referred to as S foams and F foams, respectively. Figure 6a shows the SEM images of the cell structure of the ePET, 3S, and 3F foamed at 150 °C. To quantify the cell density, the number of bubbles per unit volume and the cell size distribution are analyzed in Figure 6b. It shows that over the studied temperature range, the cell density of ePET and S foams ranged from 105 to 106 cell/cm3, and F foams ranged around 106–107 cell/cm3. The 3F foams showed higher cell densities than the ePET and 3S foams due to the presence of the fibrils of hPET, which offer a large surface-to-volume ratio, making available heterogeneous surfaces [42]. The strain hardening in an extensional flow observed from fibrillated samples also may have influenced the cell density by suppressing the cell deterioration mechanisms. As a result, lower cell size is displayed in Figure 6c.
Figure 7 illustrates the expansion ratio analysis of foamed samples. Figure 7a describes the effect of minor phase morphology by presenting the expansion ratios of ePET, 3S, and 3F foams over various foaming temperatures. Expansion ratios of the rest of the S and F foams are plotted in Figure S2. The maximum expansion ratio increases of 3F Foams compared to 3S foams and ePET foams is attributed to the increase in melt strength exhibited by the fibrils that prevent cell collapse during cell growth. In addition, the flow-induced crystallization of ePET on hPET fibrils in the form of a crystalline layer during cell growth may have contributed. Thus, a larger amount of CO2 is maintained within the matrix, and an expansion ratio increase has occurred [22]. In Figure 7b, the effect of F foam minor phase ratios in foam expansion ratio over the foaming temperature range is investigated. The expansion ratio increased with the ratio of fibrillated phase until it reached 3 wt%, which is the optimum ratio over the studied minor phase ratio. At 5 and 10 wt%, the expansion ratio decreased due to the stiffening effect.

3.4. Thermal Conductivity of Foams

Figure 8a plots the measured thermal conductivities of ePET, 3S, and 3F foam samples. While ePET foams reached the thermal conductivity of 0.067 W/mK, 3S and 3F showed lower thermal conductivities. Remarkably, thermal conductivity as low as 0.032 W/mK was achieved with 3F foam with a process temperature of 146 °C. The lower thermal conductivity of 3F may have come from the enhanced foam properties. Improved melt strength and strain-hardening behavior of F foams exhibited higher expansion ratios compared to S foams as well as ePET, which indicates more air contained in the foam. As the thermal conductivity of air (0.026 W/mK) is lower than that of polymer, the thermal conductivity of foams decreases as the expansion ratio increases.
Among the measured samples, each sample with an expansion ratio of 4 ± 0.2 was selected and analyzed based on the three main heat transfer mechanisms: convection, conduction (gas and solid phase), and radiation [20,21]. Convection can be neglected since the cell size of the foams is below 4 mm and the Rayleigh number is far below the critical value [20]. The thermal radiation portion can be calculated by subtracting the solid and air phase conduction from total thermal conductivity (Figure 8b,c). The thermal radiation amount and ratio in total conductivity decreased in the order of ePET > 3S > 3F. Specifically, the calculated result showed that the ePET foams exhibited a thermal radiation portion is 0.026 W/mK, contributing close to 40% of the total thermal conductivity. On the other hand, the thermal radiation of 3F foams was only 0.005 W/mK, with a 7% contribution to total thermal conductivity. This may be due to the enhanced foaming properties of 3F. A higher cell density generated by fibrils in the matrix creates a more distorted path for radiative thermal transport [43]. Unlike the methods of incorporating inorganic additives to reduce thermal radiation [44,45,46], self-reinforced PET composites with a nanofibrillation process can achieve a great reduction in thermal radiation without lessening the recyclability.
In comparison to previously studied foams reported in the references (Figure 8d) [45,46,47,48,49,50], F foams exhibited relatively low thermal conductivity, although they have lower expansion ratios. Combined with the improved tensile strength of the composites (Figure 3), the nanofibrillar self-reinforced PET composite foams can be applied in many applications where excellent thermal and mechanical properties are required [51].

4. Conclusions

An environmentally friendly strategy based on in situ fibril self-reinforced PET composites was developed to fabricate strong and thermally insulating foams, and fibrillated PET composites were produced using spun bond technology. Fibrillated morphology of hPET in the ePET matrix improved the tensile strength compared to non-fibrillated and neat ePET samples due to dispersed hPET fibrils that can effectively scatter stress propagation. The fibrillated morphology also benefits the strain-hardening behavior, which leads to the improvement of the foam properties. The network structure generated by hPET fibrils increased the melt strength, reducing cell coalescence and retaining a larger amount of CO2 that contributed to more cell nucleation and growth. The improved thermal insulative ability of the in situ fibril self-reinforced PET composites ascribed from the enhanced foam properties exhibited low thermal conductivity due to their strong ability to attenuate thermal radiation.
The developed fabrication represents a scalable, cost-effective, and environmentally friendly method that is also strong, lightweight, and thermally insulating. Hence, nanofibrillated PET composites have potential applications in various industrial sectors that require high mechanical strength and low thermal conductivity, such as construction and civil engineering [51].

Supplementary Materials

The following supporting information can be downloaded at: https://www.mdpi.com/article/10.3390/pr11051434/s1, Figure S1. Tensile properties of the solid samples: (a) tensile stress-strain curve of ePET, 1S, 3S, 5S and 10S; (b) tensile strength of ePET, 1S, 3S, 5S and 10S; Figure S2. The 1F–10F samples fractured during the tensile test; Figure S3. Extensional viscosity of (a) ePET, 1S, 3S, 5S and 10S; (b) ePET,1F, 3F, 5F and 10F; Figure S4. Expansion ratio characterization of the foam samples: Foam volume expansion ratios as a function of the foaming temperatures of (a) ePET and S foams; (b) ePET and F foams; Figure S5. Thermal conductivity results of (a) ePET and S foams; (b) ePET and F foams.

Author Contributions

Conceptualization, E.S.K. and P.C.L.; methodology, E.S.K.; validation, E.S.K. and P.C.L.; formal analysis, E.S.K.; investigation, E.S.K.; resources, P.C.L.; data curation, E.S.K.; writing—original draft preparation, E.S.K.; writing—review and editing, E.S.K. and P.C.L.; visualization, E.S.K.; supervision, P.C.L.; project administration, P.C.L.; funding acquisition, P.C.L. All authors have read and agreed to the published version of the manuscript.

Funding

This research was funded by the Natural Sciences and Engineering Research Council of Canada (NSERC), grant number RGPIN-2019-05778.

Data Availability Statement

The data presented in this study are available in Supplementary Materials.

Conflicts of Interest

The authors declare no conflict of interest.

References

  1. Walther, G.; Post, E.; Convey, P.; Menzel, A.; Parmesan, C.; Beebee, T.J.C.; Fromentin, J.; Hoegh-Guldberg, O.; Bairlein, F. Ecological response to recent climate change. Nature 2002, 416, 389–395. [Google Scholar] [CrossRef] [PubMed]
  2. Chen, J.C.; Wu, C.M.; Pu, F.C.; Chiu, C.H. Fabrication and mechanical properties of self-reinforced poly(ethylene terephthalate) composites. Express Polym. Lett. 2011, 5, 228–237. [Google Scholar] [CrossRef]
  3. Peijs, T. Composites for recyclability. Mater. Today 2003, 6, 30–35. [Google Scholar] [CrossRef]
  4. Matabola, K.P.; De Vries, A.R.; Moolman, F.S.; Luyt, A.S. Single polymer composites: A review. J. Mater. Sci. 2009, 44, 6213–6222. [Google Scholar] [CrossRef]
  5. Kmetty, Á.; Bárány, T.; Karger-Kocsis, J. Self-reinforced polymeric materials: A review. Prog. Polym. Sci. 2010, 35, 1288–1310. [Google Scholar] [CrossRef]
  6. Fakirov, S.; Duhovic, M.; Maitrot, P.; Bhattacharyya, D. From PET nanofibrils to nanofibrillar single-polymer composites. Macromol. Mater. Eng. 2010, 295, 515–518. [Google Scholar] [CrossRef]
  7. Capiati, N.J.; Porter, R.S. The concept of one polymer composites modelled with high density polyethylene. J. Mater. Sci. 1975, 10, 1671–1677. [Google Scholar] [CrossRef]
  8. Hine, P.J.; Ward, I.M.; Jordan, N.D.; Olley, R.H.; Bassett, D.C. A comparison of the hot-compaction behavior of oriented, high-modulus, polyethylene fibers and tapes. J. Macromol. Sci. Part B 2001, 40, 959–989. [Google Scholar] [CrossRef]
  9. Hees, T.; Zhong, F.; Koplin, C.; Jaeger, R.; Mulhaupt, R. Wear resistant all-PE single-component composites via 1D nanostructure formation during melt processing. Polymer 2018, 151, 47–55. [Google Scholar] [CrossRef]
  10. Li, H.; Zhang, X.; Kuang, X.; Wang, J.; Wang, D.; Li, L.; Yan, S. A scanning electron microscopy study on the morphologies of isotactic polypropylene induced by its own fibers. Macromolecules 2004, 37, 2847–2853. [Google Scholar] [CrossRef]
  11. Barany, T.; Karger-Kocsis, J.; Czigany, T. Development and characterization of self-reinforced poly(propylene) composites: Carded mat reinforcement. Polym. Adv. Technol. 2006, 17, 818–824. [Google Scholar] [CrossRef]
  12. Wnag, J.; Song, F.; Ding, Y.; Shao, M. The incorporation of graphene to enhance mechanical properties of polypropylene self-reinforced polymer composites. Mater. Des. 2020, 195, 1090733. [Google Scholar]
  13. Jiang, J.; Liu, X.; Lian, M.; Pan, Y.; Chen, Q.; Liu, H.; Zheng, G.; Guo, Z.; Schubert, D.W.; Shen, C.; et al. Self-reinforcing and toughening isotactic polypropylene via melt sequential injection molding. Polym. Test. 2018, 67, 183–189. [Google Scholar] [CrossRef]
  14. Majola, A.; Vainionpää, S.; Rokkanen, P.; Mikkola, H.M.; Törmälä, P. Absorbable self-reinforced polylactide (SR-PLA) composite rods for fracture fixation: Strength and strength retention in the bone and subcutaneous tissue of rabbits. J. Mater. Sci. Mater. Med. 1992, 3, 43–47. [Google Scholar] [CrossRef]
  15. Törmälä, P. Biodegradable self-reinforced composite materials; Manufacturing structure and mechanical properties. Clin. Mater. 1992, 10, 29–34. [Google Scholar] [CrossRef]
  16. Zhang, J.M.; Reynolds, C.T.; Peijs, T. All-poly(ethylene terephthalate) composites by film stacking of oriented tapes. Compos. Part A Appl. Sci. Manuf. 2009, 40, 1747–1755. [Google Scholar] [CrossRef]
  17. Andrejewski, J.; Przyszczypkowski, P.; Szostak, M. Development and characterization of poly(ethylene terephthalate) based injection molded self-reinforced composites. Direct reinforcement by overmolding the composite inserts. Mater. Des. 2018, 153, 273–286. [Google Scholar] [CrossRef]
  18. Morye, S.S.; Hine, P.J.; Duckett, R.A.; Carr, D.J.; Ward, I.M. Comparison of the properties of hot compacted gel-spun polyethylene fibre composites with conventional gel-spun polyethylene fibre composites. Compos. Part A Appl. Sci. Manuf. 1999, 30, 649–660. [Google Scholar] [CrossRef]
  19. Tohidi, S.D.; Rocha, A.M.; Dencheva, N.V.; Denchev, Z. Single polymer laminate composites by compression molding of knitted textiles and microparticles of polyamide 6: Preparation and structure-properties relationship. Compos. Part A Appl. Sci. Manuf. 2018, 109, 171–183. [Google Scholar] [CrossRef]
  20. Zhang, R.; Kim, E.S.; Romero-Diez, S.; Wang, Y.; Huang, G.; Li, A.; Yang, Y.; Lee, P.C. Cyclic olefin copolymer foam: A promising thermal insulation material. Chem. Eng. J. 2021, 409, 128251. [Google Scholar] [CrossRef]
  21. Zhang, R.; Kim, E.S.; Romero-Diez, S.; Wang, Y.; Huang, G.; Li, K.; Yang, Y.; Lee, P.C. Supercritical fluid foaming of nanoscale phase patterned structures: An approach to lightweight hierarchical porous foams with superior thermal insulation. Chem. Eng. J. 2022, 431, 133490. [Google Scholar] [CrossRef]
  22. Rizvi, A.; Andalib, Z.K.M.; Park, C.B. Fiber-spun polypropylene/polyethylene terephthalate microfibrillar composites with enhanced tensile and rheological properties and foaming ability. Polymer 2017, 110, 139–148. [Google Scholar] [CrossRef]
  23. Evstatiev, M.; Fakirov, S. Microfibrillar reinforcement of polymer blends. Polymer 1992, 33, 877–880. [Google Scholar] [CrossRef]
  24. Hsissou, R.; Bekhta, A.; Dagdag, O.; El Bachiri, A.; Rafik, M.; Elharfi, A. Rheological properties of composite polymers and hybrid nanocomposites. Heliyon 2020, 6, e04187. [Google Scholar] [CrossRef]
  25. Rahman, S.S.; Mahmud, M.B.; Monfared, A.R.; Lee, P.C.; Park, C.B. Achieving outstanding toughness of PMMA while retaining its strength, stiffness, and transparency using in situ developed TPEE nanofibrils. Compos. Sci. Technol. 2023, 236, 109994. [Google Scholar] [CrossRef]
  26. Zhai, W.; Wang, H.; Yu, J.; Dong, J.; He, J. Cell coalescence suppressed by crosslinking structure in polypropylene microcellular foaming. Polym. Eng. Sci. 2008, 48, 1312–1321. [Google Scholar] [CrossRef]
  27. Stange, J.; Munstedt, H. Effect of long-chain branching on the foaming of polypropylene with azodicarbonamide. J. Cell. Plast. 2006, 42, 445–467. [Google Scholar] [CrossRef]
  28. Zhai, W.; Park, C.B. Effect of nanoclay addition on the foaming behavior of linear polypropylene-based soft thermoplastic polyolefin foam blown in continuous extrusion. Polym. Eng. Sci. 2011, 51, 2387–2397. [Google Scholar] [CrossRef]
  29. Guo, G.; Wang, K.H.; Park, C.B.; Kim, Y.S.; Li, G. Effects of nanoparticles on the density reduction and cell morphology of extruded metallocene polyethylene/wood fiber nanocomposites. J. Appl. Polym. Sci. 2007, 104, 1058–1063. [Google Scholar] [CrossRef]
  30. Kim, E.S.; Park, H.E.; Lopez-Barron, C.R.; Lee, P.C. Enhanced foamability with shrinking microfibers in linear polymer. Polymers 2019, 11, 211. [Google Scholar] [CrossRef]
  31. Jalali, A.; Romero-Diez, S.; Nofar, M.; Park, C.B. Entirely environment-friendly polylactide composites with outstanding heat resistance and superior mechanical performance fabricated by spunbond technology: Exploring the role of nanofibrillated stereocomplex polylactide crystals. Int. J. Biol. Macromol. 2021, 193, 2210–2220. [Google Scholar] [CrossRef] [PubMed]
  32. Chung, J.W.; Son, S.; Chun, S.; Kang, T.J.; Kwak, S. Nonisothermal Crystallization Behavior of Exfoliated Poly (ethylene terephthalate) -Layered Silicate Nanocomposites in the Presence and Absence of Organic Modifier. J. Polym. Sci. 2008, 46, 989–999. [Google Scholar] [CrossRef]
  33. Li, P.; Lan, B.; Zhang, Q.; Yang, Q.; Gong, P.; Park, C.B. Microcellular foams simultaneous reinforcing and toughening strategy of combining nano-fibrillation network and supercritical solid-state foaming. Polymer 2022, 252, 124928. [Google Scholar] [CrossRef]
  34. Almanza, O.; Rodríguez-Pérez, M.A.; De Saja, J.A. Applicability of the transient plane source method to measure the thermal conductivity of low-density polyethylene foams. J. Polym. Sci. Part B Polym. Phys. 2004, 2, 1226–1234. [Google Scholar] [CrossRef]
  35. He, Y.; Jia, S.; Fang, C.; Tan, L.; Qin, S.; Yin, X.; Park, C.B.; Qu, J. Constructing synergistically strengthening-toughening 3D network bundle structures by stereocomplex crystals for manufacturing high-performance thermoplastic polyurethane nanofibers reinforced poly(lactic acid) composites. Compos. Sci. Technol. 2023, 232, 109847. [Google Scholar] [CrossRef]
  36. Zeidi, M.; Kim, C.I.; Park, C.B. The role of interface on the toughening and failure mechanisms of thermoplastic nanocomposites reinforced with nanofibrillated rubber. Nanoscale 2021, 13, 20248–20280. [Google Scholar] [CrossRef]
  37. Embabi, M.; Kweon, M.S.; Anstey, A.; Tuccito, A.V.; Park, C.B.; Shivokhin, M.E.; Lee, P.C. Effect of Ethylene Comonomer Content on the Foam Processing Window of Long-Chain Branched Polypropylene. ACS Appl. Polym. Mater. 2023, 5, 2417–2429. [Google Scholar] [CrossRef]
  38. Embabi, M.; Kweon, M.S.; Wang, Y.X.; Lin, T.P.; Lopez-Barron, C.R.; Lee, P.C. Foaming Performance of Linear Polypropylene Ionomers. Macromolecules 2022, 55, 5645–5655. [Google Scholar] [CrossRef]
  39. Hong, J.S.; Ahn, K.H.; Lee, S.J. Strain hardening behavior of polymer blends with fibril morphology. Rheol. Acta 2005, 45, 202–208. [Google Scholar] [CrossRef]
  40. Wagner, M.H.; Yamaguchi, M.; Takahashi, M. Quantitative assessment of strain hardening of low-density polyethylene melts by the molecular stress function model. J. Rheol. 2003, 47, 779–793. [Google Scholar] [CrossRef]
  41. Masubuchi, Y.; Ianniruberto, G.; Greco, F.; Marrucci, G. Primitive chain network simulations for branched polymers. Rheol. Acta 2006, 46, 297–303. [Google Scholar] [CrossRef]
  42. Leung, S.N.; Wong, A.; Park, C.B.; Zong, J.H. Ideal surface geometries of nucleating agents to enhance cell nucleation in polymeric foaming processes. J. Appl. Polym. Sci. 2008, 108, 3997–4003. [Google Scholar] [CrossRef]
  43. Anstey, A.; Chang, E.; Kim, E.S.; Rizvi, A.; Kakroodi, A.R.; Park, C.B.; Lee, P.C. Nanofibrillated polymer systems: Design, application, and current state of the art. Prog. Polym. Sci. 2021, 113, 101346. [Google Scholar] [CrossRef]
  44. Guo, Y.; Lyu, Z.; Yang, X.; Lu, Y.; Ruan, K.; Wu, Y.; Kong, J.; Gu, J. Enhanced thermal conductivities and decreased thermal resistances of functionalized boron nitride/polyimide composites. Compos. Part B Eng. 2019, 164, 732–739. [Google Scholar] [CrossRef]
  45. Kuhn, J.; Ebert, H.P.; Arduini-Schuster, M.C.; Büttner, D.; Fricke, J. Thermal transport in polystyrene and polyurethane foam insulations. Int. J. Heat Mass Transf. 1992, 35, 1795–1801. [Google Scholar] [CrossRef]
  46. Gong, P.; Wang, G.; Tran, M.; Buahom, P.; Zhai, S.; Li, G.; Park, C.B. Advanced bimodal polystyrene/multi-walled carbon nanotube nanocomposite foams for thermal insulation. Carbon 2017, 120, 1–10. [Google Scholar] [CrossRef]
  47. Zhao, J.; Zhao, Q.; Wang, C.; Guo, B.; Park, C.B.; Wang, G. High thermal insulation and compressive strength polypropylene foams fabricated by high-pressure foam injection molding and mold opening of nano-fibrillar composites. Mater. Des. 2017, 131, 1–11. [Google Scholar] [CrossRef]
  48. Forest, C.; Chaumont, P.; Cassagnau, P.; Swoboda, B.; Sonntag, P. Polymer nano-foams for insulating applications prepared from CO2 foaming. Prog. Polym. Sci. 2015, 41, 122–145. [Google Scholar] [CrossRef]
  49. Erukhimovich, I.; de la Cruz, M.O. Phase equilibrium and charge fractionation in polyelectrolyte solutions. J. Polym. Sci. Part B Polym Phys. 2007, 45, 3003–3009. [Google Scholar] [CrossRef]
  50. Li, Y.; Zhang, Z.; Wang, W.; Gong, P.; Yang, Q.; Park, C.B.; Li, G. Ultra-fast degradable PBAT/PBS foams of high performance in compression and thermal insulation made from environment-friendly supercritical foaming. J. Supercrit. Fluids 2022, 181, 105512. [Google Scholar] [CrossRef]
  51. Hasanadeh, R.; Azdast, T.; Lee, P.C.; Park, C.B. A review of the state-of-the-art on thermal insulation performance of polymeric foams. Therm. Sci. Eng. Prog. 2023, 41, 101808. [Google Scholar] [CrossRef]
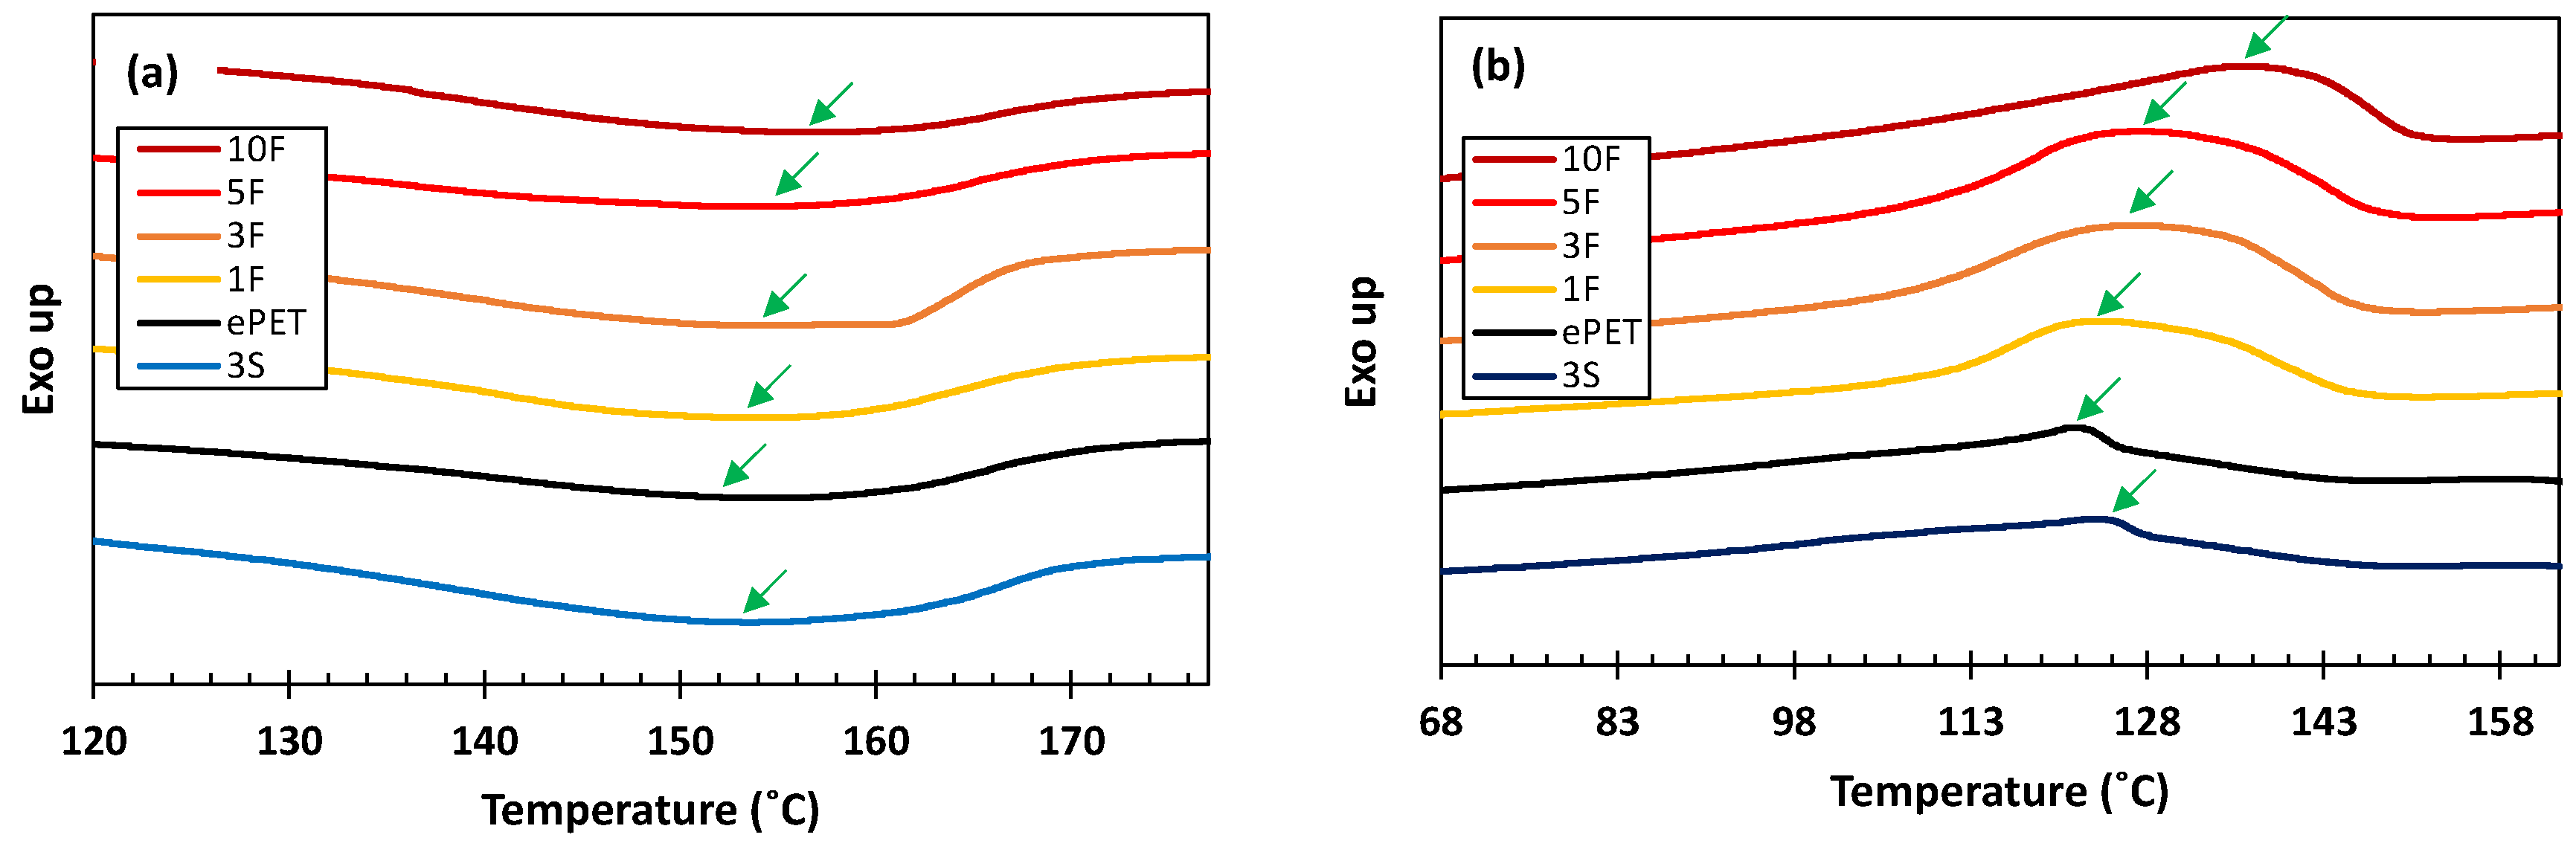
Figure 1. Schematic of the spun bond machine used in this study and post-process (hot compression). All post-process were conducted under temperatures that do not affect the morphology of hPET in the matrix.
Processes 11 01434 g001
Figure 2. (a) The heating curves and (b) the cooling curves of DSC thermograms of the PET composites after spun bonding. The green arrows indicate the locations of melt and crystallization temperatures.
Processes 11 01434 g002
Figure 3. Tensile properties of the solid samples: (a) tensile stress–strain curve of ePET, 3S, and 3F; (b) tensile strength of ePET, 3S, and 3F; (c) tensile stress–strain curve of 1F, 3F, 5F, and 10F; (d) tensile strength of 1F, 3F, 5F, and 10F.
Processes 11 01434 g003
Figure 4. Extensional viscosity of (a) ePET, 3S, and 3F; (b) 1F, 3F, 5F, and 10F. The solid lines represent the 3η+(t) where η+(t) is the growth curve of shear viscosity in the linear region. Strain-hardening factor χ of (c) ePET, 3S, and 3F; (d) 1F, 3F, 5F, and 10F.
Processes 11 01434 g004
Figure 5. (a) Frequency dependence of the storage (G’) and loss (G”) modulus for ePET, 3S, and 3F samples at 160 °C; (b) Han Plots (G’ vs. G”) for all samples.
Processes 11 01434 g005
Figure 6. Characterization of the foam morphologies of foamed ePET, S, and F foams; (a) SEM micrographs of the ePET, 3S, and 3F foams at foaming temperature of 150 °C; (b) cell density as a function of the foaming temperatures; (c) cell size distribution for the foams generated at 150 °C.
Processes 11 01434 g006
Figure 7. Expansion ratio characterization of the foam samples: Foam volume expansion ratios as a function of the foaming temperatures of (a) ePET, 3S, 3F; (b) Foam volume expansion ratios as a function of the foaming temperatures of ePET, 1F, 3F, 5F, and 10F.
Processes 11 01434 g007
Figure 8. (a) The thermal conductivity results of ePET, 3S, and 3F foams; (b) Thermal conductivity of ePET, 3S, and 3F with a fixed expansion ratio of 4; (c) The calculated thermal radiation selected foams and their contribution to total thermal conductivity; (d) The thermal conductivity of PET foams in this work and other reported thermal conductivities in the literature [32,33,34,35,36,37].
Processes 11 01434 g008
Table 1. Composition, nomenclature, and crystalline kinetic parameters of ePET-hPET blends.
Sample NameMorphology of Minor PhaseMatrix
ePET Content (wt%)
Minor Phase
hPET Content (wt%)
Tm (°C)Tc (°C) H c (J/g) X c (%)
ePET 1000152.0121.78.126.91
1SSpherical991152.8122.78.547.34
3S 973153.6123.58.937.83
5S 955154.1124.19.118.15
10S 9010154.4124.69.258.74
1FFibrillated991153.9124.112.7010.91
3F 973154.4126.614.3212.55
5F 955154.9127.013.4612.05
10F 9010156.8136.210.7910.19
Disclaimer/Publisher’s Note: The statements, opinions and data contained in all publications are solely those of the individual author(s) and contributor(s) and not of MDPI and/or the editor(s). MDPI and/or the editor(s) disclaim responsibility for any injury to people or property resulting from any ideas, methods, instructions or products referred to in the content.

