1. Introduction
Energy is the driving factor for the development of society because it is essential for food production, water distribution, transportation of people and commodities, industrial and commercial activities, construction and maintenance of infrastructure, and, last but not least, heating and cooling of buildings [
1]. The vast majority of these activities are conducted in or around cities. Therefore, the concentration of activities at specific places helps interaction and pushes gross domestic production (GDP). On average, 75% of a country’s GDP is generated in cities—a fact that requires a continuous flow of energy. Quantitatively speaking, cities consume approximately 75% of global primary energy and contribute from 50 to 60% of global greenhouse gas emissions (GHG). This percentage reaches 80% if city dwellers are indirect [
1]. Therefore, it is important to identify the sources of consumption and emissions.
The 2021 International Energy Agency (IEA) report on buildings highlights that their energy use increased from 115 EJ in 2010 to 135 EJ in 2021 [
2]. The latter corresponds to 30% of global final energy consumption. This means that the operation of buildings accounts for 30% of the global final energy consumption, which becomes approximately 34% if the production of cement, steel, and aluminium is included. In terms of emissions, the building sector is responsible for approximately one-third of global emissions of energy- and process-related carbon dioxide (CO
2):
8% from the use of fossil fuels in buildings;
19% from the generation of electricity and heat used in buildings;
6% of the manufacture of cement, steel and aluminium used for building construction.
Therefore, the buildings sector certainly needs emission restrictions throughout its entire value chain, especially in view of reaching the IEA net zero emission scenario by 2030 [
2], which assumes that energy consumption in buildings, compared to today, drops by 25% while fossil fuel use decreases by more than 40%, along with a complete phase out of traditional polluting use of biomass.
Focussing on residential direct and indirect emissions, in 2021, they were 2.1 Gt CO2 and 4.0 Gt CO2, respectively, but in the IEA net zero energy scenario, they must become 1.4 Gt CO2 and 1.3 Gt CO2 by 2030. This level of emissions cut clearly indicates the need for energy efficiency interventions aimed at introducing in residential buildings not only high-efficiency technologies, but also optimised control and maintenance strategies capable of minimising consumption and guaranteeing the best performance throughout the operating range. In this context, the installation of a monitoring system capable, on the one hand, of controlling the performance of the building’s heating and cooling system and, on the other hand, of acquiring, storing, and processing data to highlight operating anomalies, malfunctions, performance decay, and failures, as well as user behaviour, plays a crucial role not only for the transition towards full-electric buildings but also in view of building renewable energy communities (RECs). In RECs, the installation of a monitoring system can help (i) the autonomous management of cost-effective green energy production and consumption, (ii) the reduction of energy waste, and (iii) the cut of CO2 emissions.
Despite the benefits noted above, the residential sector continues to neglect the role of monitoring systems not only in the renovation of old buildings, but also in the new ones due to the scarce propensity of the owners to invest in complementary technology whose added economic value is not directly perceived. In other words, building owners believe that the monitoring system is characterised by high implementation, installation, and maintenance costs because it makes the system more complex by adding sensors and devices that are not strictly necessary for the functioning of the system but that are subject to malfunctions and failure. However, they overlook the fact that the installation and maintenance costs of the monitoring system are really modest, especially in comparison to the installation costs of a new/renovated centralised heating and cooling system. Furthermore, they also underestimate the benefits guaranteed by the monitoring system in terms of energy savings and cost reduction, especially related to malfunctions, performance degradation, and failures.
The mistrust of building owners with respect to monitoring systems may be related to the lack of studies published in the scientific literature that deal with monitoring systems. In fact, since 1975, researchers have worked on heat pumps (HPs), but have mainly focused on their modelling with the aim of predicting transient behaviour. For example, Chi and Didion [
3] were among the first to build a transient heat pump model. The heat pump components were modelled in lumped parametric form, and first-order differential equations were adopted to describe single- and two-phase heat, mass, and momentum transfer. The dynamic responses of electric motors, compressors, shafts, electric fans, air/refrigerant heat exchangers, accumulators, and thermostatic expansion valves were simulated building subroutines capable of linking the components. MacArthur [
4] also studied the transient behaviour of the heat pump using detailed mathematical models of the condenser, evaporator, accumulator, expansion device, and compressor to better predict the performance of the heat pump. Unlike others, James et al. [
5] worked to understand the state-of-the-art in dynamic mathematical models of refrigeration systems and heat pumps by reviewing the available literature. Even Welsby et al. [
6,
7] first reviewed the literature to highlight the lack of knowledge on the topic. They then built a mathematical model capable of simulating both the steady and the dynamic behaviour of an existing water-to-water electric motor driven heat pump. They were among the first to model the condenser and the evaporator, splitting the area into two sections to take into account subcooling and superheating.
Even in recent years, researchers’ attention remained focused on the heat pump itself. The vast majority of the published work continues to deal with heat pump component modelling or heat pump performance predictions instead of monitoring the entire system in which the machine is installed.
For example, Schiffmann and Favrat [
8] identified the compressor as the critical component of the heat pump. With the aim of improving the overall performance of the heat pump, they worked on the design, optimisation, and experimental testing of a small-scale radial compressor. Byrne et al. [
9] also analysed the compressor by presenting an innovative model of the scroll compressor to better predict its performance. Adhikari et al. [
10] evaluated the energy savings that can be achieved in a heat pump using a variable speed compressor, and Choi et al. [
11] extended the investigation by analysing the effects of compressor frequency and heat exchanger geometry on the dynamic performance of the heat pump. Aguilera et al. [
12] and Barandier [
13] summarised the available work investigating common faults and their diagnostics in heat pumps, and Kinab et al. [
14], Lee et al. [
15], and Ishaque et al. [
16] analysed the seasonal performance of the heat pump in view of identifying factors that can be used to redesign the machine not in full load condition but based on improved seasonal performance.
Ruhnau et al. [
17] used some measurements acquired in real operating conditions to define the correction factor that allows a more precise prediction of the performance of heat pumps while Caird et al. [
18], Le et al. [
19], and Stark et al. [
20]—to note only a few examples—carried out experimental measurement campaigns to assess the performance of heat pumps in residential houses. Other researchers studied factors that affect the performance of the heating and cooling system, identifying installation and control problems [
21], the user load profile [
22], or the system configurations [
23,
24]. There is also work devoted to modelling and optimising the size, performance, and management of complex systems in which heat pumps, thermal and electrical energy storage, fossil and renewable-based boilers, PV, wind, etc., are installed (see, e.g., Refs. [
25,
26,
27]).
Pean et al. [
28] used data acquired by the building supervisory controller to improve the energy flexibility of the heat pump, whereas Byrne [
29], starting from the real data of the heat pump, developed a mathematical model capable of simulated machine behaviour when providing heating and cooling simultaneously. Therefore, the scientific literature has approached the demand for heating and cooling in the residential sector, focussing mainly on technological aspects, presenting the monitoring system more as a tool for research purposes than as a complementary technology useful for providing benefits to the management of buildings in a real operating environment [
30,
31]. In fact, there are buildings equipped with sensors connected to monitoring systems, but they are installed for research purposes: acquiring experimental data in a real operating environment for calibrating models and/or evaluating the performance of buildings’ envelope and heating and cooling machines.
Only a few investigations have focused, directly or indirectly, on the hydraulic heating and cooling circuit monitoring system (instead of the internal comfort of the building or the envelope of the building) as a powerful technology for deriving useful information. For example, Huchtemann and Müller [
24] highlighted some sensor issues related to the monitoring of buildings. In particular, only 43 out of the 77 monitored houses have produced accurate data to perform analysis on the system performance. In Ref. [
32], Tagliafico et al. indirectly highlighted some benefits of monitoring the heating/cooling system by extracting information on the status and performance of the system. In particular, the acquired data allowed them to demonstrate the non-optimised management and maintenance of the heating system, resulting in lack of performance and in several system stops, respectively.
Based on the lack highlighted by the literature review and with the goal of providing a novel contribution to the field, this work aims to prove the benefits derived from the installation of a monitoring system of the hydraulic heating and cooling circuit in a real operating environment in terms of:
Real-time diagnosis of malfunctions, anomalies, performance reductions, and failures with a consequent fast response in planning maintenance activities aimed at limiting the risk of more severe failures and then unexpected extra costs or long plant unavailability;
Development of control strategies tailored to the building and user needs, potentially taking into account not only the technical aspects, but also the economical ones;
The possibility of giving priority to planned or unplanned maintenance activities depending on techno-economic drivers; for example, on the basis of the monitored performance decays;
A demonstration that the installation of a monitoring system is a plus for building owners, especially in the case of a residential buildings with centralised hybrid heating and cooling plants.
This analysis is the first step of a wider research project carried out in collaboration with ENEA (the Italian National Agency for New Technologies, Energy and Sustainable Economic Development) and devoted to assess the key role played by the monitoring systems to: (i) raise people’s awareness on centralised thermal production units, (ii) demonstrate that inhabitants of buildings with centralised units can check and control their consumption more efficiently than in the case of having their own systems, (iii) show building inhabitants that the monitoring system of the centralised unit can automatically activate the technical support in case of malfunctions or planned maintenance of their units, avoiding the need of calls, (iv) cut buildings inhabitants’ costs for failure and maintenance of their own system, (v) detect fluid leakage in real time, (vi) develop autonomous tools able to detect and manage failure and maintenance events in real time without requiring operators on the plant, and (vii) allow remote supervision and, then, avoid the need of going to the plant to understand the nature of the issue. Note that these aspects are also essential to implement the concept of an energy community in the near future [
33,
34,
35,
36].
The rest of the work is organised as follows.
Section 2 briefly presents the case study and the layout of the monitoring systems. In
Section 3, the data acquired by the monitoring system are reported, analysed, and discussed to derive useful information regarding the behaviour of the heating and cooling system. Finally,
Section 4 presents the concluding remarks.
2. The Case Study
The selected case study is a residential building located in northern Italy (Verona city, Veneto region). The climate zone is E as prescribed by Presidential Decree No. 412 of 26 August 1993 [
37].
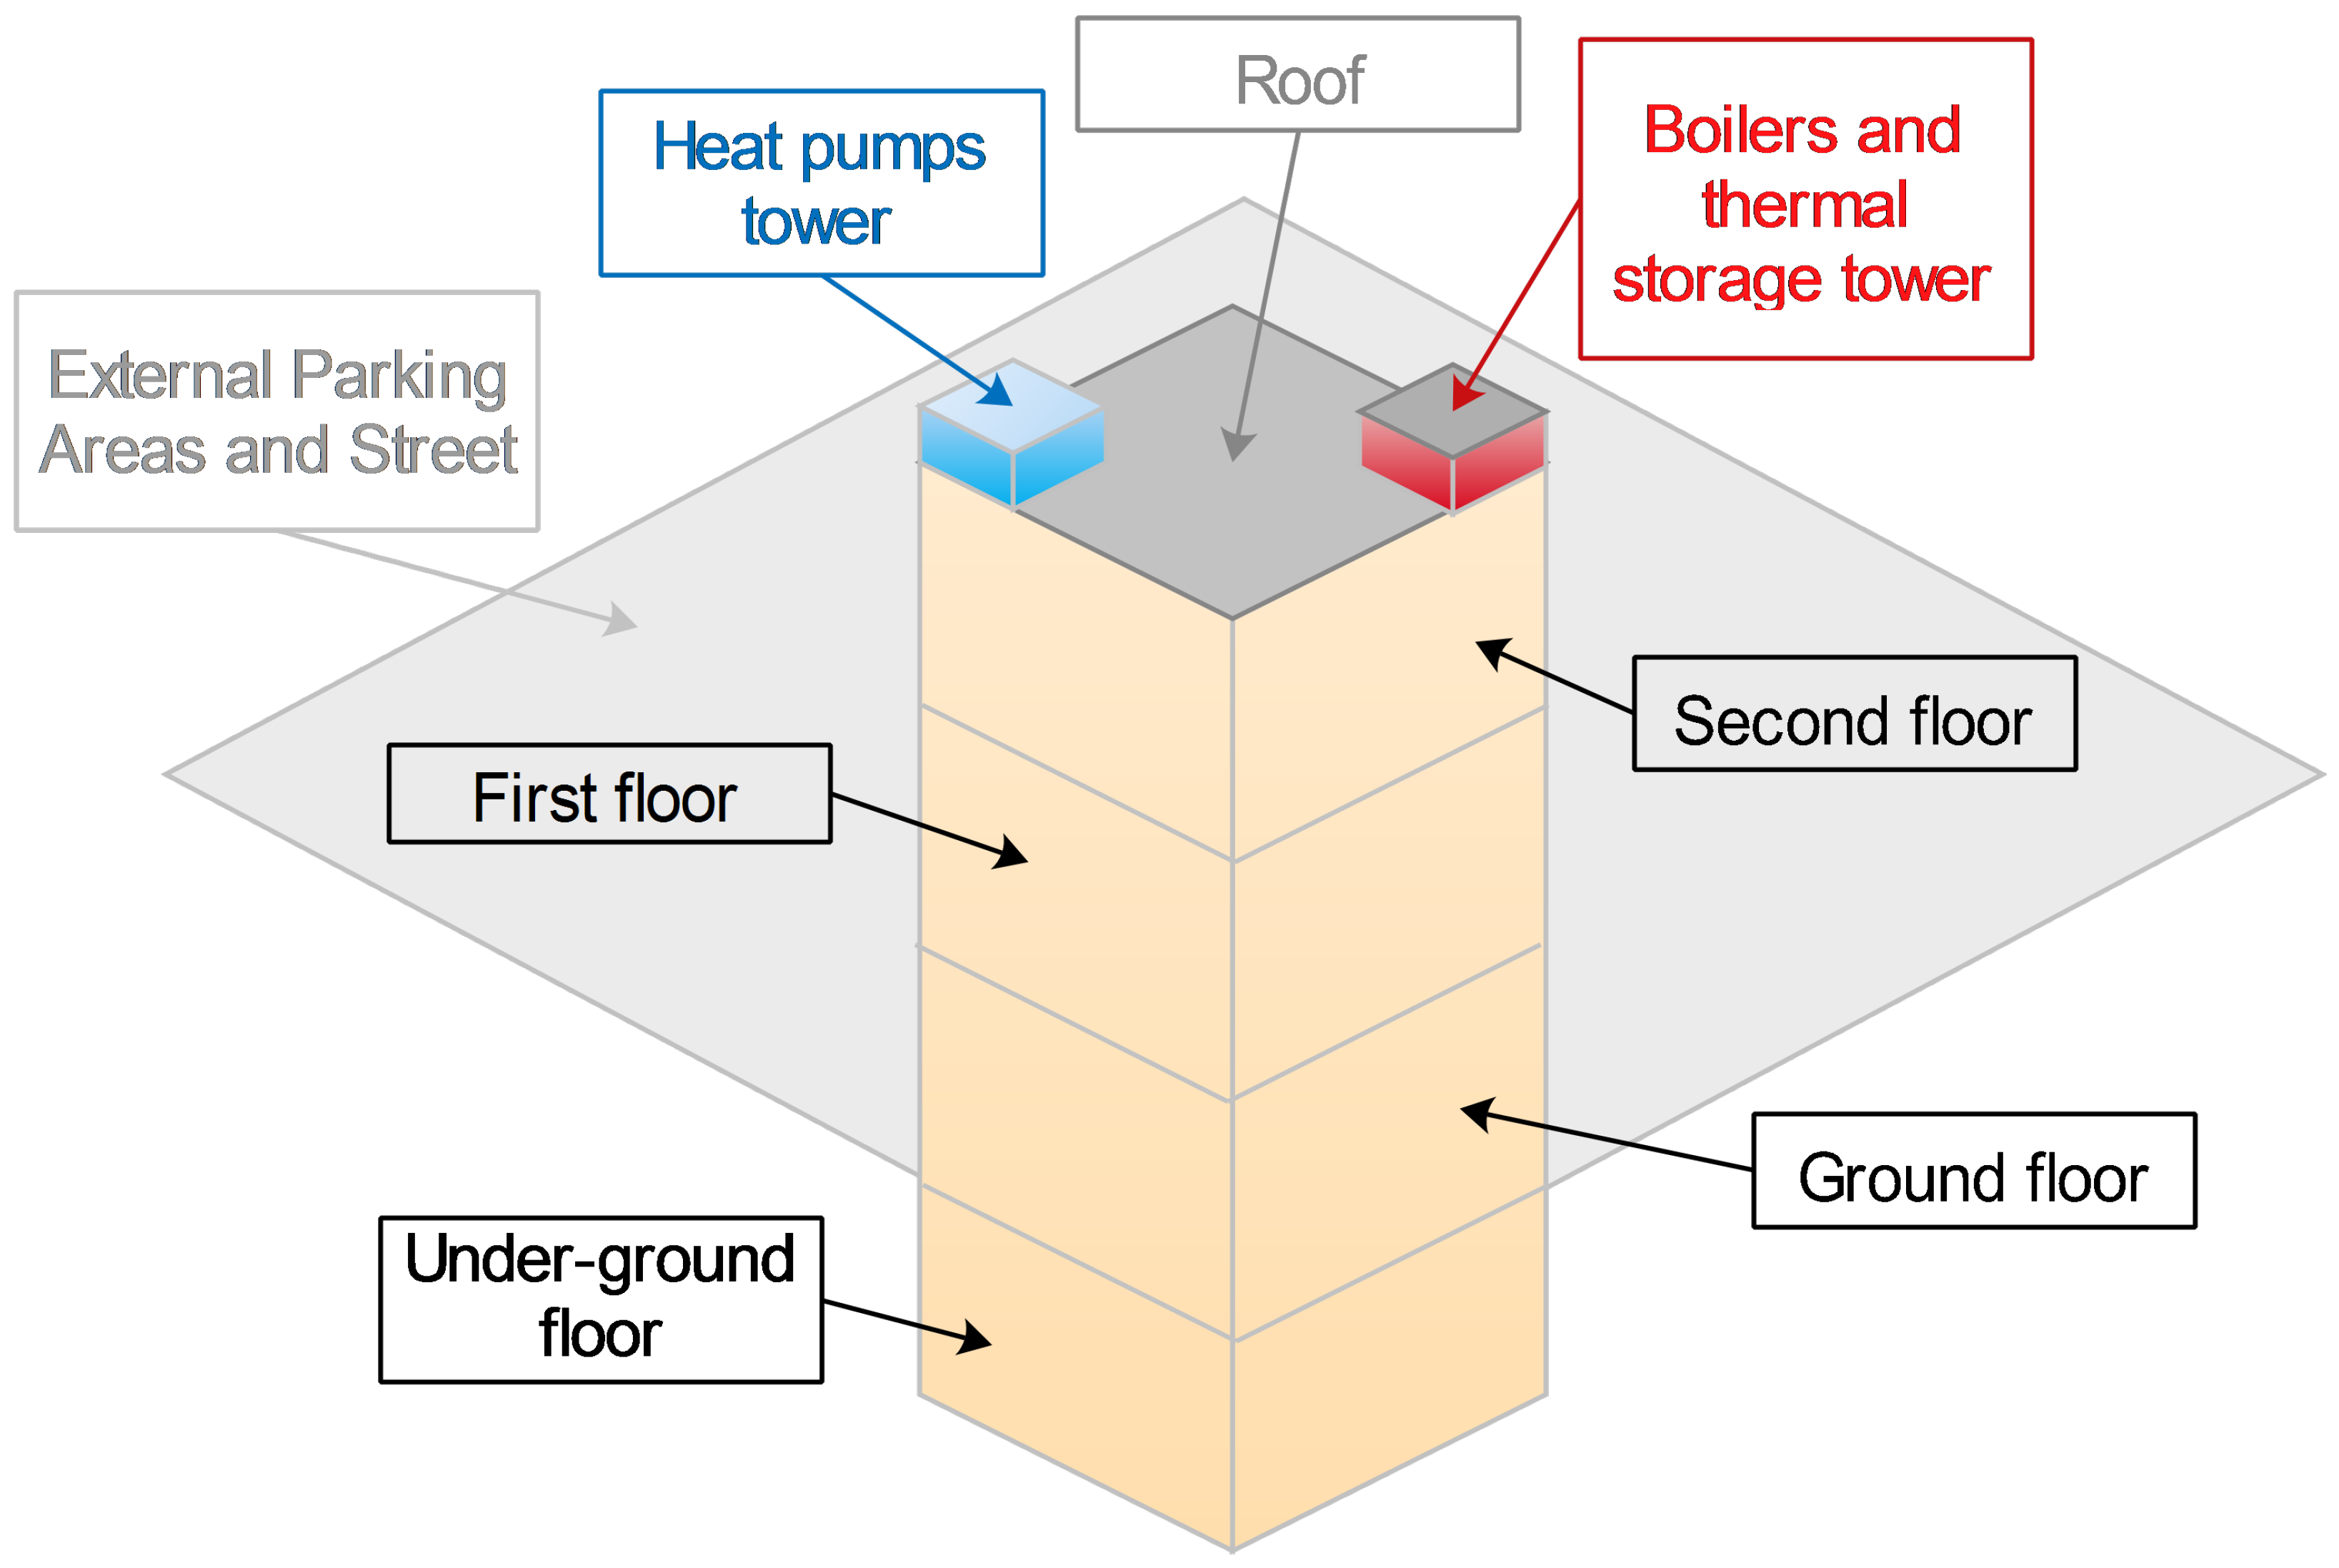
As shown in
Figure 1, the residential building is designed with an underground level with service space with a garage, storage and cellars, a ground floor, and two floors. The building is surrounded by a parking area and a street that guarantees, through a car slope, access to the basement floor. The 57 residential units are spread over the three upper floors, while on the roof there are two small towers; one closed and one without a roof. In the closed tower, the boilers and thermal storage are housed, whereas in the tower without a roof, the heat pumps are located. Note that the originally designed cooling system was equipped with two chillers placed in the tower without a roof. However, a few years ago, after a chiller failure, the system was revamped by installing two heat pumps. Therefore, the present heating and cooling system is a centralised hybrid plant composed of two natural gas boilers, plus thermal storage and two heat pumps.
The design choice of placing the heating and cooling equipment in dedicated rooms located on the roof level forced the development of an unconventional hot/cold water distribution system.
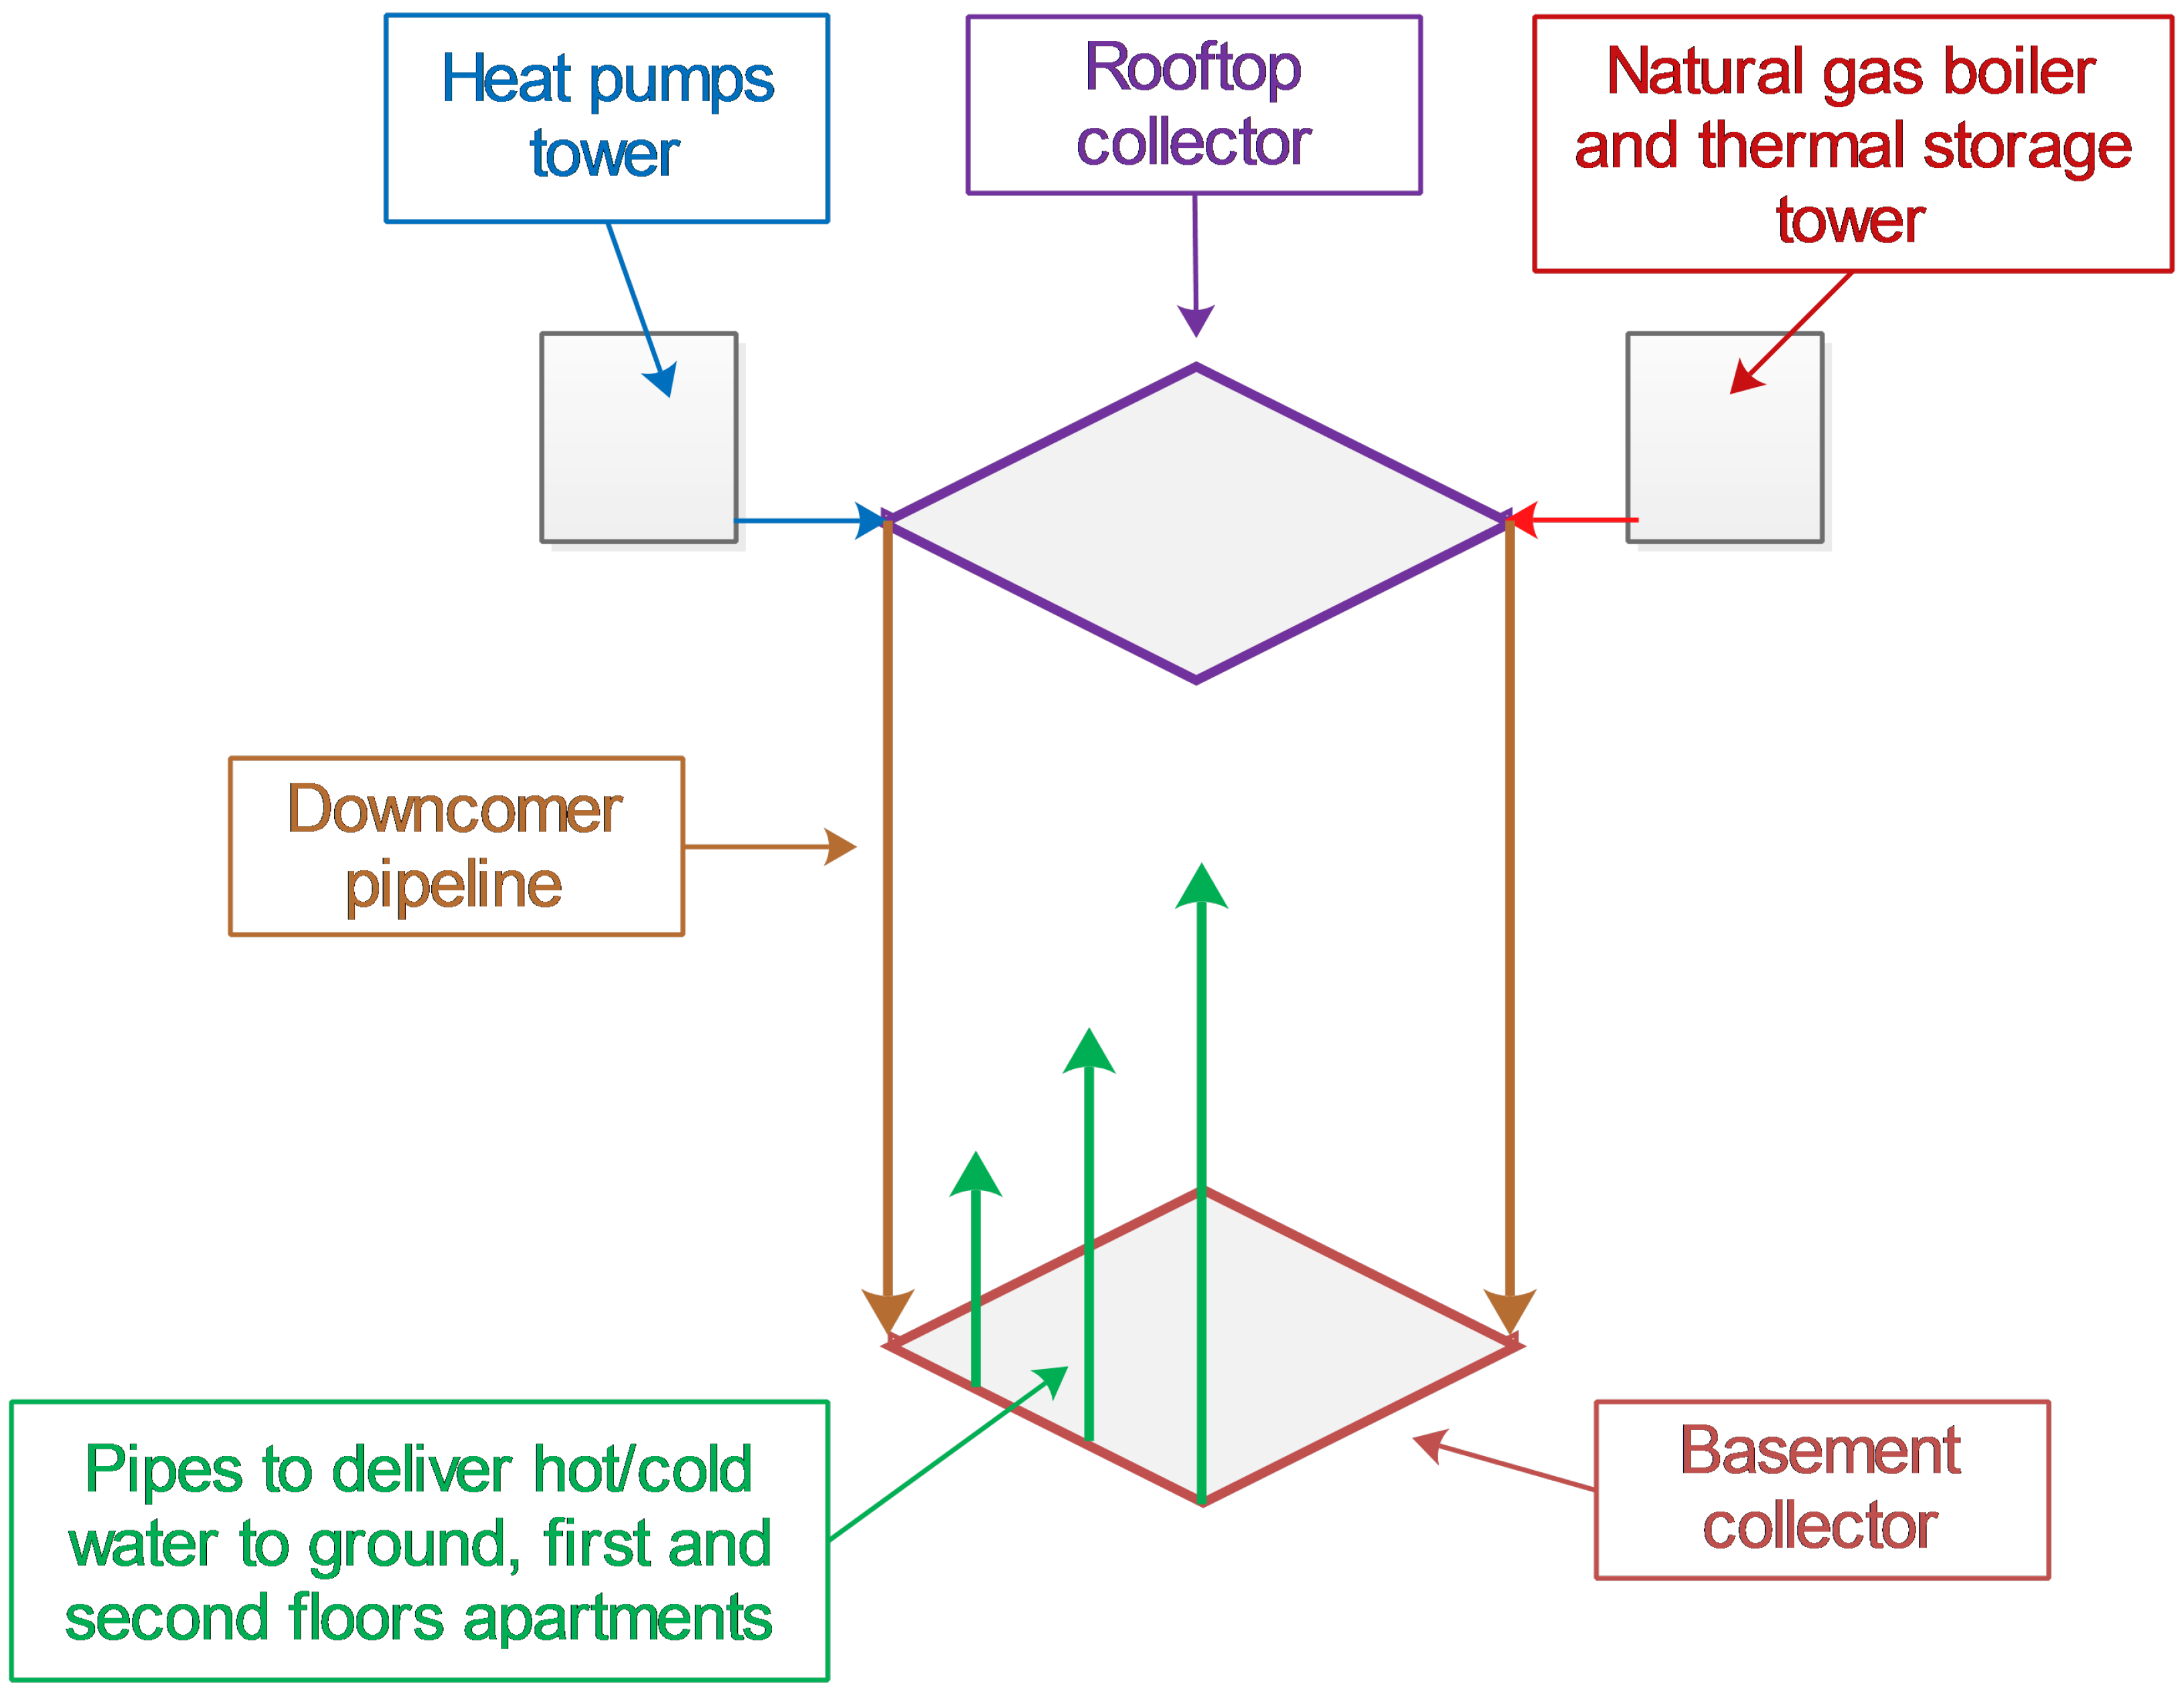
As shown in
Figure 2, the heat pumps and boilers inject hot/cold water into the so-called rooftop supply collector (the collector shape is more or less the square) that follows the perimeter of the building roof. Then, the water collected at the roof level moves downward through two downcomer pipelines, and it is collected by the basement supply collector. This collector also has a square shape and follows the perimeter of the building, resulting in a solution that guarantees a loop of water around the building. On each side of the basement supply collector, three pipes connect. Each pipe is devoted to deliver hot/cool water to a specific floor of the building. In general, the apartments located on a certain floor, e.g., the first one, are served by four tubes (one for each side of the square), which give origin from the basement supply collector. Therefore, on each floor, there are four cabinets, each fed by a tube coming from the basement supply collector, in which a supply and a return floor collector are placed. The floor supply collector presents a number of outputs equal to the number of apartments that must be served (in general, from 2 to 5). At each floor collector output there is a pump and an analog heat meter. The pump sucking the water from the supply collector guarantees its flow in the apartment heating/cooling system. The heating/cooling bodies are fan coils. The water leaving the apartment is collected in the floor return collector. Through return pipes, the water is delivered to the basement return collector and, then, to the rooftop return collect through two pipelines placed beside the two downcomer pipelines.
A peculiarity of this heating and cooling system is the absence of heat exchangers to decouple the hot/cold water circuit of the building from the apartment ones. Only two hydraulic disjunctors are used to decouple the heat pumps and boilers from the rooftop supply and return collectors.
Figure 3 shows the hydraulic circuit of the heat pumps and clearly shows the hydraulic disjunctor that decouples the hydraulic circuit of HP. from the rooftop collectors. Each heat pump is characterised by a design power of 64 kW and can be used for both heating and cooling purposes. The water circulation in the HPs circuit is guaranteed by the water pumps integrated in the heat pumps themselves. During the heating season, heat pumps are used to cover the heat demand while the domestic hot water demand (DHW) is satisfied by natural gas boilers. When the outdoor temperature drops below 2 °C, the building control system switches off the heat pumps. Then, the boilers are used to cover both heating and DHW demands.
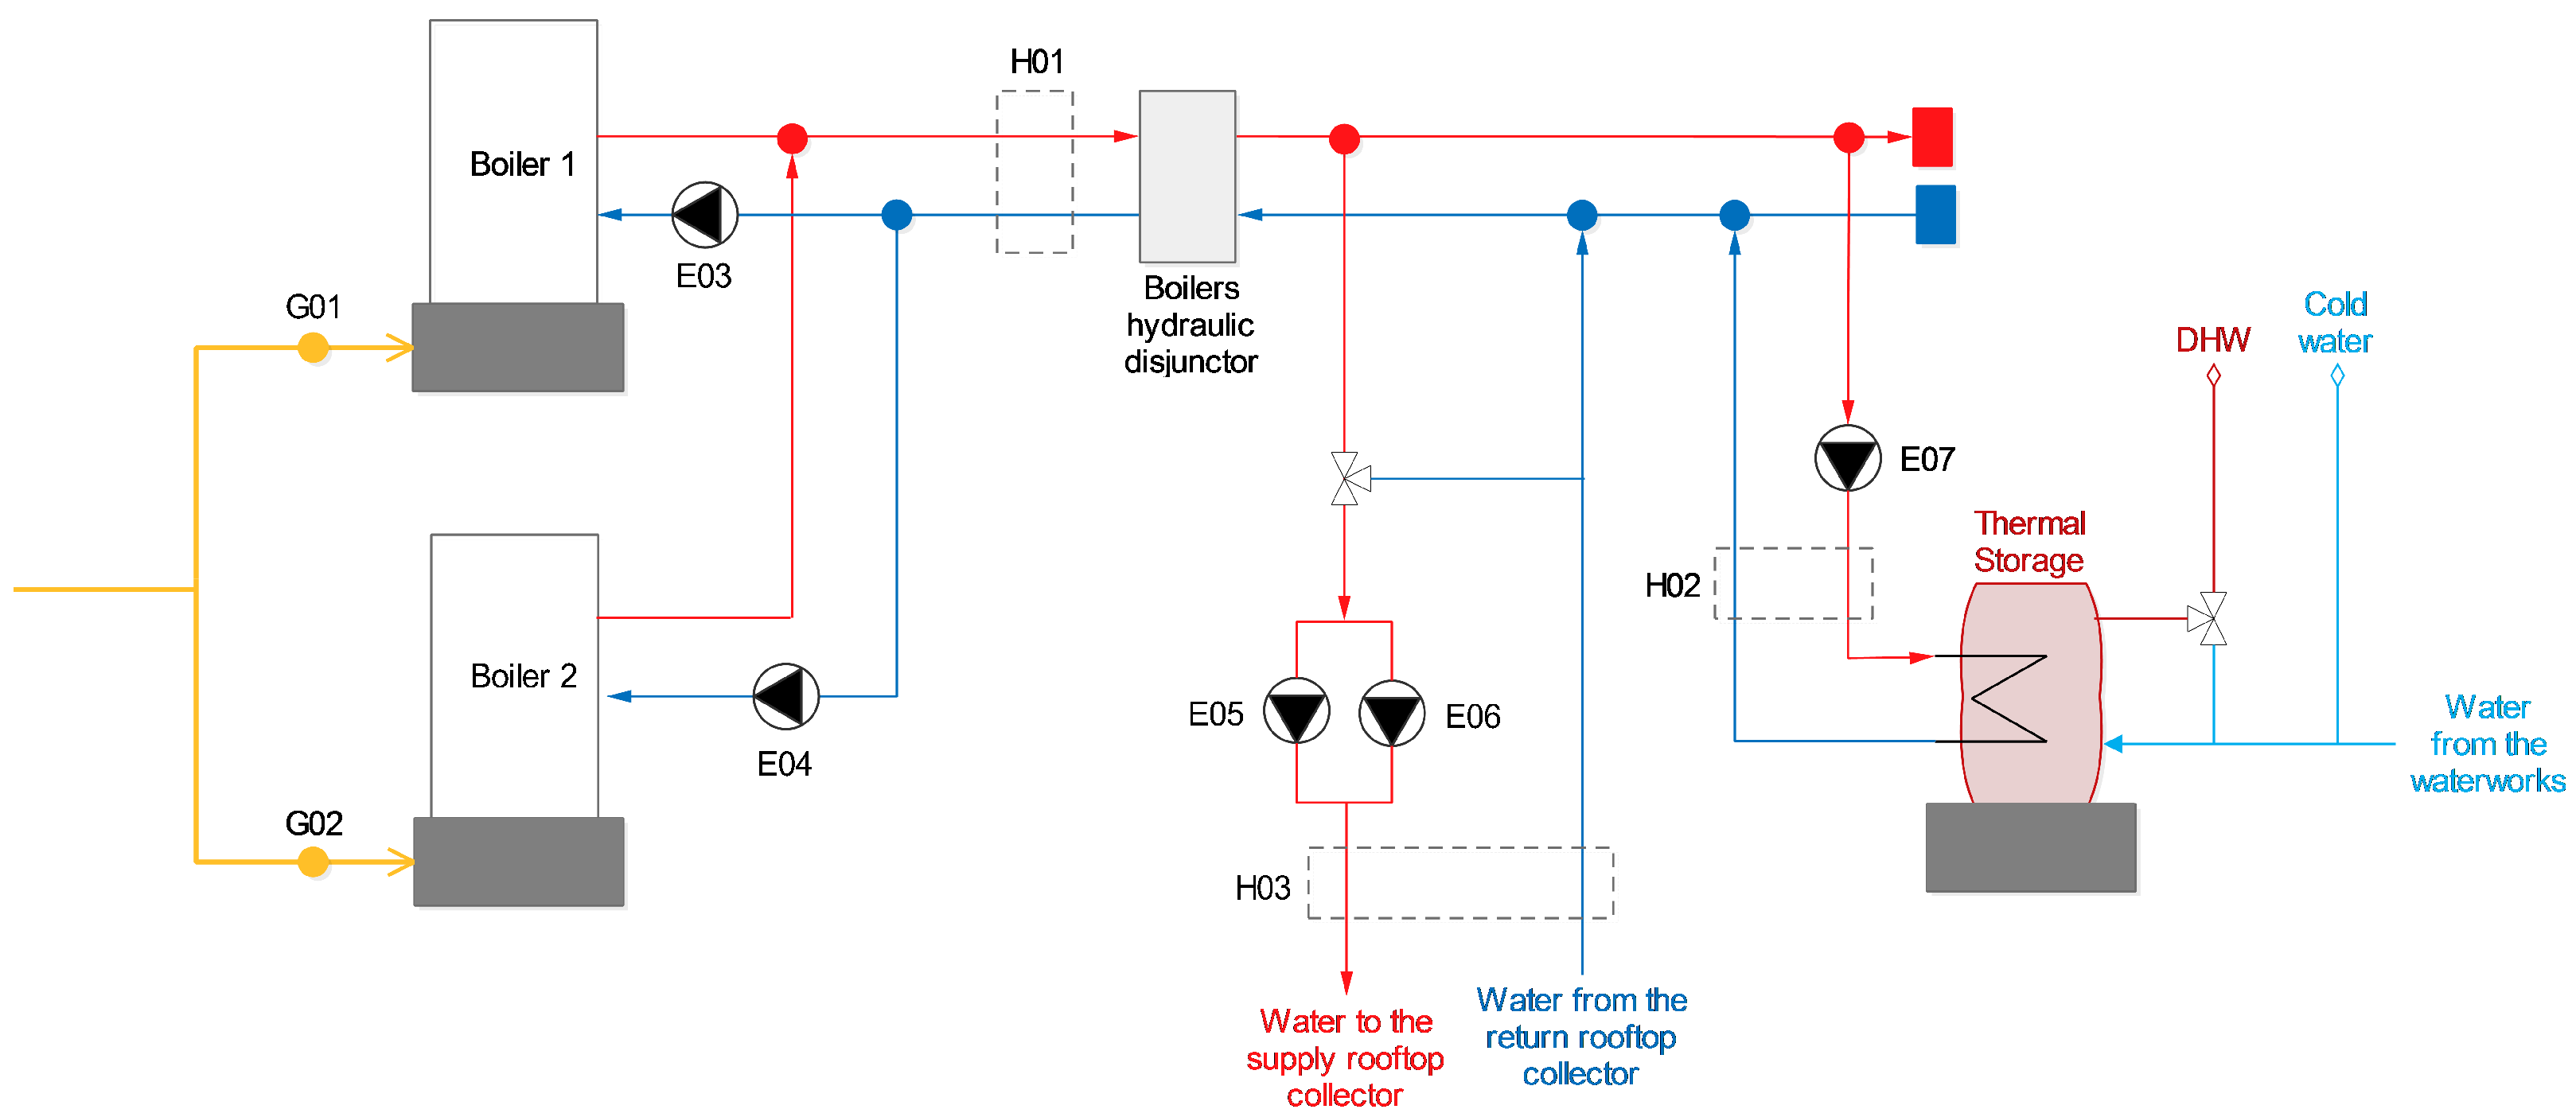
Each natural gas boiler is characterised by a design power of 218 kW. The boilers are used to cover the yearly DHW demand and, in case the outdoor temperature drops below 2 °C, are also used for heating purposes. As shown in
Figure 4, the hydraulic disjunctor of the boilers ensures that the boiler circuit is decoupled from the one that feeds the rooftop collector and the thermal storage that produces DHW. The thermal storage unit is characterised by a total capacity of 800 L, an effective capacity of 263 L, and an exchange surface area of 2.65 m
2.
The water circulation in the boiler loop is guaranteed by the pump labelled with E03 and E04 in
Figure 4, whereas pumps E05 and E06 allow the water circulation from the rooftop supply collector to the floor supply collectors and return. Pump E07 is used to circulate water in the thermal storage and then heat the storage to produce DHW. DHW circulation is guaranteed by pumps located in the same floor cabinets used for heating and cooling purposes.
To achieve the goals of this work, as well as (i) assess the performance of heat pumps in real operating conditions, (ii) evaluate the affordability of revamping residential building heating/cooling systems, originally designed with natural gas boilers and chillers, with heat pumps plus boilers (giving origin to a hybrid system), and (iii) compare the real performance of boilers plus a chillers-based heating and cooling system with the hybrid one, the selected building heating and cooling system has been equipped with a fully automated and remote monitoring system composed of:
An ultrasonic heat meter (Siemens UH50 A70 [
38]). The instrument measures the flow rate and the inlet and outlet temperatures of the heat pumps. In
Figure 3, the measurement point is named F01. The need to install a device that measures the total flow rate coming from the two heat pumps rather than one measuring the outflow of heat pump 2 arises from space constraints.
An ultrasonic heat meter (Siemens UH50 A65 [
39]). The instrument measures the flow rate and the inlet and outlet temperatures in the outlet section of heat pump 1. In
Figure 3, the measurement point is named F02.
Figure 5 shows the ultrasonic heat meters installed in the hydraulic circuit of the heat pump.
Seven energy counter modules (Seneca S504C-6 [
40]). The measuring devices are used to acquire the power and energy absorbed by each heat pump (E01 and E02 in
Figure 3) and by each of the five circulation pumps installed in the hydraulic circuit of the boilers (from E03 to E07 in
Figure 4).
Two QA/QAe quantometers for natural gas (Riels QAE-PN4-ALU [
41]). Measurements devices are used to measure the natural gas flow rate consumed by each boiler. In
Figure 4, the measurement equipment is identified as G01 and G02, respectively.
Three ultrasonic heat meters (two Siemens UH50 A83 [
42] and one Siemens UH50 A65 [
39]). Measurement devices are used to measure the volumetric flow rate and the inlet and outlet temperatures at the outlet of the boilers (H01 in
Figure 4), in the thermal storage section (H02 in
Figure 4), and at the main branch of the heating circuit (H03 in
Figure 4).
The signals of the devices noted above were acquired and made available on a remote platform through two modules for remote management (Senecta REG [
43]). In future steps of the research project, an ‘ad hoc’ application will be developed on the remote platform to acquire (with a sampling frequency of 1 min), store, and process the data coming from the heat pumps and the boilers hydraulic circuits. The aim of the app will be to guarantee a real-time diagnosis of failures and malfunctions, as well as the development, implementation, and tuning of new control strategies based on the real operation of the building. The possibility of implementing a more accurate digital twin of the heating and cooling system, to test the management strategies developed prior to their implementation, will also be considered.
3. Results and Discussion
Considering the lack in the literature of analysis based on real data acquired on centralised hybrid heating and cooling systems that power large residential buildings, this work aims to demonstrate the advantages of installing a monitoring system and using the acquired data for real-time diagnosis and the development of control strategies. To this end, data acquired during the year 2021 are used in the calculations. These data, compared to those acquired during the year 2022, allow the identification of key working conditions of the building heating and cooling. Therefore, they ensure, on the one hand, to identify two failure events and, on the other hand, to improve the currently implemented management strategy in view of reducing system failures and malfunctions and, to some extent, to cut the costs.
3.1. Real-Time Diagnosis of Failures and Malfunctions
The first interesting result of the monitoring campaign is the evaluation of the effectiveness of the monitoring system to highlight failures and malfunctions of the building heating and cooling system.
The first event was detected in the middle of July 2021.
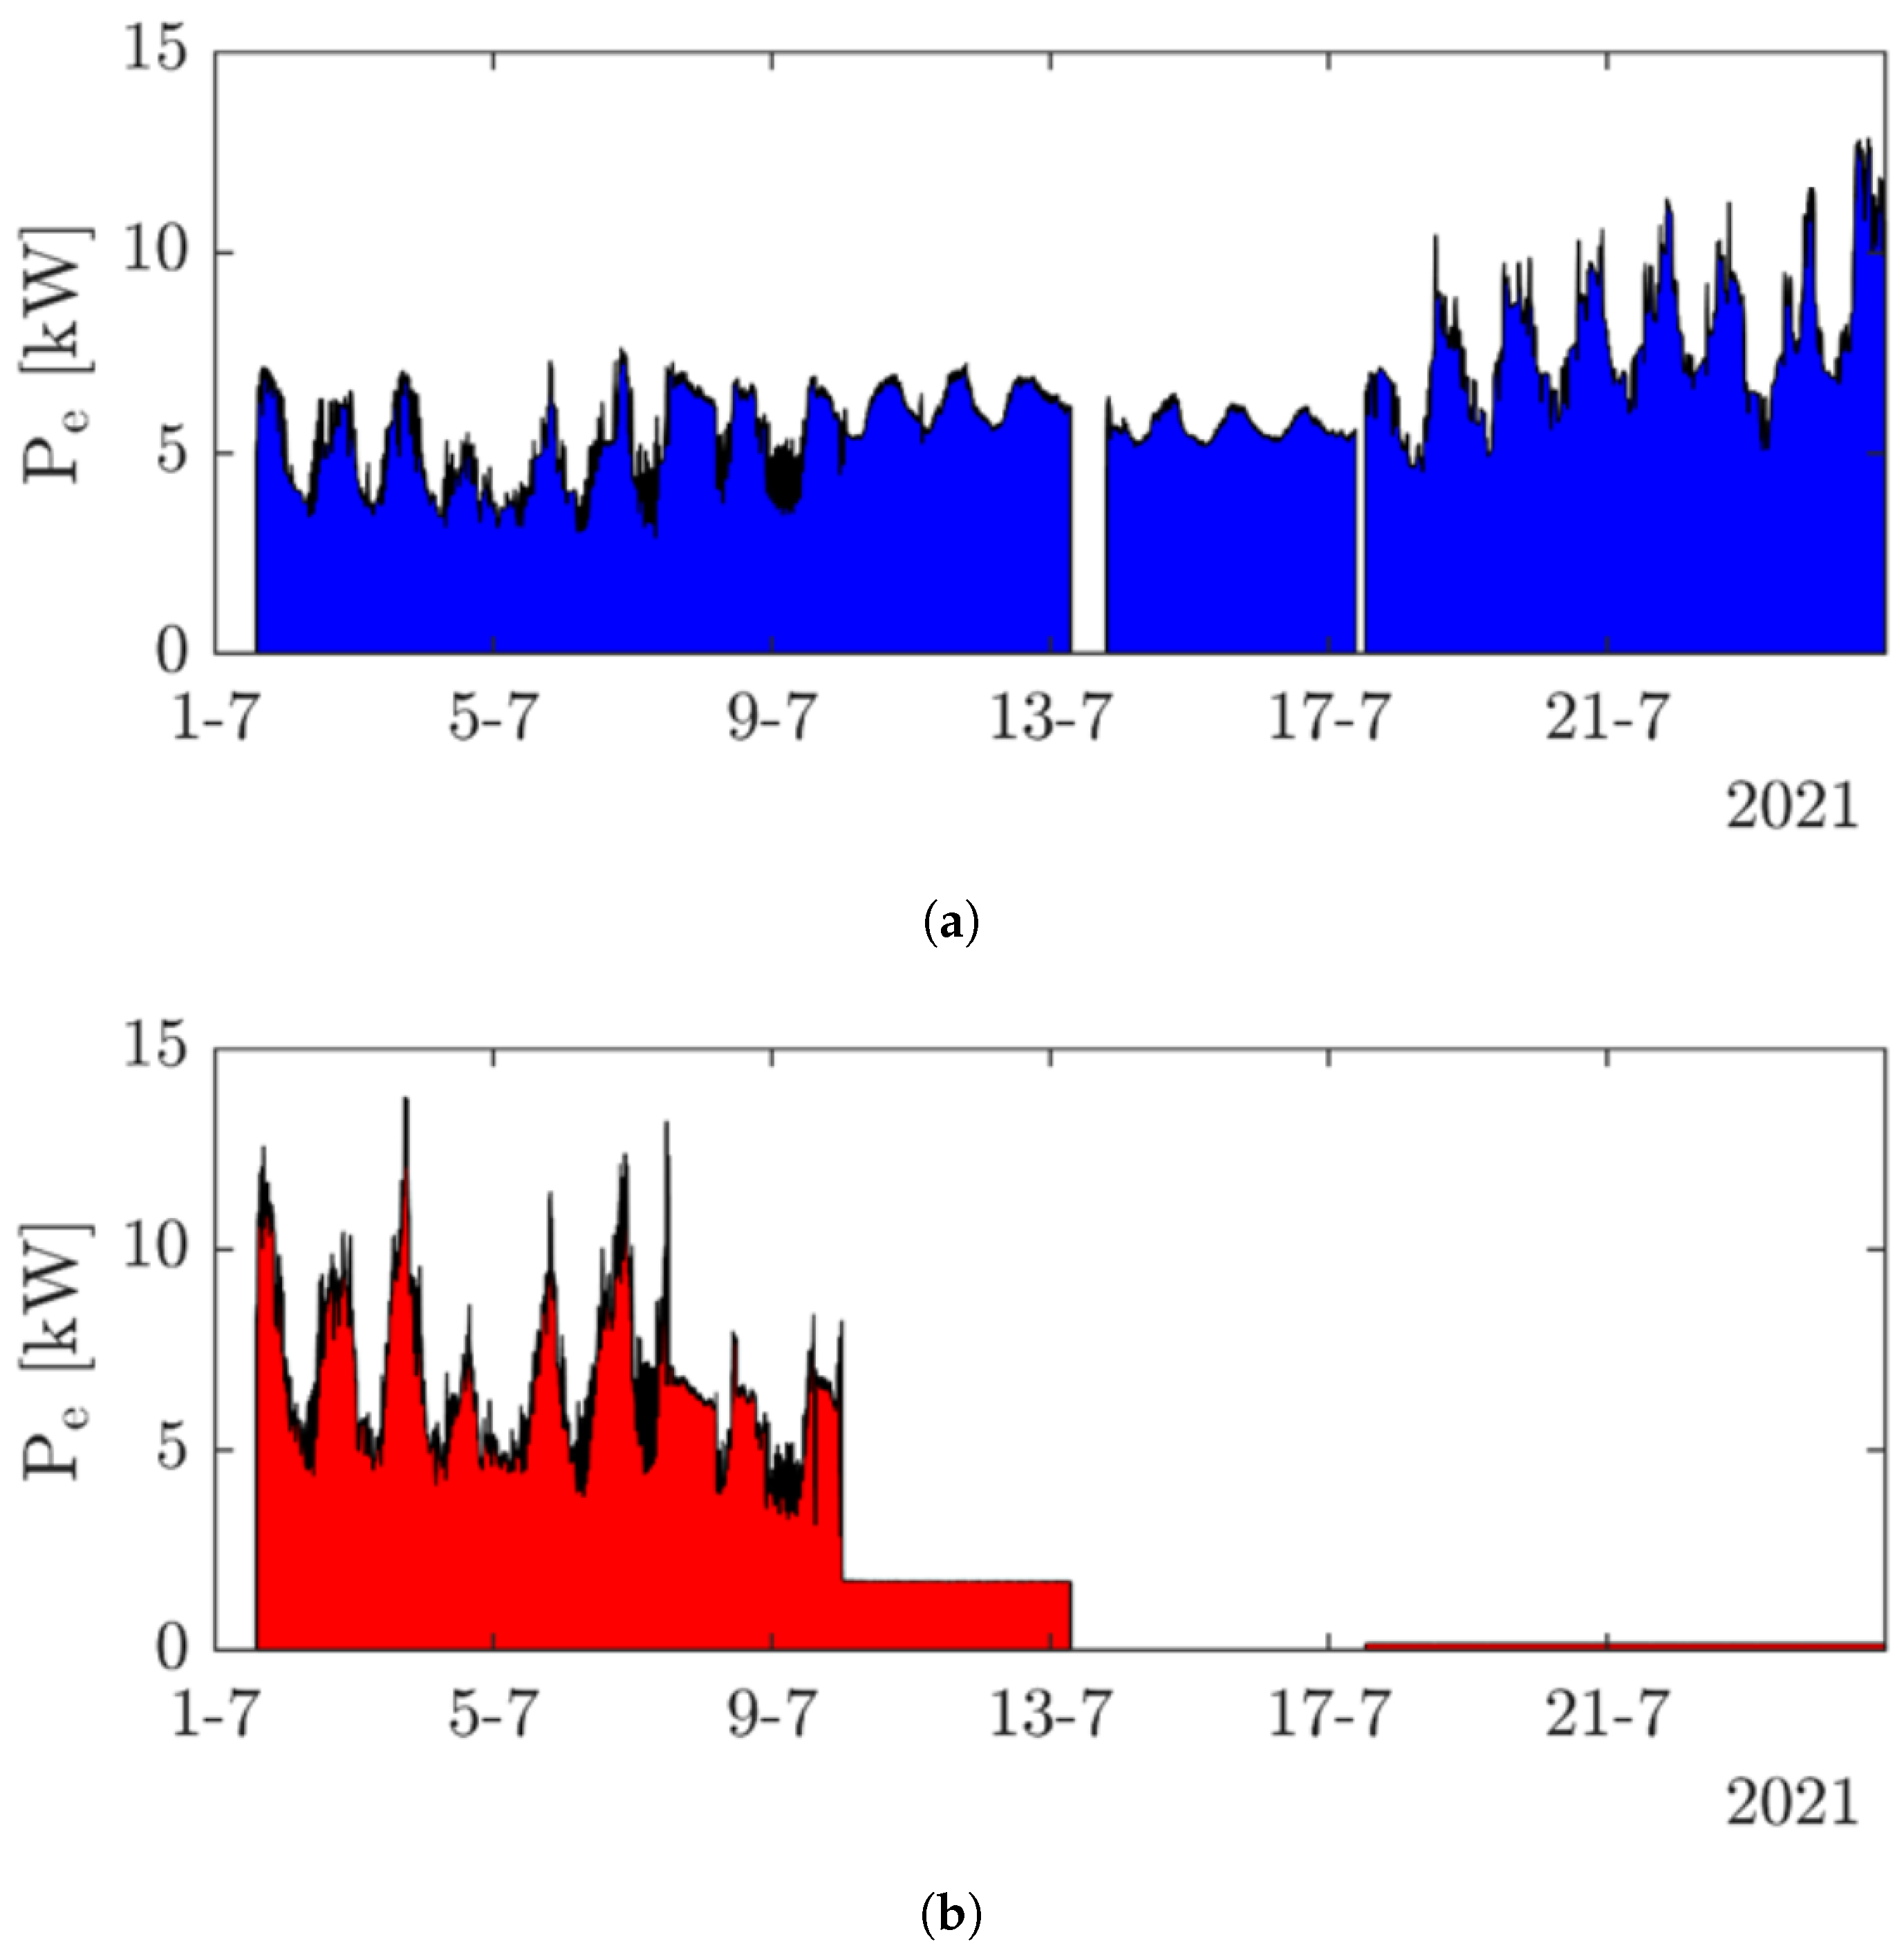
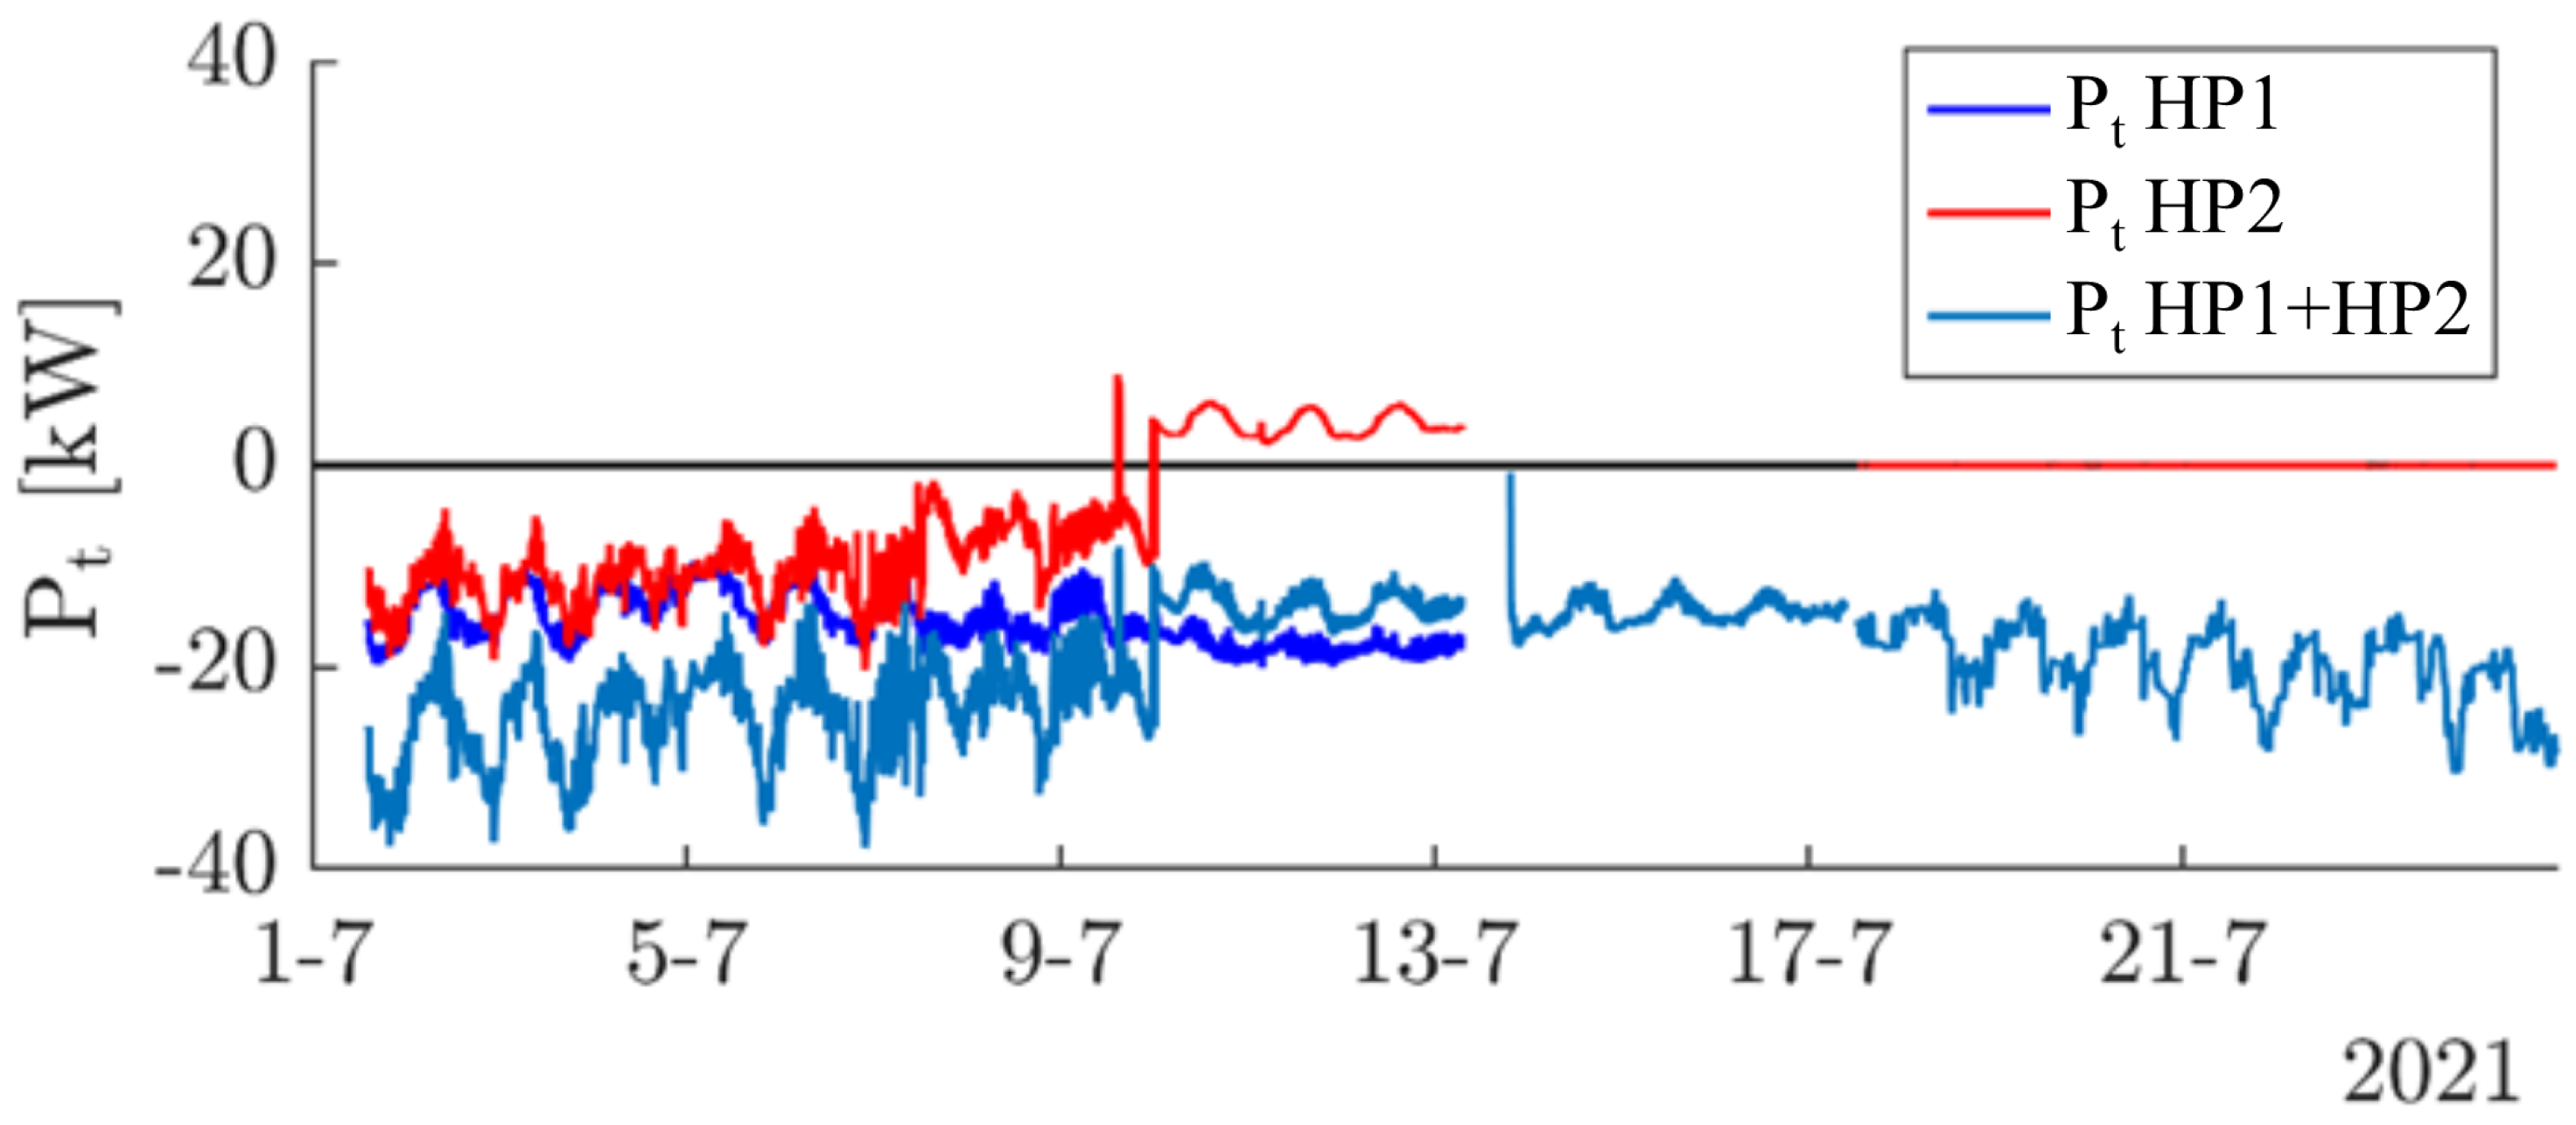
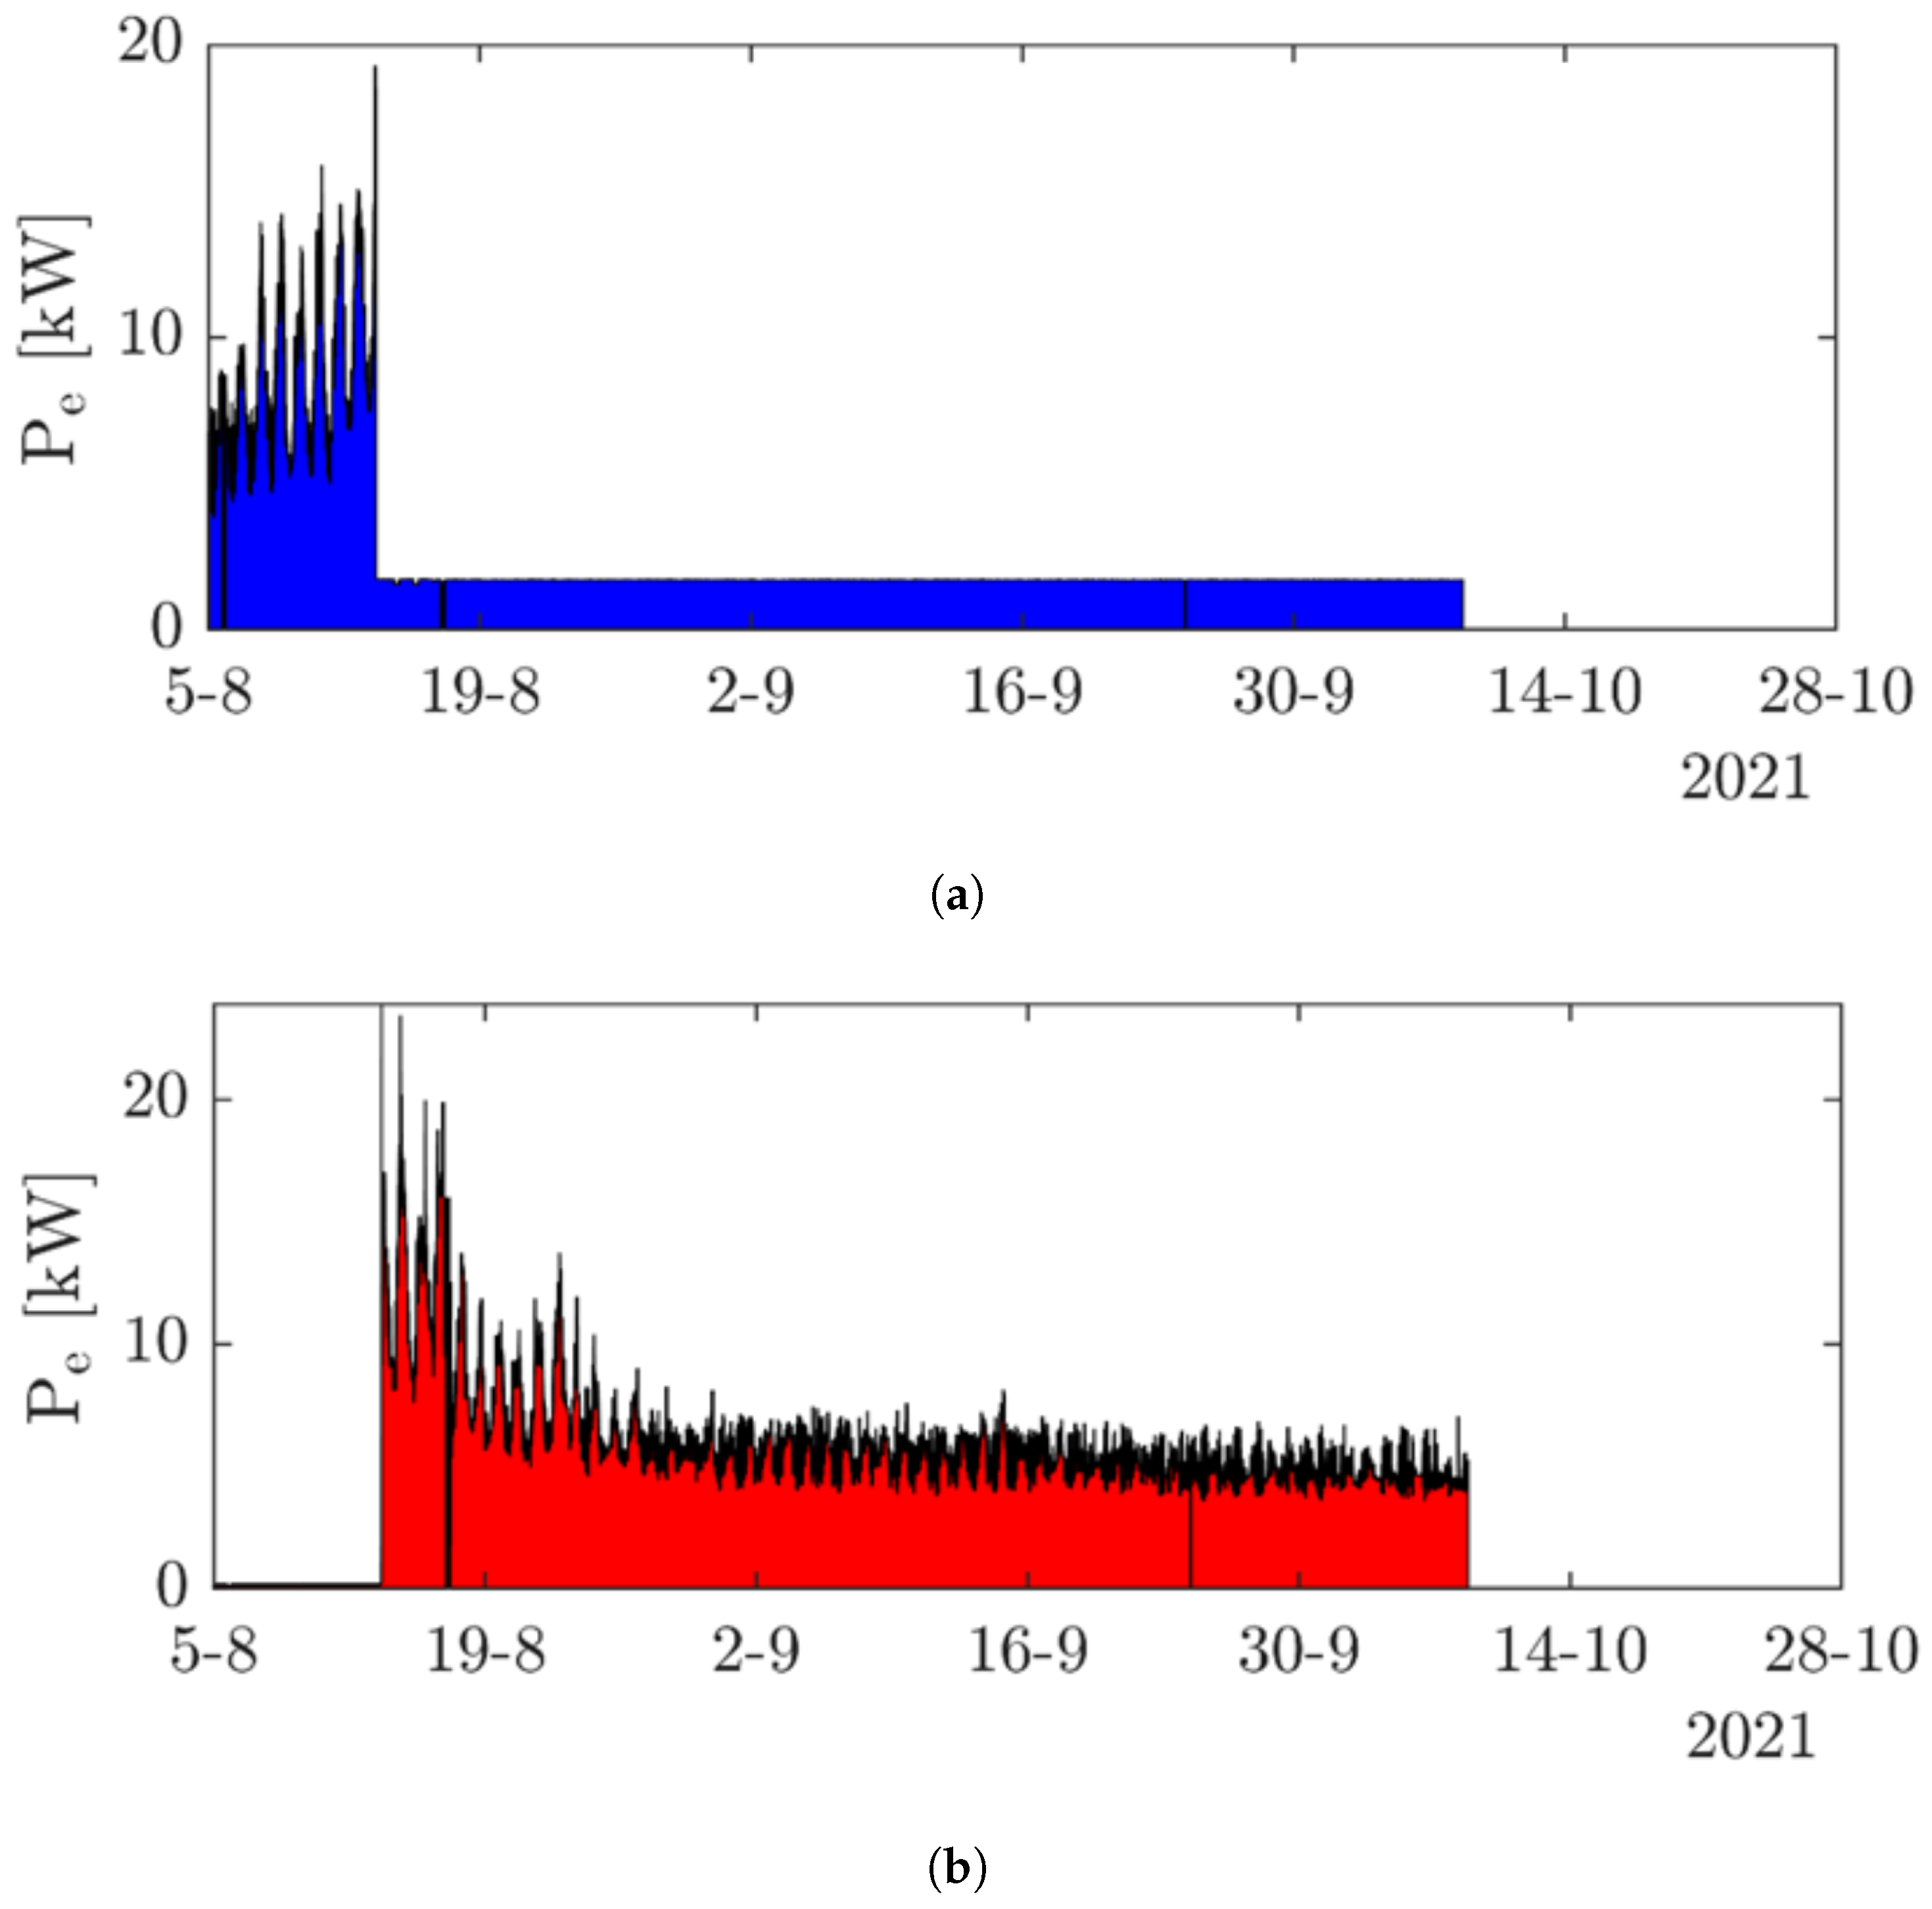
Figure 6 shows the trend of the electric power consumed by heat pump 1, HP1, (
Figure 6a) and heat pump 2, HP2, (
Figure 6b), whereas
Figure 7 shows the trend of the thermal power produced by each heat pump and the sum of them. Note that the thermal power of heat pump 2 is determined as the difference between the total thermal power registered by the ultrasonic heat meter denoted as F01 (see
Figure 3) and the one recorded by the ultrasonic heat meter denoted as F02 (see
Figure 3).
As is clearly visible in
Figure 6, the monitoring system immediately highlighted a decrease in the consumption of electrical power (up to 1.6 kW) and in the cooling power (where the positive value refers to the heating condition) of heat pump 2. Maintenance activities carried out on the system a few days later confirmed the failure of both the compressor and the electronic controller of heat pump 2, forcing it to stop for several days.
Despite the fact that the heat pump compressor failure occurred during the weekend of a summer vacation period, the presence of a monitoring system integrated into an app for remote real-time supervision and control would have allowed rapid repair without any notification from building residents.
Therefore, the monitoring system clearly demonstrated its ability to alert in almost real time to the onset of anomalies in system operation.
The second failure occurred during the winter season (December 2021) in the heating circuit of the boilers (
Figure 4). Note that, in the considered period, the outdoor temperature was higher than 2 °C. Therefore, heat pumps were used to cover the heat demand while boilers provided the DHW.
Figure 8 shows the trends of the total volumetric flow rate (Q) and of the return (
) and supply (
) temperatures of the boilers acquired by the ultrasonic heat meter (see
Figure 4) in the main branch of the boiler hydraulic circuit near the hydraulic disjunctor.
The implemented management strategy imposes on the boilers the regulation of the generated thermal power to cover the demand for DHW (see
Figure 8). Based on the manufacturer specifications and hydraulic circuit characteristics, the implemented management strategy imposes a set-point for the boiler supply temperature equal to 63 ± 1.5 °C. In fact, when the boilers cover the DHW demand, the supply temperature ranges between 62 °C and 65 °C (red line in
Figure 8). However, looking at the data, it is clear that in the middle of December a malfunction in the boilers happened because the temperatures dropped below 60 °C. The malfunction was immediately captured by the monitoring system, and because its duration was longer than 15 min (recall that the sampling time is 1 min), the company in charge of carrying out the maintenance was alerted without any notification from the building residents.
Note that the malfunction must be detected for at least 15 min to avoid unnecessary interventions by the maintenance company. In fact, as shown in
Figure 8, in October and November two unusual supply and return temperature values were recorded, but these were only measurement errors caused by air in the water stream.
Again, the monitoring system clearly demonstrated its capability to alert in almost real time about the onset of anomalies in the system operation and to potentially automatically discriminate between events according to pre-defined criteria (for example, a duration longer than 15 min).
3.2. Improvement in the Control Strategies
The experimental campaign, in addition to demonstrating the effectiveness of the monitoring system to alert in case of malfunctions or failures, also allows one, on the one hand, to analyse the currently implemented management strategy and, on the other hand, to optimise it.
In particular, during the cooling season, the heat pump system can be managed in three different ways (control strategy, CS):
CS1: the two units work in parallel;
CS2: one unit in operation and the second unit in circulating mode;
CS3: one unit in operation and the second in shut down mode.
Before the installation of the monitoring system and until the first period of the monitoring activity, the selection of one of the aforementioned strategies was driven by the specific conditions or the operator’s knowledge. For example, the third strategy (CS3) was adopted in the case of maintenance of one of the heat pumps, such as during the failure event that occurred in July 2021 (
Figure 6), whereas the normal control strategy adopted was CS1.
Analysis of data related to the absorption of electrical power from the two heat pumps to meet the cooling demand clearly shows that the parallel operation of both heat pumps (CS1) is absolutely inconvenient. The installed capacity of 128 kW (64 kW per unit) is oversized, and the load factor (LF) for the two units that work in parallel is always below 30%. Therefore, based on the analysis of the behaviour of heat pump 1 during the failure of heat pump 2 that occurred in July 2021 (CS3 management strategy), when heat pump 2 was available again, the management strategy was changed from CS1 to CS2.
As clearly visible in
Figure 9, which shows the operation of the heat pump system in August–September 2021, one heat pump (e.g., heat pump 2) can meet the cooling demand, while the other heat pump is only used for fluid circulation, as the building hydraulic circuit is very large.
However, to better understand possible improvements in terms of efficiency connected to the switch from CS1 to CS2, the acquired data were used to compute the energy efficiency ratio (EER) of each heat pump according to the following equation:
where
,
, and
are the thermal power produced by the unit, the total electric power absorbed by the unit, and the electric power due to mass flow circulation, respectively. It should be noted that
is determined by the monitoring data acquired during the operation of the unit in the circulating mode.
The results of the analysis confirmed the expected inverse dependence on outdoor temperature (see
Figure 10), with the two units performing similarly when in operation. Furthermore, the analysis highlights variable values of overall system performance
for the same outdoor temperature.
In view of better understanding the system behaviour and then optimising the control strategy, the dependence of the performance on the outdoor temperature is limited by weighting the values of the EER on the basis of the ratio between the outdoor temperature value
T and a mean temperature value
equal to 25 °C:
The computed values of EER
* are shown in
Figure 11 as a function of the load factor (LF), allowing a comparison of the different control strategies that were implemented in the period August–September 2021 (
Figure 9): CS3 with HP1 running and HP2 shut down (blue dots in
Figure 11) and CS2 with HP2 running and HP1 in circulating mode (light blue dots in
Figure 11).
It is clear that when the system meets the cooling demand with only one heat pump (CS3—blue dots), the EER* is higher in comparison to the operation with only one heat pump working and the other in circulating mode (CS2—light blue dots). The main explanation for this result is that the mass flow rates of the two heat pumps mixed in the main branch and the heat pump working in the circulating mode reduce the efficiency of the system, as it does not provide cooling power.
The comparison between the July EER
* calculated for CS3 (
Figure 11) and CS1 (
Figure 12) shows that, due to a heat pump system characterised by overcapacity, CS3 presents higher EER
* values than CS1.
Figure 12 also shows the EER
* of heat pump 2 in the period before failure, and it is interesting to note that the unit began to show performance degradation that could have been seen as a precursor sign of the need for unplanned maintenance. Therefore, ad hoc processing of the monitoring system data demonstrates its effectiveness in (i) identifying the optimal control strategy for the heat pump system and (ii) the diagnostic process of future malfunction.
The unexpected deviation from the expected performance is hence a clear alert of an upcoming failure of the machine, and, in view of avoiding system failure, an unplanned maintenance of the unit should be scheduled.
4. Conclusions
The energy transition to a more sustainable and RES-based building sector demands high-efficiency power generation technologies coupled with optimised control and maintenance strategies capable of minimising consumption and guaranteeing the best performance throughout the overall operating range. In this context, monitoring systems installed on the heating and cooling hydraulic circuit coupled with an ad hoc tool for real-time analysis can play a key role. To prove that the monitoring system can (i) allow real-time diagnosis of malfunctions, anomalies, performance reductions, and failures and then a fast response in planning maintenance activities aimed at limiting the risk of more severe failures, unexpected costs, and long plant unavailability, (ii) contribute to the development of control strategies tailored to the building and user needs, (iii) give priority to planned or unplanned maintenance activities depending on techno-economic drivers such as performance decays, and (iv) prove to building owners that the monitoring system is a plus instead of a cost, especially in residential buildings with centralised hybrid heating and cooling plants, the authors of this work designed and installed a monitoring system in a residential building composed of 57 residential units.
Real-time data analysis, performed with an ad hoc tool, allowed us to detect failures and malfunctions and evaluate the suitability of the system management strategy.
The results of the investigation made it possible to identify in real time a failure of a heat pump and a boiler malfunction. In addition, they also showed that the implemented management strategy was not suitable for the nameplate power of the cooling system. This was a fact that conditioned the load factor of the system and, subsequently, the performance. Therefore, based on these findings, the management strategy was updated, and the performance improved.
Data analysis also allowed us to detect a performance reduction in one of the heat pumps. A warning signal that, if quickly understood, would have prevented the heat pump from failing. Therefore, the analysis demonstrated the usefulness of installing a monitoring system in the heating and cooling hydraulic circuit to guide diagnosis, maintenance, and management strategy selection.
It is also important to highlight the social side of the monitoring system. It helped the inhabitants of the building to become more aware of the benefits of having centralised heating and cooling units (such as the time and costs saved in planning and managing the maintenance of their own apartment units), as well as a greater supervision on the system behaviour. Indeed, at the time of writing, the substitution of the analog heat meter placed in the floors cabinets with digital and interconnected energy meters is in progress to allow a punctual evaluation not only of the power consumption but also of heat losses and water leakages.
