1. Introduction
The genetic history of organism development is stored in the cell genome [
1,
2]. This phenomenon is called phylogenetic memory [
1,
2]. The existence of a phylogenetic memory can indicate that there are genes in the genome that represent the evolutionary genetic history of organisms. These genes should also allow for the recognition of the timestamps of organism development. An example of the existence of phylogenetic memory is cancer development. The transformed cell loses control over this historic potential stored in the genome, and as a result, the atavistic code is activated uncontrollably [
3,
4]. This article is an extension of previously published works that present unified cell bioenergetics (UCB) and propose methods that can be used to study organism evolution [
4,
5,
6,
7,
8,
9,
10]. It has been pointed out that UCB allows for the interpretation of several cell bioenergetic effects, certain diseases and as well as some causes of evolution [
10,
11,
12,
13,
14,
15]. As it was presented, the evolution of organisms can be considered as a discontinuous process that occurs mainly in genome attractors, where organisms undergo random mutations and natural selection [
5,
16,
17]. In a general sense, the term “attractor” denotes a configuration to which the system tends over time. After attaining the attractor, the system gains sufficient stability to return to its original state after the disappearance of emerging disturbances [
18]. In this sense, genome attractors allow for the stabilization of configurations of features that are typical for given organisms [
5]. This approach is consistent with the researchers’ current interest in ‘organisms as attractors in phase space’ [
19].
As a highly conserved and omnipresent protein, cytochrome c is additionally characterized by linear changes in amino-acid differences between different lineages over time, which makes it suitable for the study of cladistics [
20,
21,
22]. In this work, cytochrome c is used as a representative that allows not only for the recognition of genome attractors, but also keeps historical information about organism evolution. This historical information can be considered as specific pictures that have been written in DNA during organism evolution. In this work, is presented what is visible during the analysis of these evolutionary pictures and how deep we can penetrate into evolution using these pictures. As it is presented, these pictures can be recognized by artificial neural networks and, based on this recognition, the timestamps of evolution can be identified. As a result, in this work a new method of penetrating deep into evolution using the recognized timestamps has been established. It is presented that, using this method, traveling between genome attractors and the reconstruction of the line of organism development from the most advanced to the most primitive organisms is possible.
Modern methods of determining phylogeny are usually based on calculations. Phylogenetic trees have remained a central metaphor in evolutionary biology since Charles Darwin sketched his first evolutionary tree in 1837 [
23]. Evolutionary trees have now become the subject of detailed, rigorous study to reconstruct the branching patterns that led to the diversity of life evolution [
23,
24,
25]. The fundamental problem in striving to determine the real course of evolution by generating phylogenetic trees is the very large number of trees (even for a relatively small number of taxa) that should be evaluated in order to select the tree that can be considered the best in the light of the assumed criteria [
26]. For this reason, the determination of the best tree must very often be made after evaluating a small number of possible trees. In this case, along with determining the best tree, it is necessary to determine the reliabilities of internal nodes in the tree. One of the most commonly used methods to determine the reliability of a generated tree is the bootstrap method, which uses the bootstrap resampling technique [
27,
28]. The bootstrap method has been implemented, for example, in the MEGA program [
29]. A small number of evaluated trees, in relation to the total number of trees that can be generated, can be considered as an important factor of the low reliability of tree nodes. Especially in the case when nodes of low reliability are located close to the root of the tree, the reliability of the entire generated tree can also be considered low. This disadvantage of using phylogenetic trees to reconstruct the real phylogenesis makes it necessary to develop and implement new algorithms dedicated, among others, to reconstruct the line of organism development.
Artificial neural networks (ANNs) are a method of artificial intelligence that has been applied in various fields [
30,
31,
32,
33,
34]. ANNs are most suitable for solving complex, highly non-linear, ill-defined problems with many different variables, which include, for example, establishing protein secondary structure, classification of cancers, gene prediction and drug design [
30,
35,
36]. In this work, neural networks are used to recognize patterns drawn by evolution (and stored in cytochromes c), but contrary to previous works, genome attractors were not exclusively detected. The aim of this work is to show how to reconstruct the line of organism development using the timestamps of evolution recognized by artificial neural networks.
This article is organized as follows: First, the methods and theoretical bases are presented, including descriptions of the implemented neural networks along with teaching and recognition procedures and a semihomologous approach. Secondly, a new method of penetrating deep into evolution using the recognized timestamps is presented for the exemplary organisms along with the validation of the results. Then, a general algorithm of the method of penetrating deep into evolution, with the aim to establish a line of organism development, is proposed. Finally, the conclusions are presented.
3. Results and Discussion
First, the neural networks were taught and validated and timestamps were recognized for sets of monkeys and fish. It transpired that, during the recognition, not only similarity to the closest evolutionary organism can be recognized but also similarities to other, evolutionarily more distant organisms, as similarities of the lower values visible in the “background”. In this article, a set of recognized outliers constitutes the timestamp of evolution. Background similarities usually have relatively small values, for this reason, it was decided to teach each neural network more than once (i.e., 10 times) to increase the reliability of outlier recognition. Each examined organism was also recognized 10 times by each taught neural network and the similarities presented in the article were calculated as the arithmetic means of 10 recognitions. The standard deviations were calculated and presented along with the average similarities.
3.1. Teaching of the Neural Networks
In general, the teaching process involves updating the weights of neurons [
37]. In this work, the weights in the artificial neural networks (ANNs) were adjusted using the error (root-mean-squared Error (RMSE)) between the predicted and correct values in order to minimize RMSE (i.e., lower RMSE to a value below 0.002). It was concluded that it is impossible to teach an 8-layer neural network using the set of 15 organisms, i.e., after several days of teaching, the RMSE was higher than 0.5. Moreover, for a 7-layer neural network, only about 30% of the teaching processes conducted were successful (i.e., RMSE dropped below 0.002). For 2-, 3-, 4-, 5- and 6-layer neural networks, the teaching process was repeated 10 times.
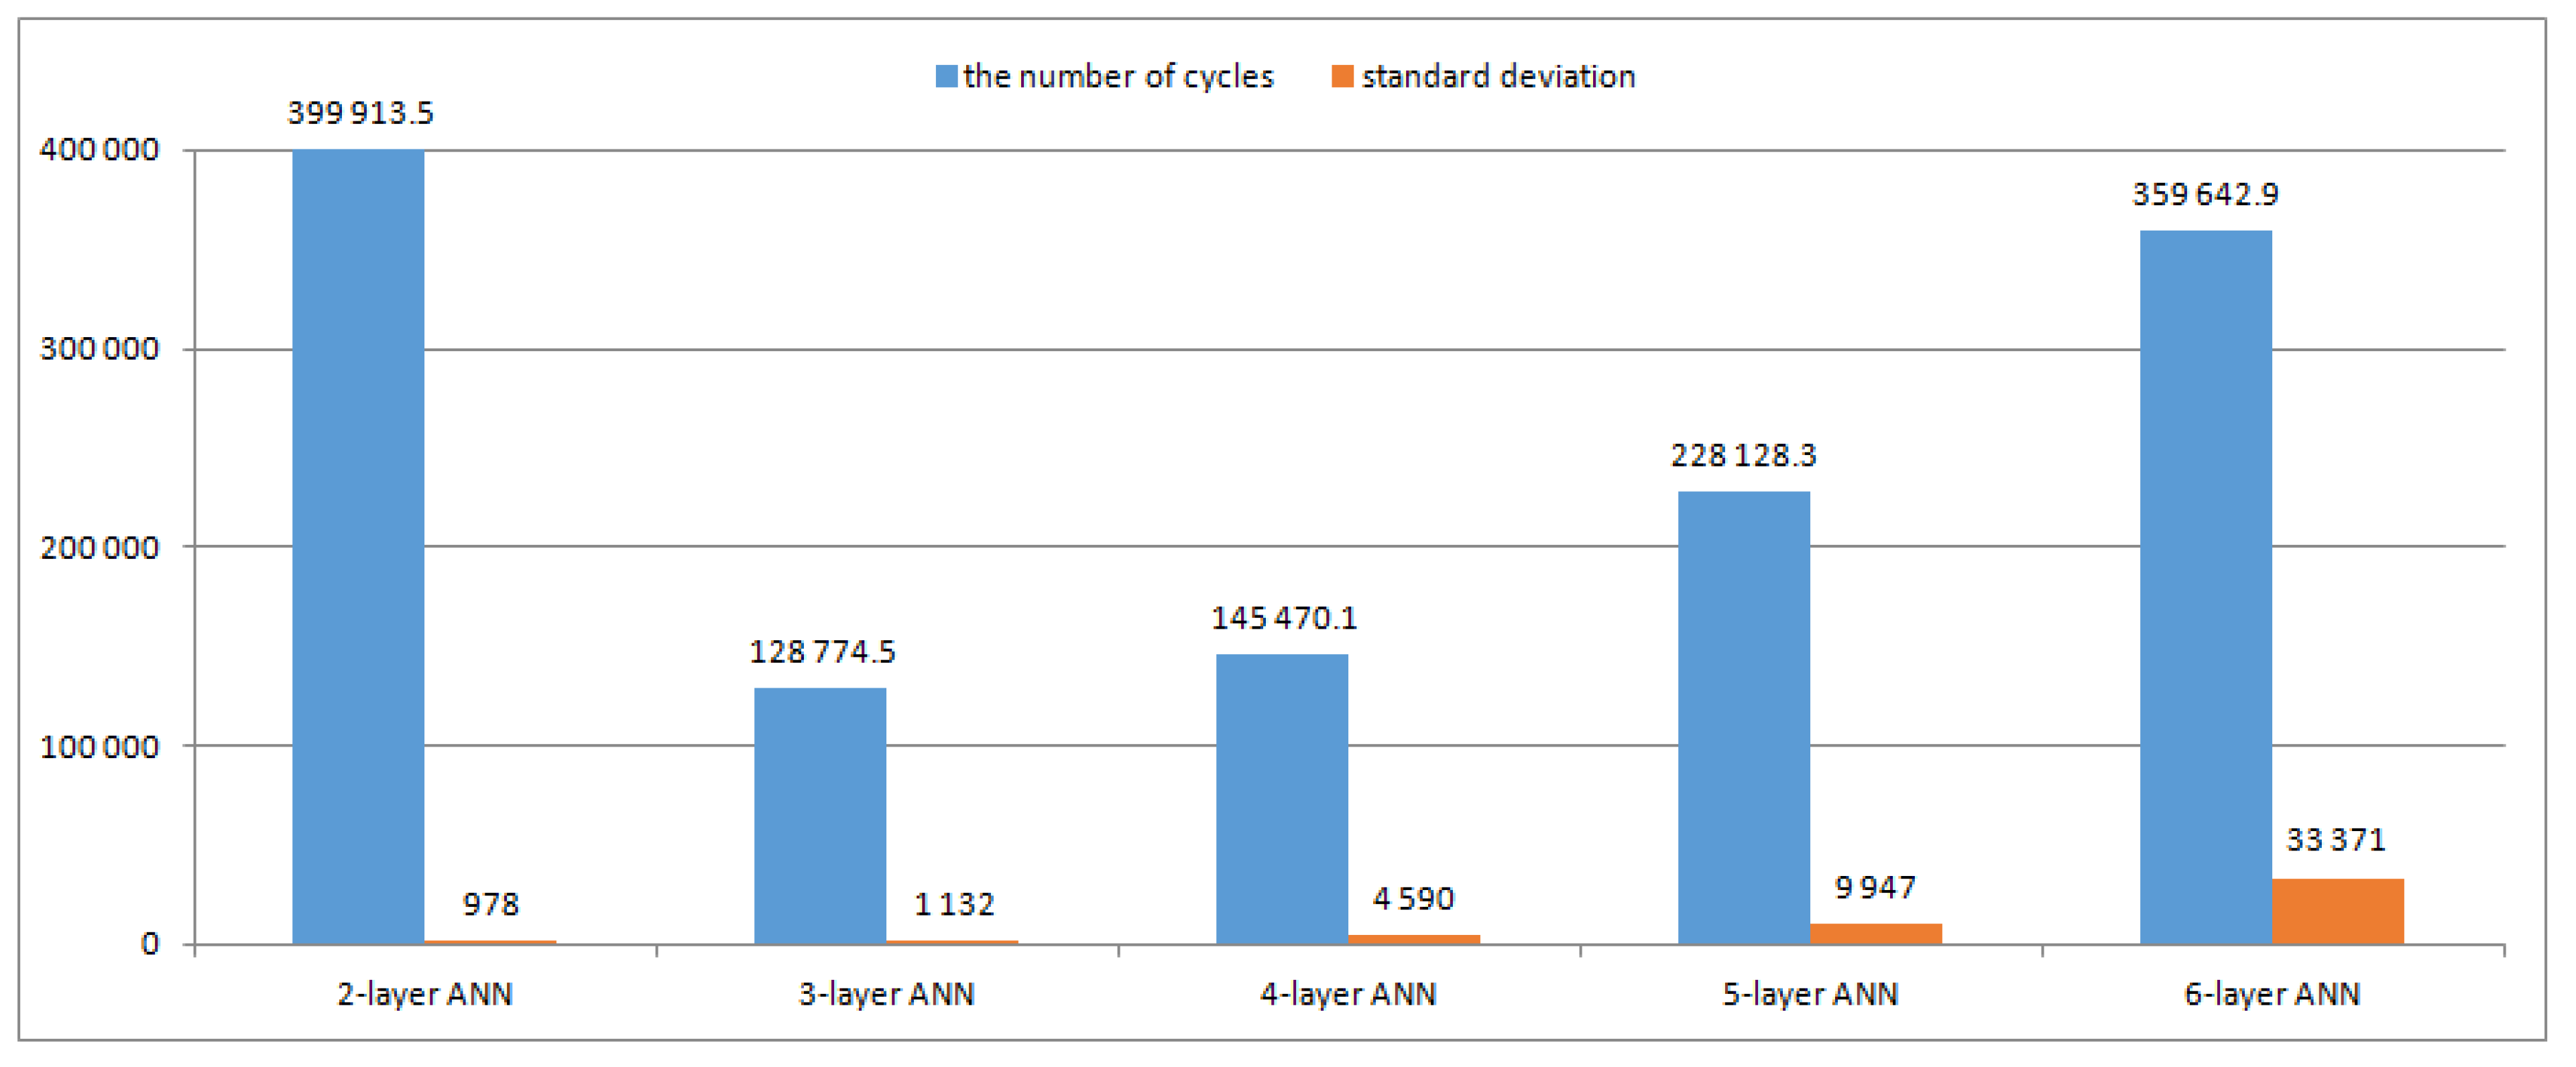
Figure 1 shows the average number of teaching cycles and standard deviations for processes of teaching the 2-, 3-, 4-, 5- and 6-layer neural networks.
From
Figure 1, it can be observed that the 2-layer neural network needs the largest number of teaching cycles, but the standard deviation (of the number of teaching cycles) calculated for 10 teaching processes is the smallest. For a 3-layer ANN, the number of teaching cycles is the smallest. When the number of layers increases from 3 to 6, the number of teaching cycles and standard deviation increase; however, the standard deviation remains relatively small for a 5-layer ANN.
3.2. Validation of the Neural Networks and Recognition of Timestamps for a Set of Monkeys
First, the taught neural networks were validated using a set of monkeys. As shown in
Table A1,
Table A2,
Table A3,
Table A4 and
Table A5 (see
Appendix A), timestamps that contain three outliers (
Homo sapiens, Horse and Crow (listed in the order of the decreasing average value of recognized similarity)) were recognized during this validation. This means that, when recognizing similarity, monkeys are similar to
Homo sapiens, but also to Horse to a lesser extent and to Crow the least. That means that monkeys show, mainly, a similarity to
Homo sapiens but that similarities to Horse and to Crow are also visible in “the background”. It is also evident that similarities to
Homo sapiens recognized by 2-, 3-, 4- and 5-layer neural networks were greater than similarities recognized to Horse and any standard deviation was small (see
Table A1,
Table A2,
Table A3 and
Table A4 in
Appendix A). Moreover, an increase in the number of layers from 2 to 5 caused an increase in similarity to
Homo sapiens. For the 6-layer ANN, the similarity of New World Monkeys (i.e., monkeys with numbers from 12 to 18 (see
Table A5 in
Appendix A)) to
Homo sapiens suddenly decreased, the similarity to Horse increased significantly and the standard deviation increased, compared to the 5-layer ANN. For this reason, the subsequent recognitions presented in this work were made using 2-, 3-, 4- and 5-layer ANNs.
3.3. Validation of the Neural Networks and Recognition of Timestamps for a Set of Fish
The neural networks were also validated using a set of fish. As shown in
Table A6 and
Table A9, the timestamps that contain five outliers (Horse, Crow, Frog, Goldfish and Worm) were recognized during this validation. The greatest similarities of each fish from the set of fish used for validation (i.e.,
Epinephelus moara,
Epinephelus fuscoguttatus,
Brienomyrus brachyistius,
Hypomesus transpacificus and
Nothobranchius furzeri) were to Goldfish by each neural network, i.e., by 2-, 3-, 4- and 5-layer ANNs (see
Table A6 and
Table A9 in
Appendix A), which is in accordance with our expectations.
An especially interesting result was that for
Nothobranchius furzeri. The recognized similarities of
Nothobranchius furzeri to Goldfish by the 2-, 3-, 4- and 5-layer ANNs were equal to 0.83611, 0.57080, 0.60185 and 0.88947, respectively, and were greater than the similarities recognized to Frog, Crow, Horse and Worm (i.e., the other outliers) (see
Table A6 and
Table A9 in
Appendix A). The number of homologous comparisons (i.e., the number of “R” positions) between
Nothobranchius furzeri and Goldfish is equal to 91 (see
Table A6 and
Table A9 in
Appendix A). The numbers of homologous comparisons between
Nothobranchius furzeri and Frog, Crow and Horse were equal to 92, 98 and 95, respectively (see
Table A6 and
Table A9 in
Appendix A). Therefore, considering only the number of homologous comparisons, it is impossible to detect that the similarity of
Nothobranchius furzeri to Goldfish is the greatest. It means that, during the detection of evolutionary similarities, not only the number of homologous comparisons and the lengths of compared sequences are important, but also the distribution of similarities between the compared sequences.
In addition, this validation also showed that the greatest similarities to the closest evolutionary organism was recognized by the 5-layer ANN, i.e., the recognized similarities of each fish from the set of fish used for validation were the greatest for the 5-layer ANN (see
Table A6 in
Appendix A). For this reason, the 5-layer ANN was used to demonstrate the method of penetrating deep into evolution and reconstructing the line of organism development.
3.4. Method of Penetrating Deep into Evolution and Reconstruction of the Line of Organism Development
The recognized timestamps for a set of monkeys (see the Validation of the Neural Networks and Recognition of Timestamps for a Set of Monkeys Section) can indicate that the temporary line of development from the most advanced to the most primitive organisms begins with
Homo sapiens and leads to two less developed organisms, i.e., to Horse and then Crow (see
Table A1,
Table A2,
Table A3,
Table A4 and
Table A5 in
Appendix A). Because the recognized timestamps for a set of monkeys contain only three outliers (
Homo sapiens, Horse and Crow (see
Table A1,
Table A2,
Table A3,
Table A4 and
Table A5 in
Appendix A)), it is impossible to determine which is the next organism “hidden in the depths” of evolution.
The steps of the proposed method, which reveal the line of organism development from the most advanced to the most primitive organisms, are as follows:
- (a)
In the first step of the proposed method,
Homo sapiens, as the most developed organism, is recognized by the 5-layer neural network. The results of the recognition of
Homo sapiens are presented in
Table 3.
- (b)
In the next step, the organism with the greatest recognized similarity (i.e.,
Homo sapiens) is removed from the set of organisms and the 5-layer neural network is taught using the remaining (fourteen) organisms. After re-teaching, the removed organism (i.e.,
Homo sapiens) is recognized once again. The new results of the recognition of
Homo sapiens are presented in
Table 4.
The recognized timestamp (a set of outliers) indicates that the removal of Homo sapiens caused the level of considerations to be shifted to less developed organisms, i.e., from the Homo sapiens genome attractor to the Horse genome attractor (with Crow and Frog genome attractors being visible in the background). It should be noted that the largest outlier (Horse) was recognized reliable, as evidenced by the relatively small value of the standard deviation (0.05320). The recognized timestamp indicates a temporary line of development from the most advanced to the most primitive organisms, i.e., Homo sapiens, Horse, Crow and Frog. The procedure was repeated in the next steps as follows. The organism with the greatest recognized similarity is removed from the set of organisms; the 5-layer neural network is taught using the remaining organisms; and, after re-teaching, the removed organism is recognized. The recognized timestamps indicate the temporary line of development from the most advanced to the most primitive organisms. It can be seen that, in general, the method is based on the principle that “it is necessary to approach the bend in order to see what is around the bend”.
- (c)
In the next step, the organism with the greatest recognized similarity (i.e., Horse) is removed from the set of organisms and the 5-layer neural network is taught using the remaining (thirteen) organisms. After re-teaching, the removed organism (i.e., Horse) is recognized. The results of the recognition of Horse are presented in
Table 5.
- (d)
In the next step, the organism with the greatest recognized similarity (i.e., Crow) is removed from the set of organisms and the 5-layer neural network is taught using the remaining (twelve) organisms. After re-teaching, the removed organism (i.e., Crow) is recognized. The results of the recognition of Crow are presented in
Table 6. In this case, the standard deviation associated with the recognized similarity Crow to Frog (i.e., the biggest outlier) is relatively large (recognized similarity equal to 0.57232 and standard deviation equal to 0.30661), which means that this similarity was not very clearly visible by the neural network.
- (e)
In the next step, the organism with the greatest recognized similarity (i.e., Frog) is removed from the set of organisms and the 5-layer neural network is taught using the remaining (eleven) organisms. After re-teaching, the removed organism (i.e., Frog) is recognized. The results of the recognition of Frog are presented in
Table 7.
- (f)
The organism with the greatest recognized similarity (i.e., Goldfish) is removed from the set of organisms and the 5-layer neural network is taught using the remaining (ten) organisms. After re-teaching, the removed organism (i.e., Goldfish) is recognized. The results of the recognition of Goldfish are presented in
Table 8.
- (g)
In the next step, the organism with the greatest recognized similarity (i.e., Worm) is removed from the set of organisms and the 5-layer neural network is taught using the remaining (nine) organisms. After re-teaching, the removed organism (i.e., Worm) is recognized. The results of the recognition of Worm are presented in
Table 9.
It is clear that, after this step, the line of organism development leads to Bacteria, which may indicate that the remaining organisms are located in other side branches (i.e., “side tracks” [
23]) of the evolutionary tree having a small similarity to Worm. The standard deviation associated with the recognized similarity to Bacteria (and also associated with the recognition of the other outliers) is relatively large (
Table 9), which may also indicate that the ANN is unable to unambiguously recognize this similarity. These conclusions were checked by phylogenetic tree generation (see the Validation of the Reconstructed Line of Organism Development by Phylogenetic Tree Generation Section) and also using the semihomology approach (
Table 10).
From
Table 10, it is evident that evolutionary distances between Worm and the organisms used to teach ANN in the last step of the method are very large, i.e., there are a very small number of “R” positions (i.e., positions with homologous comparisons) and large number of “-” positions (positions with two or three point mutations between codons of the compared amino acids), which confirms that the Worm recognition was correctly taken as the last step of the method.
Finally, the proposed method allowed for reconstructing the line of organism development from the most advanced to the most primitive organisms, as follows:
Homo sapiens, horses, birds, amphibians, fish, worms and bacteria. This line of development is in accordance with the latest scientific findings (see, for example, [
44]).
3.5. Structure of the Neural Networks in the Subsequent Steps of the Method
The number of neurons in the layers of the implemented 5-layer neural networks (calculated according to the geometric pyramid rule) for the 15, 14, 13, 12, 11, 10 and 9 organisms used for teaching the ANNs in the subsequent steps of the method is presented in
Table 11. The number of neurons in the layers, for example, for 12 organisms, is equal to: nbrInp = 525, nbrHid1 = 204, nbrHid2 = 79, nbrHid3 = 31, nbrOut = 12.
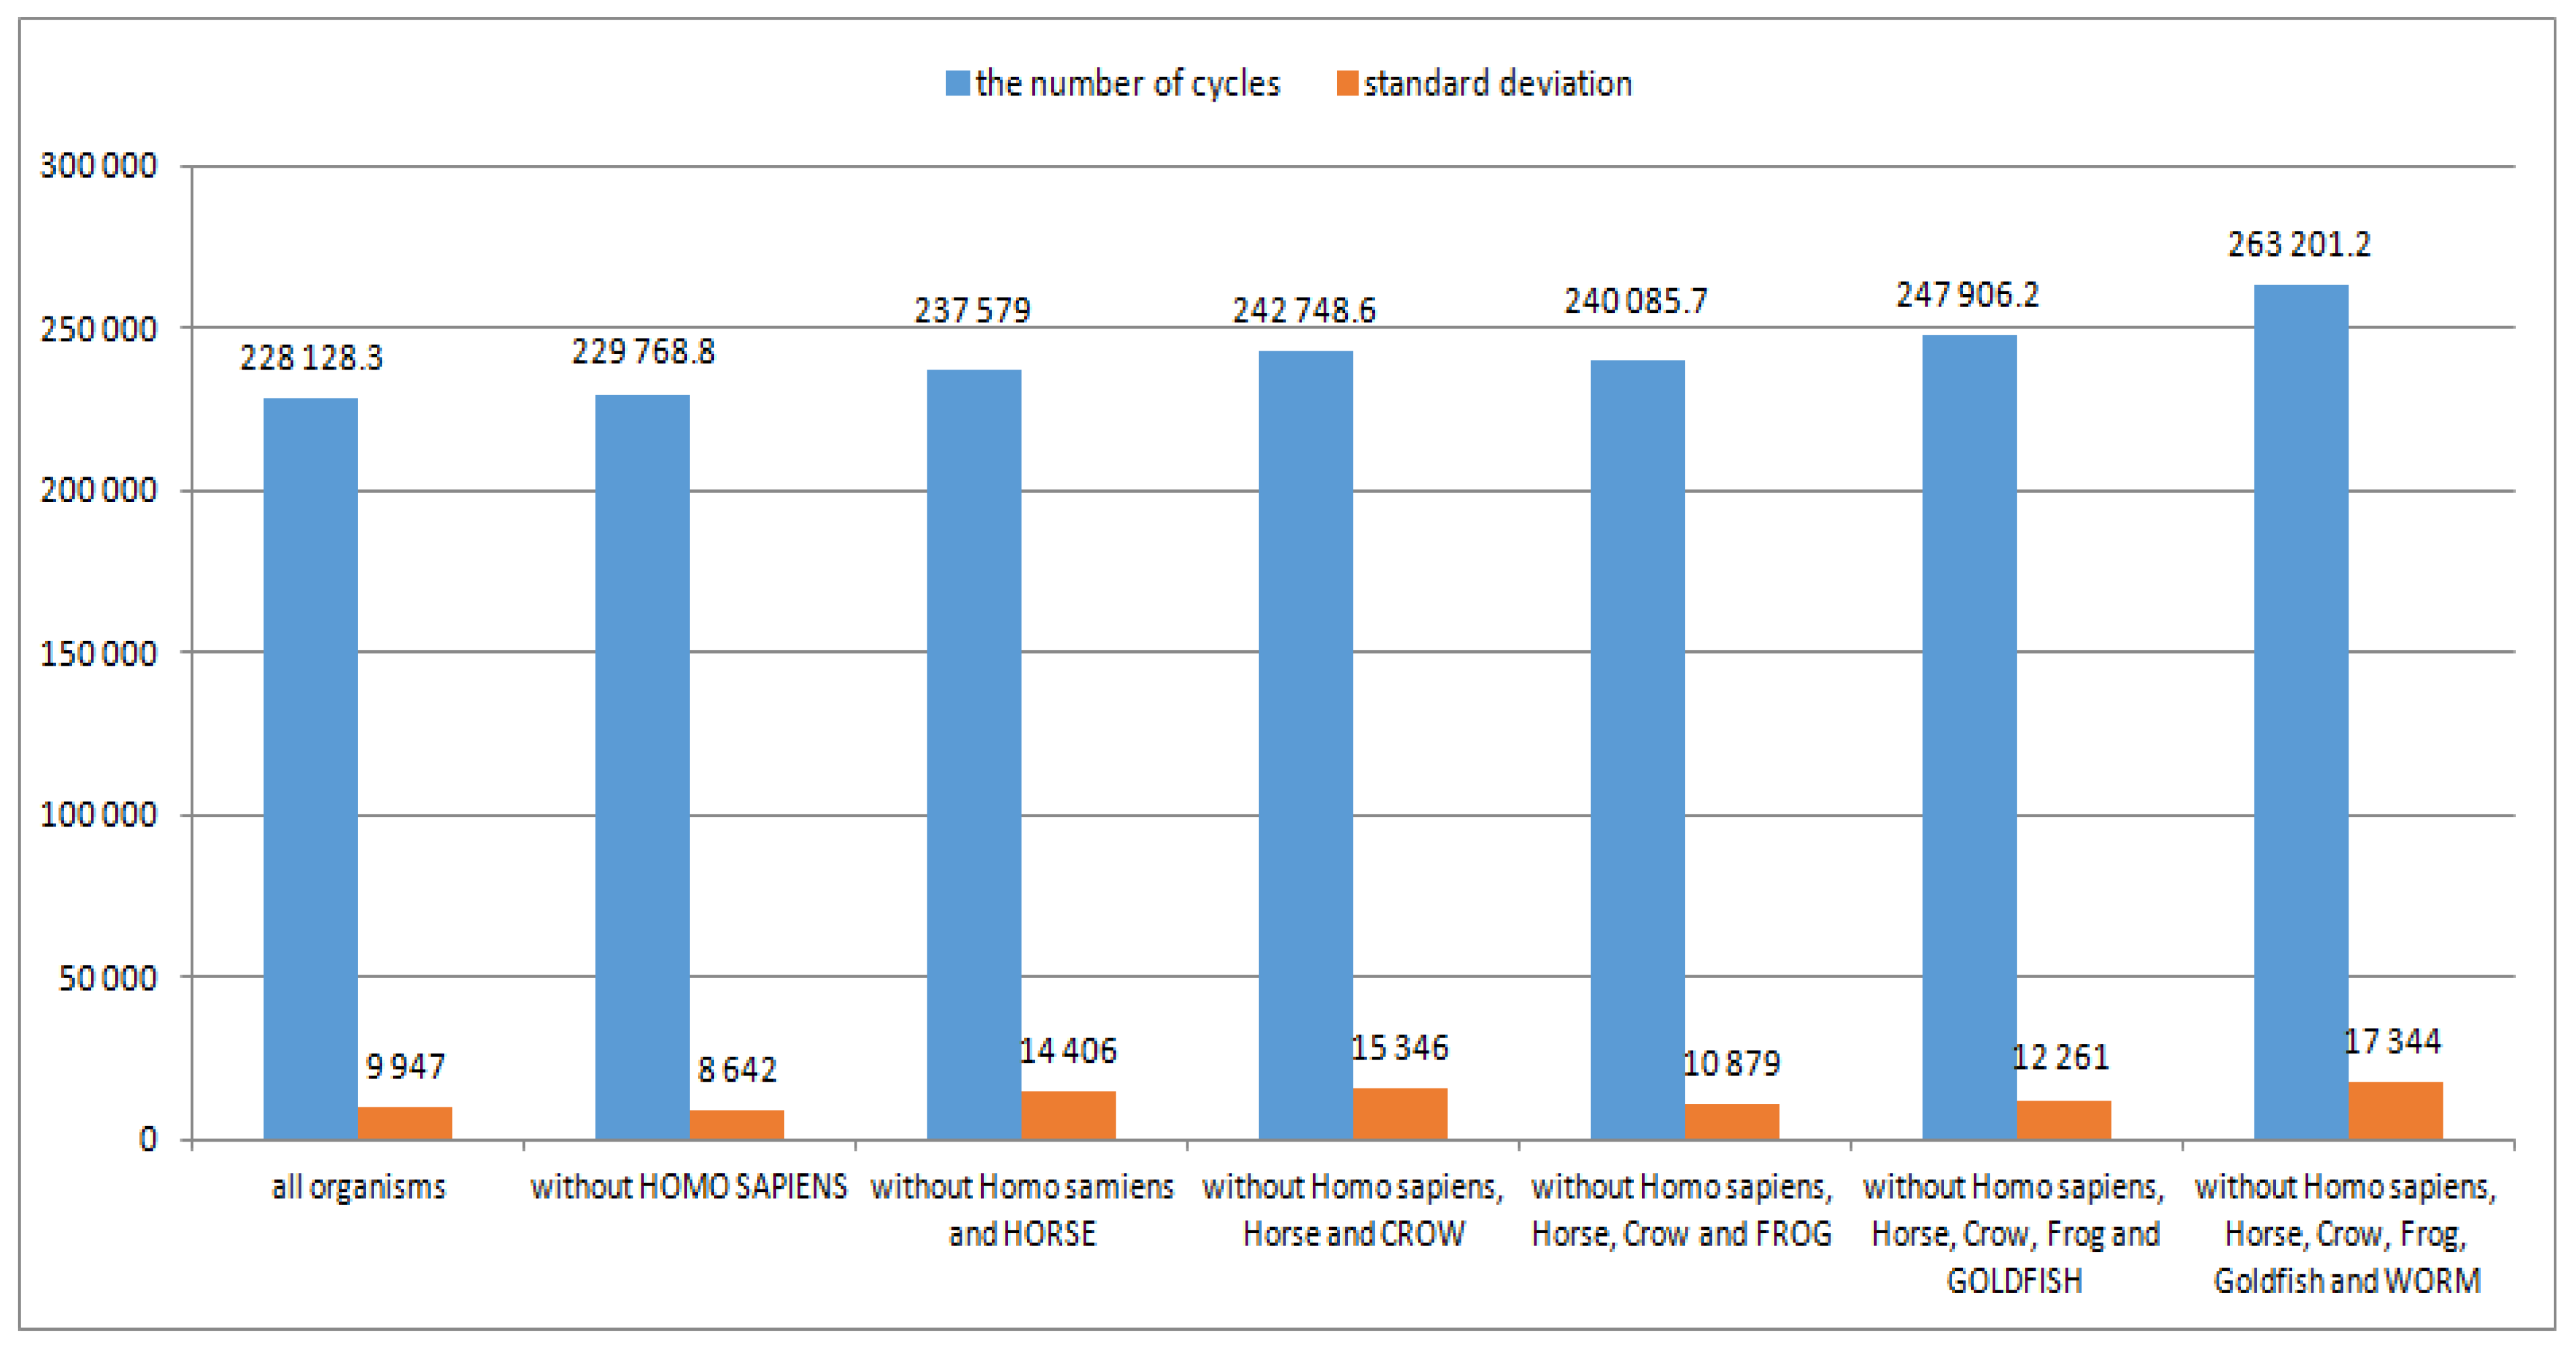
The average number of teaching cycles and standard deviations of the number of teaching cycles for processes of teaching the 5-layer neural networks are presented in
Figure 2.
Figure 2 shows that the removal of consecutive organisms from a set of organisms used to teach the ANNs does not have a significant effect on the number of teaching cycles and standard deviations, although after removing the 6th organism, a slightly greater increase in these two values is visible, which can also indicate (and confirm) that this step (i.e., Worm recognition) should be the last step of the method.
3.6. Validation of the Method of Penetrating Deep into Evolution
In this section, is presented how the result of the method of penetrating deep into evolution can be validated. The reconstructed line of organism development was validated by 2-, 3-, 4- and 5-layer ANNs taught using 15 organisms and by phylogenetic tree generation. A set of birds (see
Table A7 and
Table A10 in
Appendix A) and a set of amphibians and reptiles (see
Table A8 and
Table A11 in
Appendix A) were used for the validation.
3.6.1. Validation of the Reconstructed Line of Organism Development by Determining Timestamps for a Set of Birds
At the beginning, the reconstructed line of organism development was validated using a set of birds (see
Table A7 and
Table A10 in
Appendix A). In
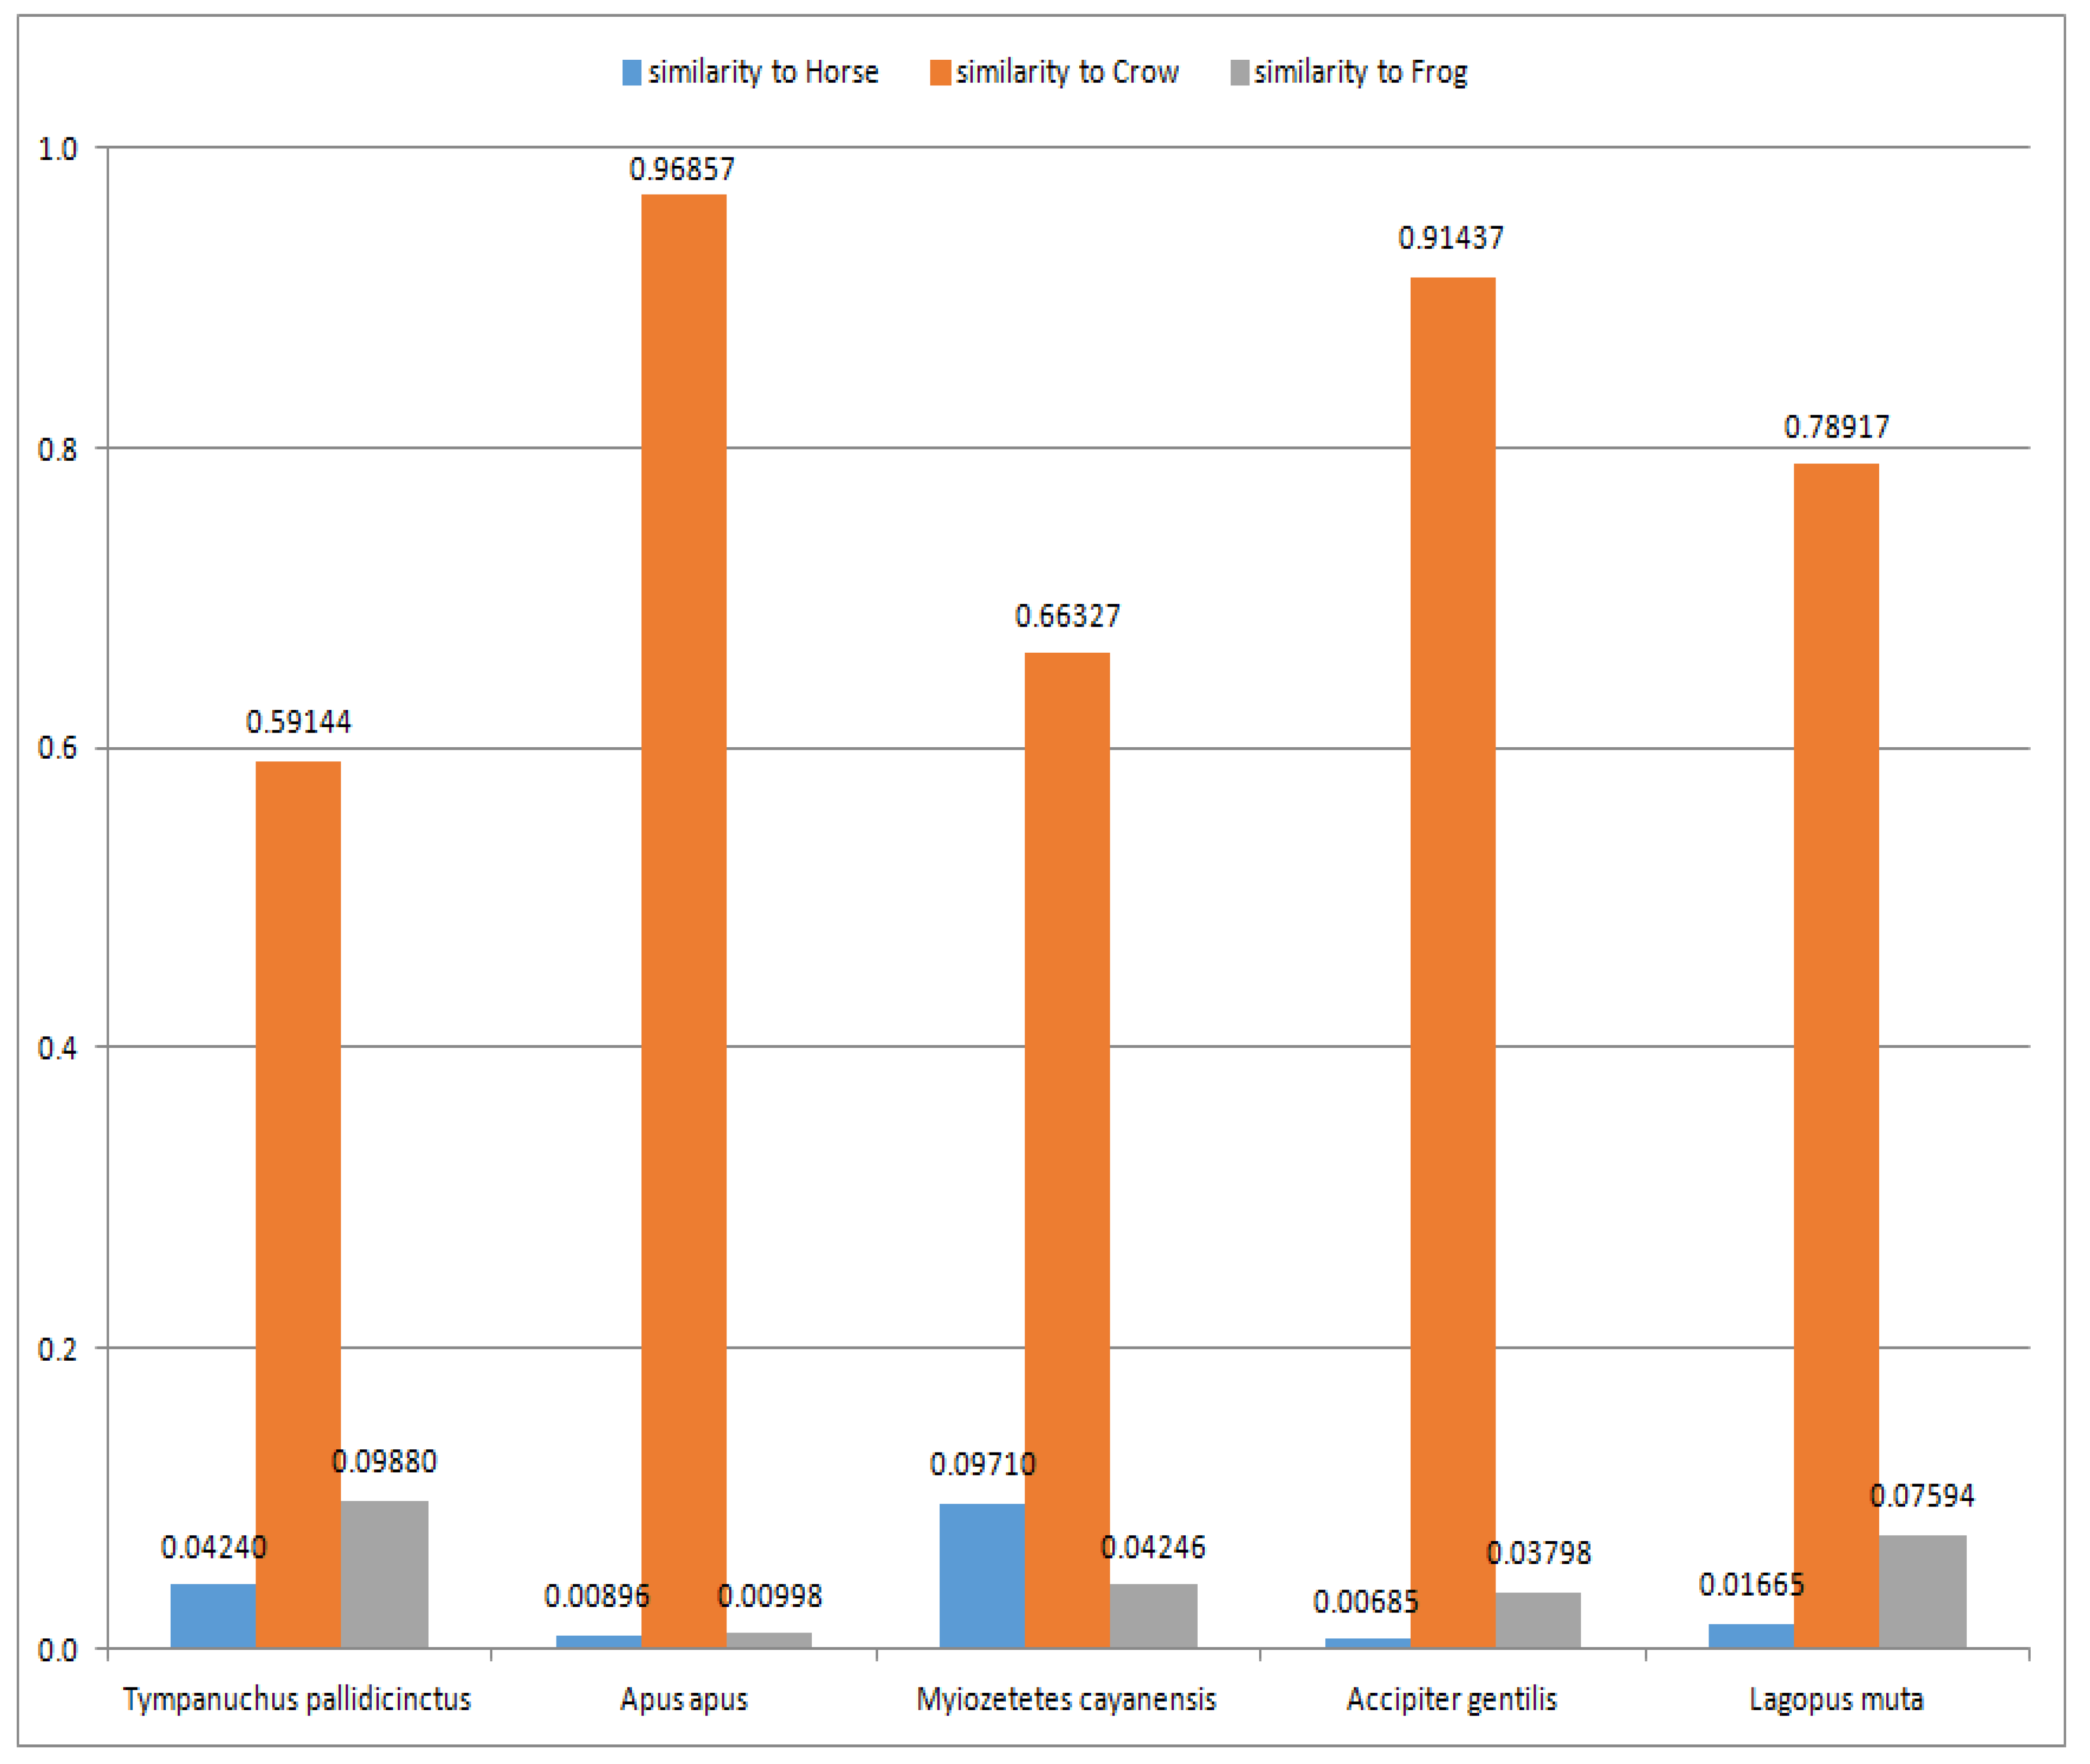
Figure 3, the average similarities (calculated as the arithmetic means of similarities recognized by the 2-, 3-, 4- and 5-layer ANNs) for the three recognized largest outliers (i.e., Horse, Crow and Frog) are presented. The other outliers presented in
Table A7 and
Table A10 (see
Appendix A) (i.e., Goldfish, Worm and Fly) are much smaller compared to Horse, Crow and Frog and, therefore, are not shown in
Figure 3 for readability. As it can be seen, the similarities of each bird (from the set of birds used for validation) are the most obvious to Crow (see
Table A7 in
Appendix A). The background similarities to Horse and Frog are also visible (see
Table A7 in
Appendix A), which confirms the correctness of this part of the reconstructed line of organism development, i.e., birds are evolutionarily between Horse and Frog.
3.6.2. Validation of the Reconstructed Line of Organism Development by Determining Timestamps for a Set of Amphibians and Reptiles
Next, the recognized line of organism evolution was validated using a set of amphibians (
Bufo gargarizans,
Bufo bufo and
Lithobates catesbeianus) and reptiles (
Pelodiscus sinensis and
Mauremys reevesii) (see
Table A8 and
Table A11 in
Appendix A). In
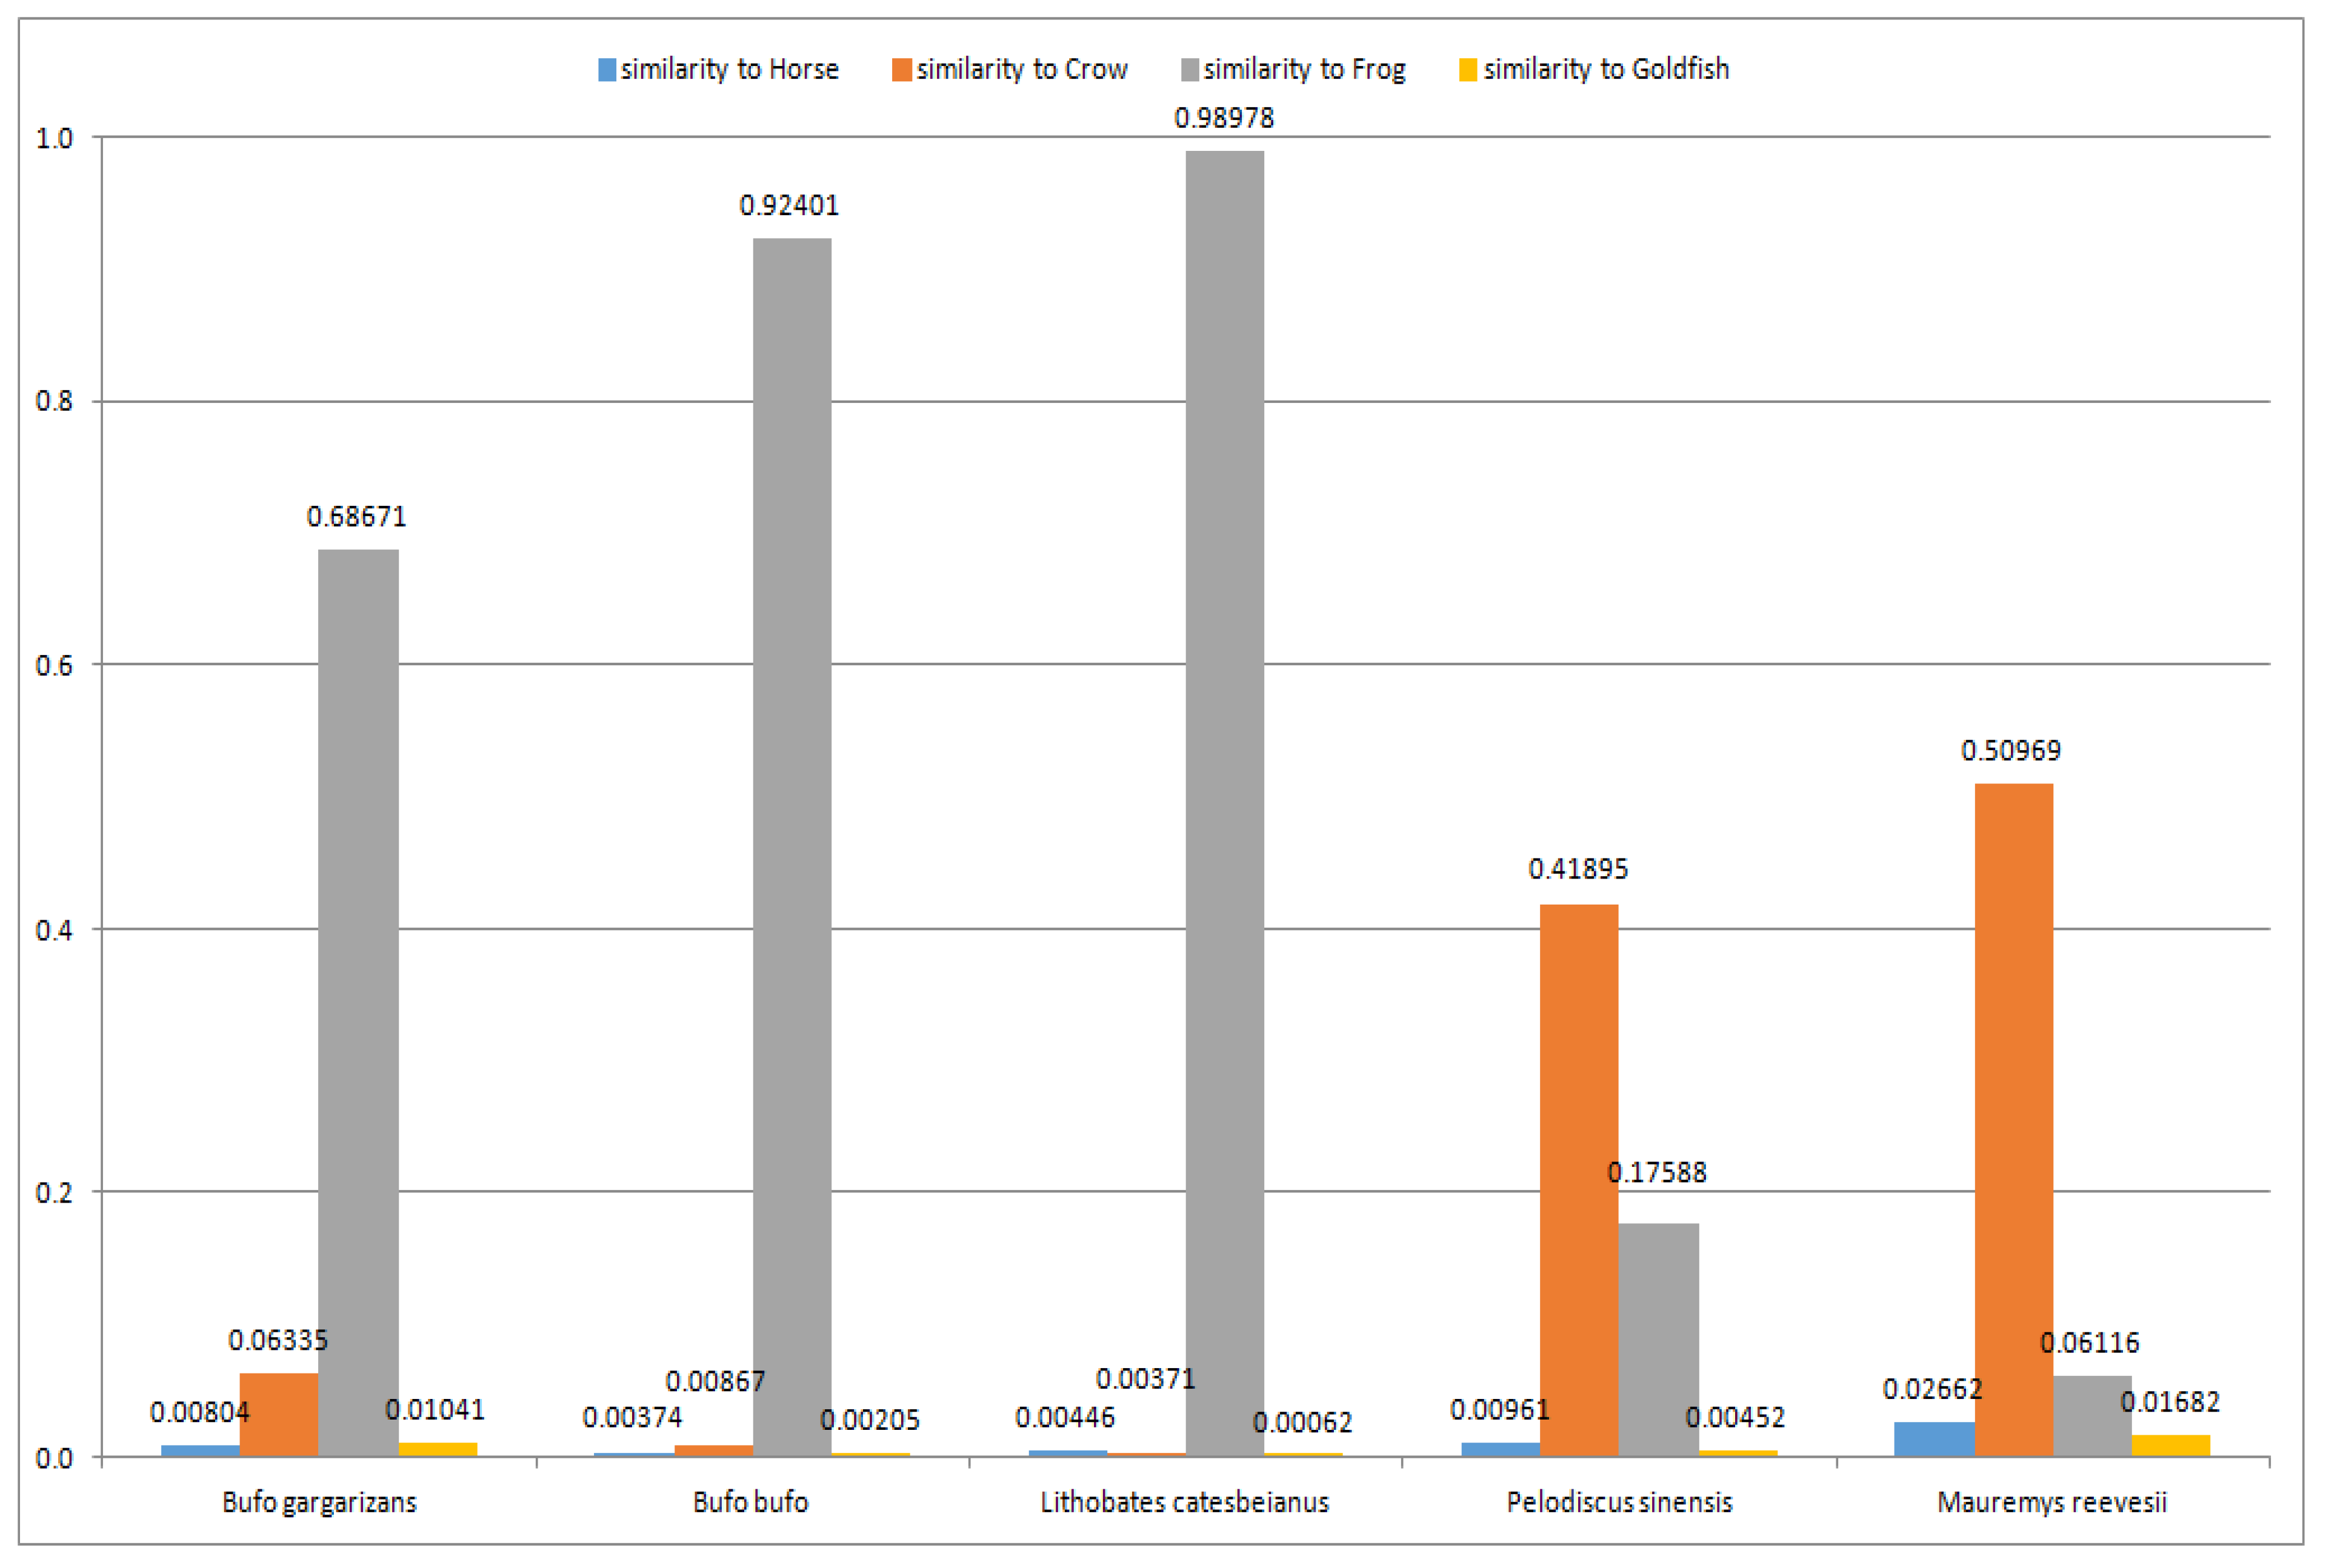
Figure 4, the average similarities (calculated as the arithmetic means of similarities recognized by the 2-, 3-, 4- and 5-layer ANNs) for the four recognized largest outliers (i.e., Horse, Crow, Frog and Goldfish) are presented. The four largest outliers (out of the five outliers presented in
Table A8 and
Table A11 in
Appendix A) are shown in
Figure 4 to ensure readability.
As it can be seen, the similarities of each amphibian (from the set of amphibians used for validation) are the greatest to Frog (see
Table A8 in
Appendix A). The background similarities to Horse, Crow and Goldfish are also visible (see
Table A8 in
Appendix A), which confirms the correctness of this part of the reconstructed line of organism development, i.e., amphibians are evolutionarily between birds and fish (this conclusion is also supported by other works [
44]). Moreover, it can be observed that reptiles (
Pelodiscus sinensis and
Mauremys reevesii) are evolutionarily between birds (Crow) and amphibians (Frog) (closer to Crow), which is in accordance with other authors [
44].
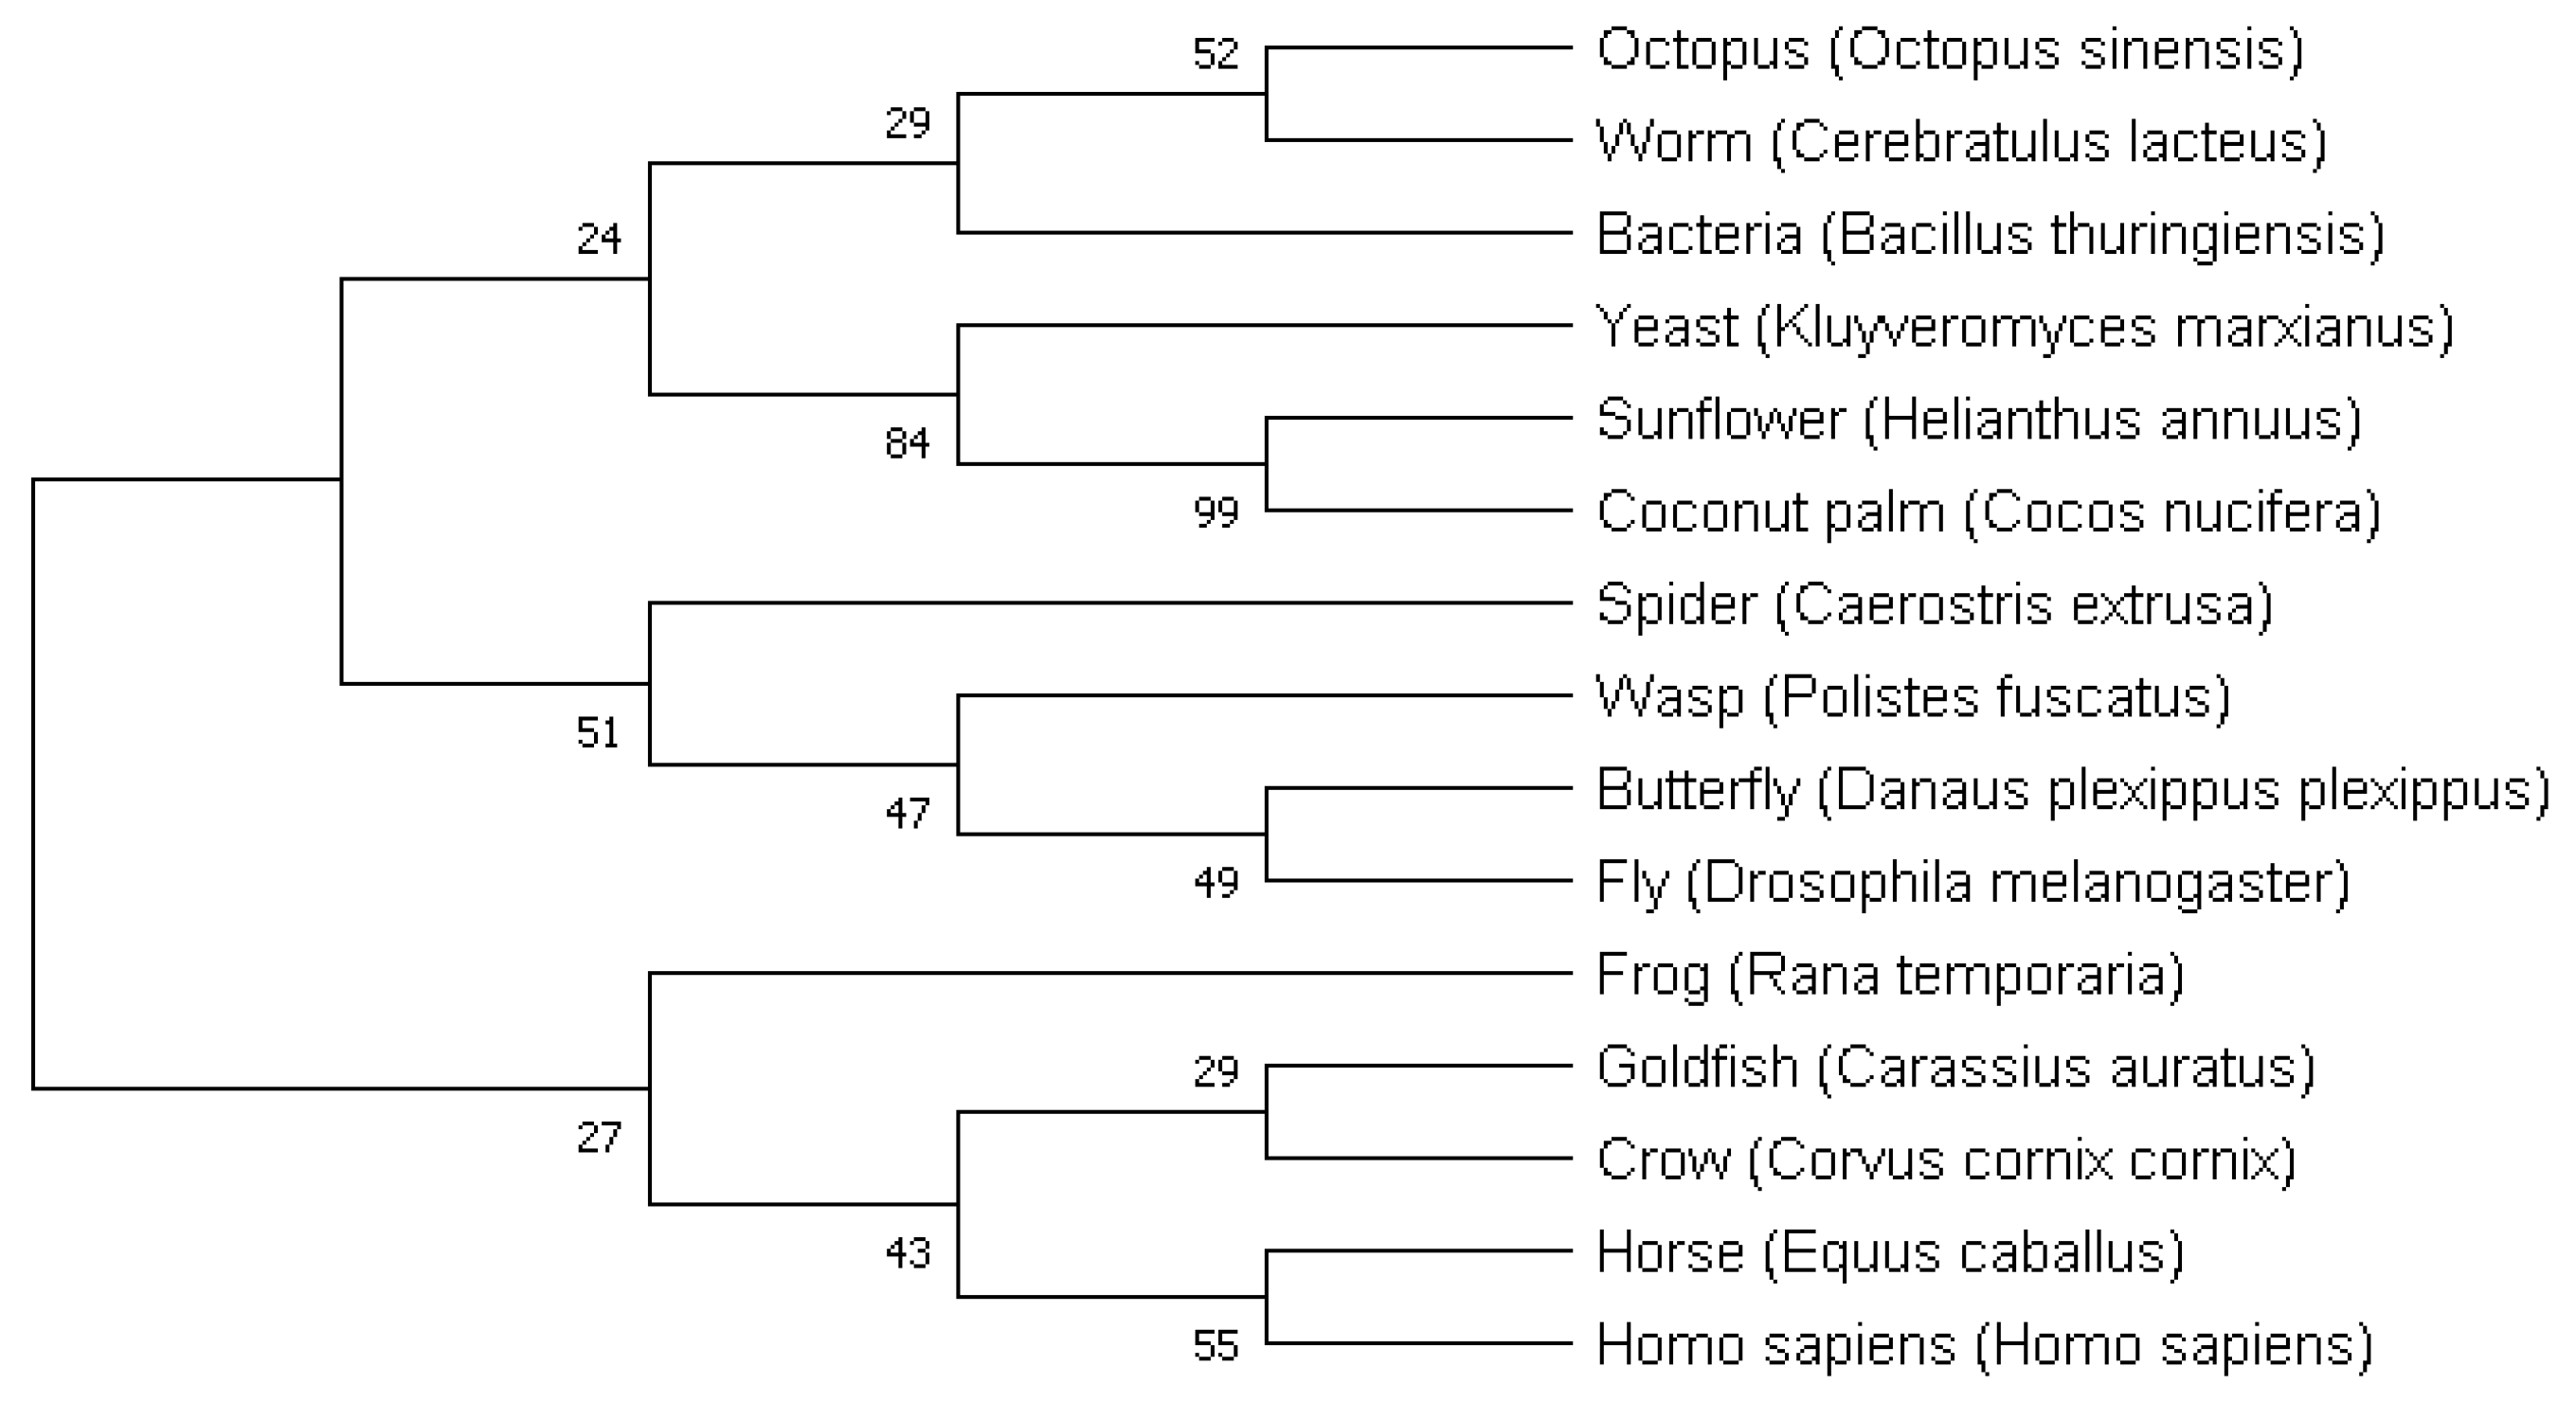
3.6.3. Validation of the Reconstructed Line of Organism Development by Phylogenetic Tree Generation
The reconstructed line of organism development was validated by phylogenetic tree generation. The trees were generated using the MEGA X program [
29]. The phylogenetic trees were generated for 15 organisms used for ANN teaching using the Maximum Likelihood (ML) method with Poisson correction [
45,
46]. This method was used because it is considered one of the most accurate and widely used methods for reconstructing phylogenetic trees [
46,
47]. The ML method approaches a phylogenetic tree from a probabilistic point of view and looks for a tree that maximizes the probability of observing a given set of sequences on the tree leaves [
46]. In this work, the bootstrap method with 1000 replications (
Figure 5) and 10,000 replications (i.e., maximum number of replications in the MEGA X program) (
Figure 6) was used to determine the reliability of the generated tree nodes. Trees were generated for different values of replications to check the effect of the number of replications on the reliability of the tree nodes.
Figure 5 and
Figure 6 show that the increase in the number of replications has not significantly affected the reliability of the tree nodes. Although the reliability of the tree nodes (for both 1000 and 10,000 replications) can hardly be considered satisfactory (see the Introduction for a possible cause), it is apparent that the most and the least developed organisms are
Homo sapiens and Bacteria, respectively. The closest organism to
Homo sapiens is Horse (from the organisms used for ANN teaching), which confirms the results obtained using the method of penetrating deep into evolution. Moreover, the closest organisms to Worm are Octopus and Bacteria, which is in accordance with the last step of the method of penetrating deep into evolution. Additionally, evolutionary relationships between Worm and Octopus can be confirmed by the works of other authors [
44,
48]. In accordance with the generated tree, Goldfish is the closest to Crow, but the reliability of common node between these two organisms has a reliability of only 26% (for 1000 replications) and 29% (for 10,000 replications), so it is difficult to trust this result. The method of penetrating deep into evolution allowed the determination of a result that fits better with the modern theory of evolution, i.e., Frog (as a representative of amphibians) is the closest to Crow (as a representative of birds) considering the organisms used to teach the ANNs, which is in accordance with the results of other authors (for example, [
23,
44,
49]).
The presented considerations show that the proposed method makes it possible to narrow down the area of considerations to the timestamp (i.e., set of recognized outliers) that was recognized in the each step of the algorithm (see the algorithm presented in the General Algorithm of Penetrating Deep Into Evolution Method and Reconstructing the Line of Organism Development Section). Travelling between genome attractors and narrowing down the area of considerations to the recognized timestamp (that contains only a small number of outliers comparing to the entire number of organisms) makes possible to obtain more reliable results compared to the reliability of the results obtained by generating phylogenetic trees. In the algorithms of phylogenetic tree generation (including the algorithms of the Neighbor Joining, Maximum Parsimony and Maximum Likelihood methods), the generated trees are evaluated on the basis of the evaluation of the trees as the whole, i.e., the generated trees are evaluated taking into account the entire sets of the nodes and branches [
50]. This means that, although the generated tree will meet the assumed criteria as a whole, locally, it may contain internal nodes of lower reliabilities (and this is exactly what was obtained when generating the tree using the Maximum Likelihood method in this work; see
Figure 5 and
Figure 6). In accordance with the information presented in the Introduction, an important factor related to lower reliability of the nodes is the impossibility of evaluating all possible trees for more organisms. The number of possible rooted trees (calculated for n organisms as (2n − 3)!/(2
n−2(s − 2)!)) for n = 15 (i.e., for the number of organisms considered in this article)) is equal to 213,458,046,676,875 [
51]. The number of trees grows very quickly with the increase in the number of organisms and, for n = 50, the number of possible rooted trees is greater than the number of atoms in the universe [
26]. This may indicate and also justify the need to narrow down the area of considerations in order to obtain a greater reliability when determining the course of evolution and reconstructing the line of organism development.
3.7. General Algorithm of the Method of Penetrating Deep into Evolution and Reconstructing the Line of Organism Development
In the light of the presented idea, the general algorithm of the method of penetrating deep into evolution and reconstructing the line of organism development is presented in the following steps:
- Step 1.
Set the organisms in random order.
- Step 2.
Teach the artificial neural network (ANN) using a full set of organisms.
- Step 3.
Recognize the evolutionary timestamp (i.e., recognize a set of outliers) by recognizing the similarity to Homo sapiens using the ANN.
- Step 4.
Add the organism represented by the biggest outlier to the list of organisms.
- Step 5.
If the maximal number of iterations is archived or a sufficiently primitive organism to finish the algorithm is added to the list, stop the algorithm.
- Step 6.
Remove the organism represented by the biggest outlier from the set of organisms.
- Step 7.
Teach the ANN using the reduced set of organisms.
- Step 8.
Recognize the evolutionary timestamp by recognizing the similarity to the removed organism using the ANN.
- Step 9.
Go back to Step 4.
As a result of executing this algorithm for a set of organisms, the created list will contain organisms written in the order from the most developed to the most primitive organisms.
4. Conclusions
This work showed that one of the features of evolutionary timestamps (i.e., a set of outliers recognized by an artificial neural network) is their transparency, which allows not only to determine the closest evolutionary organism but also to determine more distant organisms. In this article, it is presented that this feature allows for penetration deep into evolution. As a result, a general algorithm of penetrating deep into evolution was established, which allows to reconstruct the line of organism development from the most advanced to the most primitive organisms. It was also shown the way in which this line can be validated using, among others, recognized timestamps. Five-layer ANNs were used to demonstrate the application of the method of penetrating deep into evolution, for which the recognized similarities to the closest evolutionary organism were the greatest, as was demonstrated during validation. The work also showed that not only the number of homologous comparisons and length of identity fragments are important in determining the evolutionary relationships between organisms, but also the distribution of similarities between sequences (i.e., distribution of amino acids in the compared sequences). It is possible that lines reconstructed using the proposed method can be considered as main lines of development (i.e., lines that omit “side tracks” of development); however, this conclusion needs to be carefully corroborated in following works. Finding a way to reconstruct the line of organism development can be considered a great scientific challenge, so further continuation of this work is planned to confirm the effectiveness of the proposed method.
