Abstract
A four-node model is proposed to investigate the no-vent filling performance of liquid hydrogen (LH2) at microgravity. The no-vent filling method can directly prevent the influence of random gas–liquid distributions at microgravity, making it a good choice for cryogenic propellants to achieve orbital refueling. The typical phase distribution of the centrally located ullage was assumed and, in particular, the correlations for the boiling heat transfer of LH2 at microgravity were corrected in this model. After the accuracy of this model was effectively verified, the effects of different filling conditions, including the initial tank pressure, the initial temperature, and the temperature of the inlet liquid, were studied. The results showed that the initial pressure had a major influence on the initial pressure rise but only a slight influence on the final pressure development. A higher initial temperature would have led to an obvious increase in the tank pressure and an obvious decrease in the final filling level when reaching the upper pressure limit. Reducing the temperature of the inlet liquid has certain effects on the pressure control and the improvement of the final filling level. In conclusion, to achieve a higher filling level under a lower pressure level during the no-vent filling of LH2 at microgravity, sufficient pre-cooling of the filling system is required. Furthermore, appropriate evacuation of the receiver tank before filling and subcooling of the inlet liquid within an acceptable range of costs are both suggested. While the proposed model is less accurate than full-resolution CFD for the detailed evolution of physical fields, it offers much greater computational speed for quick parametric studies of key input conditions.
1. Introduction
Longer in-orbit operations and deeper space exploration have become important topics in space-technology development. The scope of space missions is now directly limited by the limited carrying capacities of rockets. If we continue to develop different, extremely heavy launch vehicles for various missions with greater demands on working time and flight distance, huge resistance will inevitably arise through new technical bottlenecks and the huge costs of development, manufacturing, transportation and launch. In the 1960s, the concept of the orbital refilling depot was proposed, and the refueling of spacecraft in-orbit has been regarded as a fundamental solution to break through the limitations of carrying capacity and exploration scope [1]. The use of orbital refueling technology could also make it possible to miniaturize spacecraft, shorten the preparation period, and reduce the cost of space missions [2]. Therefore, a large number of flight-test projects have been conducted to investigate and verify the key technologies for propellant orbit refueling, including Storable Fluid Management Demonstration (SFMD) [3], Fluid Acquisition and Resupply Experiment (FARE) [4], Vented Tank Resupply Experiment (VTRE) [5], Orbital Express (OE) [6] and EXPeriment for Liquid On-orbit Refueling (EXPLORE) [7]. Since its successful application on Salyut 6, the use of orbital refilling technology for storable propellants has become increasingly mature and is already a key foundation to maintain the long-term in-orbit operation of space stations [8].
Considering the high specific impulse and non-pollution of liquid hydrogen (LH2), the use of cryogenic propellants has become a better choice for the new generation of rockets, especially for the upper stages. Most of the heavy rockets in service and in development, such as CZ-5 and CZ-9 from China, Delta IV and SLS from America, and Ariane V and VI from Europe, all adopt the propellant couple of LH2 and liquid oxygen (LO2). Therefore, the orbital refilling of cryogenic propellants has also attracted close attention, and several schemes for the cryogenic depot have been designed for different mission requirements. For example, Goff et al. [9] reported a United Launch Alliance (ULA) disposable single-use LO2 depot based on the existing upper stage tanks, which could support missions such as Mars-sample return or Europa landers without the need to develop new heavy-lift vehicles (HLVs). Chandler et al. [10] introduced and compared 12 configurations of the cryogenic depot for LH2/LO2 that could refuel the Earth-departure stage (EDS) at low Earth orbit (LEO) to support lunar missions without upgrading the Ares I/Ares V commonality.
The orbital refilling of liquid propellants involves several key technologies, and a major challenge is to overcome the unstable gas–liquid distribution under microgravity conditions [2]. As shown in Figure 1, under ground conditions, clear phase separation can be achieved through the effect of gravity; thus it is easy to discharge or fill the liquid from the bottom of the tank bottom while pressurizing or venting the gas from the top of the tank. However, in orbital environments, the effect of gravity would become too weak to effectively separate the gas and liquid phases. Due to the uncertain phase distribution within the propellant tank under microgravity, it is quite difficult to guarantee the single-phase liquid acquisition from the supplier tank or the single-phase gas venting from the receiver tank without effective phase management, which would induce inefficiency in, and even the failure of the orbital transfer process.
Figure 1.
Schematic diagrams of the comparison between filling processes at normal and micro gravities: (a) ground conditions; (b) orbital conditions.
For storable propellants, membrane-bound tanks are widely used as simple and reliable tools for phase separation, in both the supplier and the receiver tanks [3,4]. However, they are no longer suitable for cryogenic propellants, since cryogenic liquid is extremely heat-sensitive and evaporation from the liquid side is inevitable, after which the liquid cannot be separated again by the membrane. Vaned tanks are also effective solutions for storable propellants to acquire liquid from supplier tanks and ensure the effective filling of receiver tanks [4,5]. By installing vanes around the liquid inlet/outlet, the effect of surface tension is given play to control the liquid in the vicinity of the vanes during the filling and draining processes. However, the feasibility of this method for cryogenic fluids is still doubtful due to the very low surface tension of cryogenic liquids, especially that of liquid hydrogen.
In order to realize the safe and efficient in-orbit transfer of cryogenic propellants, in addition to the many investigations that have been conducted to find new liquid-acquisition technologies from the supplier side [11,12], many studies have been devoted to improving the refilling efficiency within the receiver tank. In view of the special physical properties of cryogenic fluids, the concept of no-vent filling was proposed, which makes excellent use of the active-phase-transition characteristic of cryogenic fluids and completely removes the requirement of gas–liquid management at microgravity [13]. In no-vent filling, the gas-evacuation valve of the receiver tank remains closed during the entire filling process; thus, there is no longer a risk of venting with liquid during the orbital refueling. The tank pressure can be controlled to ensure that it does not exceed the vent-pressure limit during the no-vent filling process due to the appropriate condensation of the ullage region under appropriate conditions. Chato [14,15] carried out hydrogen-based no-vent filling tests for lightweight tanks measuring 2.01 m3 and 4.96 m3 and successfully verified the feasibility of this filling method for cryogenic fluids. At the same time, Moran et al. [16,17] also conducted ground tests for the no-vent filling of liquid hydrogen in smaller tanks, and they found that the tank pressure can be used as an indicator to reflect the filling progress. Furthermore, Anderson et al. [18] and Jones and Fesmire [19] mainly investigated the effect of the inlet structure on the no-vent filling performance, while Wang et al. [20,21] established the difference between vent and no-vent fillings and compared the effects of different tank placements on the no-vent filling performance through LN2 tests. Based on experimental results, Vaughan and Schmidt [22], Fite [23], and Sauter et al. [24] established the FILL model, the LUMPY model, and NVF model, respectively, to describe the no-vent bottom-filling performance. Regarding the no-vent filling of the top-filling or spray-filling mode, models named GDNVF and NVEQU were proposed by Honkonen et al. [25] and Taylor and Chato [26], respectively. Although a great deal of valuable theoretical and experimental research has been published on no-vent-filling technology on the ground, few studies have investigated no-vent-filling performance under microgravity. Considering the limitations of experimental techniques and the costs of flight tests on cryogenic fluids, several programs exploring the orbital transfer and refueling technology of cryogenic fluids have been stopped or remain at the planning or ground-test stage [27,28,29,30]. Wang et al. [31] developed an analytical model based on the thermodynamic-equilibrium method to predict the no-vent filling process at microgravity; however, their assumption that the ullage temperature would be cooled down immediately to the saturated temperature was unreasonable, especially under conditions in which there is a high initial temperature. Dominick and Tegart [32] used the CFD tool to predict the filling performances of a LH2 tank at microgravity, but only the phase distribution was exhibited and discussed in detail. In our previous work, the no-vent filling performances of a liquid hydrogen tank in terrestrial and in-orbit environments were simulated, and the effects of different filling conditions were compared [33]. Although the CFD method offers superiority in the display of the detailed physical-field distribution compared with experimental or theoretical methods, high costs are associated with the large amounts of time and computing resources are needed, which might make the simulation on the long-term filling of large-scale tanks unaffordable.
In conclusion, no-vent filling technology is of great importance to the development of orbital refilling, as well as future in-orbit depots for cryogenic propellants. In this paper, based on our previous numerical study, a computational four-node model is established to predict heat- and mass-transfer behaviors during no-vent filling at microgravity. This model is suggested as a quick and flexible tool to obtain the pressure development, filling time, and filling level during the orbital no-vent filling of tanks of scales and under different filling conditions, providing a reference for the design and control of orbital filling with cryogenic propellants.
2. Model Descriptions
2.1. Physical Model
The test tank in [16] was selected as the target, and its geometrical structure is shown in Figure 2. This tank is composed of a cylinder and two domes with a total inner volume of 34 L, a total internal height of 0.508 m, an inner diameter of 0.318 m. The tank wall is made of stainless steel 304 with a thickness of 3 mm. The bottom diffuser configuration is used for liquid injection. The inlet is located at a height of 30 mm from the tank bottom, with a width of 4 mm.
Figure 2.
Schematic diagram of the target LH2 tank.
2.2. Governing Equations
By comparing the existing analytical models of no-vent filling under ground conditions, the liquid–gas distribution was found to be a main factor determining the heat- and mass-transfer characteristics [22,23,24,25,26]. Due to the lack of orbital experimental data for cryogenic filling process, the numerical results of the same LH2 tank reported in our previous work [33] were taken as the references to illustrate the development of the phase field during no-vent filling at microgravity. At the acceleration level of 9.8 × 10⁻⁶ m∙s−2, the inlet configuration had a slight effect on the filling performance, since the inlet liquid always quickly reaches the tank wall without the constraint of gravity. Next, under the effect of surface tension, the liquid flows along and accumulates at the tank wall, generating the phase distribution of a liquid-wrapped central ullage [33]. According to these special characteristics of the phase distribution, the tank/fluid system is segregated into four distinct nodes, including the ullage, bulk liquid, liquid–ullage interface layer, and the tank wall. As shown in Figure 3, the inner tank wall is covered by liquid, and is not in contact with the ullage region during the filling process. In theory, without the influence of other factors, the ullage region should tend to be spherical due to the surface tension under zero gravity. Comprehensively considering the effect of tank structure, the interface of the central-located ullage is assumed to be of the same feathered shape as the tank in this model.
Figure 3.
Schematic diagram of the four-node model.
The mass and energy flows between the four regions are also marked in Figure 3. The conservation of energy for each node can be expressed as
If the tank pressure is lower than the saturated pressure of the inlet liquid, which might occur at the initial filling stage, the liquid flash should be considered. A flash coefficient is defined to calculate the flash ratio of the inlet liquid, and the temperatures of the inlet liquid and the flashed vapor are at the saturated temperature corresponding to the tank pressure [34].
With the volume change of the ullage during the filling process, the compression work takes place in the gas region, which can be calculated as
The liquid is assumed to be incompressible and the compression work on the liquid phase is neglected. At an arbitrary time t(i), the fluid nodes should meet the mass balance of
It should be noted that the node of the interface layer is assumed to only take part in the heat transfer. It always has no thickness or mass, and is at the saturated temperature corresponding to the tank pressure [22,23].
2.3. Heat-Transfer Models
In this model, the heat leakage from the environment is neglected and the outer wall of the tank is treated as an adiabatic boundary [31,32,33]. Therefore, only the heat transfer between the liquid and the wall and between the liquid and the gas is described further. The heat-transfer capacity and the temperature change of each node can be calculated by
2.3.1. Boiling-Heat-Transfer Model for Liquid–Wall
When the cold liquid comes into contact with the hot tank wall, boiling heat transfer inevitably occurs. Figure 4 shows the boiling curve of liquid hydrogen, which is different from that of most common fluids. In other words, common correlations of boiling heat transfer are probably not suitable for liquid hydrogen. Therefore, in order to predict the boiling heat transfer of liquid hydrogen precisely, a series of correlations derived from the experimental data on hydrogen are used, as listed in Table 1 [35].
Figure 4.
Schematic diagram of the typical boiling curve for liquid hydrogen.

Table 1.
Correlations of pool boiling for hydrogen [35].
Table 1.
Correlations of pool boiling for hydrogen [35].
| Regimes | Correlations |
|---|---|
| Onset of nucleate boiling (ONB) | |
| Nucleate boiling | |
| Critical heat flux (CHF) | |
| Transition boiling | |
| Leidenfrost | |
| Film boiling |
Considering that boiling behaves differently at different gravity levels, the corrections for microgravity conditions are also included [36]. Here, Equations (6), (8) and (10), listed in Table 1, are directly used for microgravity conditions, since the effect of gravity level is already taken into account. For nucleate boiling, the heat flux can be corrected by
where the empirical coefficient can be determined by
and the threshold acceleration can be solved by
The heat flux of film boiling at different accelerations, can be determined by
To realize the smooth transition between the nucleate and film-boiling regimes, the linear interpolation of Equation (9) continues to apply under microgravity conditions.
2.3.2. Convective Heat-Transfer Model for Liquid–Gas
As shown in Figure 3, three-node method (liquid, interface, and gas) is adopted to describe the heat-transfer behavior between the liquid and gas phases [24,25]. The heat fluxes from the liquid to the interface and from the interface to the ullage are calculated, respectively. The difference between these two heat fluxes further determines the amount of mass change induced by the liquid–gas heat-transfer process, as expressed in Equation (4).
At the initial stage of the filling, due to the significant disturbance caused by the high-speed inlet liquid, the relative motion between the liquid and gas phases is non-negligible. Therefore, forced-convection heat-transfer mechanism is used to describe the relatively strong heat transfer between liquid–interface and interface–gas [37]:
where
With the continuous injection of the liquid, the liquid region becomes more stable. When the disturbance caused by the inlet liquid attenuates to a very weak level, natural-convection mechanism is applied [37]. The heat-transfer coefficient can be calculated by
where
The diameter of the tank is taken as the characteristic length [12,31]. Regarding the transition stage from the forced convection to the natural convection, the Nusselt number can be obtained by
2.4. Model Verification
The model introduced above was compiled by MATLAB 2021a. All the properties of para-hydrogen were obtained by using the NIST Reference Fluid Properties Database (REFPROP) [38]. For the tank wall, the properties used s were obtained from the Material Properties DataBase (MPDB).
Owing to the unavailability of the orbital test data, the results predicted by the CFD model (the reliability verification of the CFD model based on three experiments under different no-vent filling conditions was introduced in detail in our previous work [33]) for microgravity conditions was taken as the benchmark to verify the current model. The filling conditions of the verification case are listed in Table 2.
Table 2.
Main parameters of the verification case.
Figure 5 shows the comparison of calculated and simulated tank-pressure responses. It can be seen that the calculated tank-pressure curve was in good agreement with the CFD results as a whole, with an average relative deviation of about 5.8%. The maximum deviation was about 28.8%, which occurred at the beginning stage (at around 5 s). On one hand, since the tank pressure was still low at the beginning, a small absolute error produced a large relative error. Another reason might be the different settings of the initial temperature field might be another reason. In the compared CFD model, the initial wall temperature was assumed to be a function of the height. However, in this model, an equivalent average temperature was set, since the tank wall was simplified into a node that could not reflect the two-dimensional temperature distribution. Therefore, at the beginning stage, the temperature of the wall area with which the liquid made contact in the CFD case was actually lower than the average temperature. In other words, the four-node model may have overestimated the corresponding heat transfer between liquid and wall, resulting in a higher pressure increase at the beginning stage. As the filling continued, although the initial temperature distribution was different, the overall thermal effect of the tank wall was equivalent and the tank pressures obtained by two models tended to be very close during the period from 30 s to about 80 s. Subsequently, the increasing rate of the calculating pressure was slower at the middle filling stage and became quicker at the end filling stage compared to the results of the CFD simulation. The calculated and simulated filling times corresponding to the upper pressure limit of 0.25 MPa were 194 s and 198 s, respectively. This small error of about 2% further demonstrates the accuracy of the proposed four-node model.
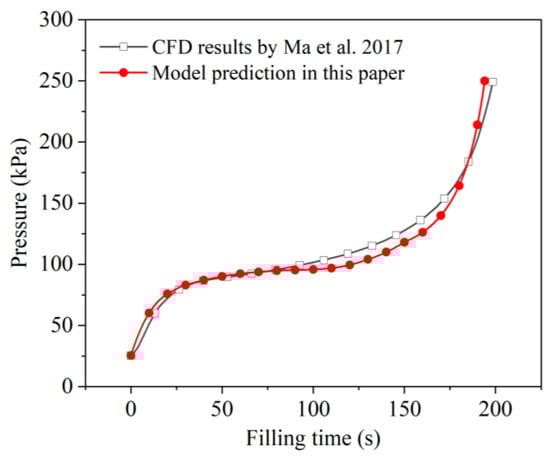
Figure 5.
Comparison of calculated and simulated pressure responses during the no-vent filling at microgravity [33].
The phase-change phenomenon, which was reflected by the mass difference between the total amount of injected liquid and the actually accumulated liquid mass, is also compared in Figure 6. Two curves present a similar trend of increase followed by decrease, with an average relative deviation of about 11.8%. During the early filling period, the increase in ∆m indicated the mass transfer from liquid phase to the gas phase as a whole. That is, due to the low initial pressure in the tank and the high temperature of the ullage and tank wall, the effects of liquid flash and evaporation were higher than that of condensation, which was consistent with the fast pressure rise during the corresponding period, depicted in Figure 5. It was also found that the slope of the calculated ∆m curve was slightly steeper than that of the simulation results at the beginning, indicating a greater phase-change intensity. This was also consistent with the faster pressure rise displayed by the initial calculation results (in Figure 5), analyzed above. Next, as the wall and ullage gradually cooled down, evaporation weakened and the effect of condensation became prominent, reflected by the drop in ∆m. Additionally, the drop rate of the calculated ∆m also increased, which coincided with the slower pressure rise compared to the CFD results in Figure 5.
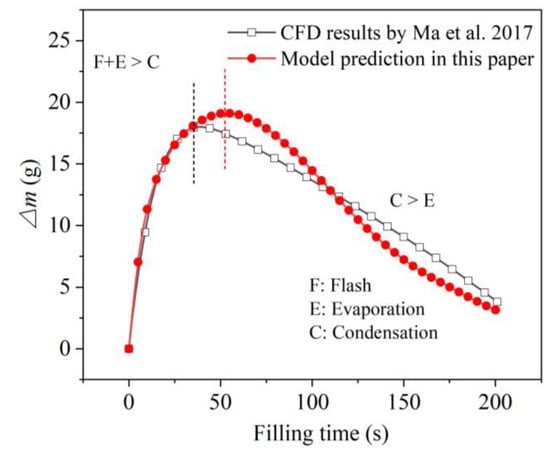
Figure 6.
Comparison of calculated and simulated phase-change amounts during the no-vent filling at microgravity [33].
Based on the comparative analysis above, it can be concluded that the four-node model proposed in this paper might be able to precisely predict the heat- and mass-transfer characteristics of the no-vent filling process under microgravity conditions. Another equally important indicator is that, for this verification case, the calculation time taken by the two-dimensional CFD model and this model were about one week and 10 min, respectively. In other words, this model can obtain the key data such as the pressure development much more quickly, with acceptable precision, compared to the CFD method.
3. Results and Discussion
In order to further investigate the orbital no-vent filling performance, sets of comparison calculations under different filling conditions were conducted and analyzed. The microgravity level was always set as 9.8 × 10⁻⁶ m/s2. The upper-pressure limit was set as 0.35 MPa. The upper limit of the filling level was 95%. Initially, the tank was filled with gaseous hydrogen at the same temperature as the tank wall.
Figure 7 displays the effect of the initial tank pressure on the pressure development during the no-vent filling. Five levels of initial tank pressure are compared, and the initial temperature of the tank wall, as well as the ullage, the temperature of the inlet liquid, and the filling flow rate were uniformly set at 50 K, 20 K, and 0.01 kg/s, respectively. It can be observed that, at the beginning stage, the initial tank pressure presented a significant influence on the tank-pressure development, since the tank pressure increased to a higher level based when the initial pressure was higher. However, except for the conditions with the lowest initial pressure, under which the pressure remained at the lowest level during the entire filling process, the initial pressure only had a slight influence on the pressure development at the middle and end filling stages. This can be further explained by the mass-change data in Figure 8.
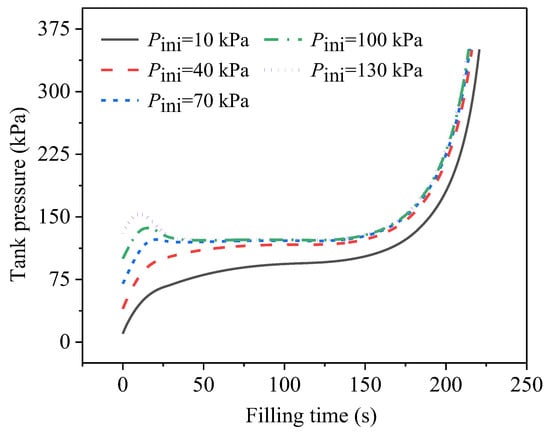
Figure 7.
Development of tank pressure during no-vent filling at different initial tank pressures.
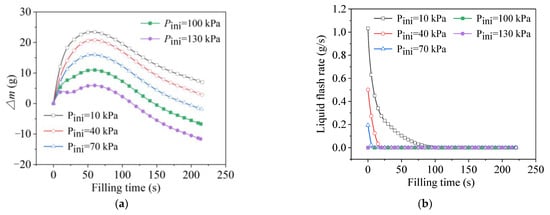
Figure 8.
Data of phase-change behavior at different initial tank pressures. (a) Trends of total phase change. (b) Trends of liquid flash.
As shown in Figure 8a, during the growth phase of ∆m, the slope was steeper at lower initial pressures, which was mainly because the flash intensity was higher at lower initial pressures. The saturated pressure corresponding to the 20-K inlet liquid was 93.4 kPa. According to Equation (2), the difference between the initial tank pressure and the saturated pressure corresponding to the inlet-liquid temperature (which was 93.4 kPa, corresponding to the 20 K of inlet liquid), the flash intensity was greater. As illustrated in Figure 8b, the intensity and the duration of the flash were both at their greatest when the initial pressure was at its lowest, while there was no liquid flash when the initial pressure was 100 kPa and 130 kPa. Although the mass-change amount decreased as the initial pressure increased, the ∆m always presented an increasing trend at the early filling stage in all the cases, indicating that the final phase-transition direction was liquid-phase evaporation. In other words, although the growth rates were different, the tank pressure always increased to a higher level when the initial value was higher. Moreover, the mass-change curve with the highest initial pressure showed a negative slope in the range of about 10–20 s, which was consistent with the pressure drop after the initial pressurization, as shown in Figure 7.
After about 60 s, the total mass-change amounts of all the cases adopted a downward trend, representing a shift in the final phase-transition direction towards gas-phase condensation. At this point, the slopes of all the ∆m curves were essentially the same, which was consistent with the small deviation among the pressure developments for all the cases analyzed above, in Figure 7.
Figure 9 displays the effect of the initial temperature on the pressure development during the no-vent filling. The initial temperatures of the tank wall and the ullage were set to be the same. The initial tank pressure, the temperature of the inlet liquid, and the filling-flow rate were uniformly set at 70 kPa, 20 K, and 0.01 kg/s, respectively. As the initial temperature increased, the tank pressure quickly increased to and always remained at a higher level, and then reached the upper pressure limit earlier. Due to the significant thermal effect of the hot tank wall, when the wall temperature was sufficiently high, a pressure peak occurred at the beginning, induced by the dramatic boiling of the liquid. As in the case with the initial temperature of 130 K, the pressure directly climbed to the upper limit at the very beginning, leading to a failure of the no-vent fill. With the increase in the initial temperature, the filling levels of the five cases when reaching the upper pressure limit were 88.8%, 81.0%, 63.6%, 52.9%, and 4.4%, respectively.
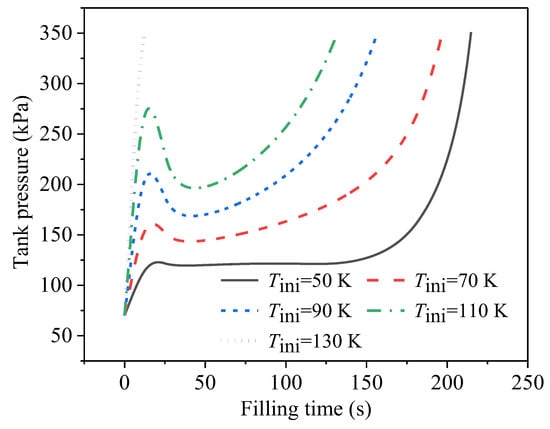
Figure 9.
Developments of tank pressure during no-vent filling at different initial temperatures.
Figure 10 shows the cooling processes of the tank wall and the ullage region during the no-vent fillings at different initial temperatures. It can be seen in Figure 10a that the tank wall was sufficiently cooled down to the liquid temperature in the two cases with the lowest and second-lowest initial temperatures. For the three remaining cases, on one hand, the tank wall stored more heat at a higher temperature. On the other hand, the cooling time was shorter since, the filling was terminated earlier at a higher initial temperature. Therefore, the higher the initial temperature of the tank, the less efficiently the wall cooled down.
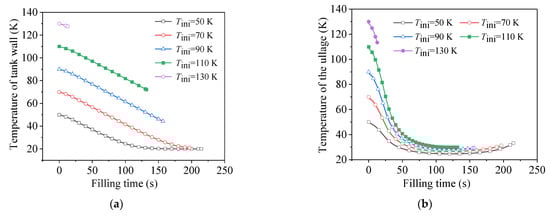
Figure 10.
Comparison of cooling behaviors at different initial temperatures. (a) Temperature change of tank wall. (b) Temperature change of ullage.
As shown in Figure 10b, except for the case with an initial temperature of 130 K, which quickly failed at the very beginning, the ullage region was sufficiently cooled down to the saturated temperature, corresponding to the local tank pressure, in the four remaining cases. Due to the low heat capacity of the gas phase, the heat-transfer enhancement between the liquid and gas phases caused by the larger temperature difference accelerated the cooling effect of the cold liquid on the hot ullage region. It was further observed that, at different initial temperatures, since the cooling rate was faster at higher initial temperatures, the times required for the ullage to cool down to the corresponding saturated state were relatively similar (in addition to the failure case). Subsequently, with the continuous increase in the tank pressure, as well as the effect of the compression work, the temperature of the ullage might have experienced a small recovery, after about 100 s.
Figure 11 displays the effect of the temperature of the inlet liquid on the pressure development during the no-vent filling. The initial tank pressure, the initial temperature of the tank wall, and the filling-flow rate were uniformly set at 70 kPa, 50 K, and 0.01 kg/s, respectively. The saturated temperature, corresponding to the initial pressure of 70 kPa, was 19.1 K. The five liquid temperatures compared here were lower than, equal to, and higher than the saturated values. The data in Figure 11 show that the influence rule was that the higher the temperature of the inlet liquid, the higher the tank pressure from the beginning to the end of the filling. A reasonable explanation for this is that the lower inlet-liquid temperature exerted weaker flash effects at the same initial pressure, resulting in a lower pressure rise at the beginning. Furthermore, lower inlet-liquid temperatures meant a higher degree of subcooling at the same pressure, as well as a higher heat-transfer-temperature difference with the same tank-wall temperature (or ullage temperature), indicating the higher heat-exchange ability of the cold inlet liquid to cool the wall and the ullage. For the case with the 17-K inlet liquid, due to the significant cooling effect of the cold liquid, the condensation of the ullage region was more intense in the heat- and mass-transfer processes between the gas and the liquid, leading to an obvious pressure decrease after the beginning stage. It can be seen in Figure 11 that, at the middle filling stage of Tin,l = 17 K, the tank pressure was even lower than the initial pressure level, indicating the significant effect of the inlet-liquid temperature on the tank-pressure development.
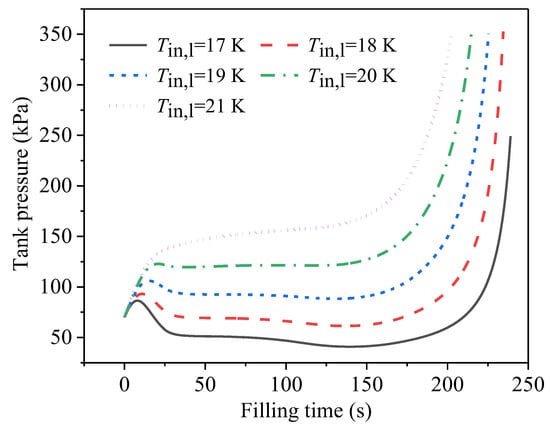
Figure 11.
Developments of tank pressure during no-vent filling at different temperatures of inlet liquid.
It should be noted that, in the four cases with higher inlet-liquid temperatures, the filling levels when the upper pressure limit was reached were 94.4%, 92.0%, 88.8%, and 85.0%, respectively. Furthermore, when the temperature of the inlet liquid was set at 17 K, the no-vent filling process reached the filling-level limit of 95% without breaking the upper pressure limit of 0.35 MPa used in this study.
4. Conclusions
In this paper, a computational four-node model aiming at the prediction of the no-vent filling performance of LH2 under microgravity was established. Comparative calculations were also conducted to investigate the effects of different filling conditions. The main conclusions are summarized as follows:
- Compared to the results of the CFD simulations of orbital no-vent fillings, the average deviations in the pressure development and mass change predicted by the proposed model were 5.8% and 11.8%, respectively. Therefore, the proposed four-node model was shown to have good precision in the prediction of mass- and heat-transfer behaviors and can quickly determine the pressure, as well as other performance parameters, during the no-vent filling of LH2 at microgravity.
- The initial pressure level has a significant effect on the beginning stage of the pressure development, in that higher initial pressures induce greater tank-pressure increases. Although it has a slight influence on the final pressure development when the initial pressure is higher than 40 kPa, in this case, the evacuation of the receiver tank is recommended, since the results show that the tank pressure can be kept at a lower level during the entire filling period if the initial pressure is sufficiently low.
- The initial temperature of the tank wall has a significant influence on the no-vent filling process. As the initial temperature increases, the pressure rise increases significantly, and the filling level when the upper pressure limit is reached decreases obviously. To prevent the rapid failure of the filling at the beginning stage, and to achieve a higher filling level under lower pressure, sufficient pre-cooling of the receiver tank is necessary.
- It is suggested to increase the subcooled degree of the inlet liquid within an acceptable range of costs. The use of an inlet liquid at a lower temperature offers higher heat-exchange capability with which to cool the wall and the ullage, achieving a higher filling level under lower pressure.
Author Contributions
Conceptualization, Y.M. and Y.L.; methodology, Y.M. and X.L.; software, Y.M.; formal analysis, Y.M.; writing—original draft preparation, Y.M. and Y.Z.; writing—review and editing, Y.Z., X.L. and F.X.; supervision, Y.Z. and X.L.; funding acquisition, Y.M. and F.X. All authors have read and agreed to the published version of the manuscript.
Funding
This research was funded by National Natural Science Foundation of China, grant number 51906194, and China Postdoctoral Science Foundation, grant number 2021T140538.
Data Availability Statement
Not applicable.
Conflicts of Interest
The authors declare no conflict of interest.
Nomenclature
| A contact area, m2 | |
| a | acceleration, m/s2 |
| cp | specific heat, J/(kg∙K) |
| Gr | Grashof number, - |
| g | gravity acceleration, m/s2 |
| h | enthalpy, J/kg |
| hfg | latent heat, J/kg |
| k | heat-transfer coefficient, W/(m2∙K) |
| l | characteristic length, m |
| m | mass, kg |
| mass flux, kg/s | |
| Nu | Nusselt number, - |
| p | pressure, Pa |
| Pr | Prandtl number |
| Q heat-exchange capacity, W | |
| q | heat-exchange flux, W/m2 |
| Re | Reynolds number, - |
| t | time, s |
| dt | time step, s |
| T | temperature, K |
| u | internal energy, J/kg |
| V | volume, m3 |
| v | velocity, m/s |
| wlg | compression work, W |
| Greek symbols | |
| αv | expansion coefficient, K−1 |
| ∆m | mass difference, kg |
| ∆T temperature difference, K | |
| η | flash coefficient, - |
| λ | thermal conductivity, W/(m∙K) |
| μ | dynamic viscosity, Pa∙s |
| ρ | density, kg/m3 |
| 𝜎 | surface tension, N/m |
| Subscripts | |
| CHF | critical heat flux |
| cr | critical state |
| fb | film boiling |
| fc | forced convection |
| g | gas phase |
| in | inlet fluid |
| ig | from interface to gas |
| L | Leidenfrost |
| l | liquid phase |
| lg | from liquid to gas |
| li | from liquid to interface |
| wl | from tank wall to liquid |
| nb | nucleate boiling |
| nc | natural convection |
| ONB | onset of nucleate boiling |
| sat | saturated state |
| t | tank |
| tb | transition boiling |
| w | wall |
References
- Morgan, L. Orbital tanker designs and operational modes for orbit launch programs. In Proceedings of the 2nd Annual Meeting, San Francisco, CA, USA, 30 May 1965. [Google Scholar]
- Chato, D.J. Technologies for refueling spacecraft on-orbit. In Proceedings of the AIAA Space 2000 Conference and Exposition, Long Beach, CA, USA, 19–21 September 2000. [Google Scholar]
- Kirkland, Z.; Tegart, J. On-orbit propellant resupply demonstration. In Proceedings of the 20th AIAA/SAE/ASME Joint Propulsion Conference, Cincinnati, OH, USA, 11–13 June 1984. [Google Scholar]
- Tegart, J.R.; Driscoll, S.L.; Hastings, L.J. Fluid Acquisition and Resupply Experiments on Space Shuttle Flights STS-53 and STS-57; NASA/TP-2011-216465; Huntsville, AL, USA, 1 April 2011. Available online: https://ntrs.nasa.gov/citations/20110011736 (accessed on 20 March 2023).
- Chato, D.J.; Martin, T.A. Vented tank resupply experiment: Flight test results. J. Spacecr. Rocket. 2006, 43, 1124–1130. [Google Scholar] [CrossRef]
- Friend, R.B. Orbital express program summary and mission overview. In Sensors and Systems for Space Applications II; International Society for Optics and Photonics: Bellingham, WA, USA, 2008. [Google Scholar]
- Hill, C.; Schlutz, J.; Fink, A.; Weppler, J.; Schelling, R.; Nathanson, E. Explore: Technology and process demonstration for orbital refuelling on a sounding rocket. In Proceedings of the 20th Symposium on European Rocket and Balloon Programmes and Related Research, Hyère, France, 22–26 May 2011. [Google Scholar]
- Smitherman, D.; Woodcock, G. Space transportation infrastructure supported by propellant depots. In Proceedings of the AIAA Space 2011 Conference and Exposition, Online, 14 June 2011. [Google Scholar]
- Goff, J.A.; Kutter, B.F.; Zegler, F.; Marchetta, J.; Kutter, B.; Chandler, F. Realistic near-term propellant depots: Implementation of a critical spacefaring capability. In Proceedings of the AIAA SPACE 2009 Conference & Exposition, Pasadena, CA, USA, 5–8 January 2009. [Google Scholar]
- Chandler, F.; Bienhoff, D.; Cronick, J.; Grayson, G. Propellant depots for earth orbit and lunar exploration. In Proceedings of the AIAA SPACE 2007 Conference & Exposition, Long Beach, CA, USA, 18–20 September 2007. [Google Scholar]
- Hartwig, J.W. Propellant Management devices for low-gravity fluid management: Past, present, and future applications. J. Spacecr. Rocket. 2017, 54, 1–17. [Google Scholar] [CrossRef]
- Ma, Y.; Li, Y.Z.; Li, J.; Ren, J.; Wang, L. Simulation on vertical wicking behaviors of liquid hydrogen within metallic weaves in terrestrial and microgravity environments. Int. J. Hydrogen Energy 2020, 45, 4910–4921. [Google Scholar] [CrossRef]
- Chato, D.J. Cryogenic fluid transfer for exploration. Cryogenics 2008, 48, 206–209. [Google Scholar] [CrossRef]
- Chato, D.J. Ground testing for the no-vent fill of cryogenic tanks: Results of tests for a 71 cubic foot tank. In Proceedings of the Joint Propulsion Conference and Exhibit, Monterey, CA, USA, 28–30 June 1993. [Google Scholar]
- Chato, D.J. Analysis of the Nonvented Fill of a 4.96-Cubic-Meter Lightweight Liquid Hydrogen Tank. NASA TM-102039, 5 Augut 1989. Available online: https://ntrs.nasa.gov/citations/19890013281 (accessed on 1 March 2023).
- Moran, M.E.; Nyland, T.W.; Driscoll, S.L. Hydrogen No-Vent Fill Testing in a 1.2 Cubic Foot (34 liter) Tank. NASA TM-105273, 1 October 1991. Available online: https://ntrs.nasa.gov/citations/19920004183 (accessed on 1 March 2023).
- Moran, M.E.; Nyland, T.W. Hydrogen No-Vent Fill Testing in a 5 Cubic Foot (142 Liter) Tank Using Spray Nozzle and Spray Bar Liquid Injection; Semantic Scholar: Seattle, CA, USA, 1992. [Google Scholar]
- Anderson, J.E.; Czysz, P.M.; Fester, D.A. No-vent fill testing of liquid hydrogen. In Advances in Cryogenic Engineering; Springer: New York, NY, USA, 1991. [Google Scholar]
- Jones, J.; Fesmire, J.E. Quick cooling and filling through a single port for cryogenic transfer operations. In Proceedings of the Advances in Cryogenic Engineering: Proceedings of the Cryogenic Engineering Conference-CECF, Online, 19–23 July 2002. [Google Scholar]
- Wang, C.L.; Li, Y.; Wang, R.S. Performance comparison between no-vent and vented fills in vertical thermal-insulated cryogenic cylinders. Exp. Therm. Fluid Sci. 2011, 35, 311–318. [Google Scholar] [CrossRef]
- Wang, C.L.; Wang, R.S. The effect of vertical and horizontal placement on no-vent fill of cryogenic insulated vessels. Cryogenics 2010, 50, 480–485. [Google Scholar] [CrossRef]
- Vaughan, D.A.; Schmidt, G.R. Analytical modeling of no-vent filling process. J. Spacecr. 1991, 2, 574–579. [Google Scholar] [CrossRef]
- Fite, L.W. Characteristics of Nonvented Propellant Transfer; Memphis State University: Memphis, TN, USA, 1993. [Google Scholar]
- Sauter, D.R.; Hochstein, J.I.; Fite, L.W. Computational Modeling of Cryogenic Propellant Resupply. In Proceedings of the 44th AIAA Aerospace Sciences Meeting and Exhibit, Online, 9–12 January 2006. [Google Scholar]
- Honkonen, S.C.; Bennett, F.O.; Hepworth, H.K. An analytical model for low-gravity tank chilldown and no-vent fill: The general dynamics no-vent fill program (GDNVF). In Proceedings of the 26th Thermophysics Conferences, Honolulu, Hawaii, USA, 24-26 June 1991. [Google Scholar]
- Taylor, W.J.; Chato, D.J. Comparing the results of an analytical model of the no-vent filling process with no-vent fill test results for a 496 m3 (175 ft3) tank. In Proceedings of the 28th Joint Propulsion Conference and Exhibit, Hartford, CT, USA, 6–8 July 1992. [Google Scholar]
- Arif, H. Preliminary thermal design of the COLD-SAT spacecraft. In Proceedings of the 26th Thermophysics Conference; AIAA-91-1305, Honolulu, HA, USA, 4–26 June 1991. [Google Scholar]
- Meyer, M.; Motil, S.; Kortes, T.; Taylor, W.; McRight, P. Cryogenic Propellant Storage and Transfer Technology Demonstration for Long Duration in-Space Missions. Cleveland: Glenn Research Center. NASA/TM-217642, 2012. Available online: https://ntrs.nasa.gov/citations/20120009208 (accessed on 1 March 2023).
- Gravlee, M.; Kutter, B.; Mclean, C.; Marquardt, J. Cryogenic Orbital Testbed (CRYOTE) development status. Cryogenics 2012, 52, 231–235. [Google Scholar] [CrossRef]
- Meyer, M.L.; Doherty, M.P.; Moder, J.P. Technology Maturation in Preparation for the Cryogenic Propellant Storage and Transfer (CPST) Technology Demonstration Mission (TDM); Space Propulsion; European Space Agency: Cologne, Germany, 2014. [Google Scholar]
- Wang, L.; Li, Y.Z.; Zhang, F.N.; Ma, Y. Performance analysis of no-vent filling process for liquid hydrogen tank in terrestrial and on-orbit environments. Cryogenics 2015, 7, 55–61. [Google Scholar]
- Dominick, S.; Tegart, J. Fluid dynamics and thermodynamics of a low gravity liquid tank filling method. In Proceedings of the AIAA Aerospace Sciences Meeting, Reno, NV, USA, 8–11 January 1990. [Google Scholar]
- Ma, Y.; Li, Y.Z.; Zhu, K.; Wang, Y.; Wang, L.; Tan, H. Investigation on no-vent filling process of liquid hydrogen tank under microgravity condition. Int. J. Hydrogen Energy 2017, 42, 8264–8277. [Google Scholar] [CrossRef]
- Wang, C.; Li, Y.; Deng, D.; Wang, R.; Xie, G. Performance model of the top filling configurations for no-vent fills. J. Thermophys. Heat Transf. 2011, 25, 140–146. [Google Scholar] [CrossRef]
- Wang, L.; Li, Y.Z.; Zhang, F.N.; Xie, F.S.; Ma, Y. Correlations for calculating heat transfer of hydrogen pool boiling. Int. J. Hydrogen Energy 2016, 41, 17118–17131. [Google Scholar] [CrossRef]
- Wang, L.; Kang, Z.; Xie, F.S.; Ma, Y.; Li, Y.Z. Prediction of pool boiling heat transfer for hydrogen in microgravity. Int. J. Heat Mass Transf. 2016, 94, 465–473. [Google Scholar] [CrossRef]
- Yang, S.M.; Tao, W.Q. Heat transfer. High. Educ. Press 2006, 5, 379–533. (In Chinese) [Google Scholar]
- NIST, Chemistry, WebBook. NIST Standard Reference Database Number 69. October 2011 Release. Available online: http://webbook.nist.gov/chemistry/ (accessed on 1 October 2011).
Disclaimer/Publisher’s Note: The statements, opinions and data contained in all publications are solely those of the individual author(s) and contributor(s) and not of MDPI and/or the editor(s). MDPI and/or the editor(s) disclaim responsibility for any injury to people or property resulting from any ideas, methods, instructions or products referred to in the content. |
© 2023 by the authors. Licensee MDPI, Basel, Switzerland. This article is an open access article distributed under the terms and conditions of the Creative Commons Attribution (CC BY) license (https://creativecommons.org/licenses/by/4.0/).