
Effect of the Mixer Design Parameters on the Performance of a Twin Paddle Blender: A DEM Study


Abstract
1. Introduction
2. Modelling and Simulations
2.1. Discrete Element Method (DEM)
2.2. Simulation Conditions
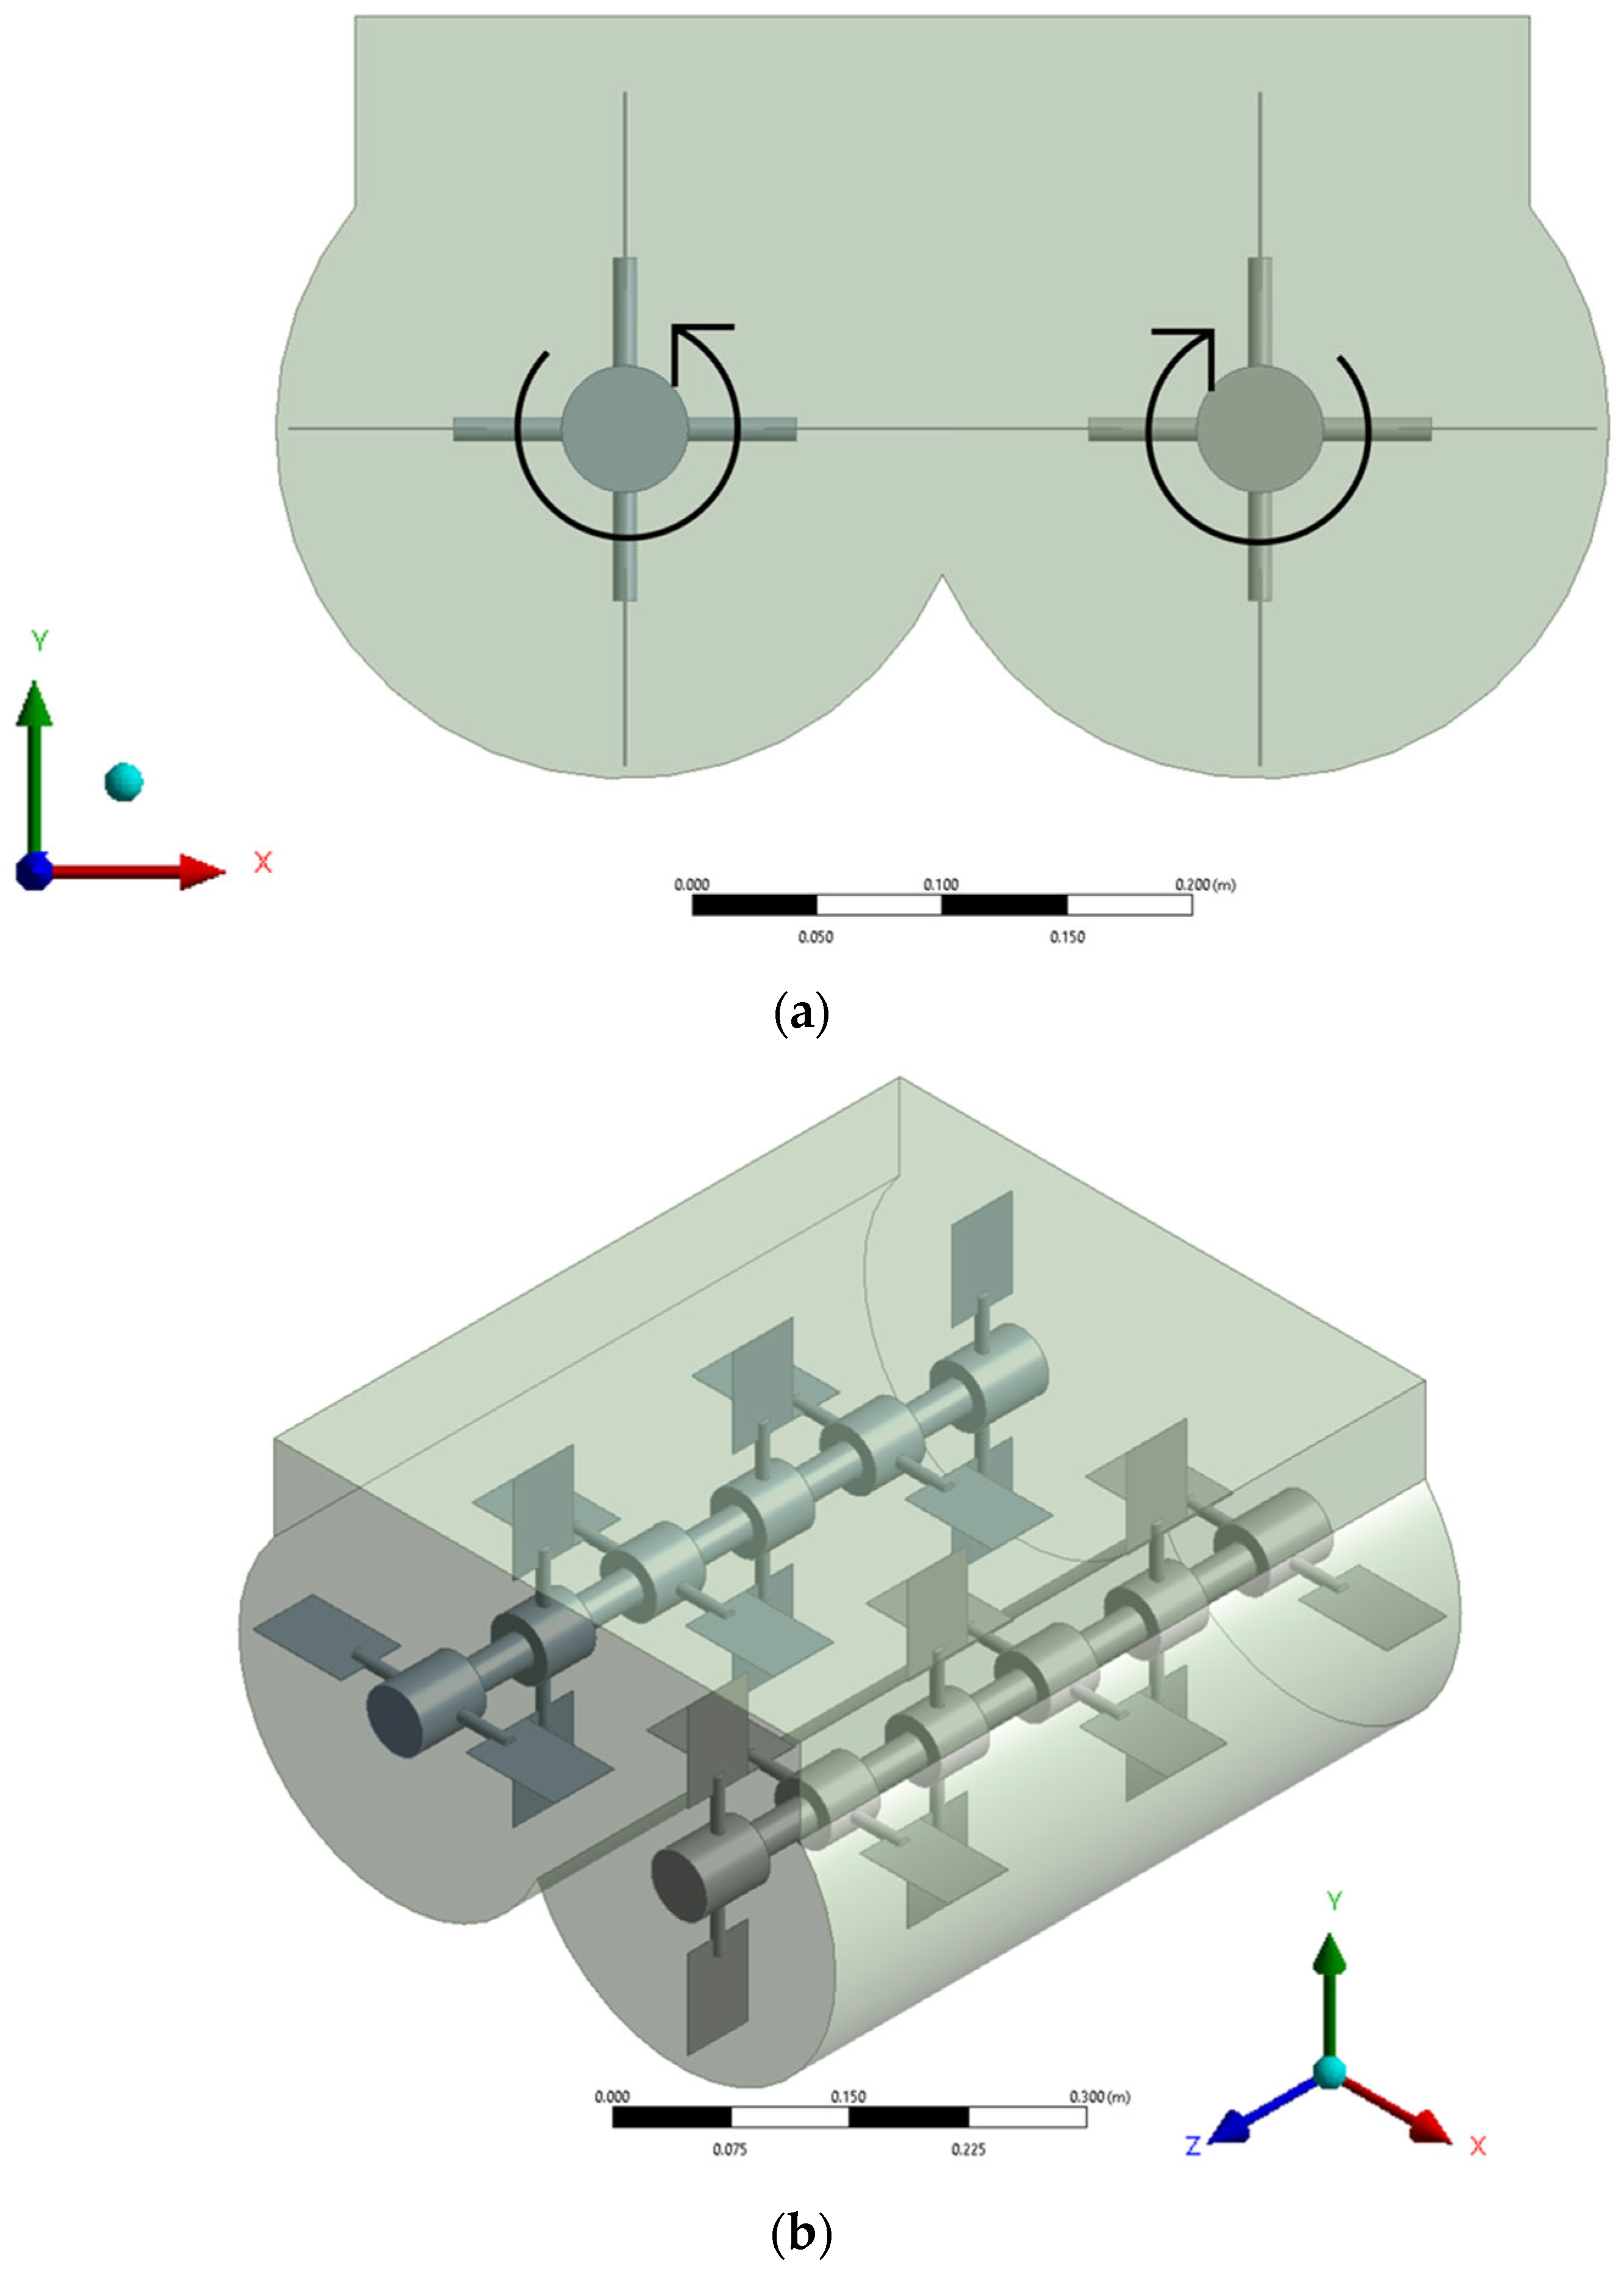
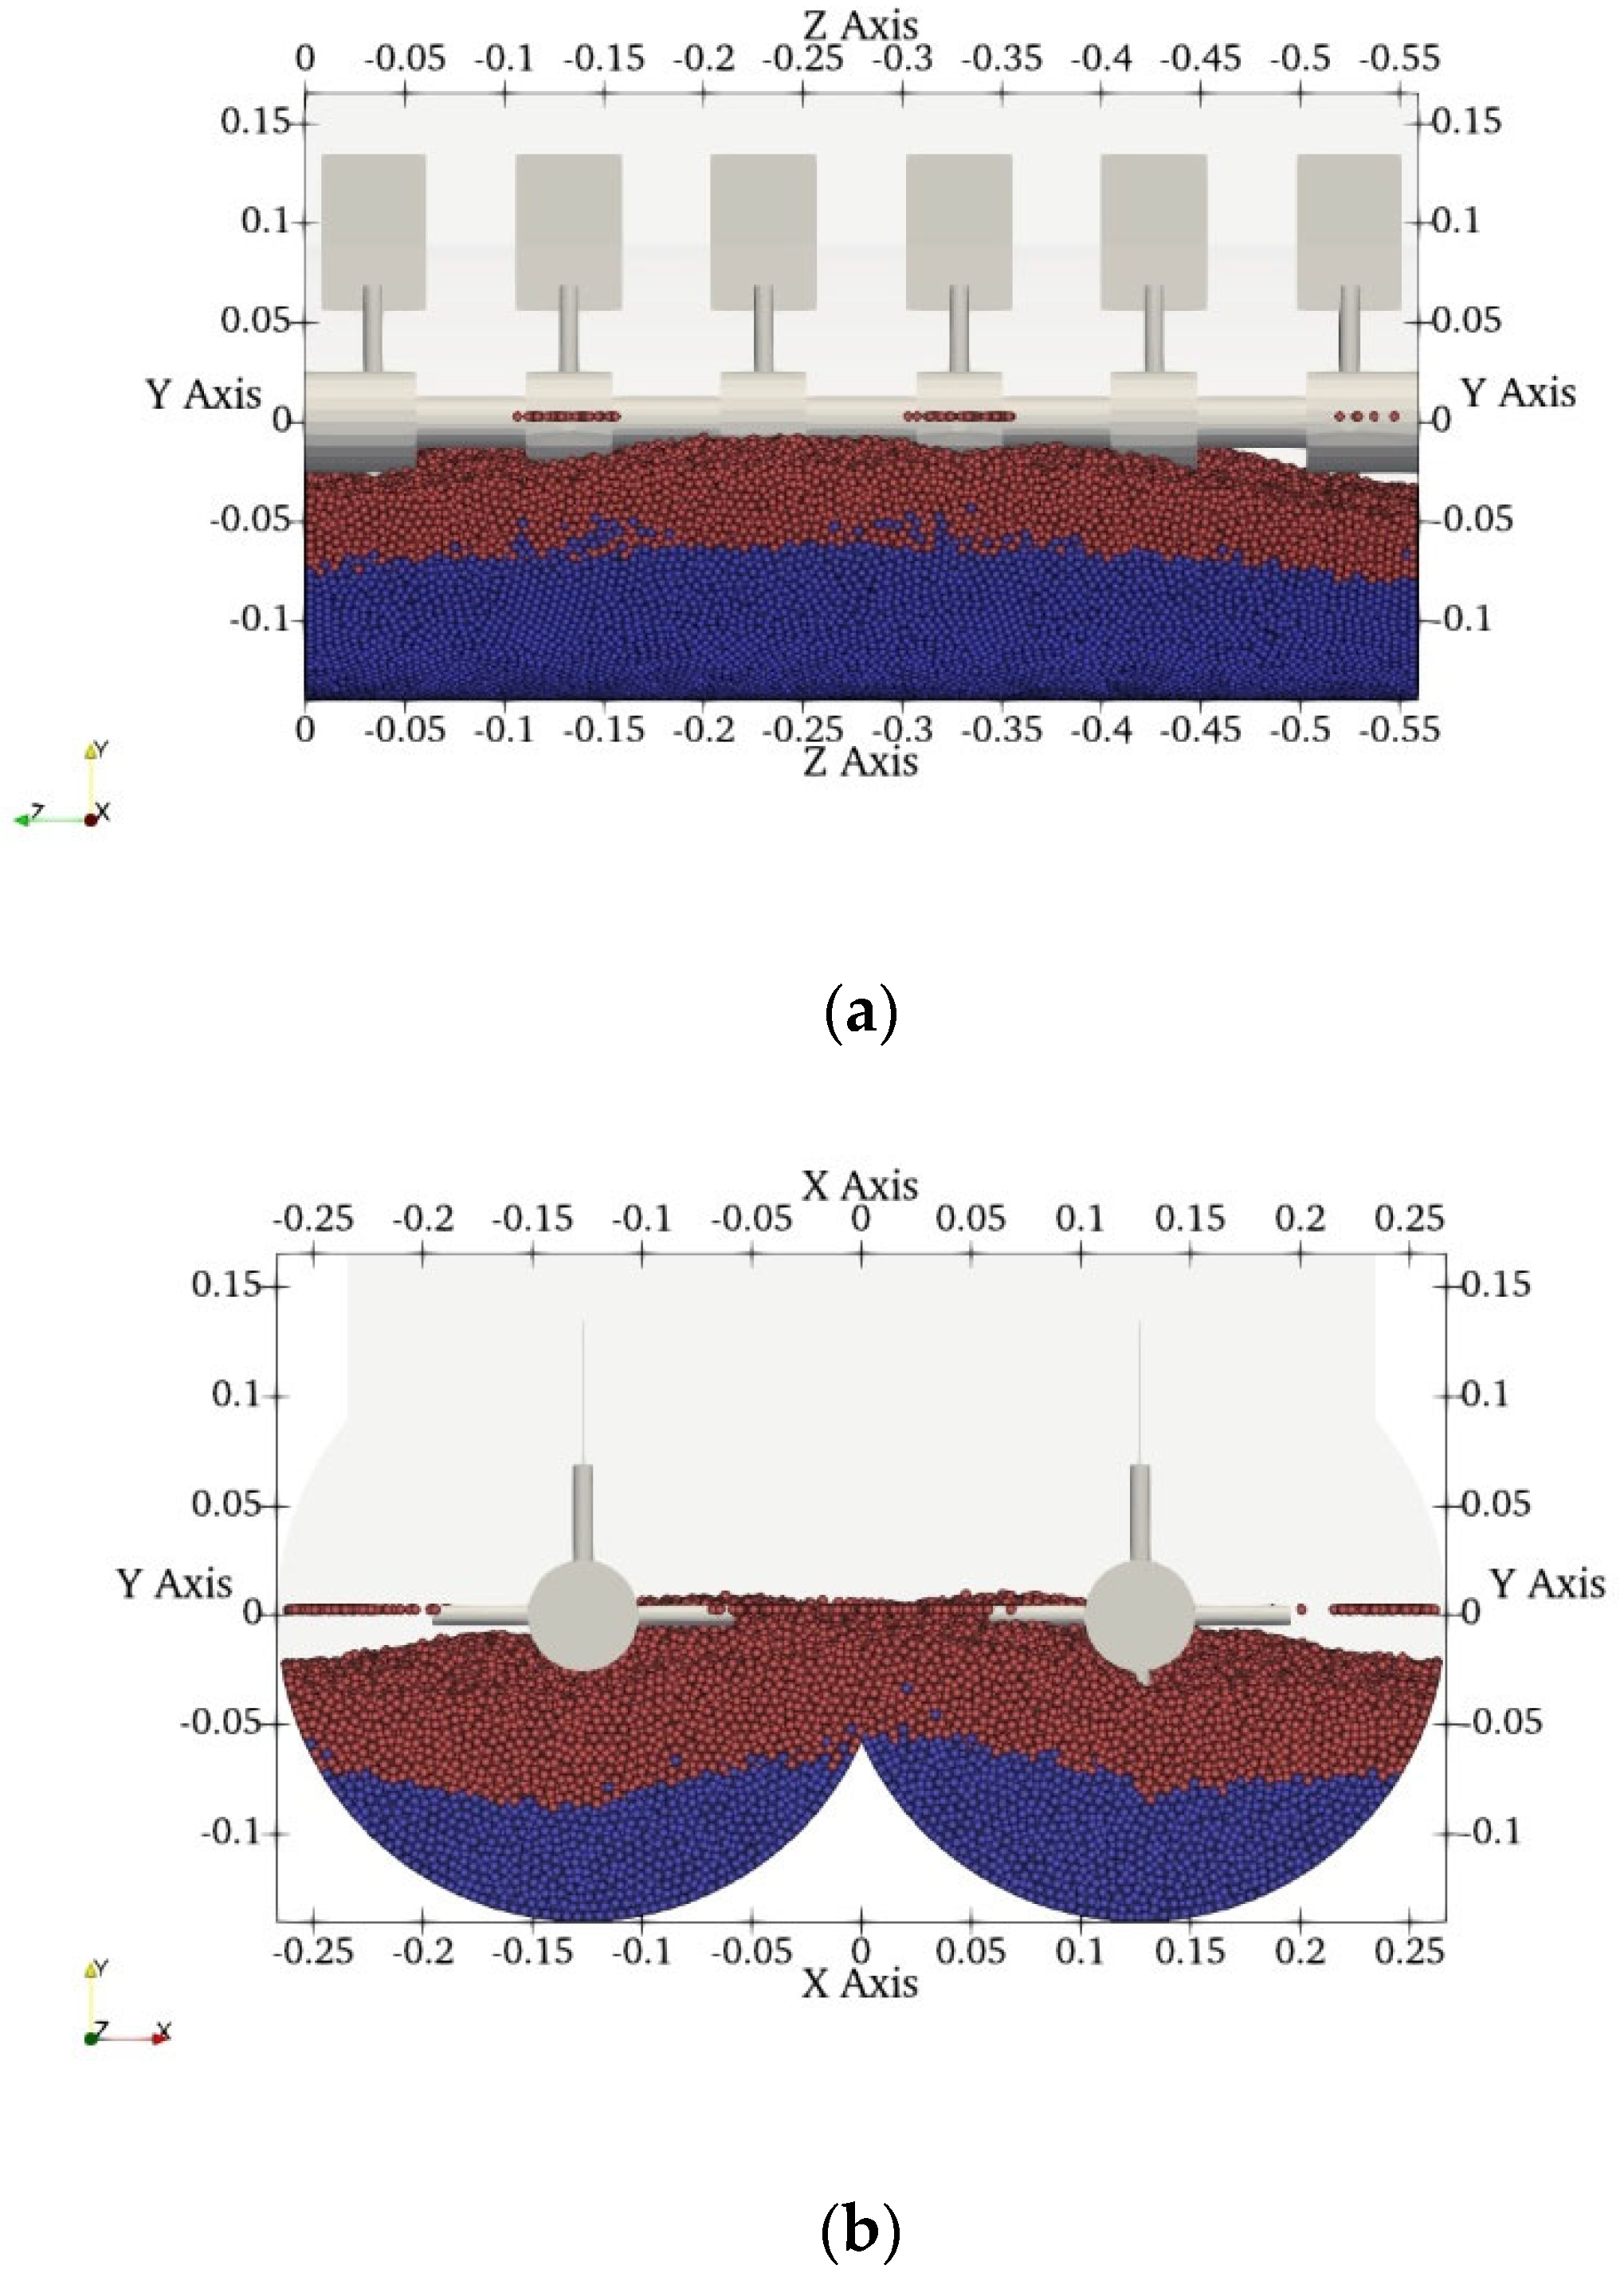
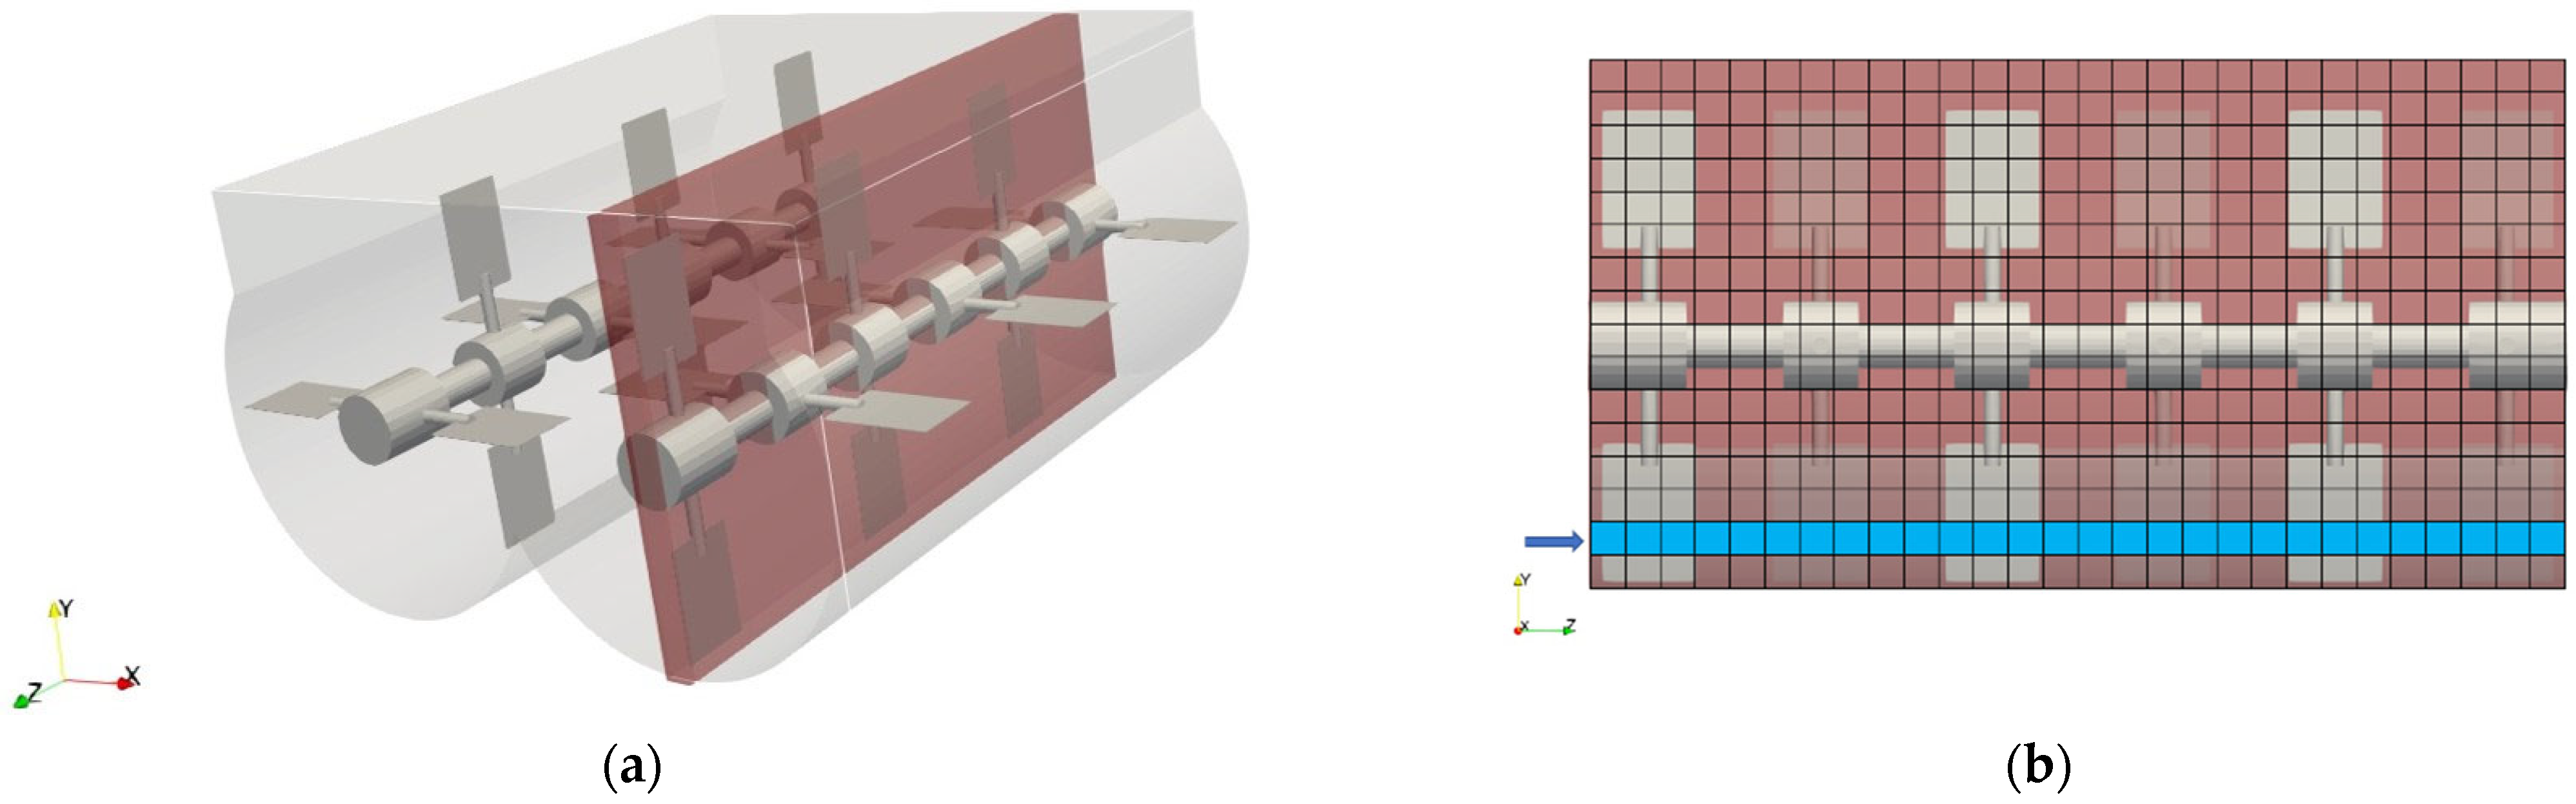
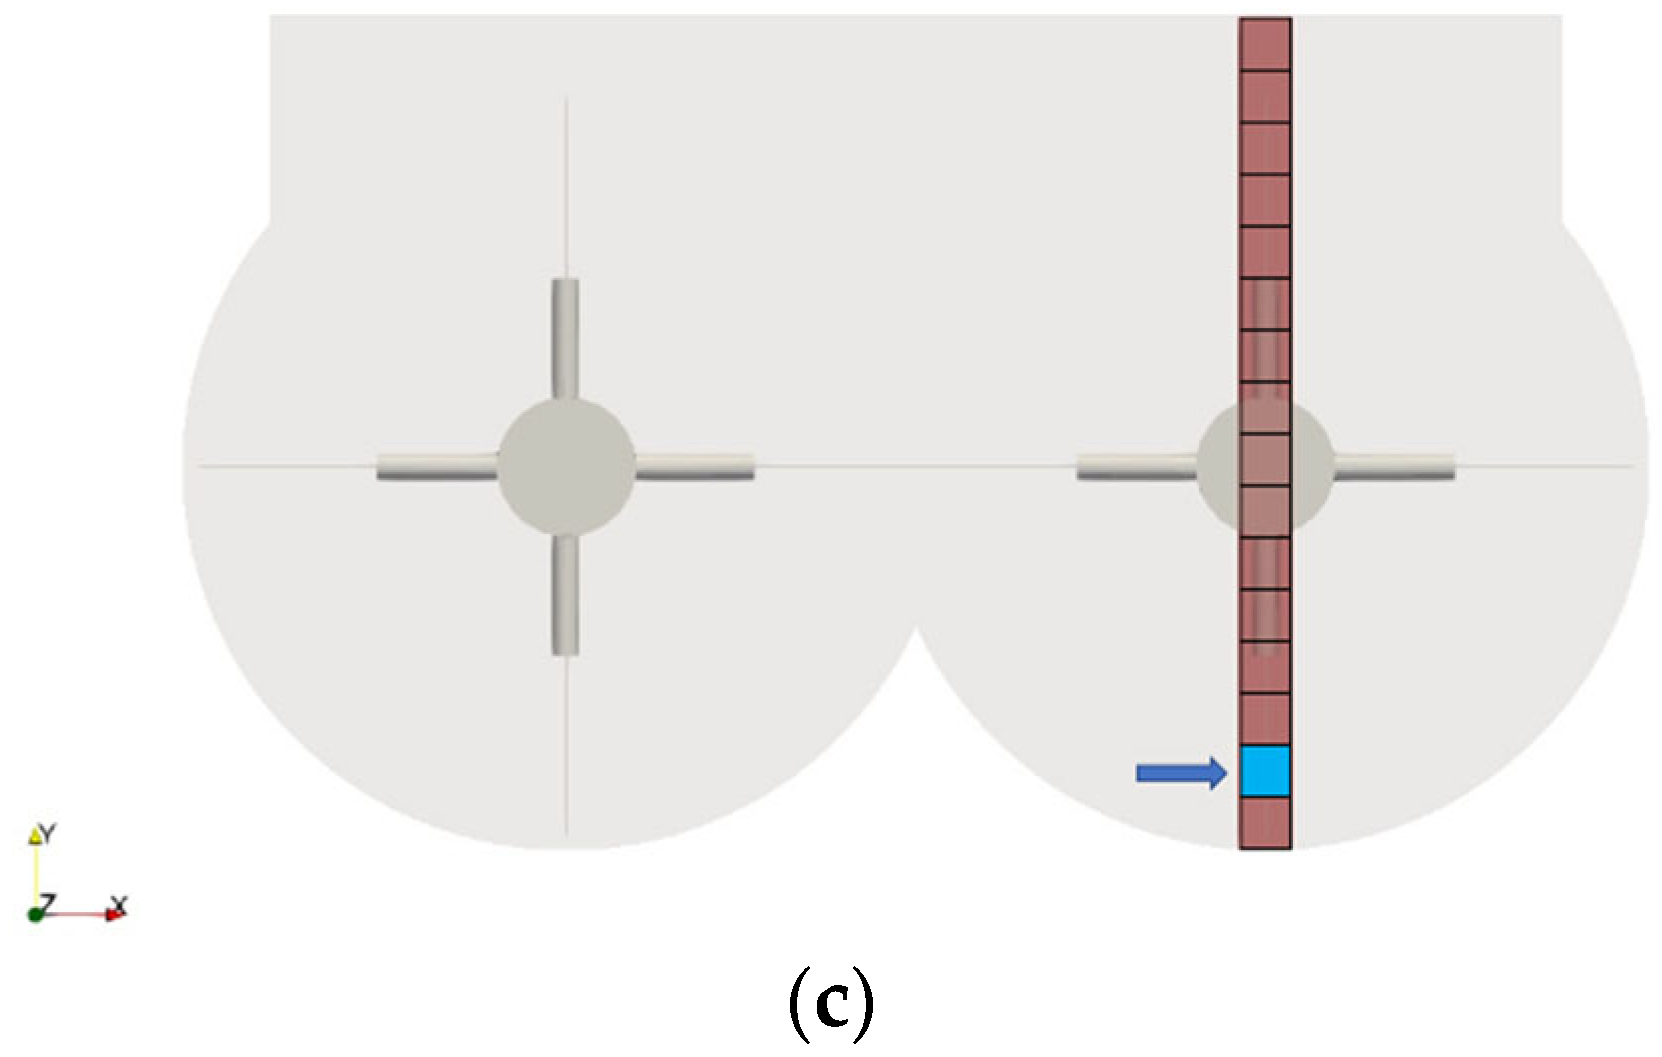
2.2.1. Geometry of the Mixer
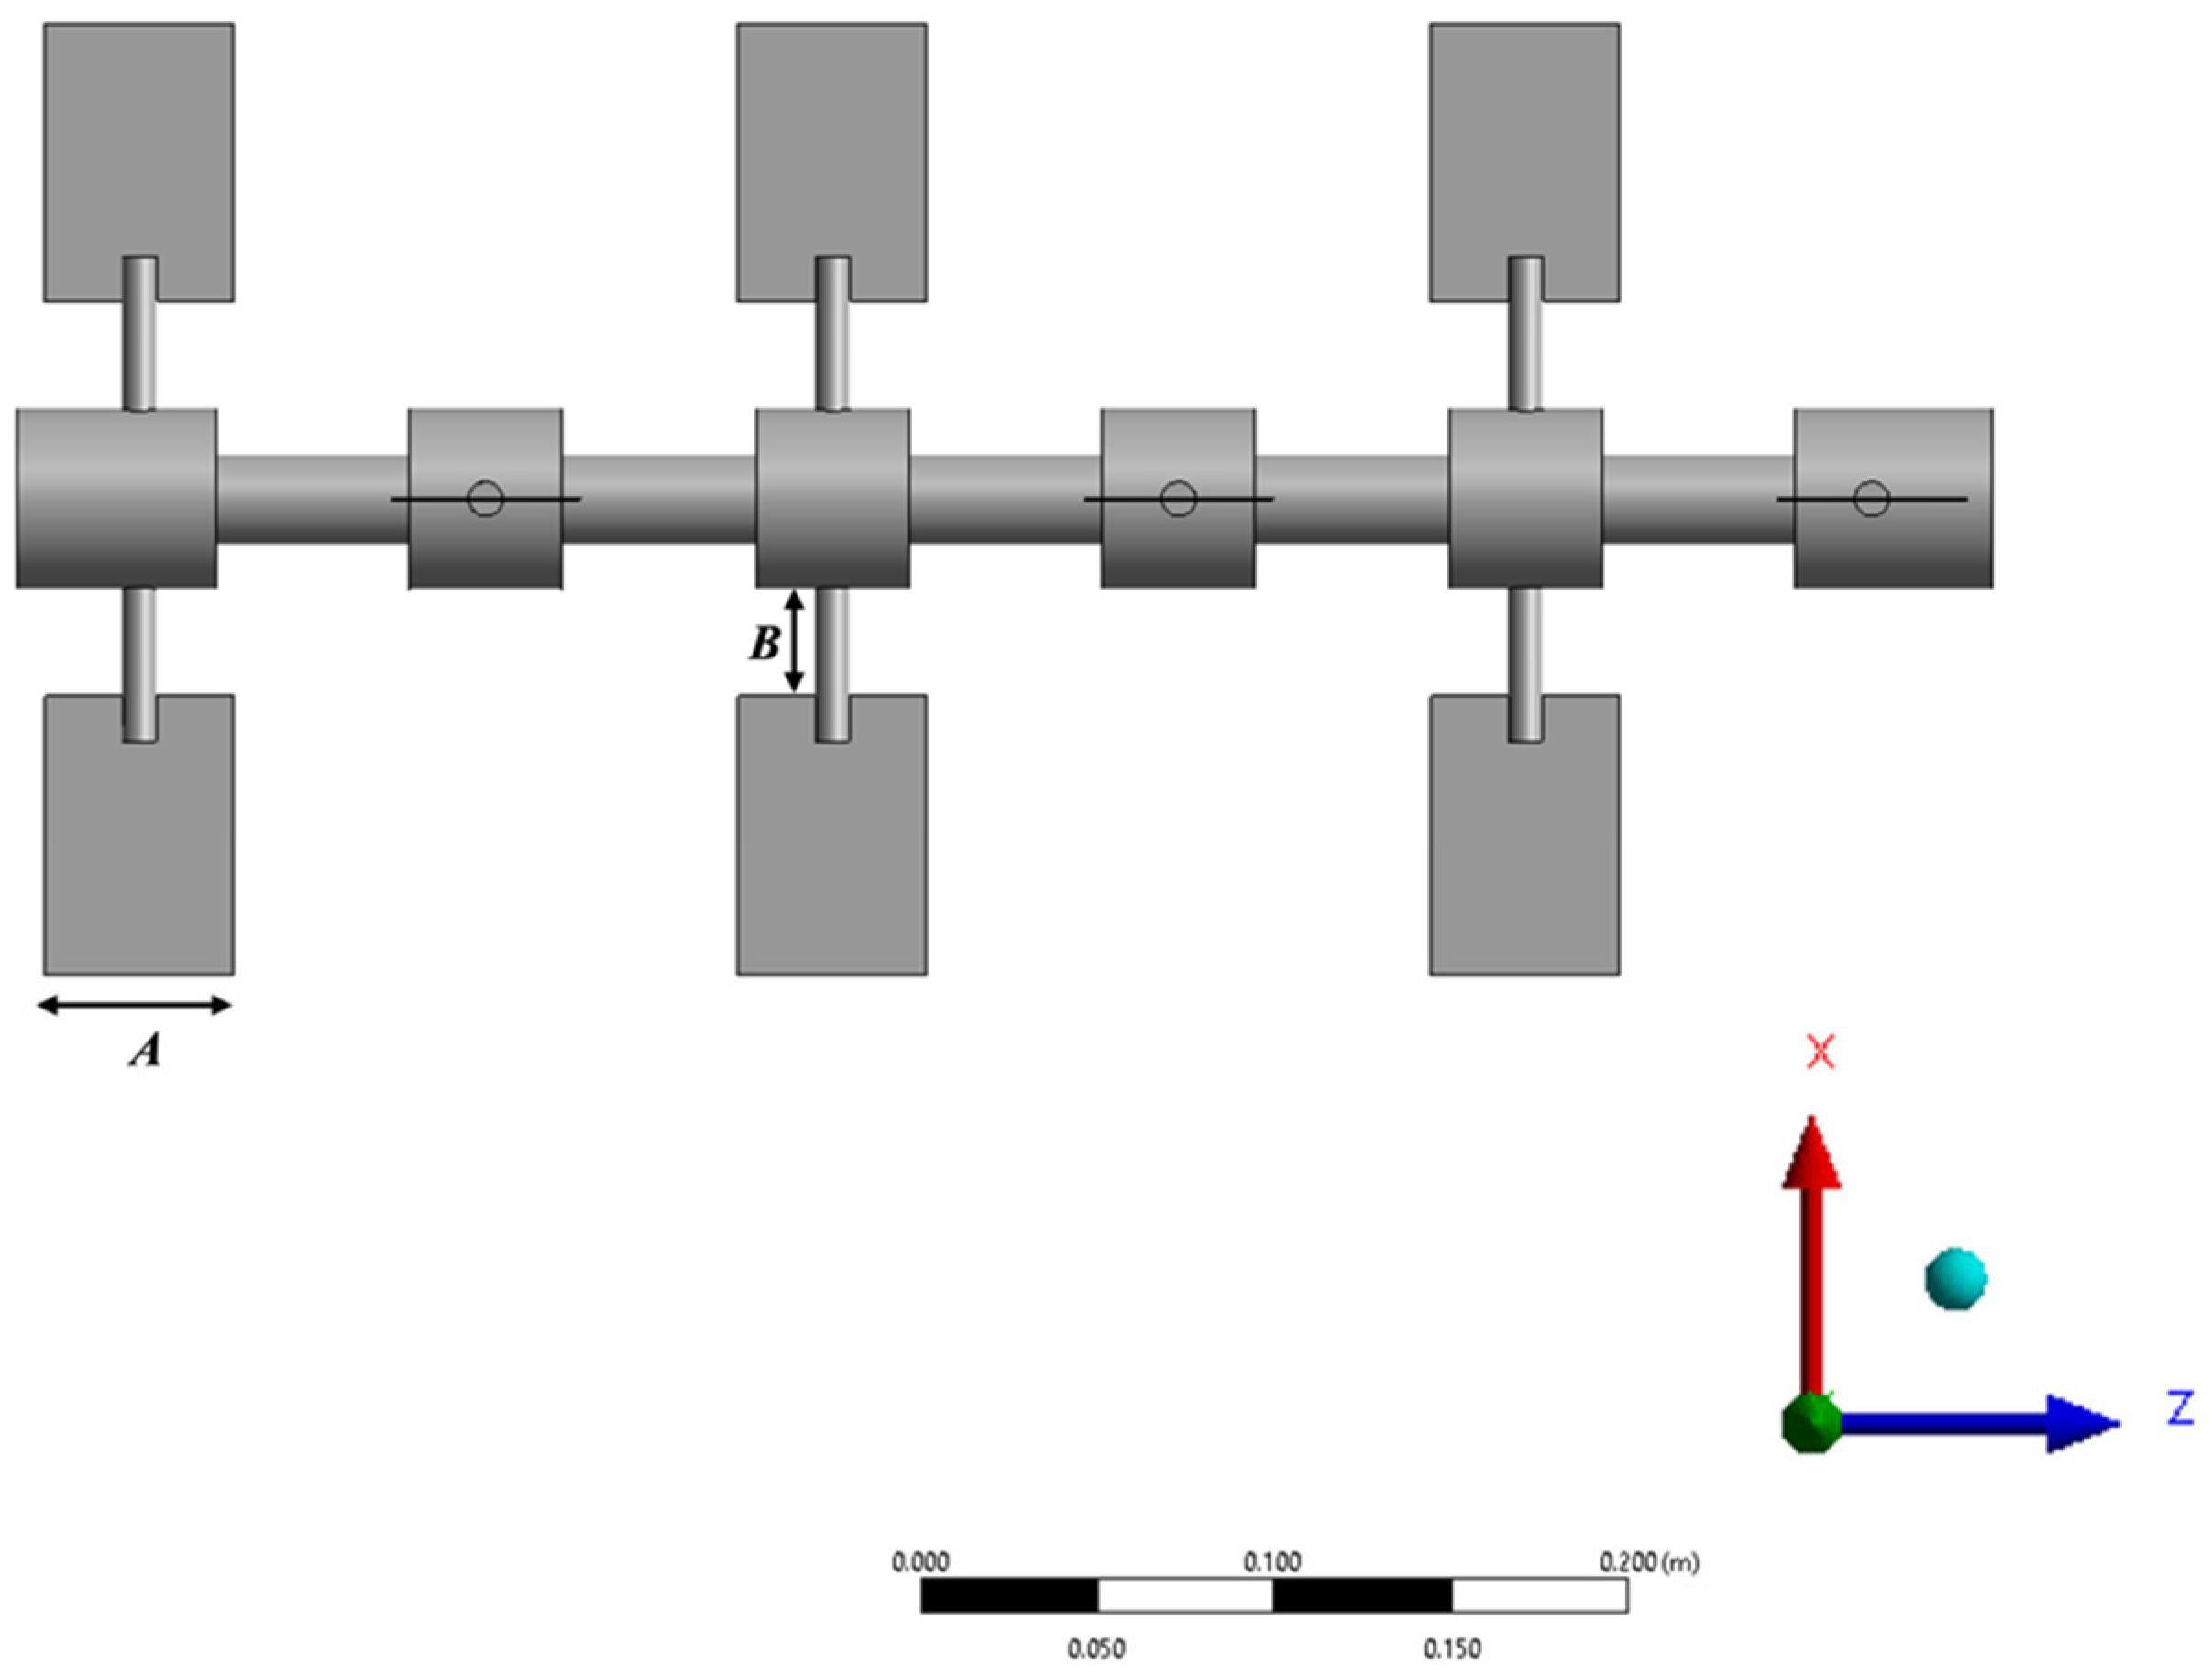
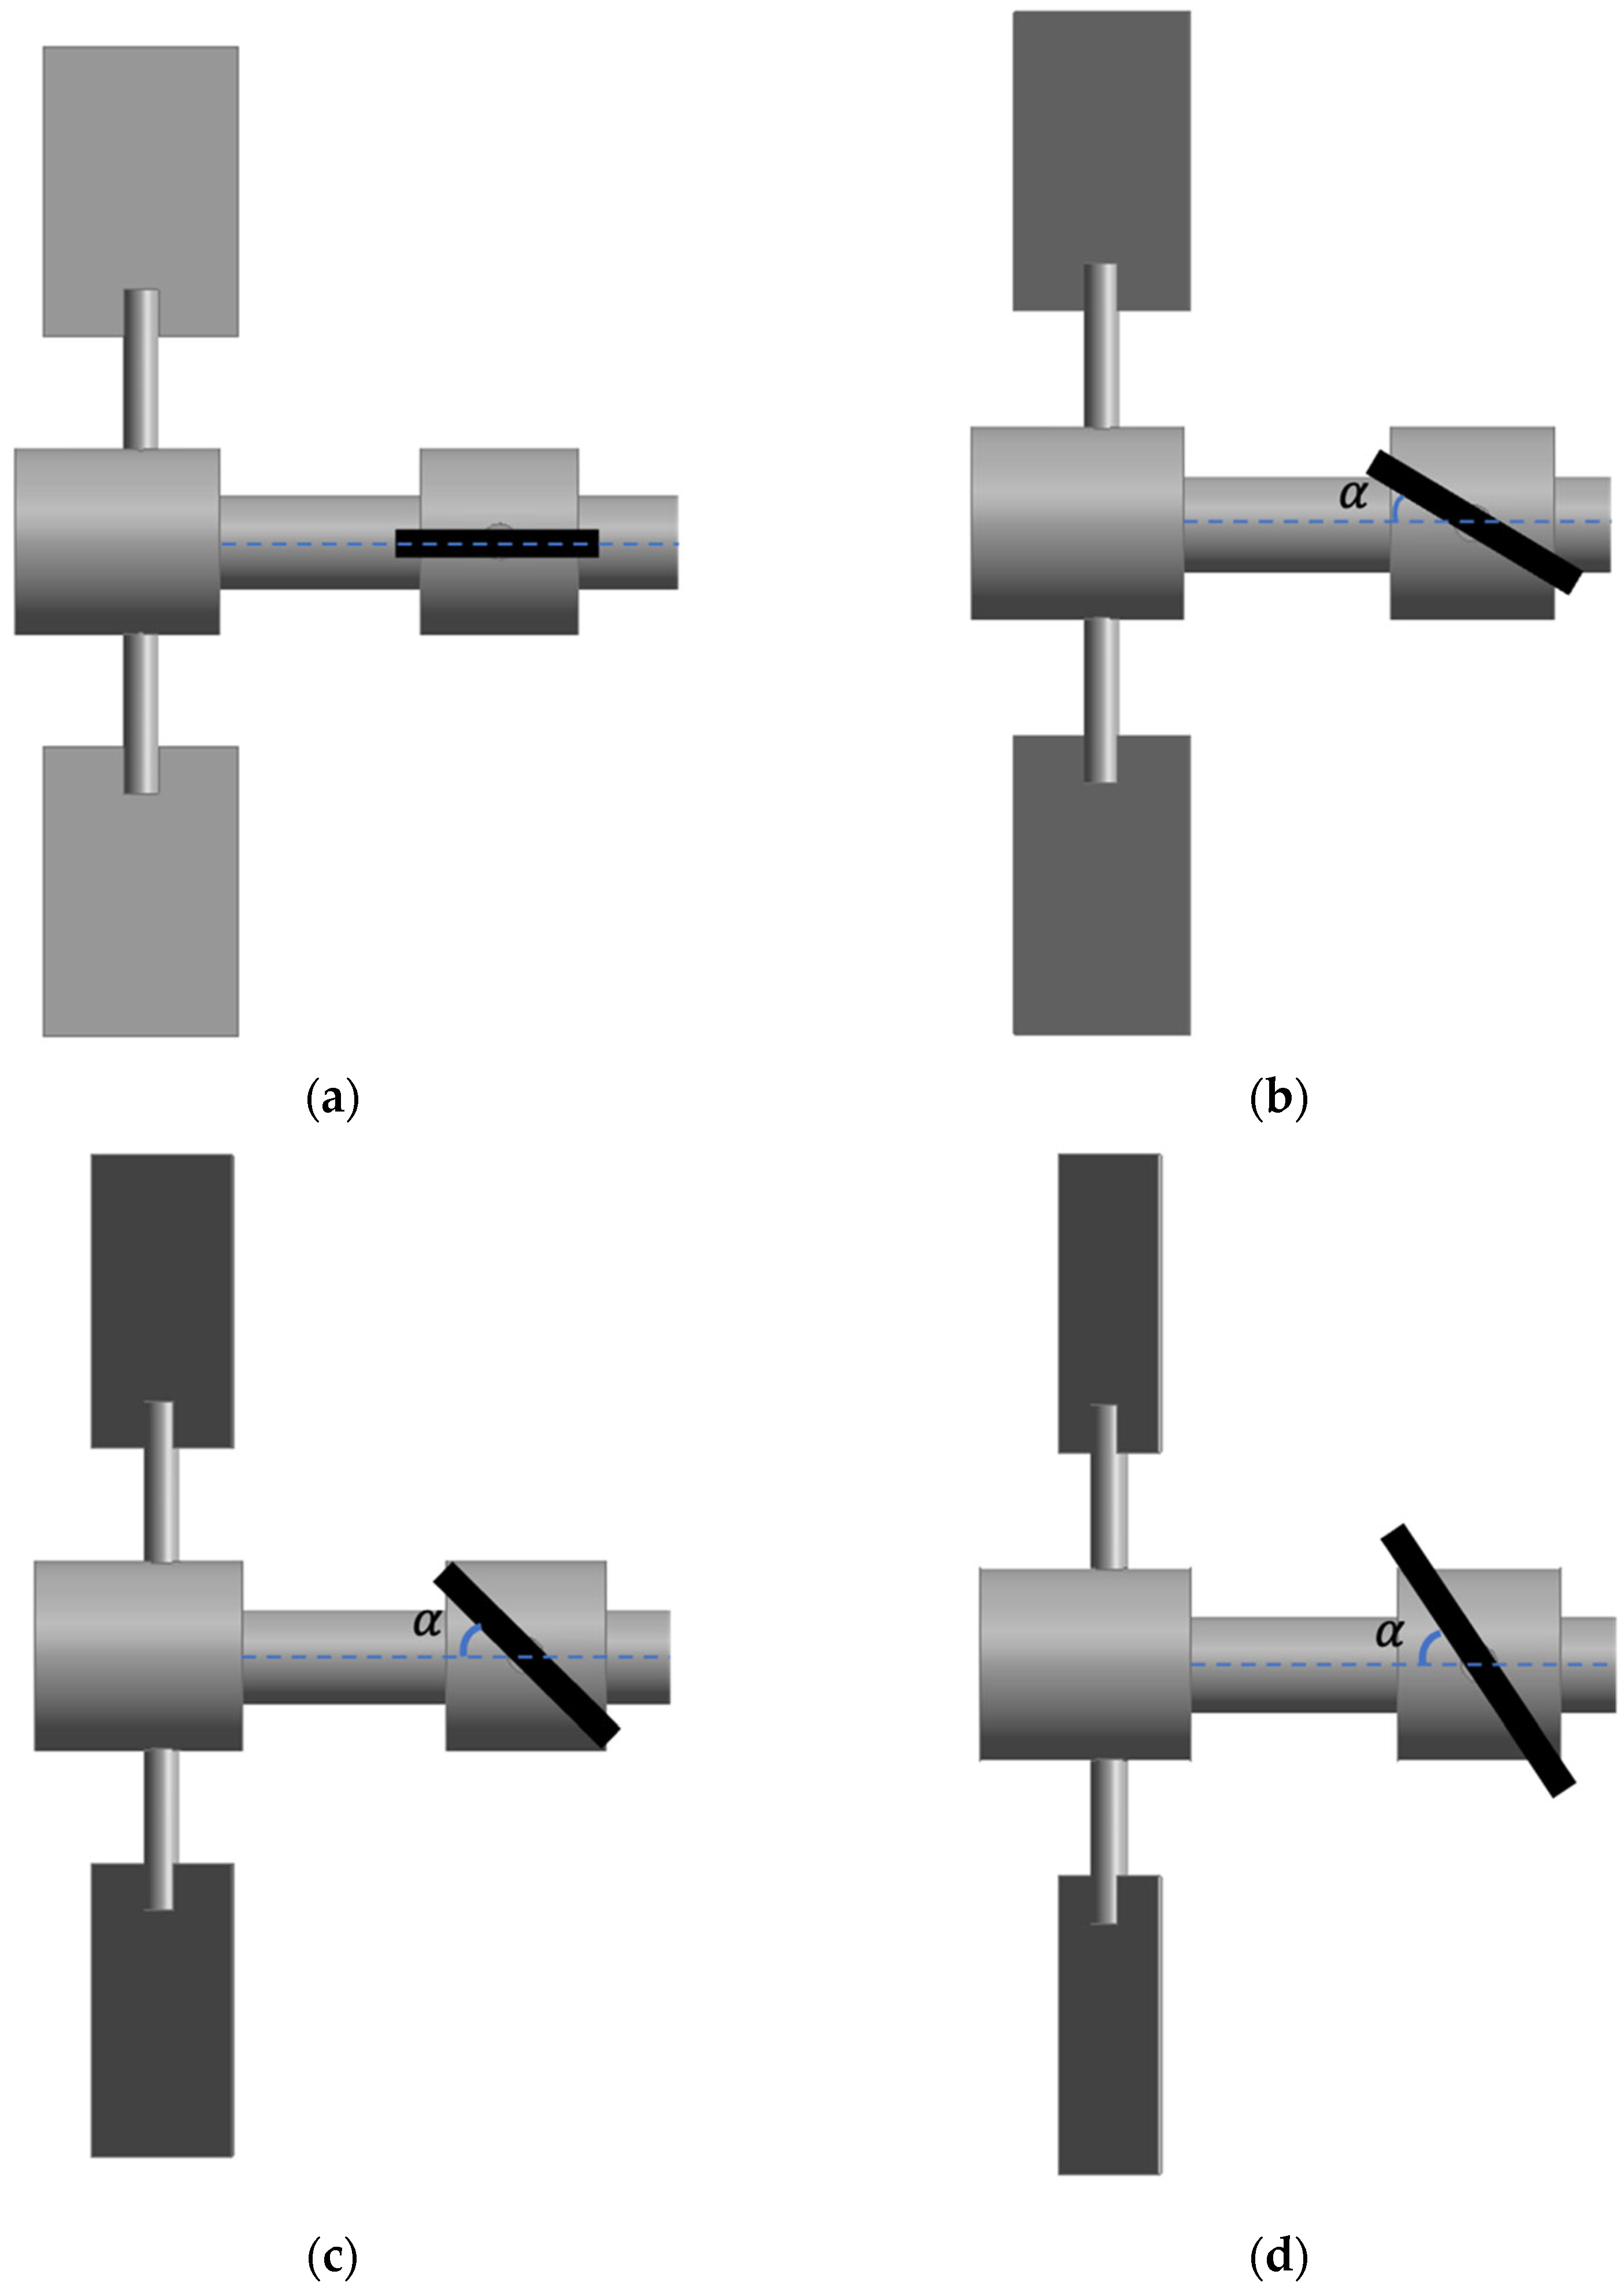
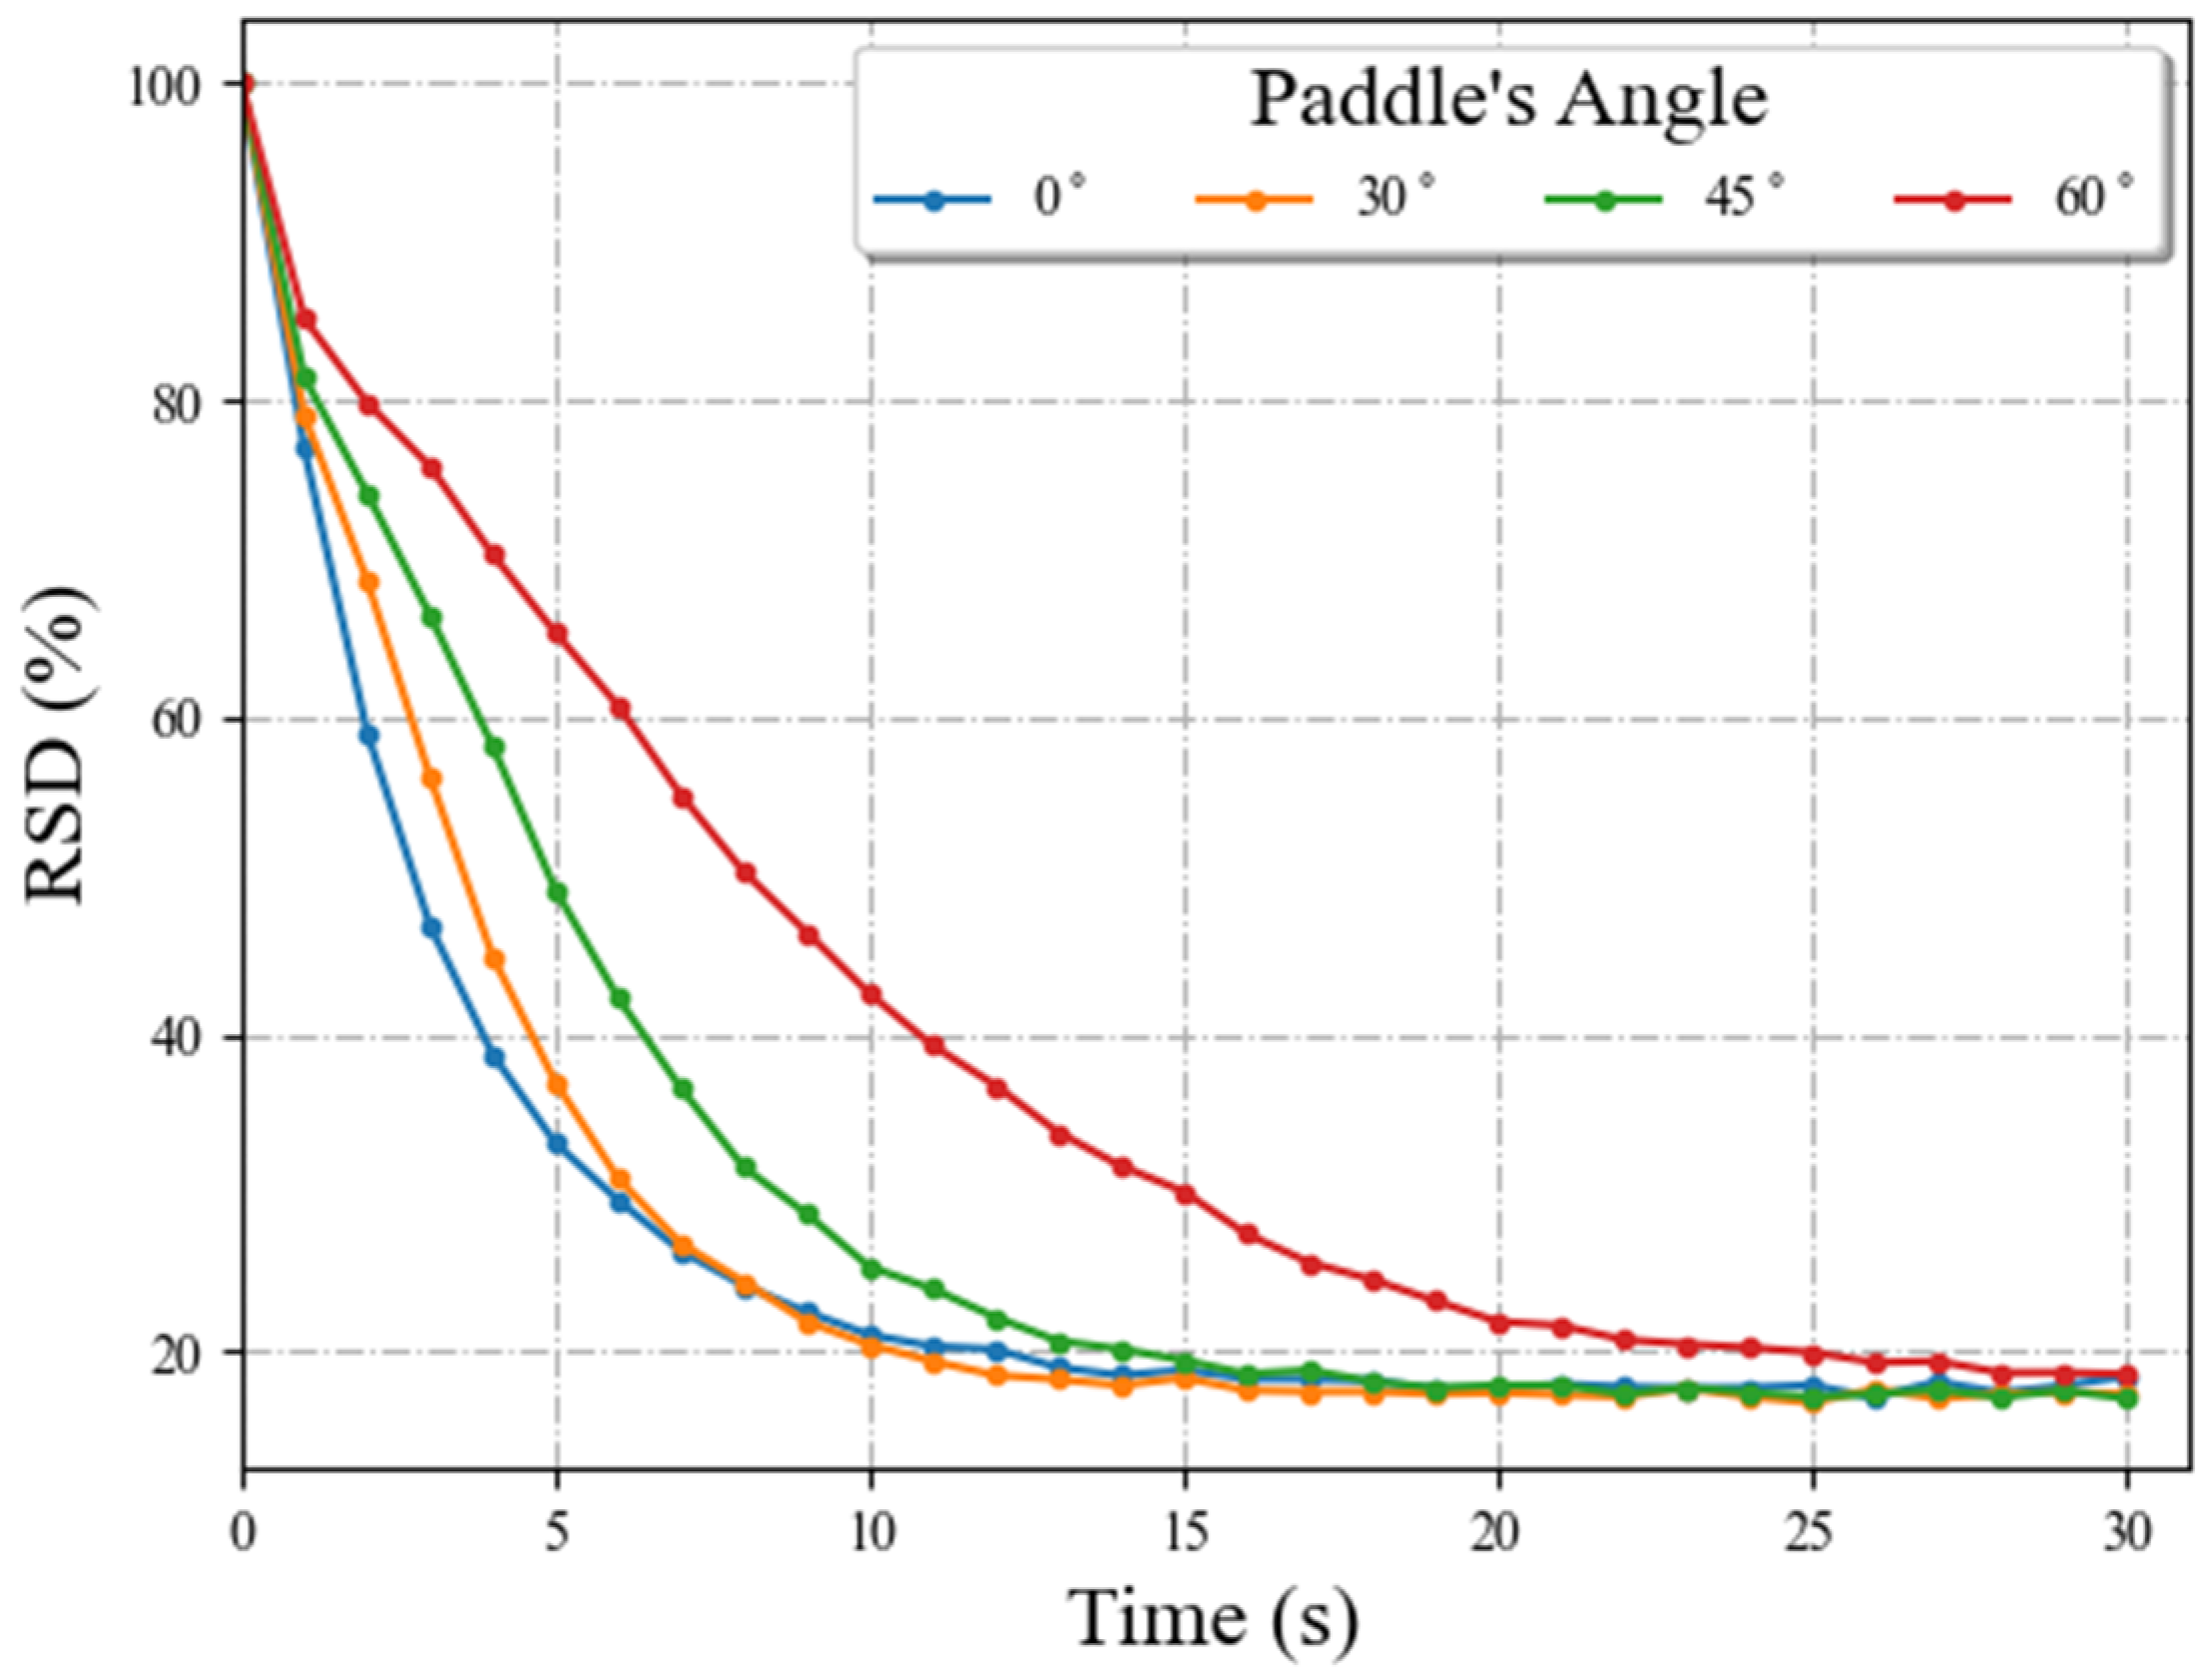
2.2.2. Mixer’s Design Parameters
2.2.3. Particles’ Properties
2.3. Mixing Characterization Analysis
2.3.1. Mixing Performance
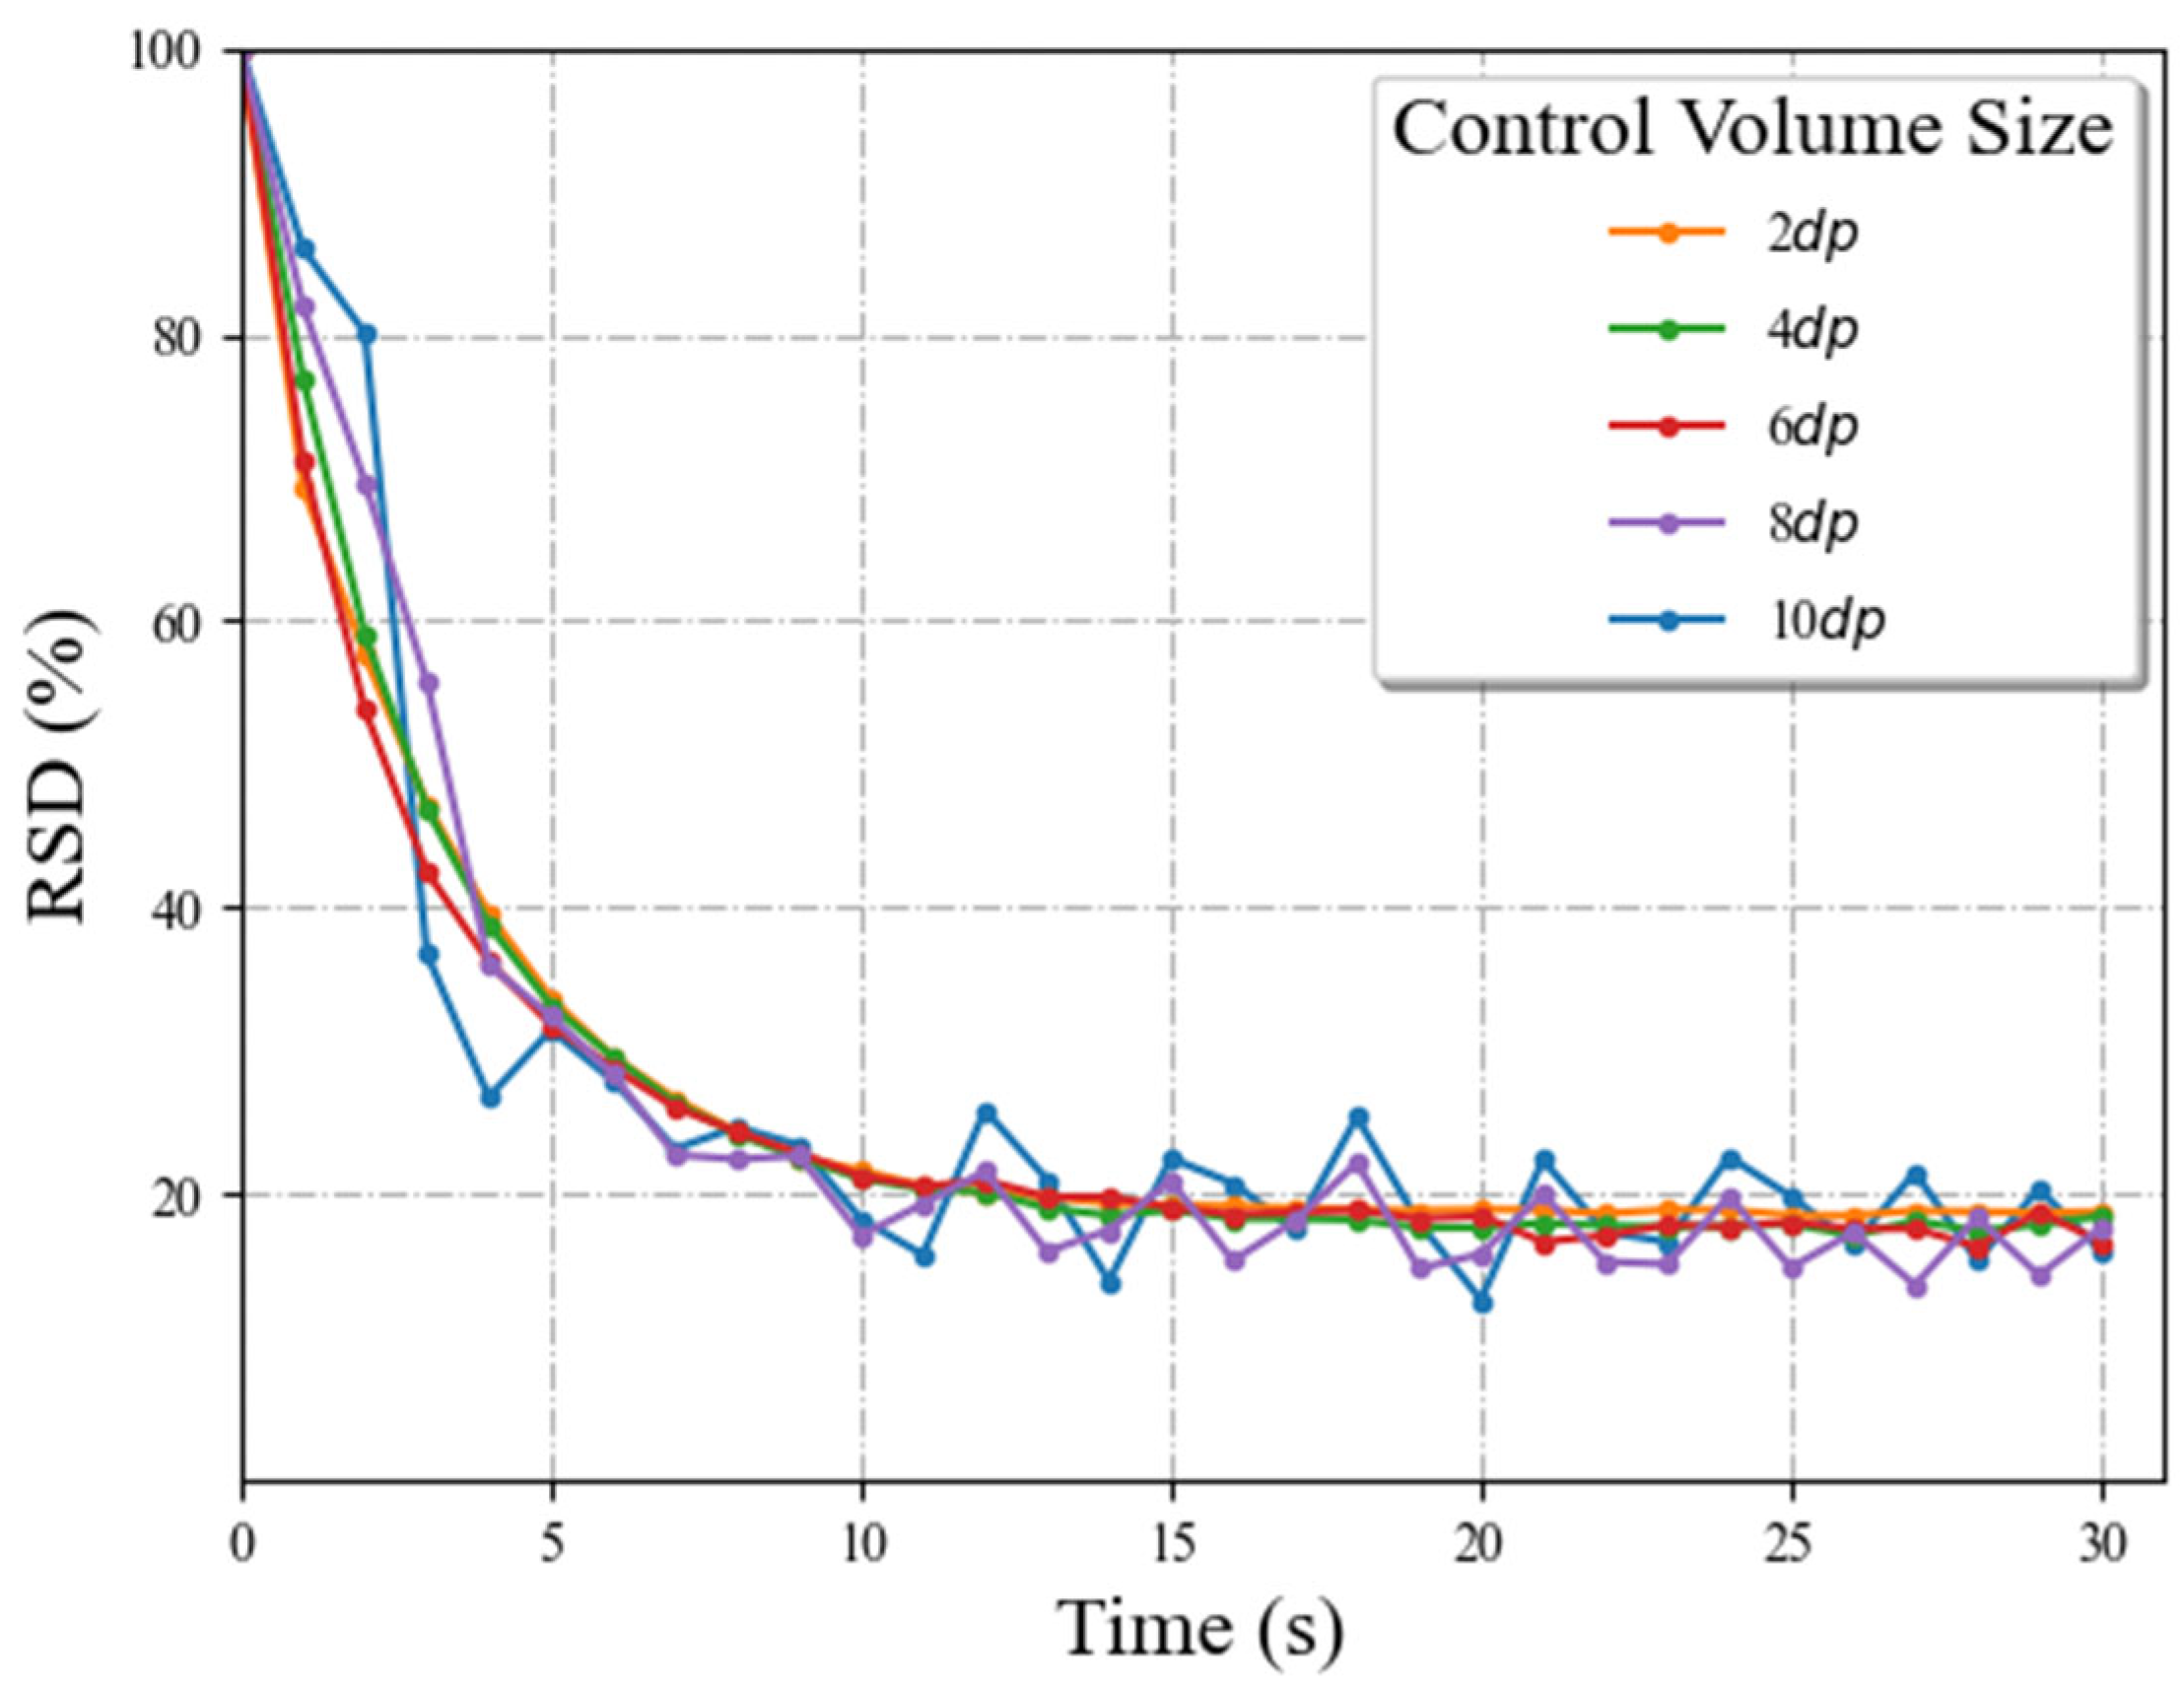
2.3.2. Solid Dispersion
2.3.3. Granular Temperature
2.3.4. Force Acting on Particles and Power Consumption
3. Results and Discussion
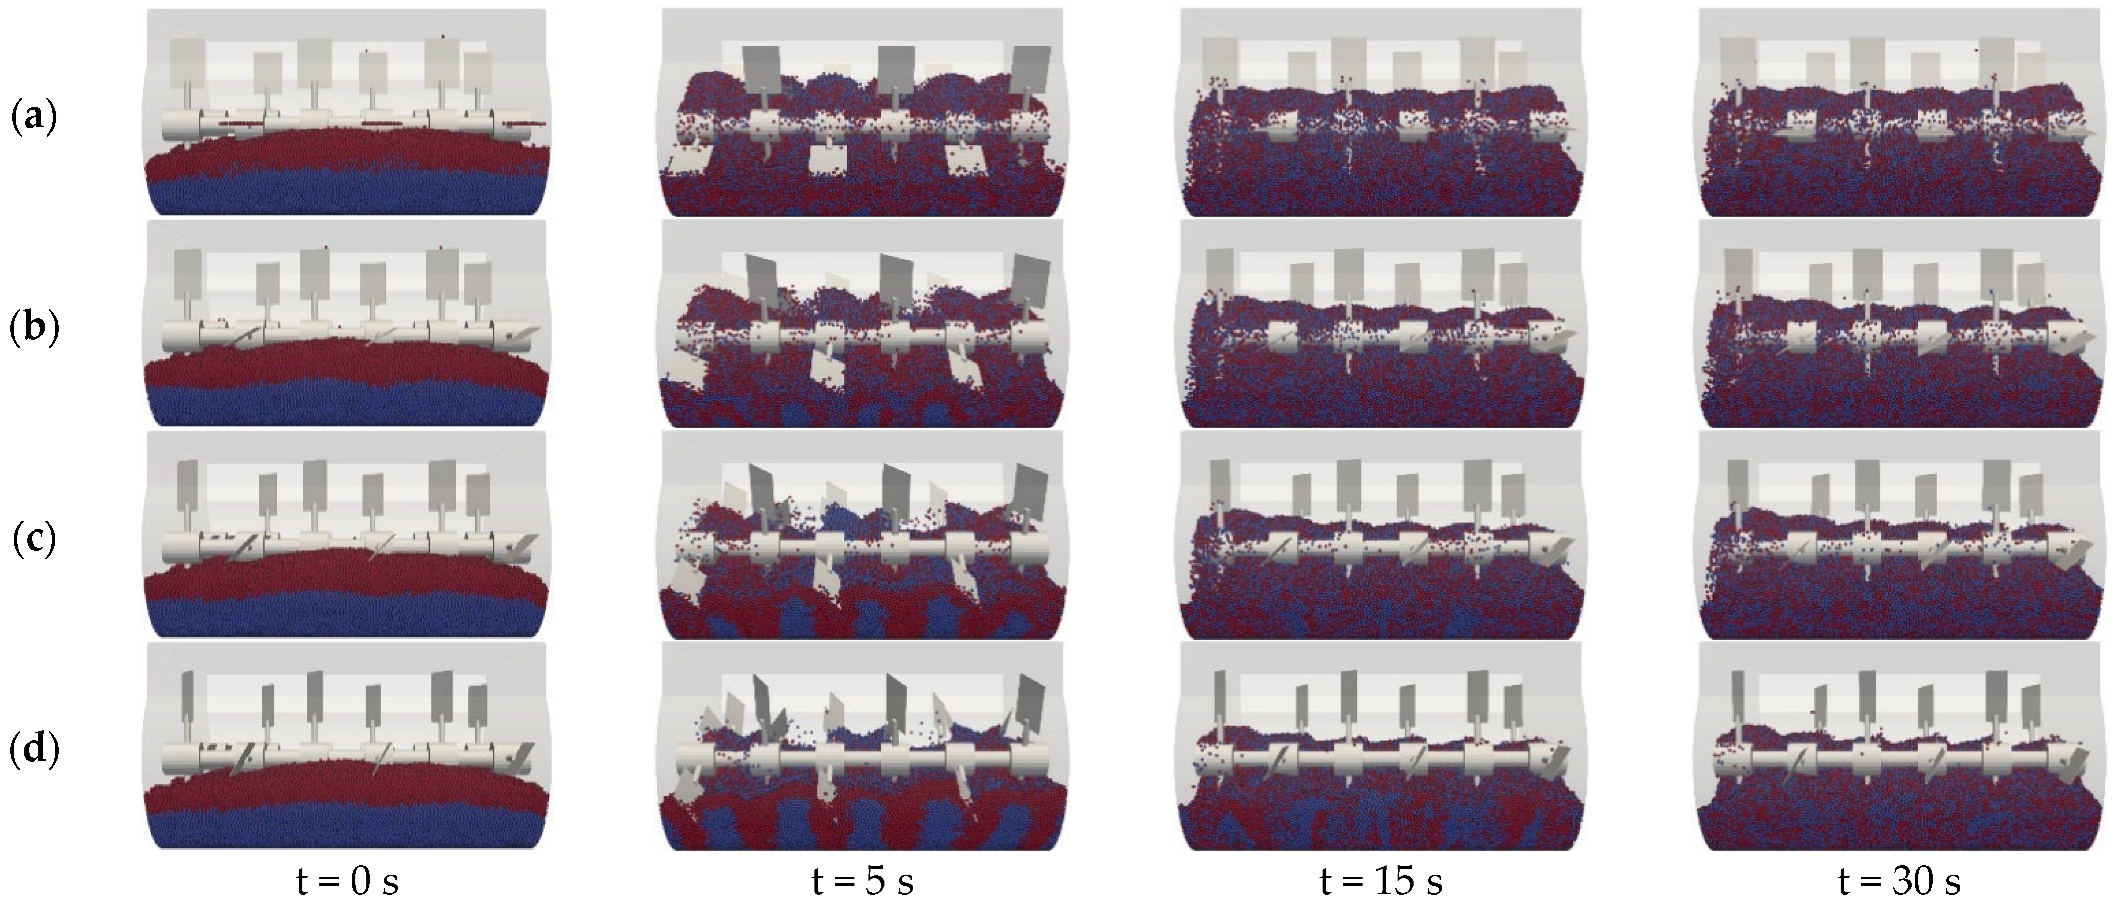
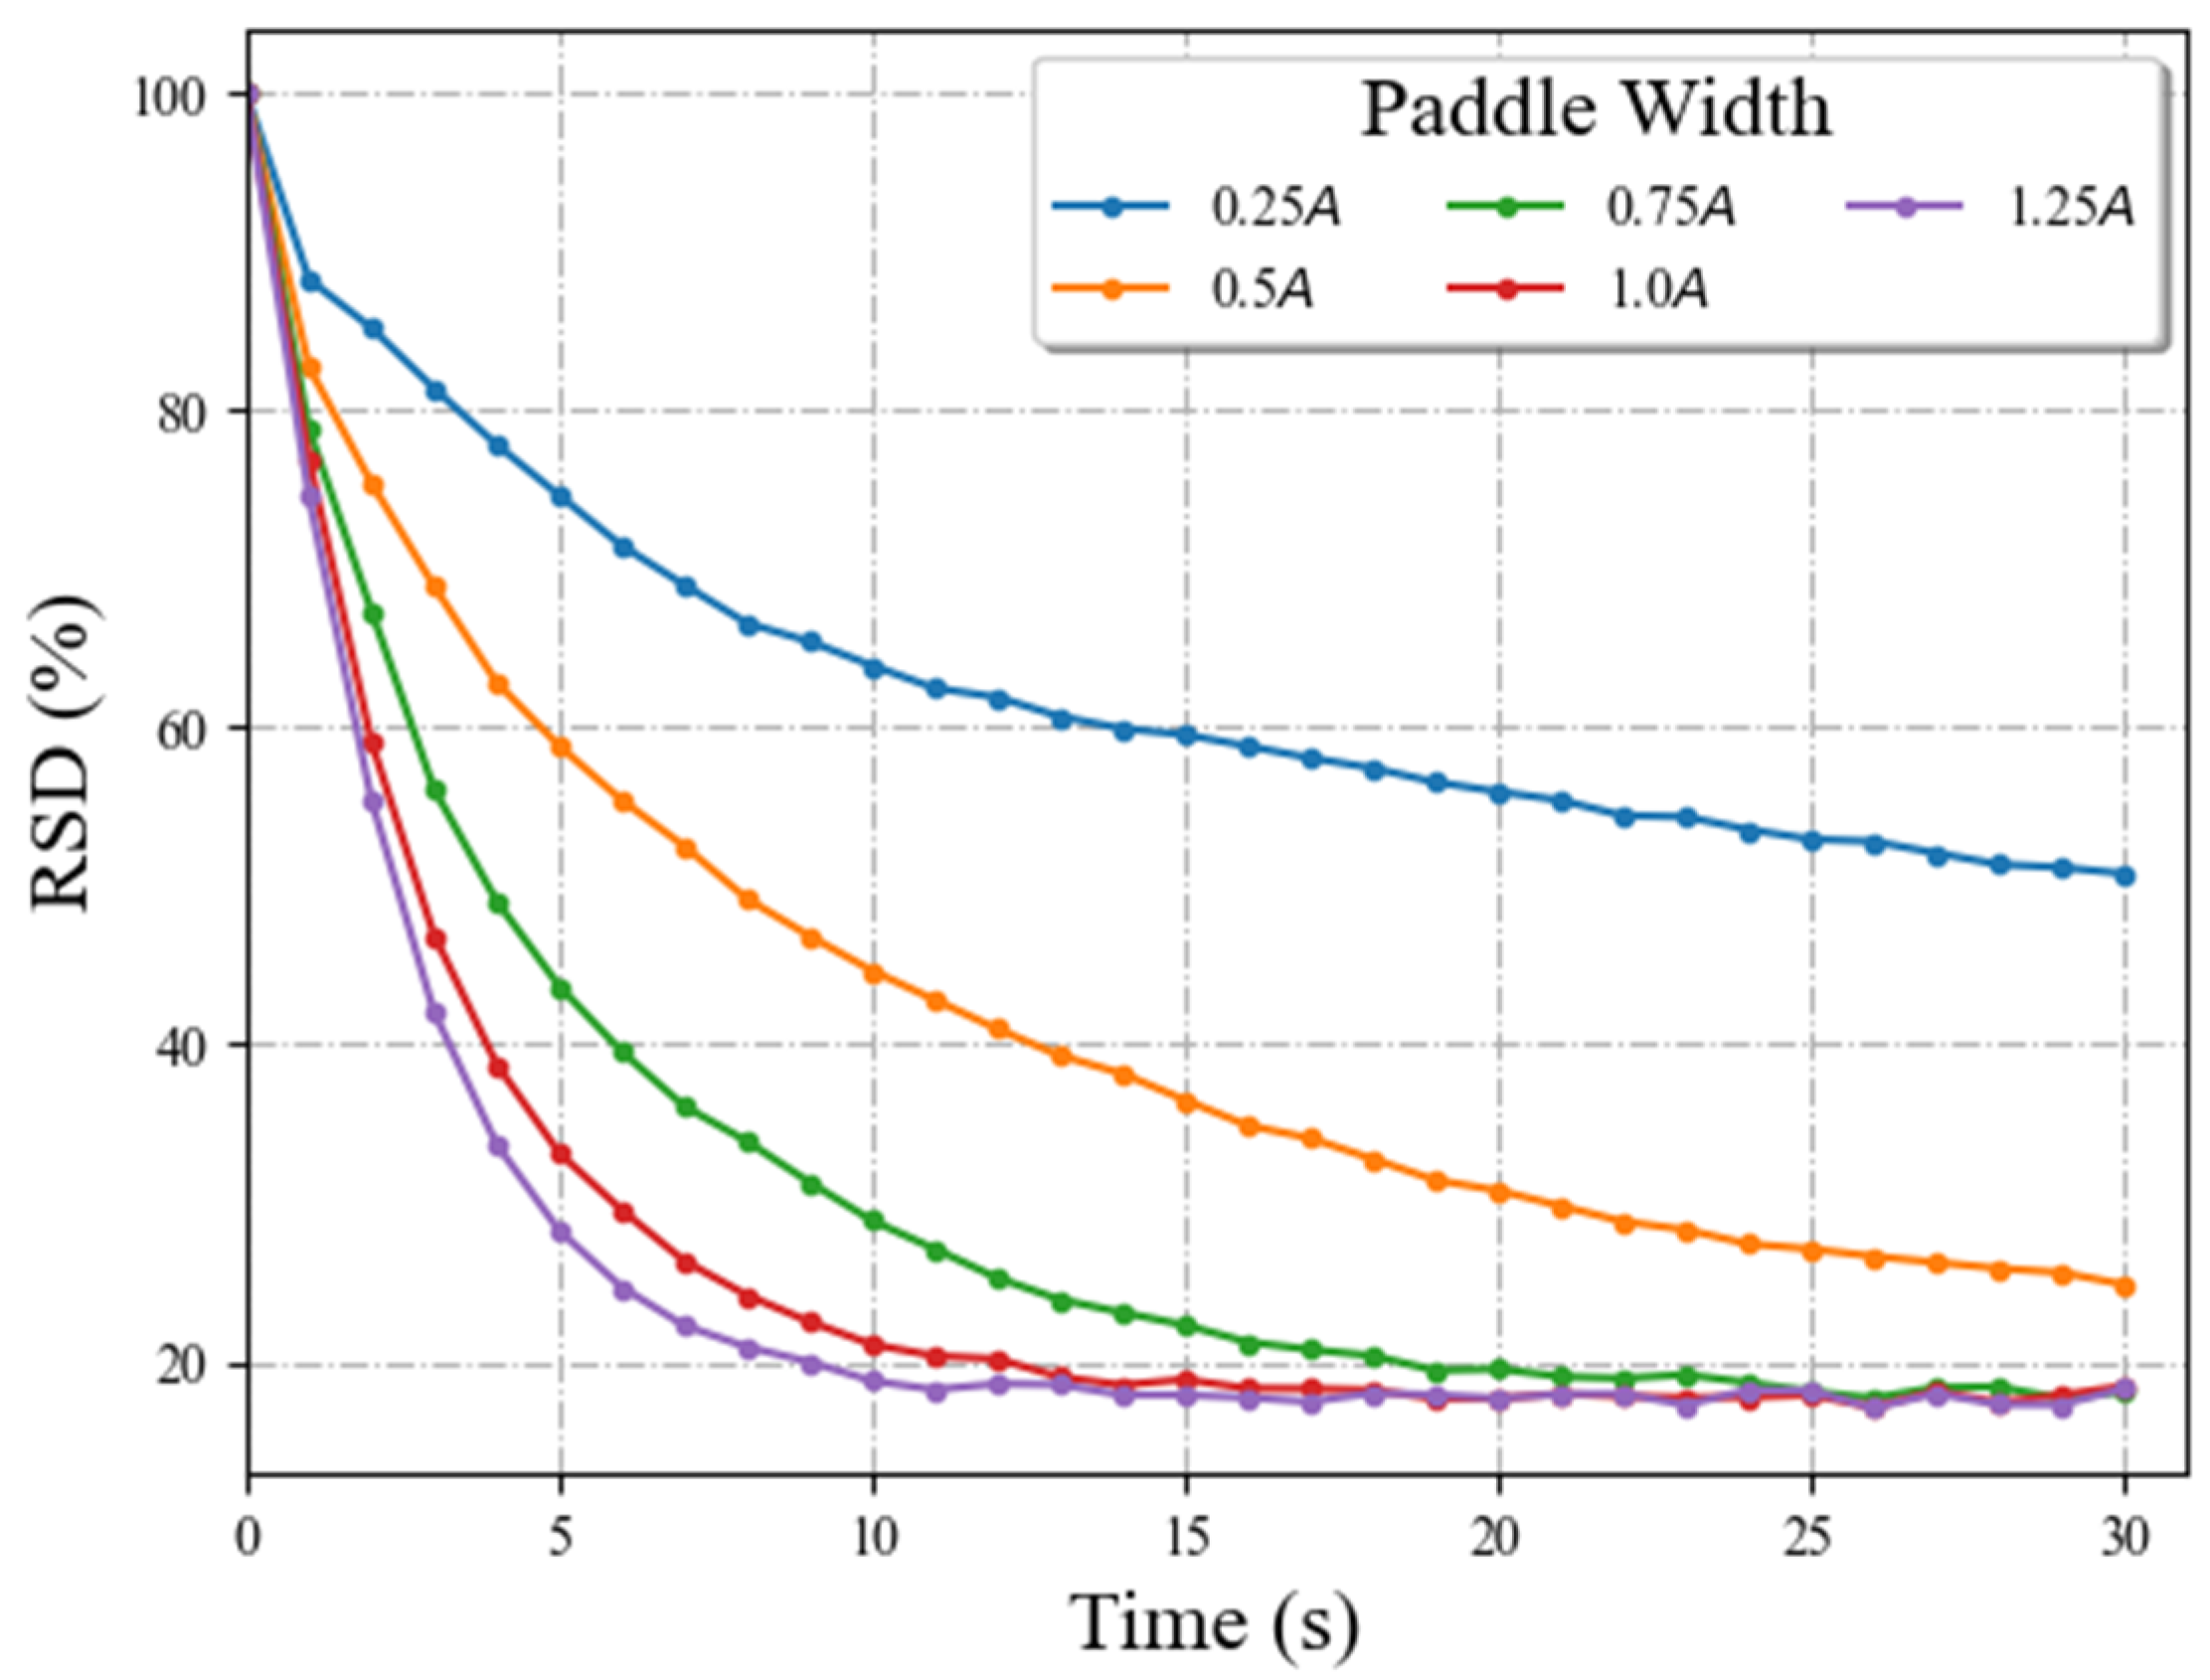
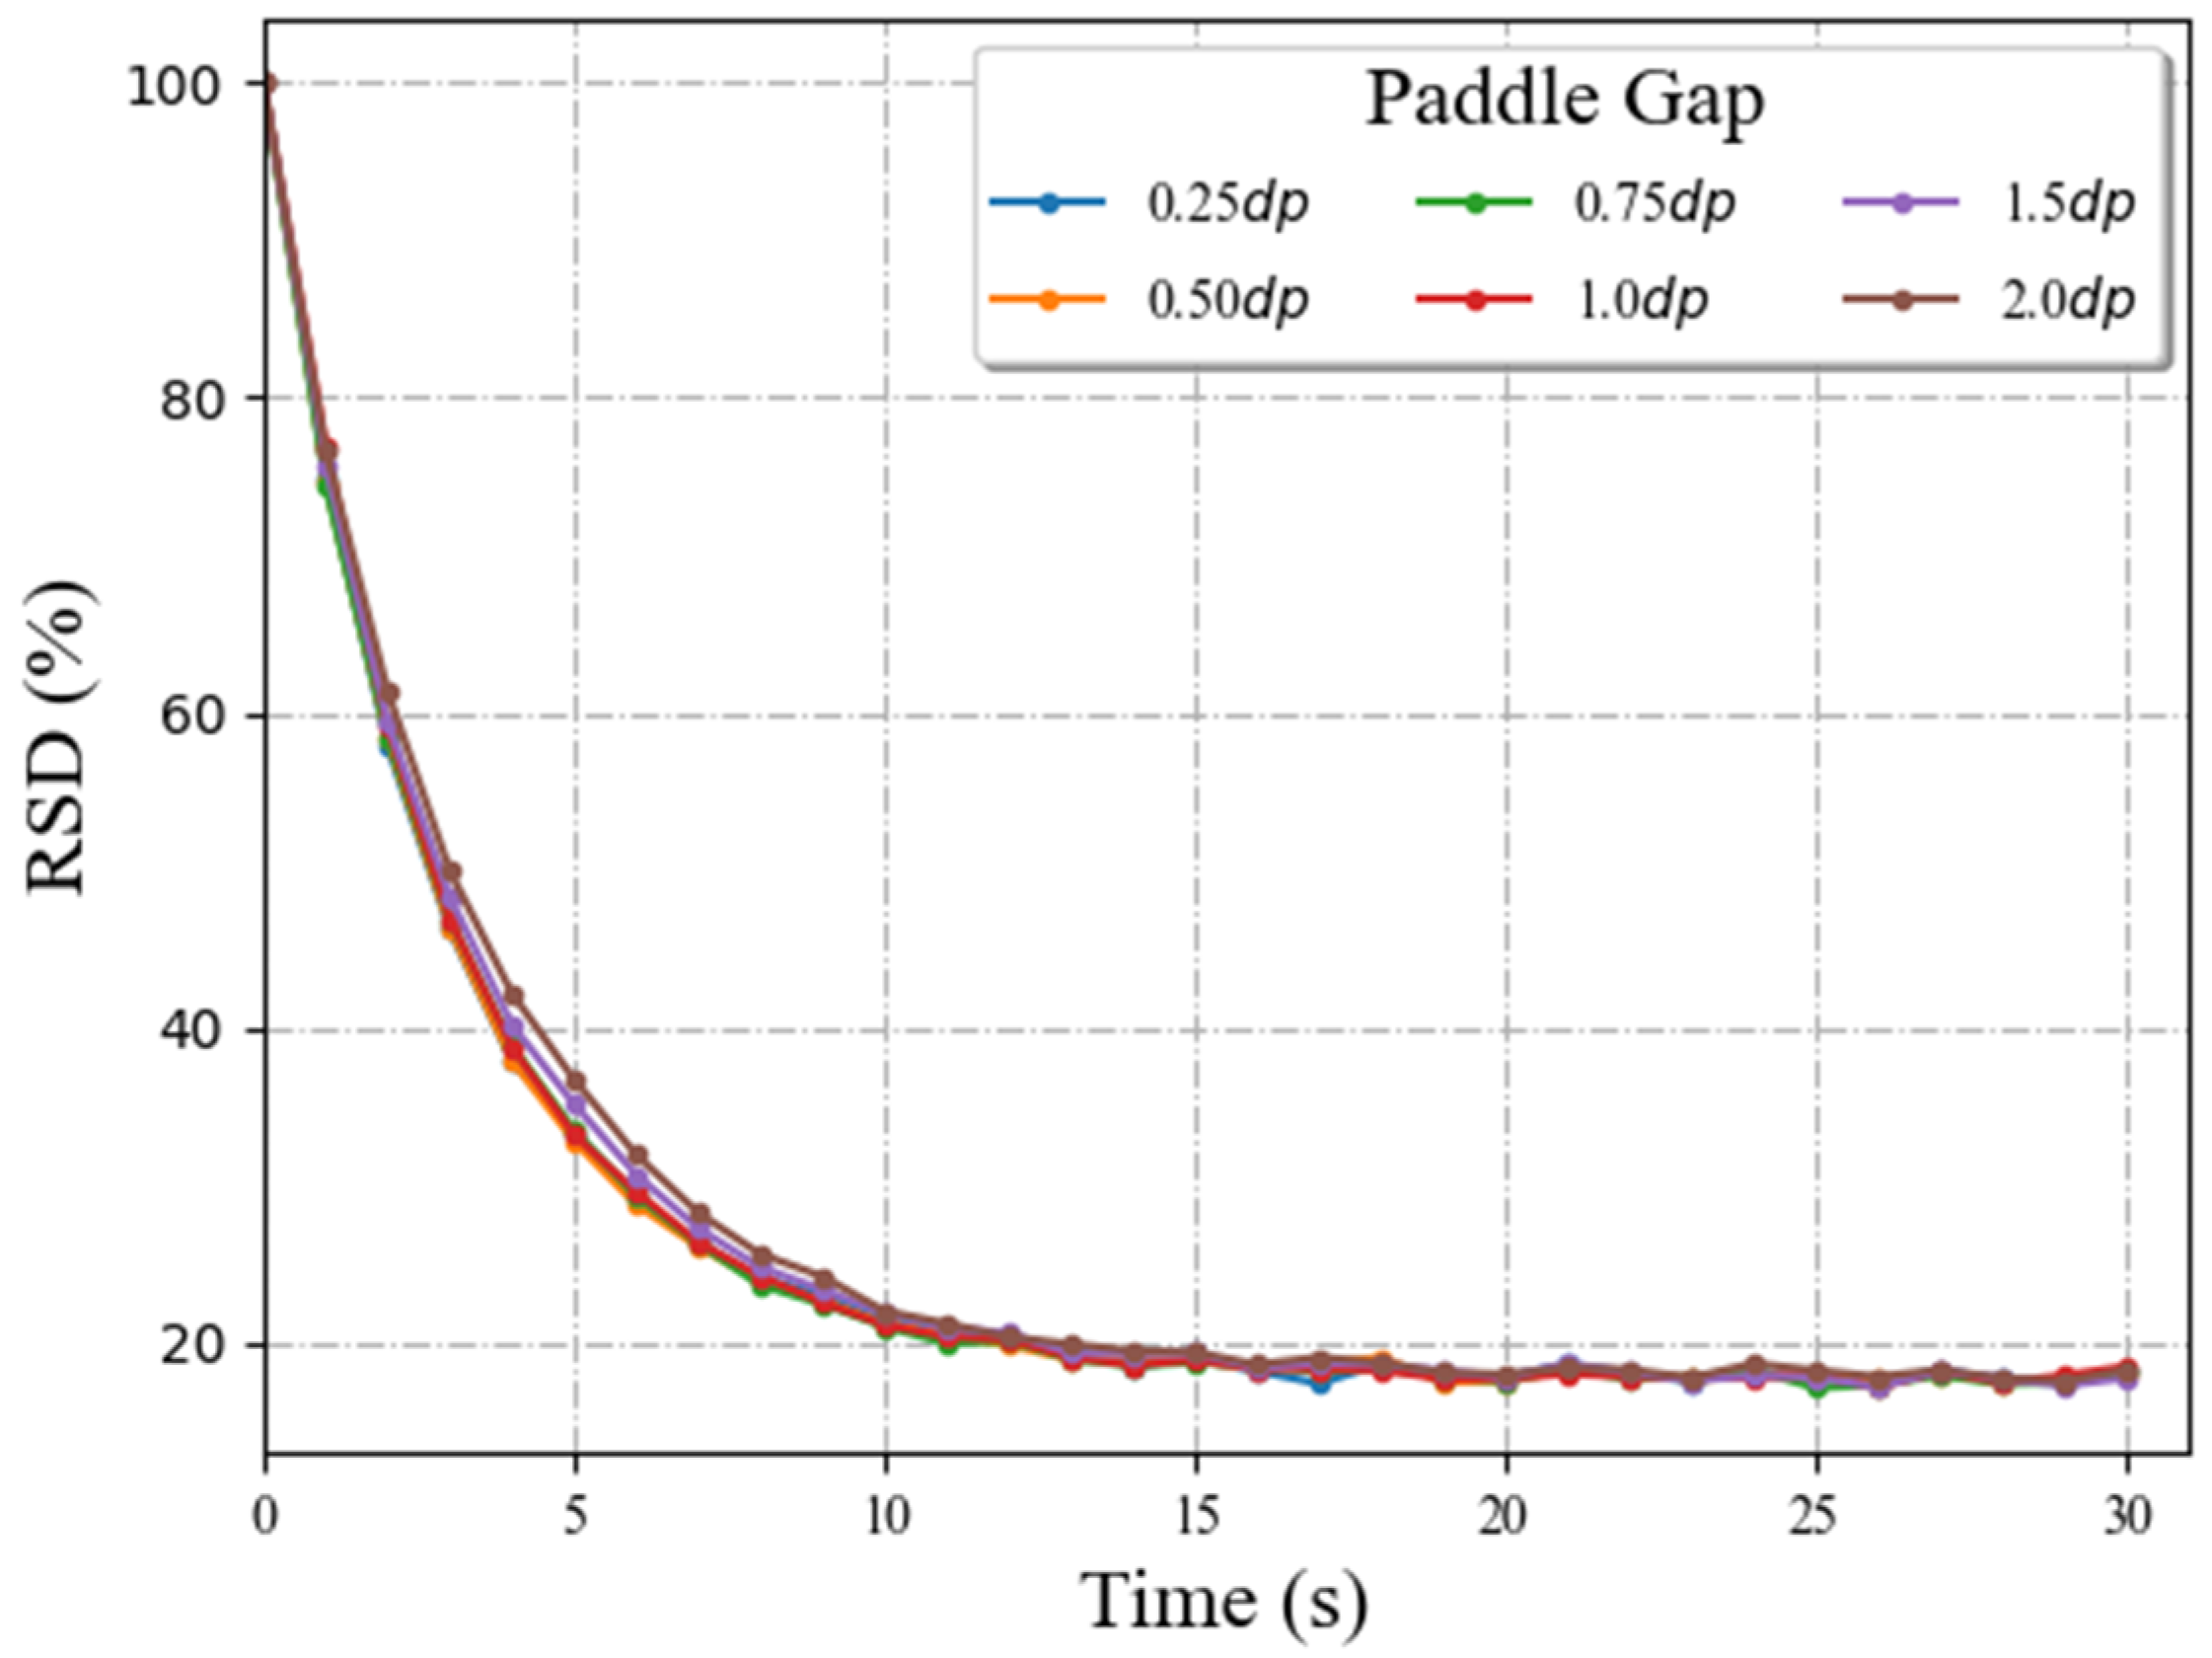
3.1. Mixing Performance
3.2. Particle Diffusivity
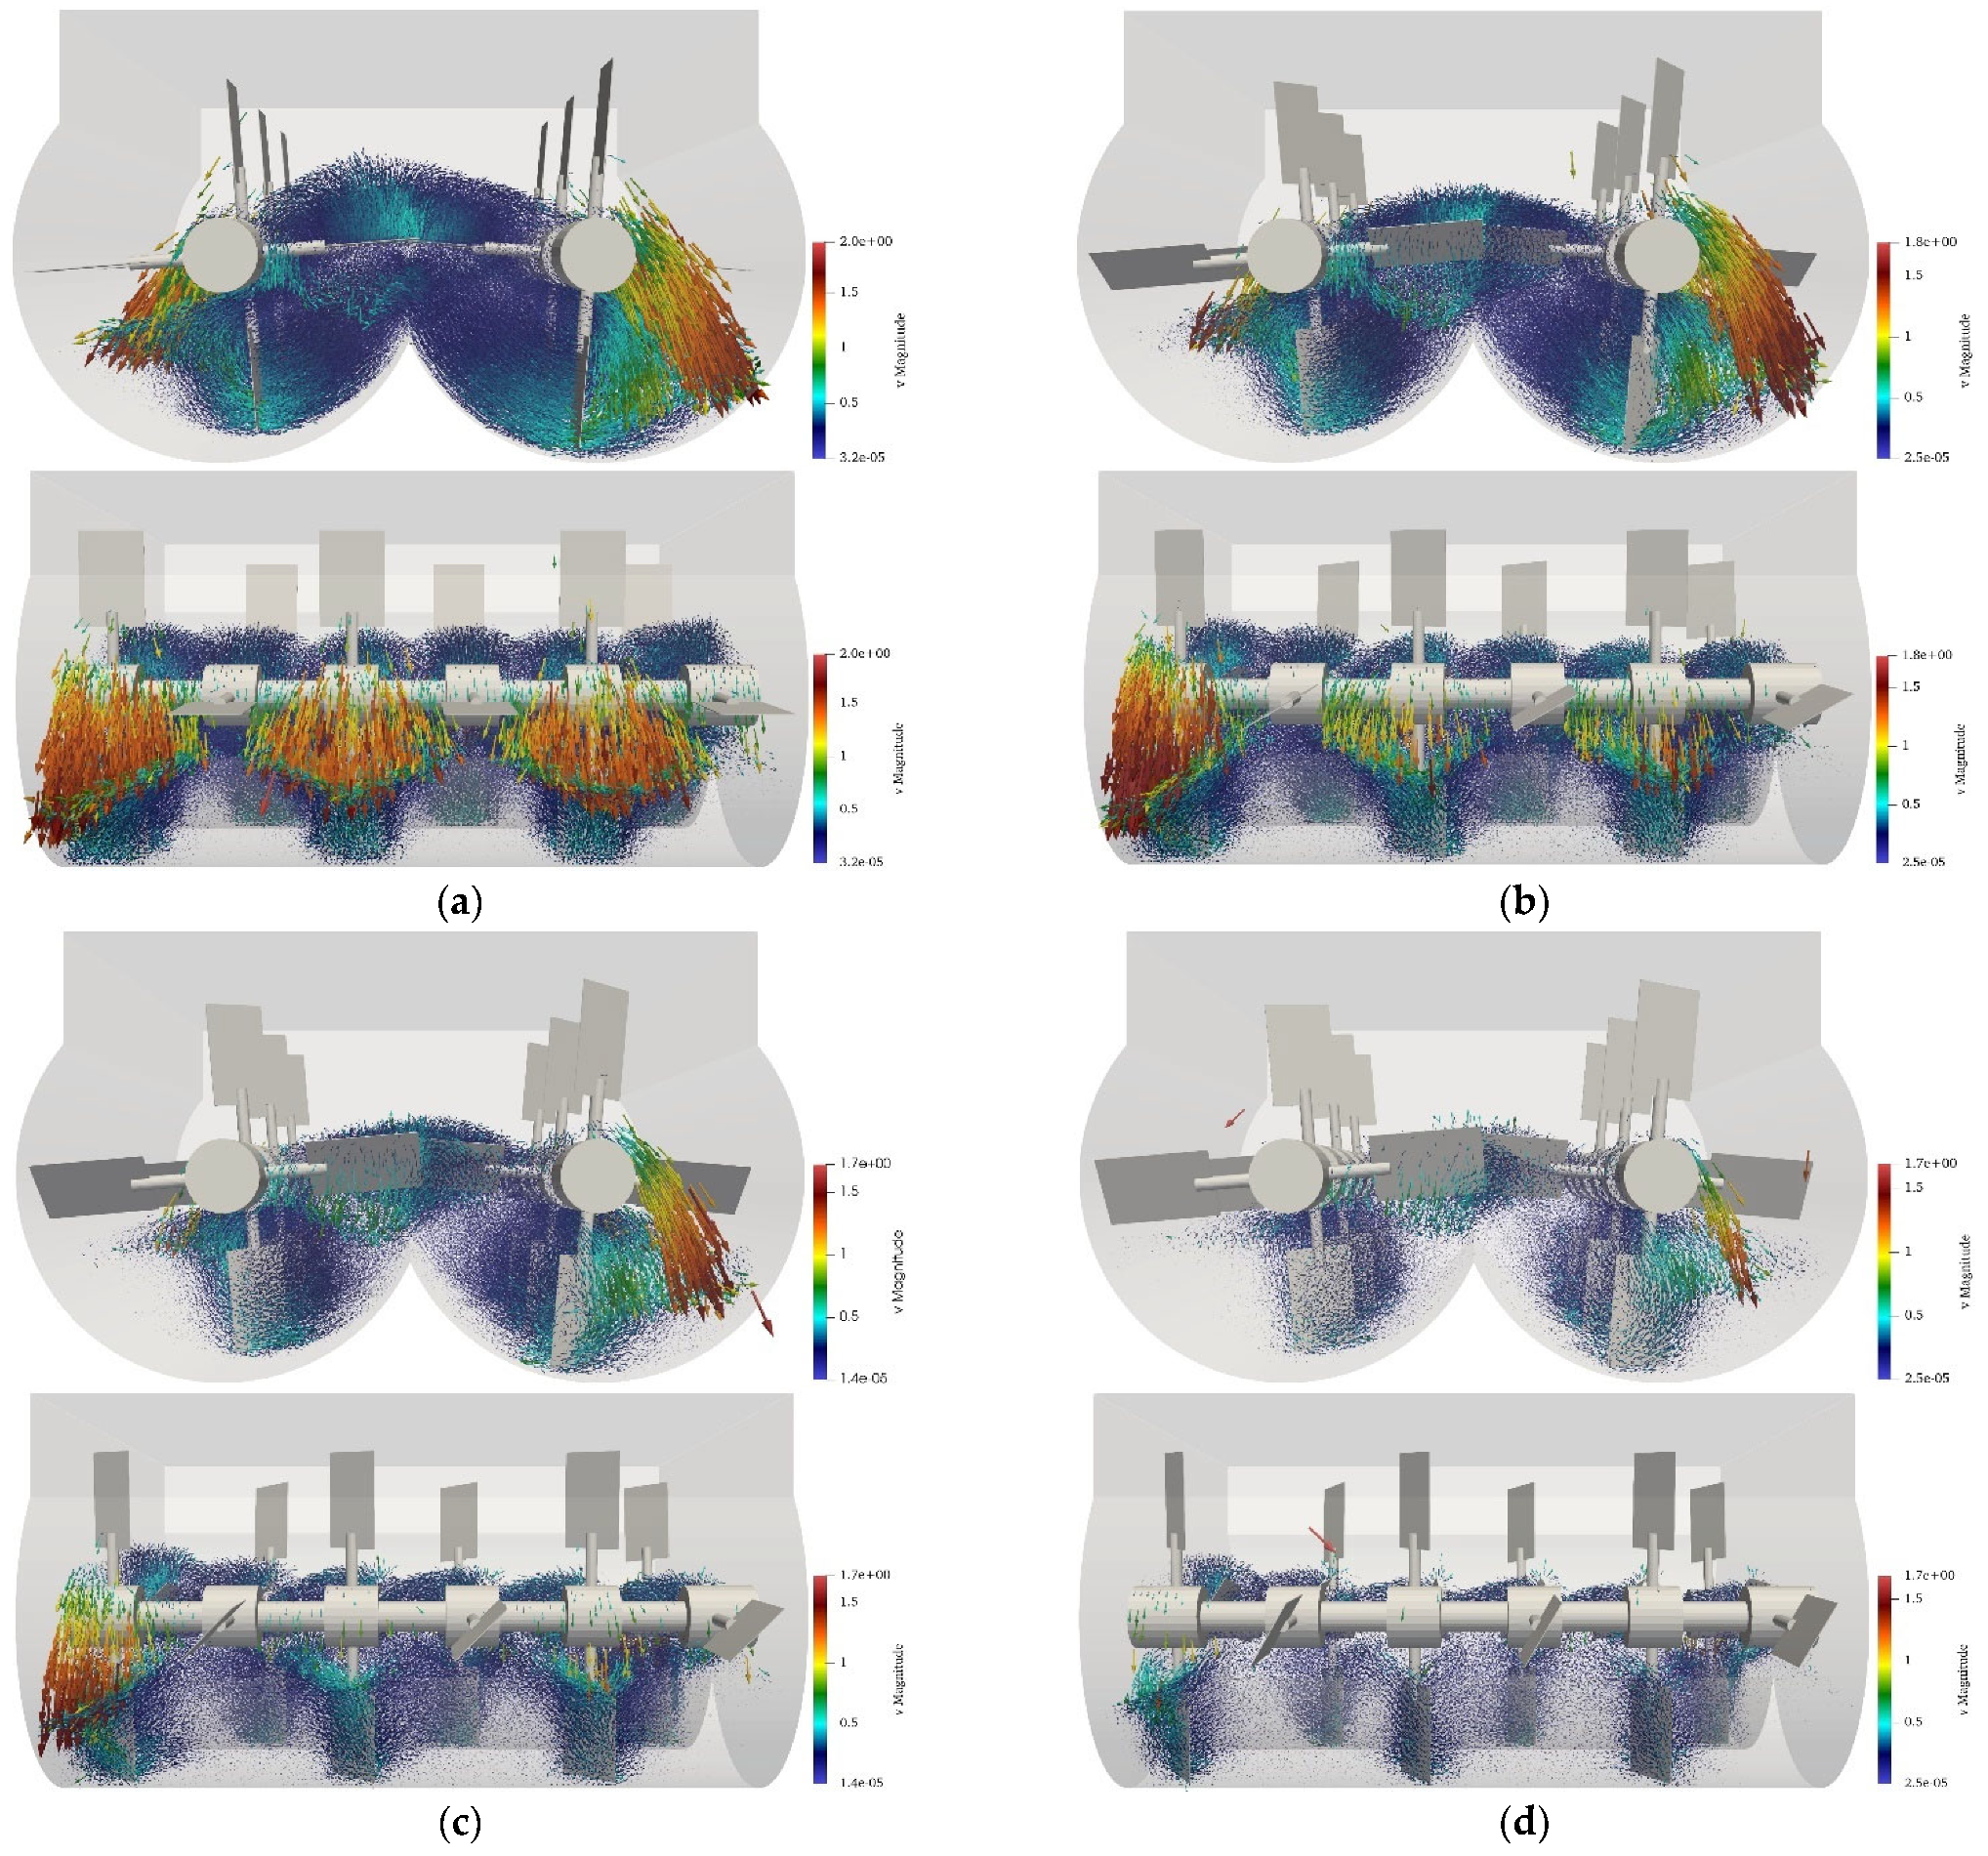
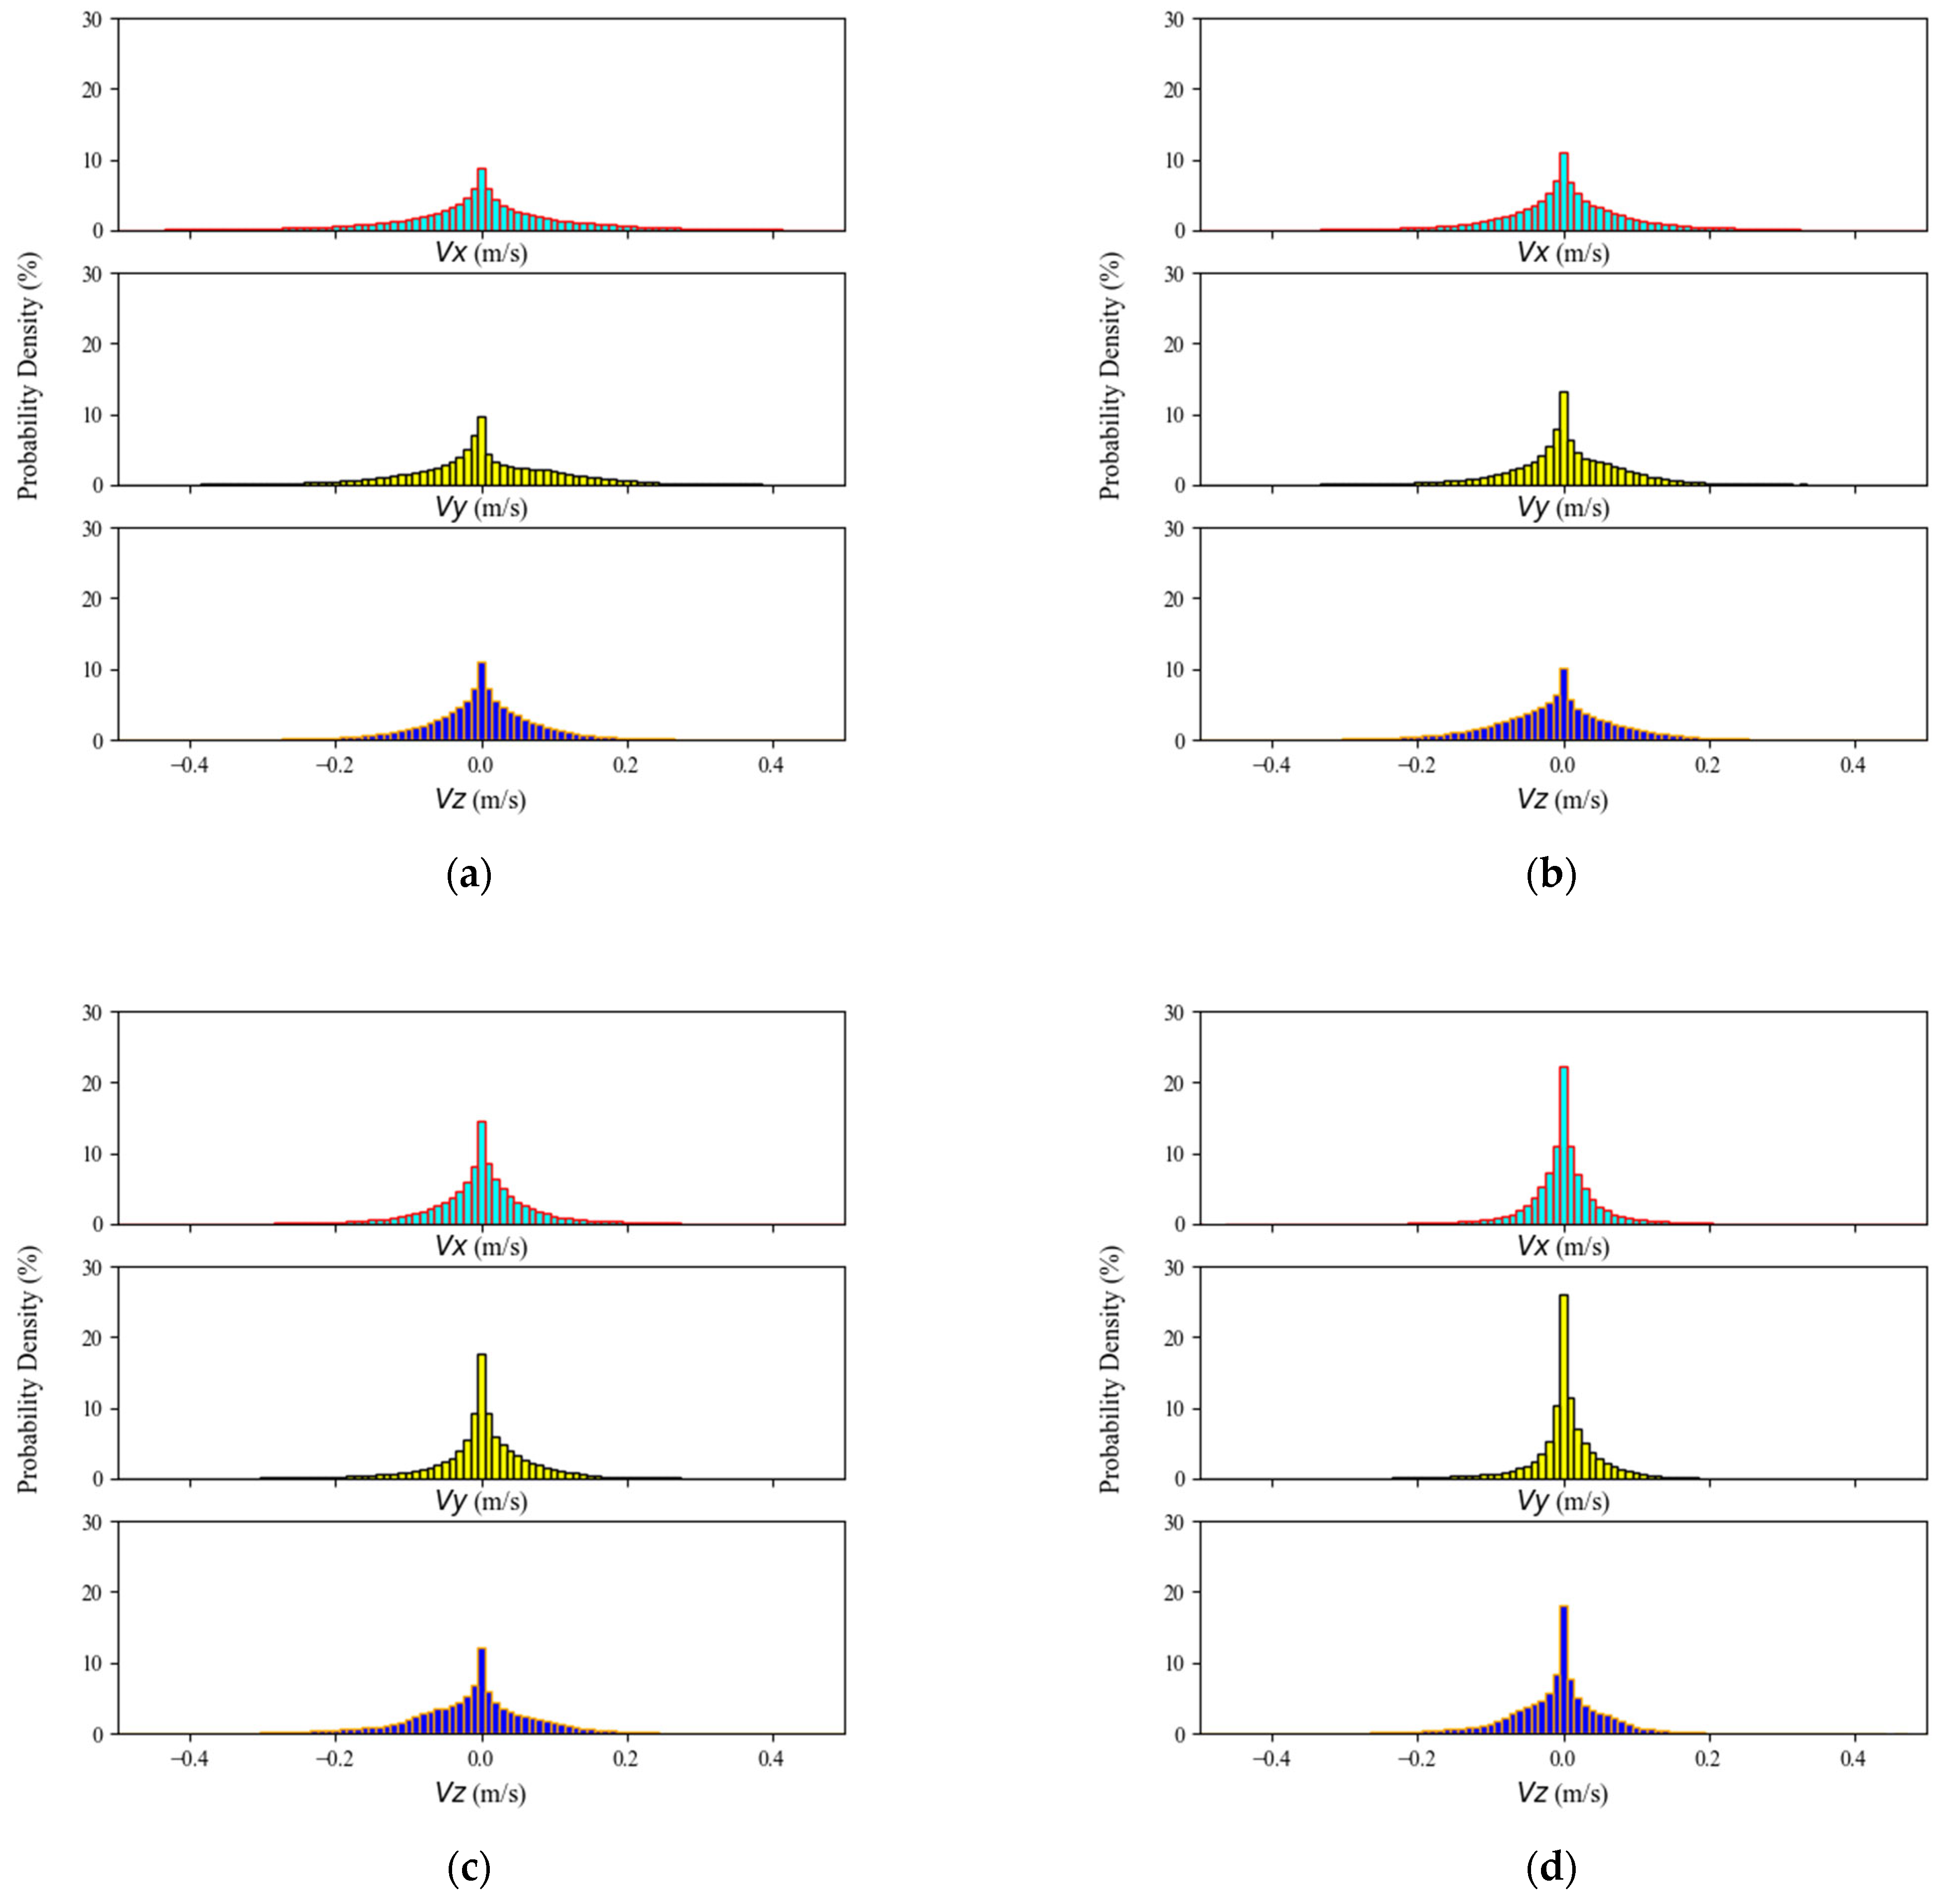
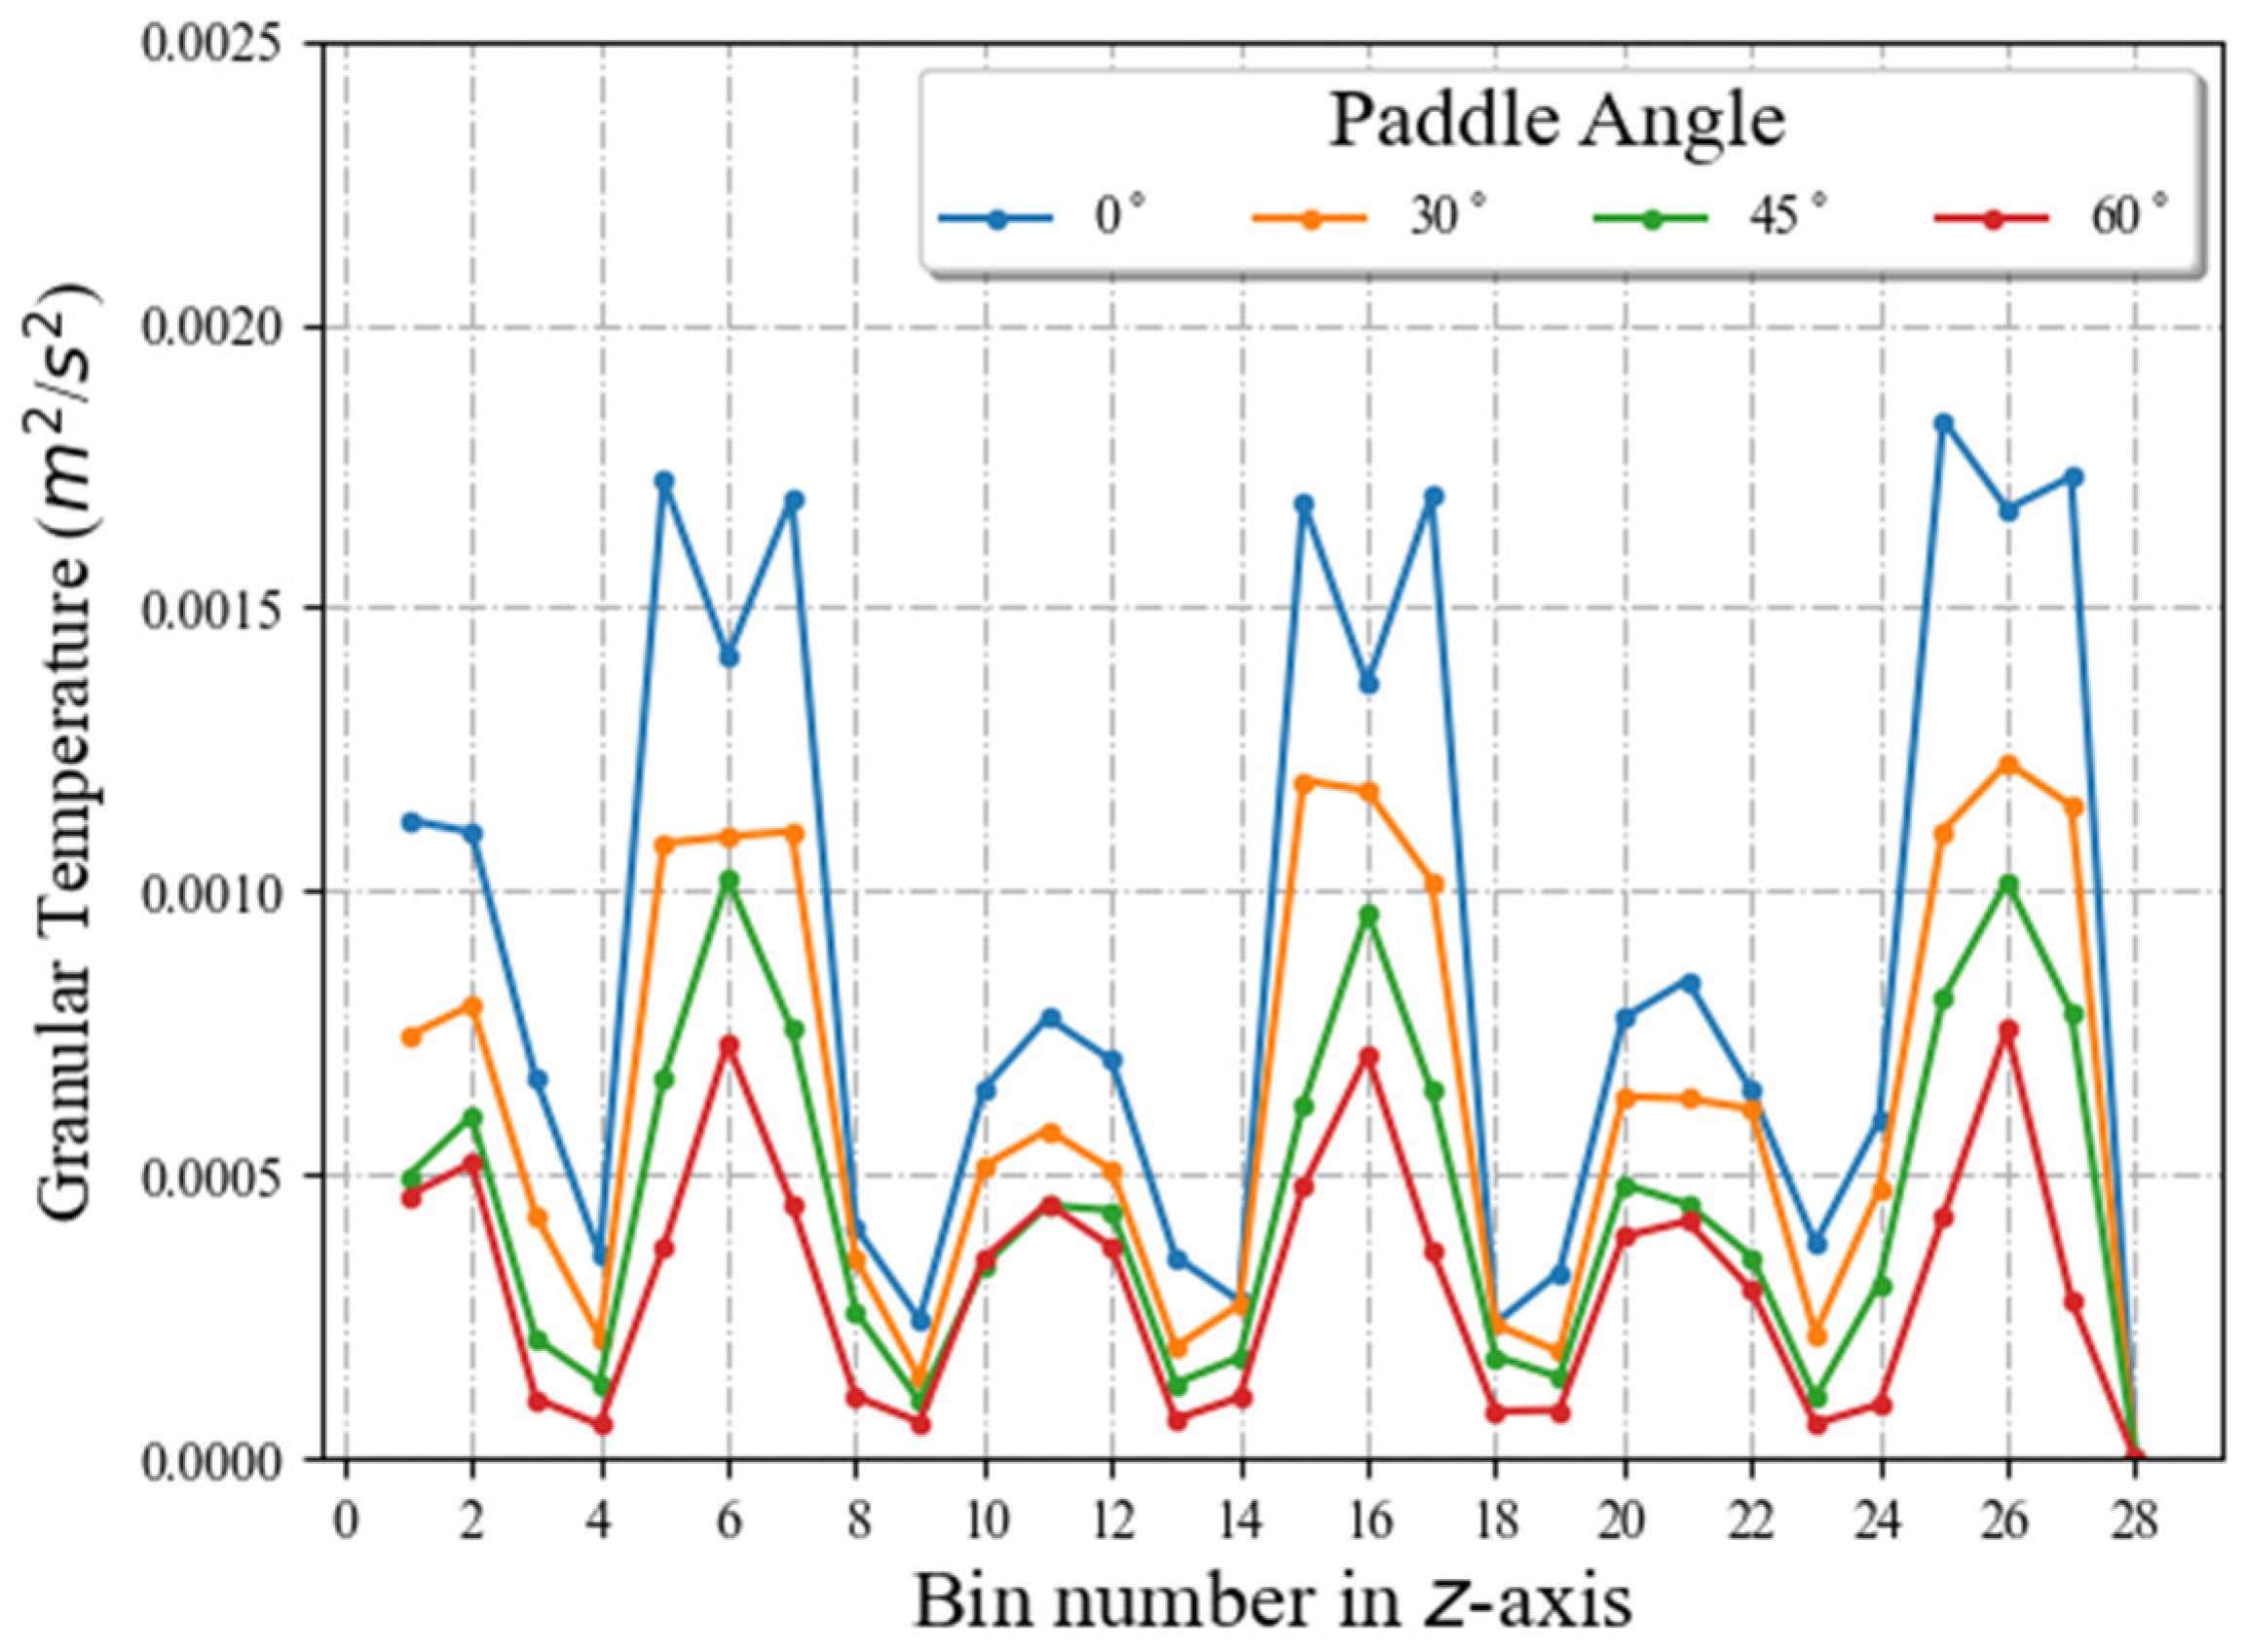
3.3. Mixing Kinetics: Velocity Distribution and Granular Temperature
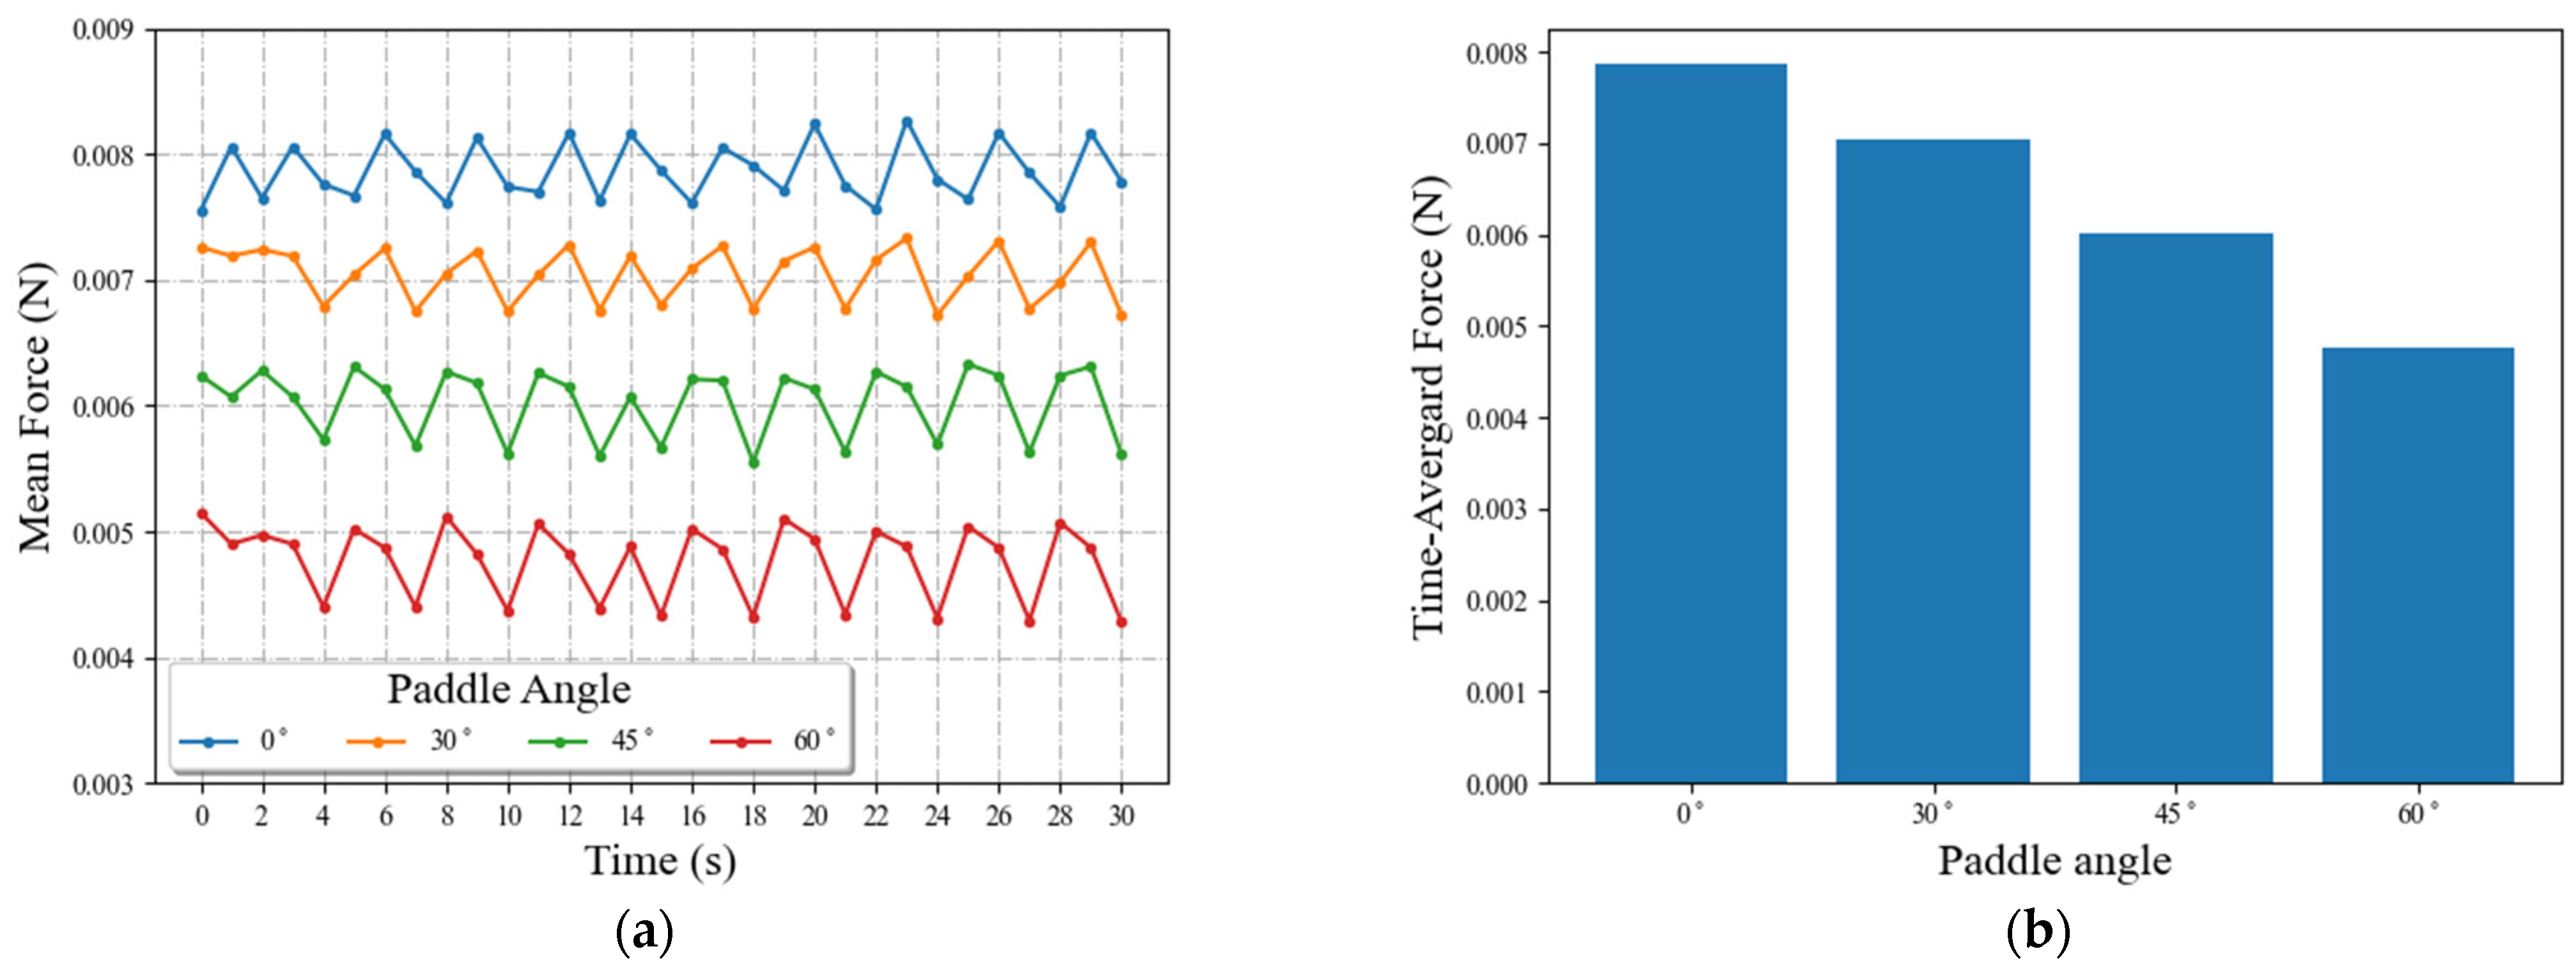
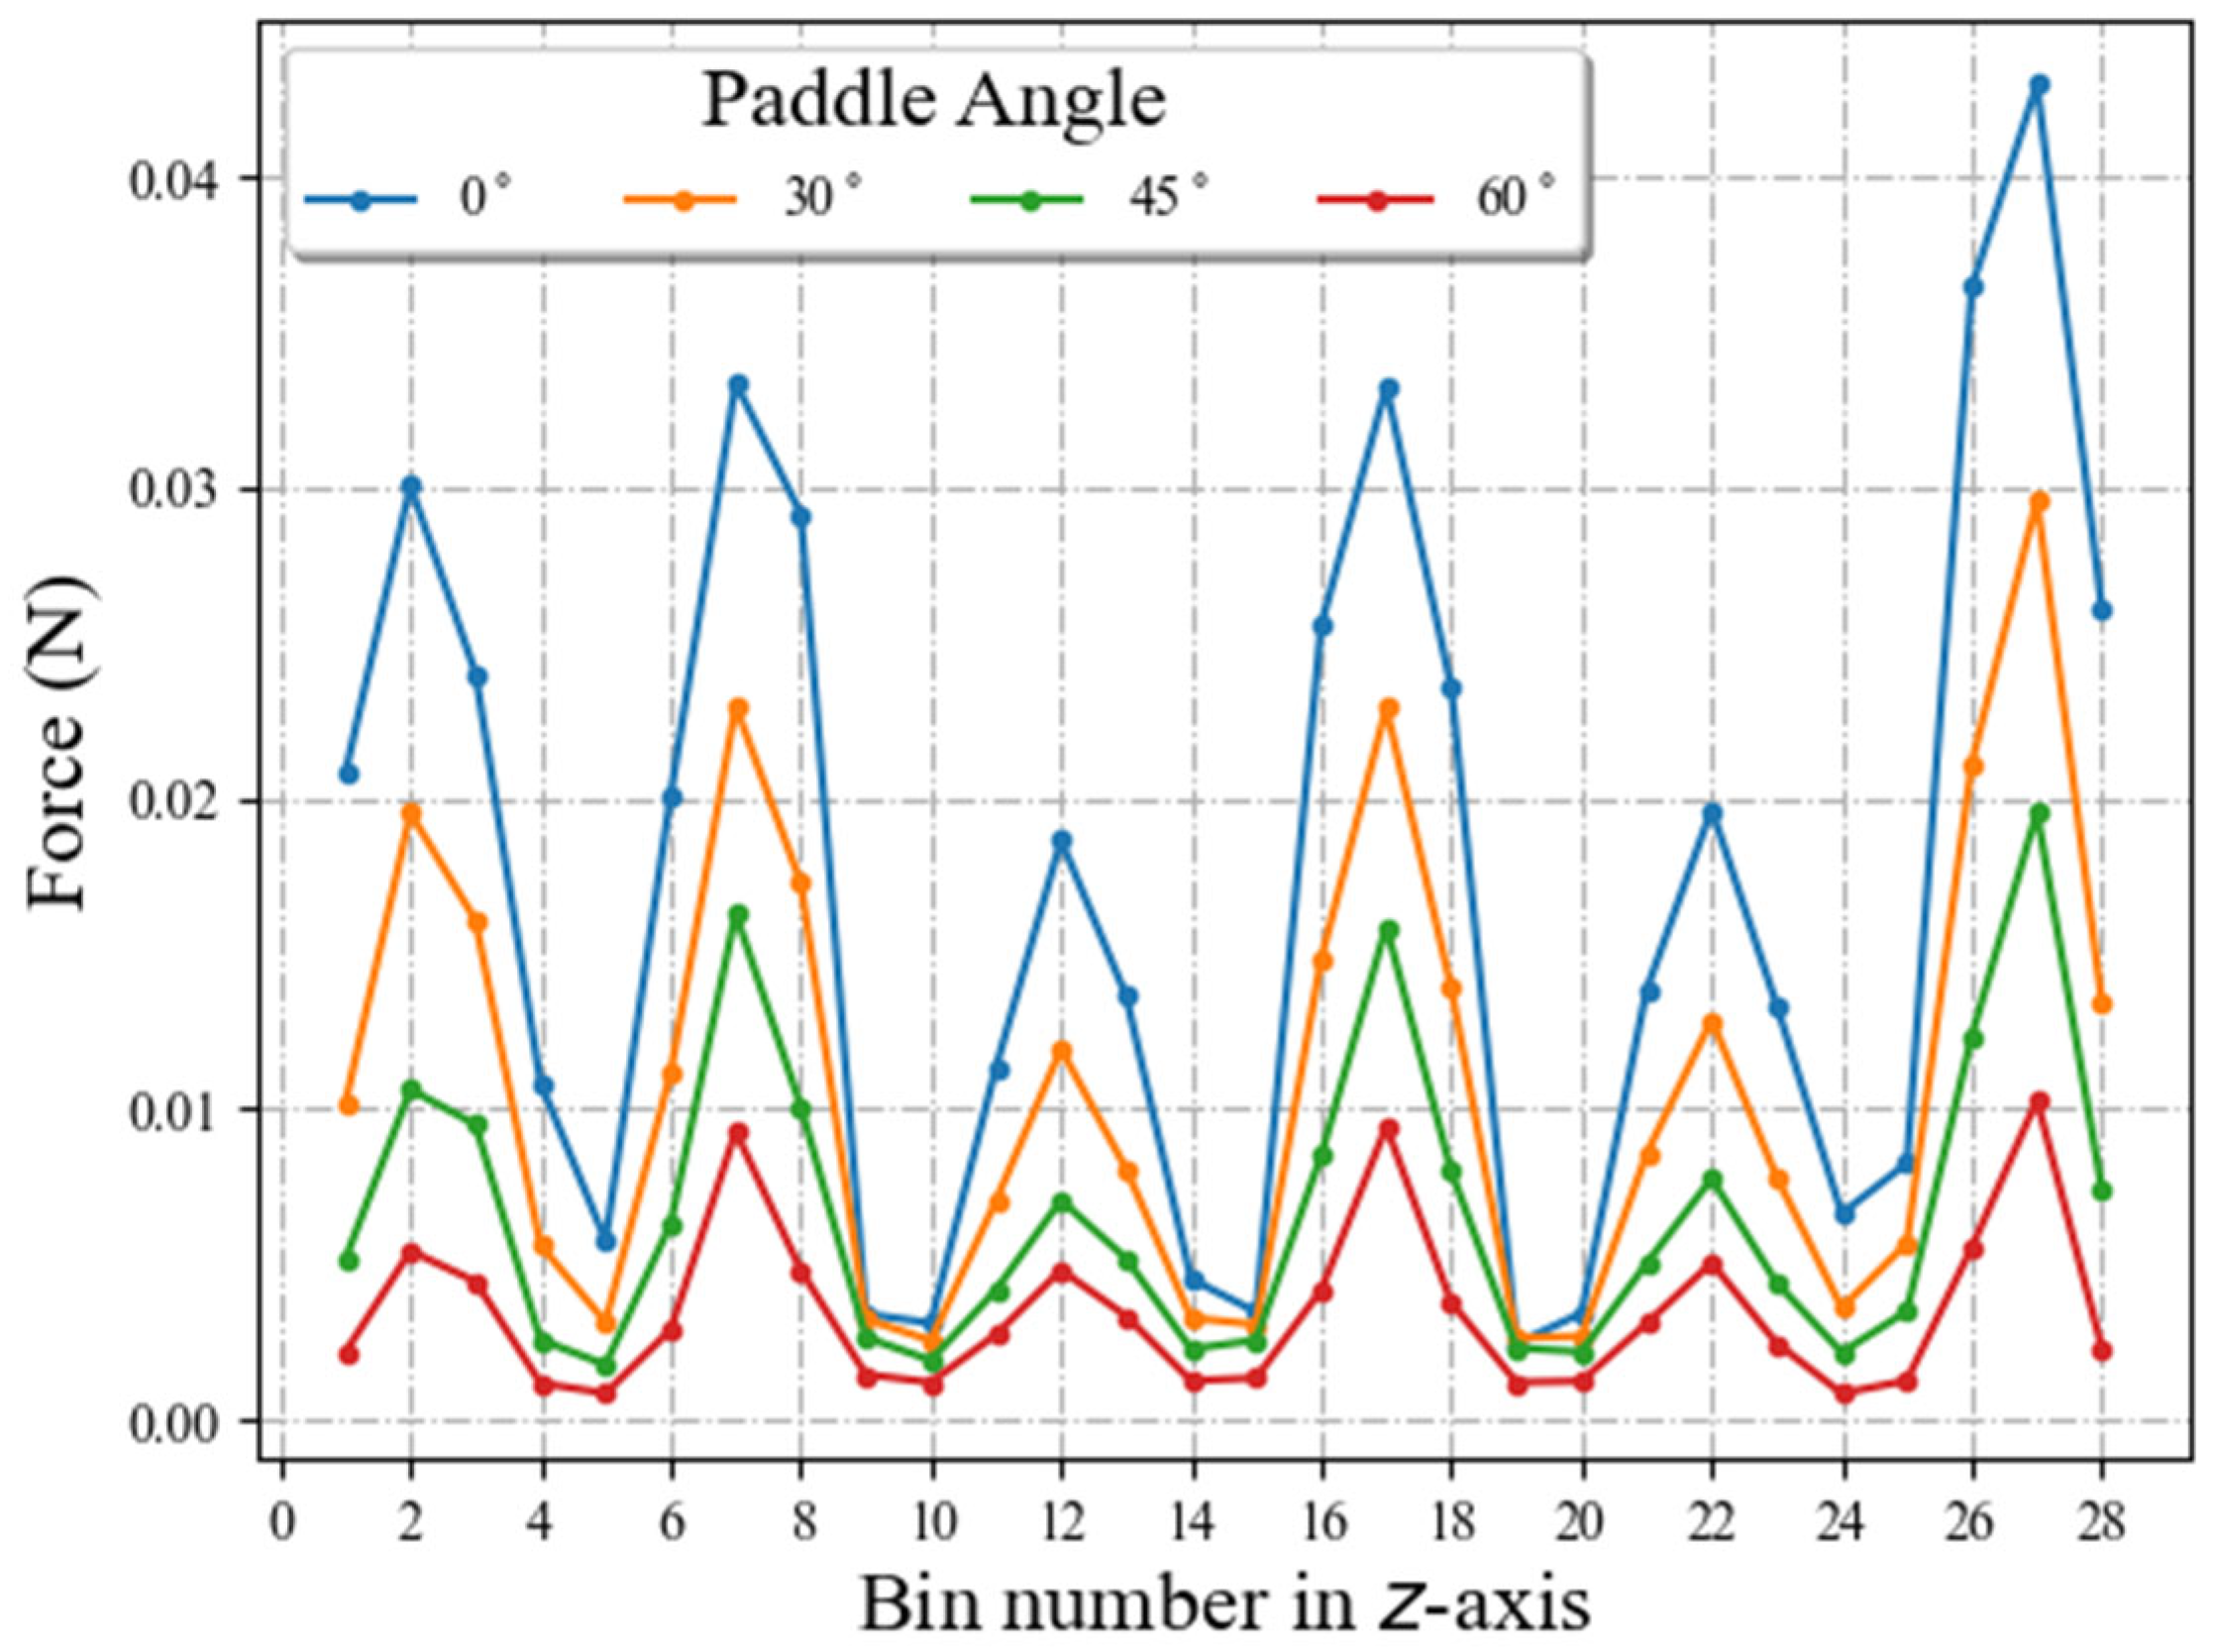
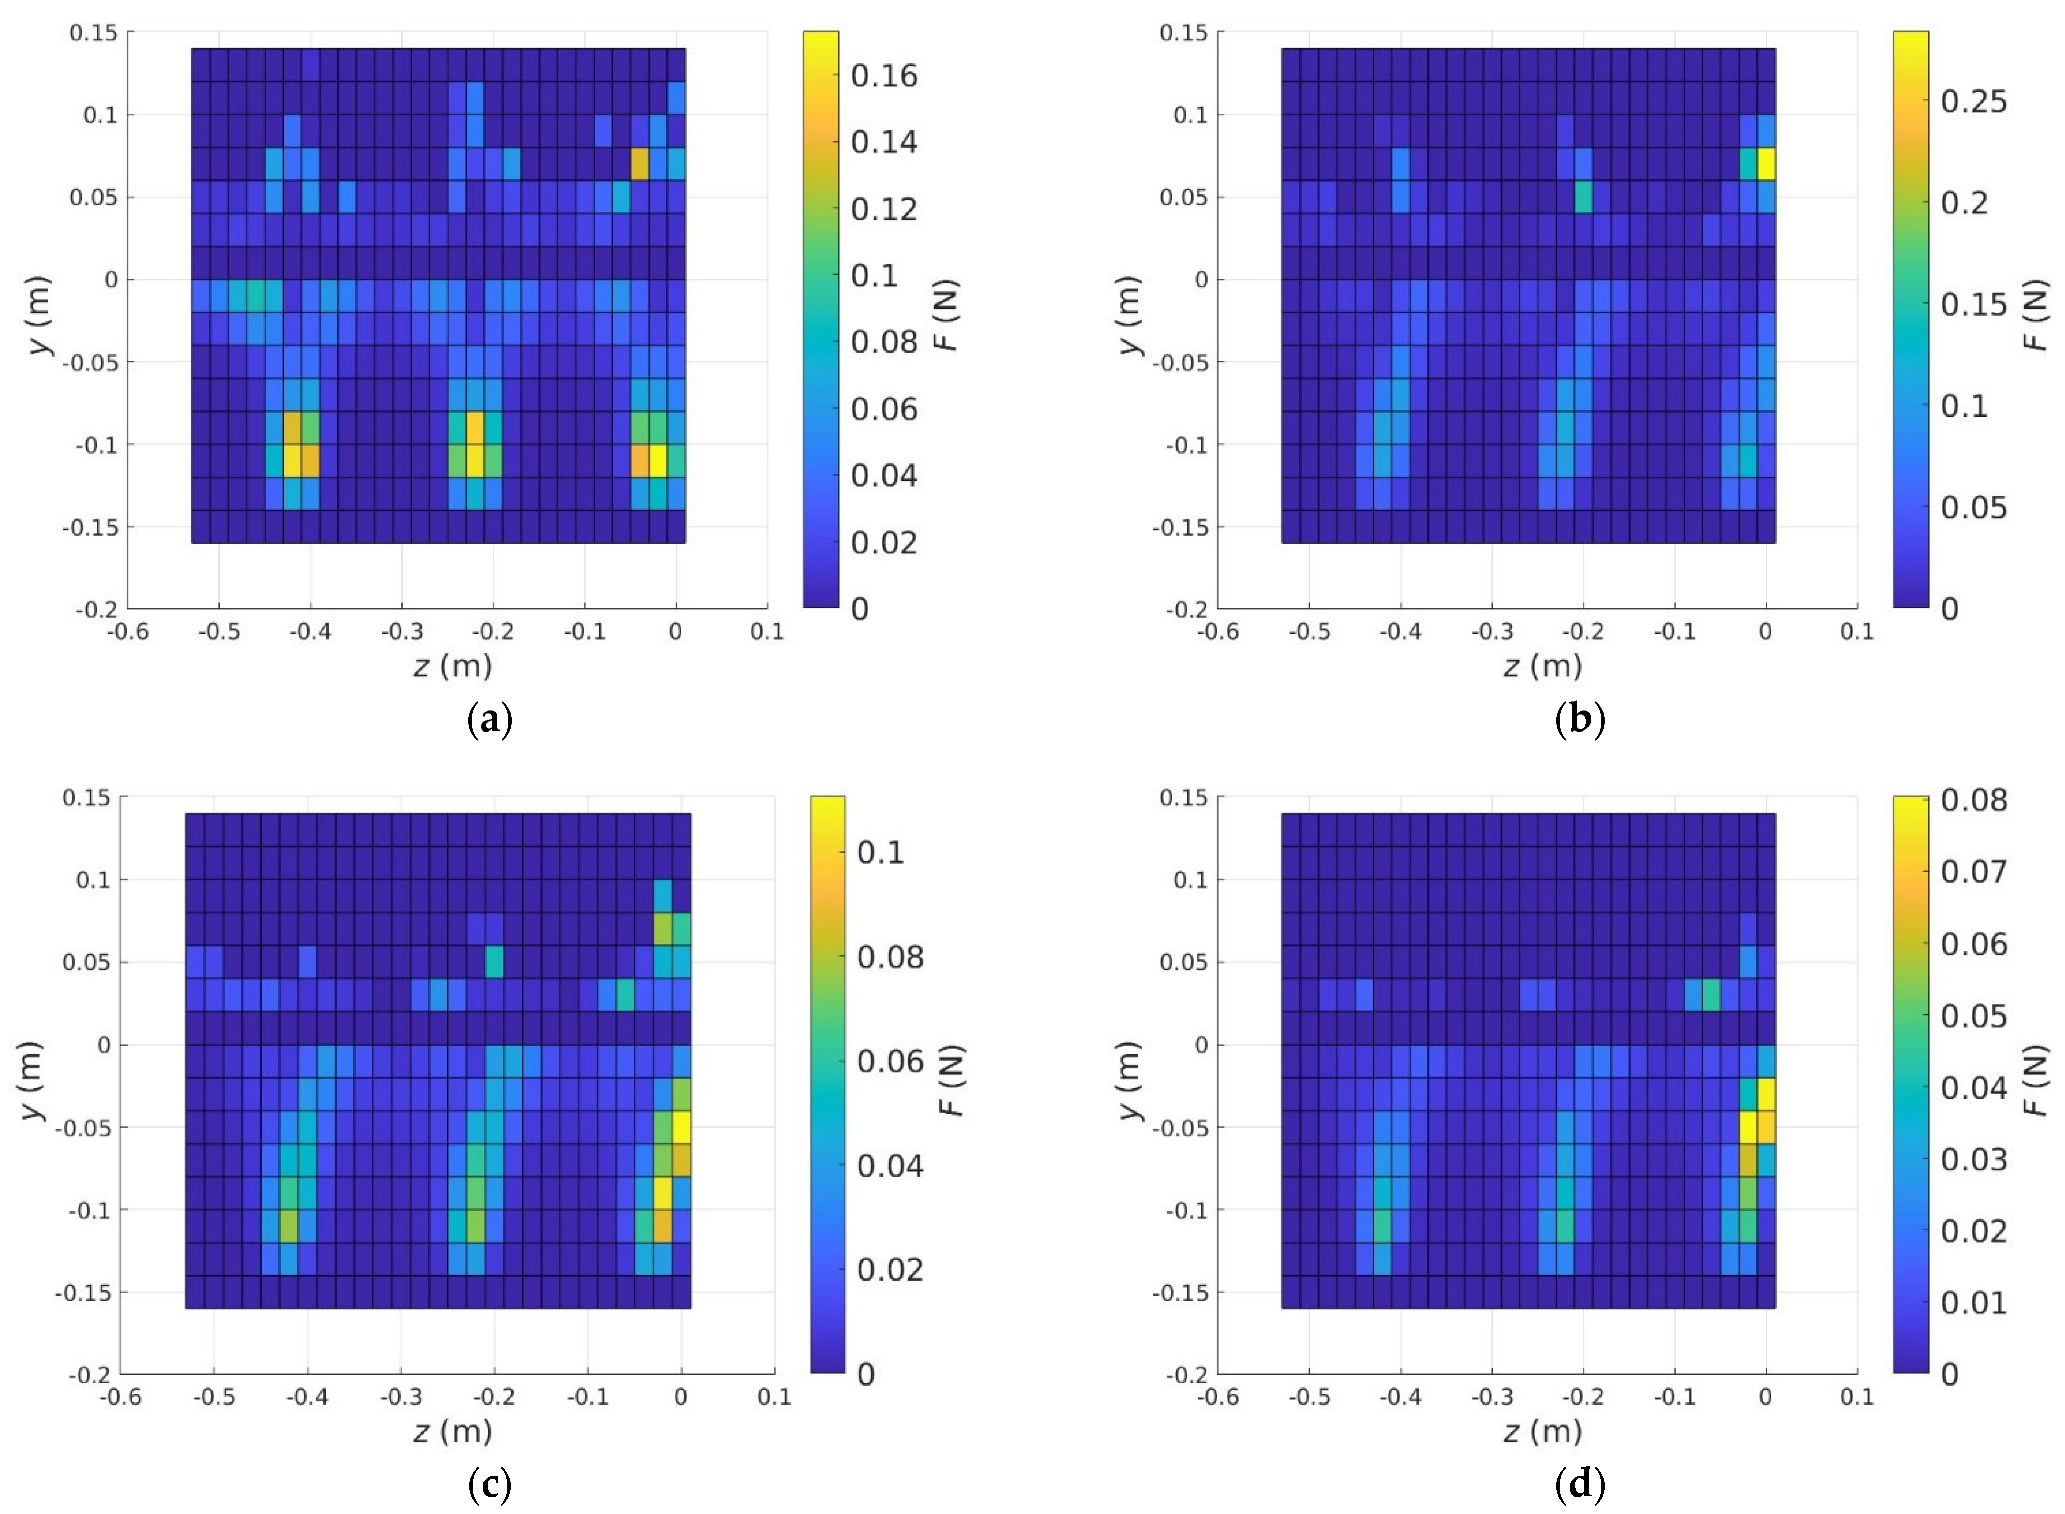
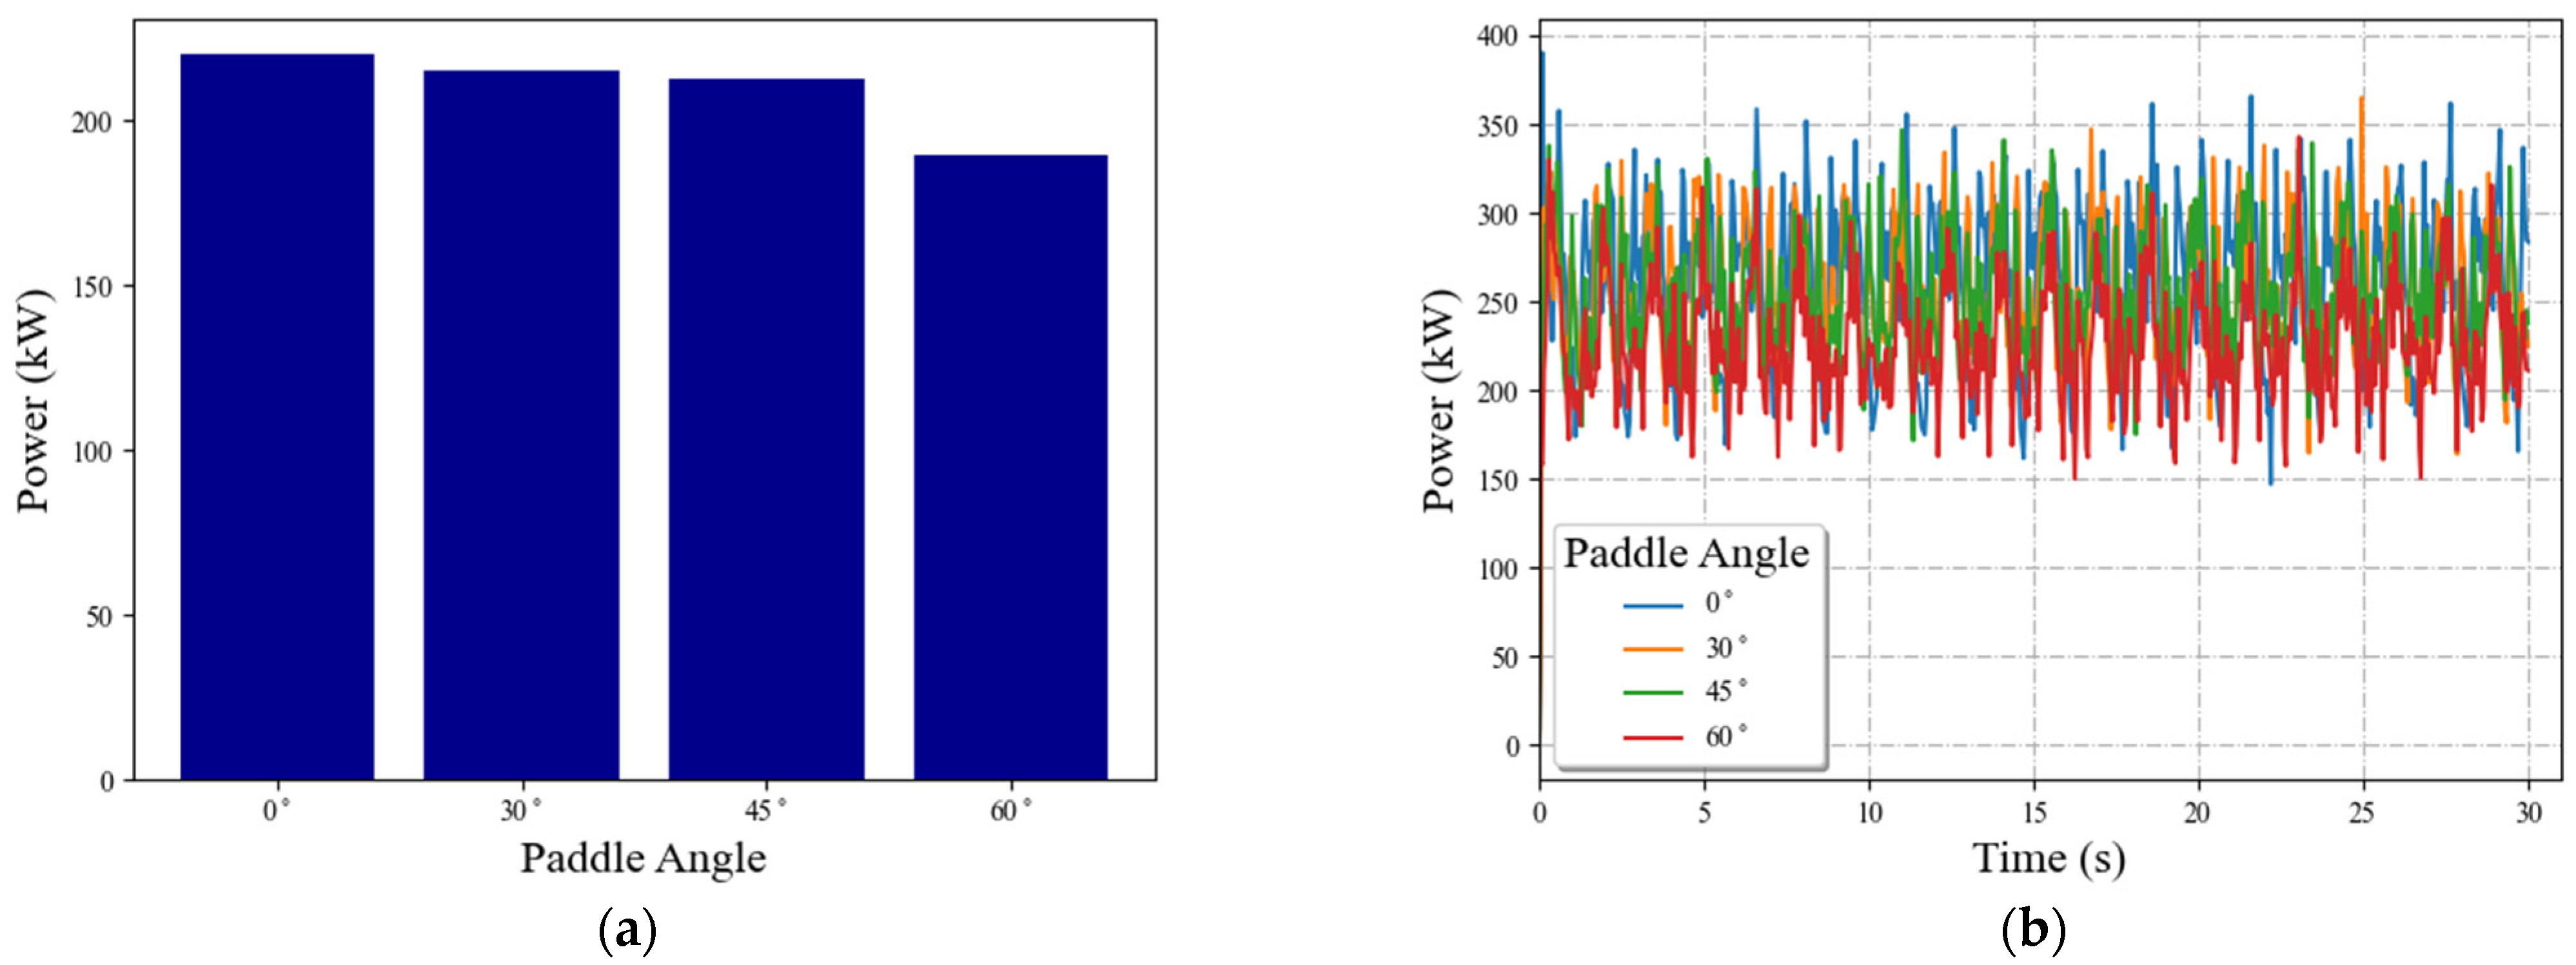
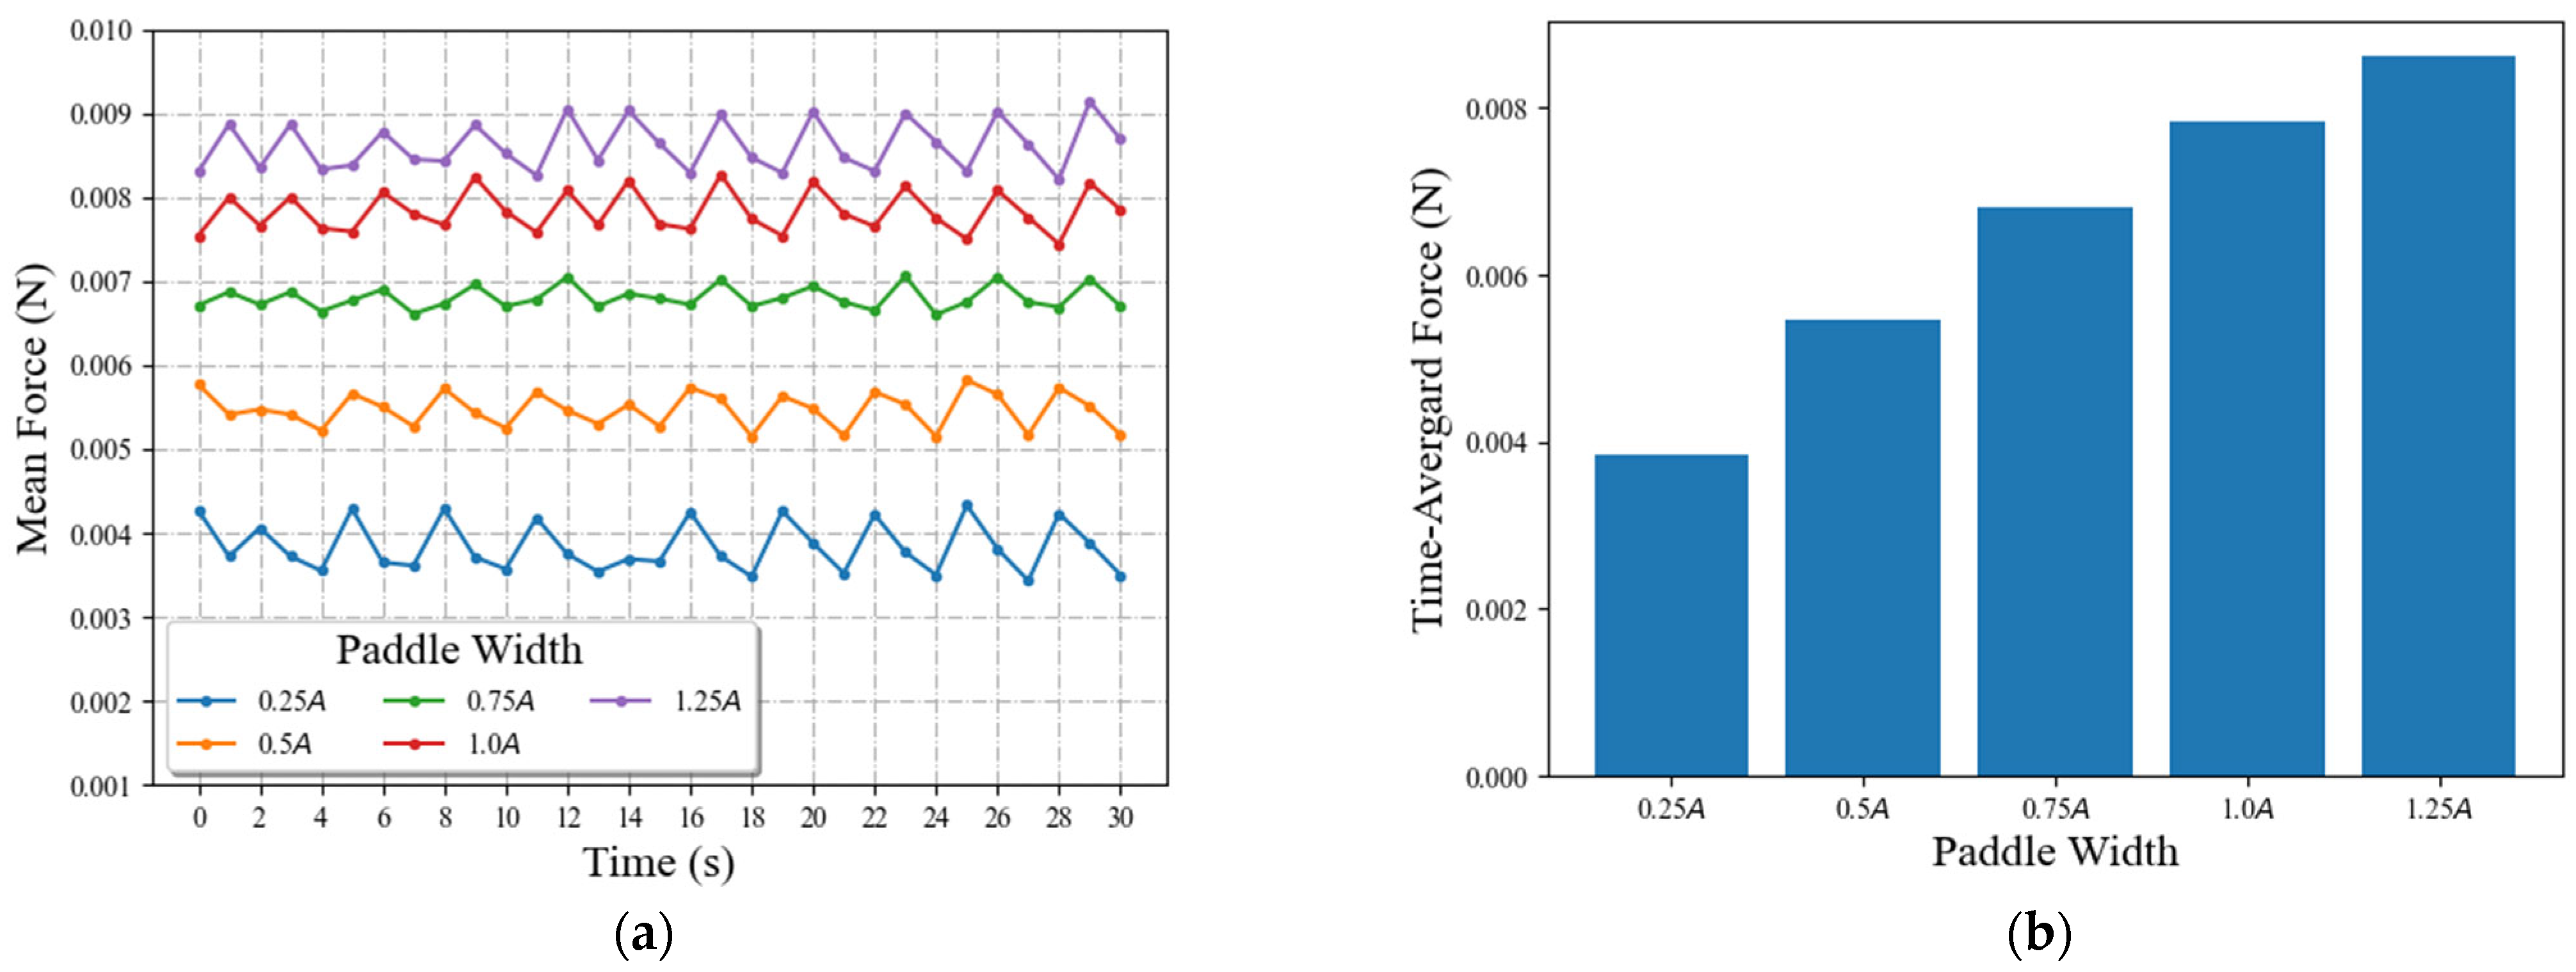
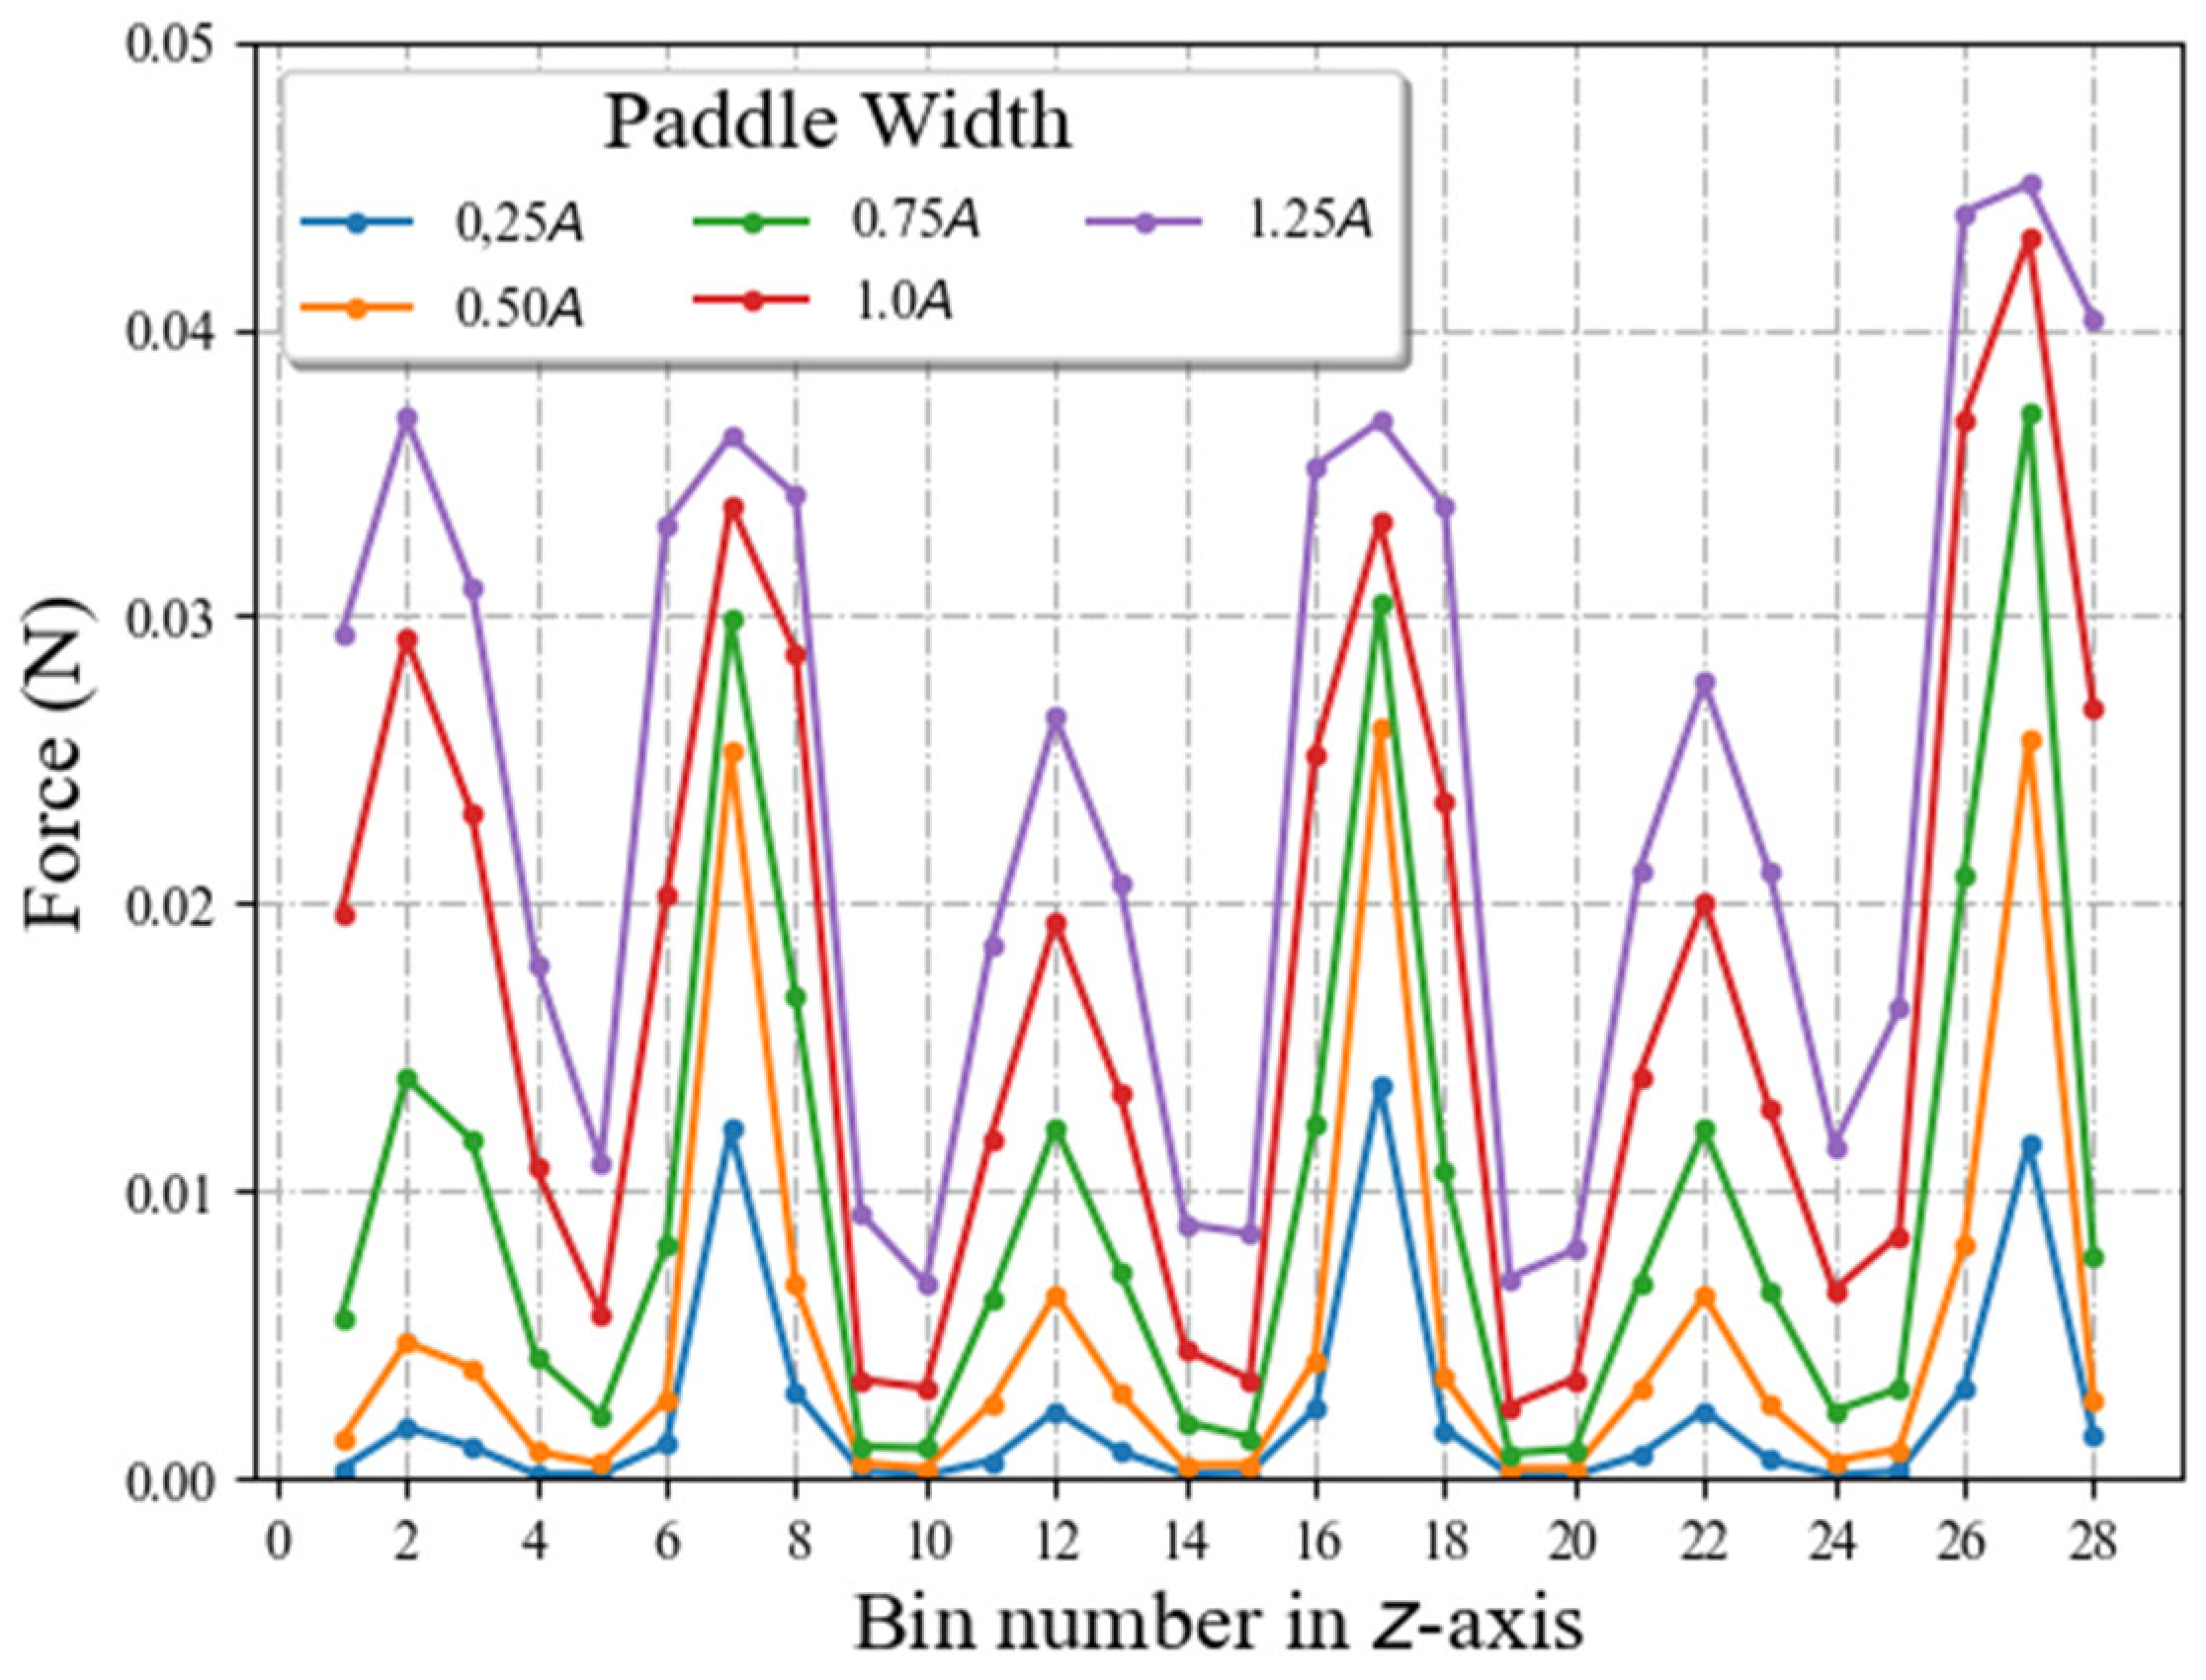
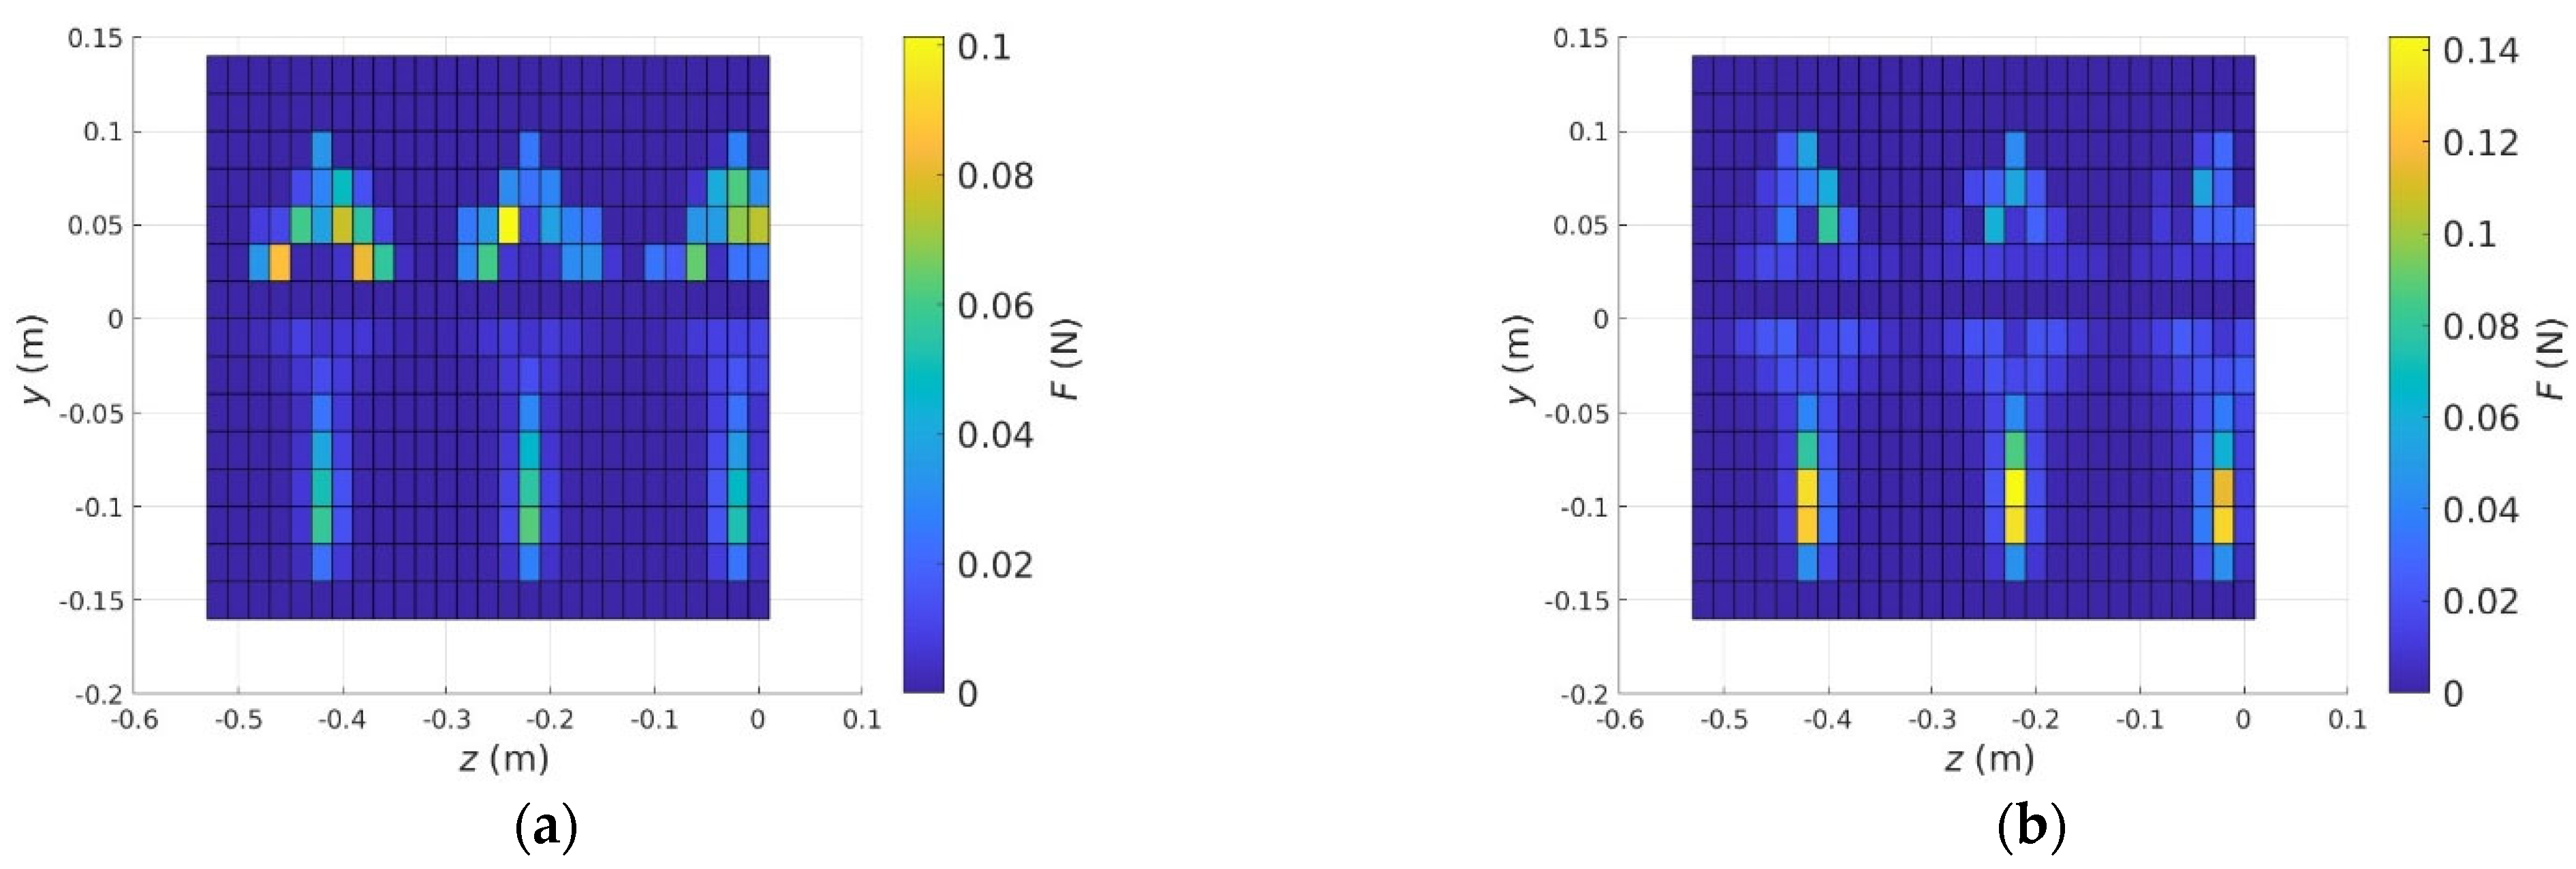
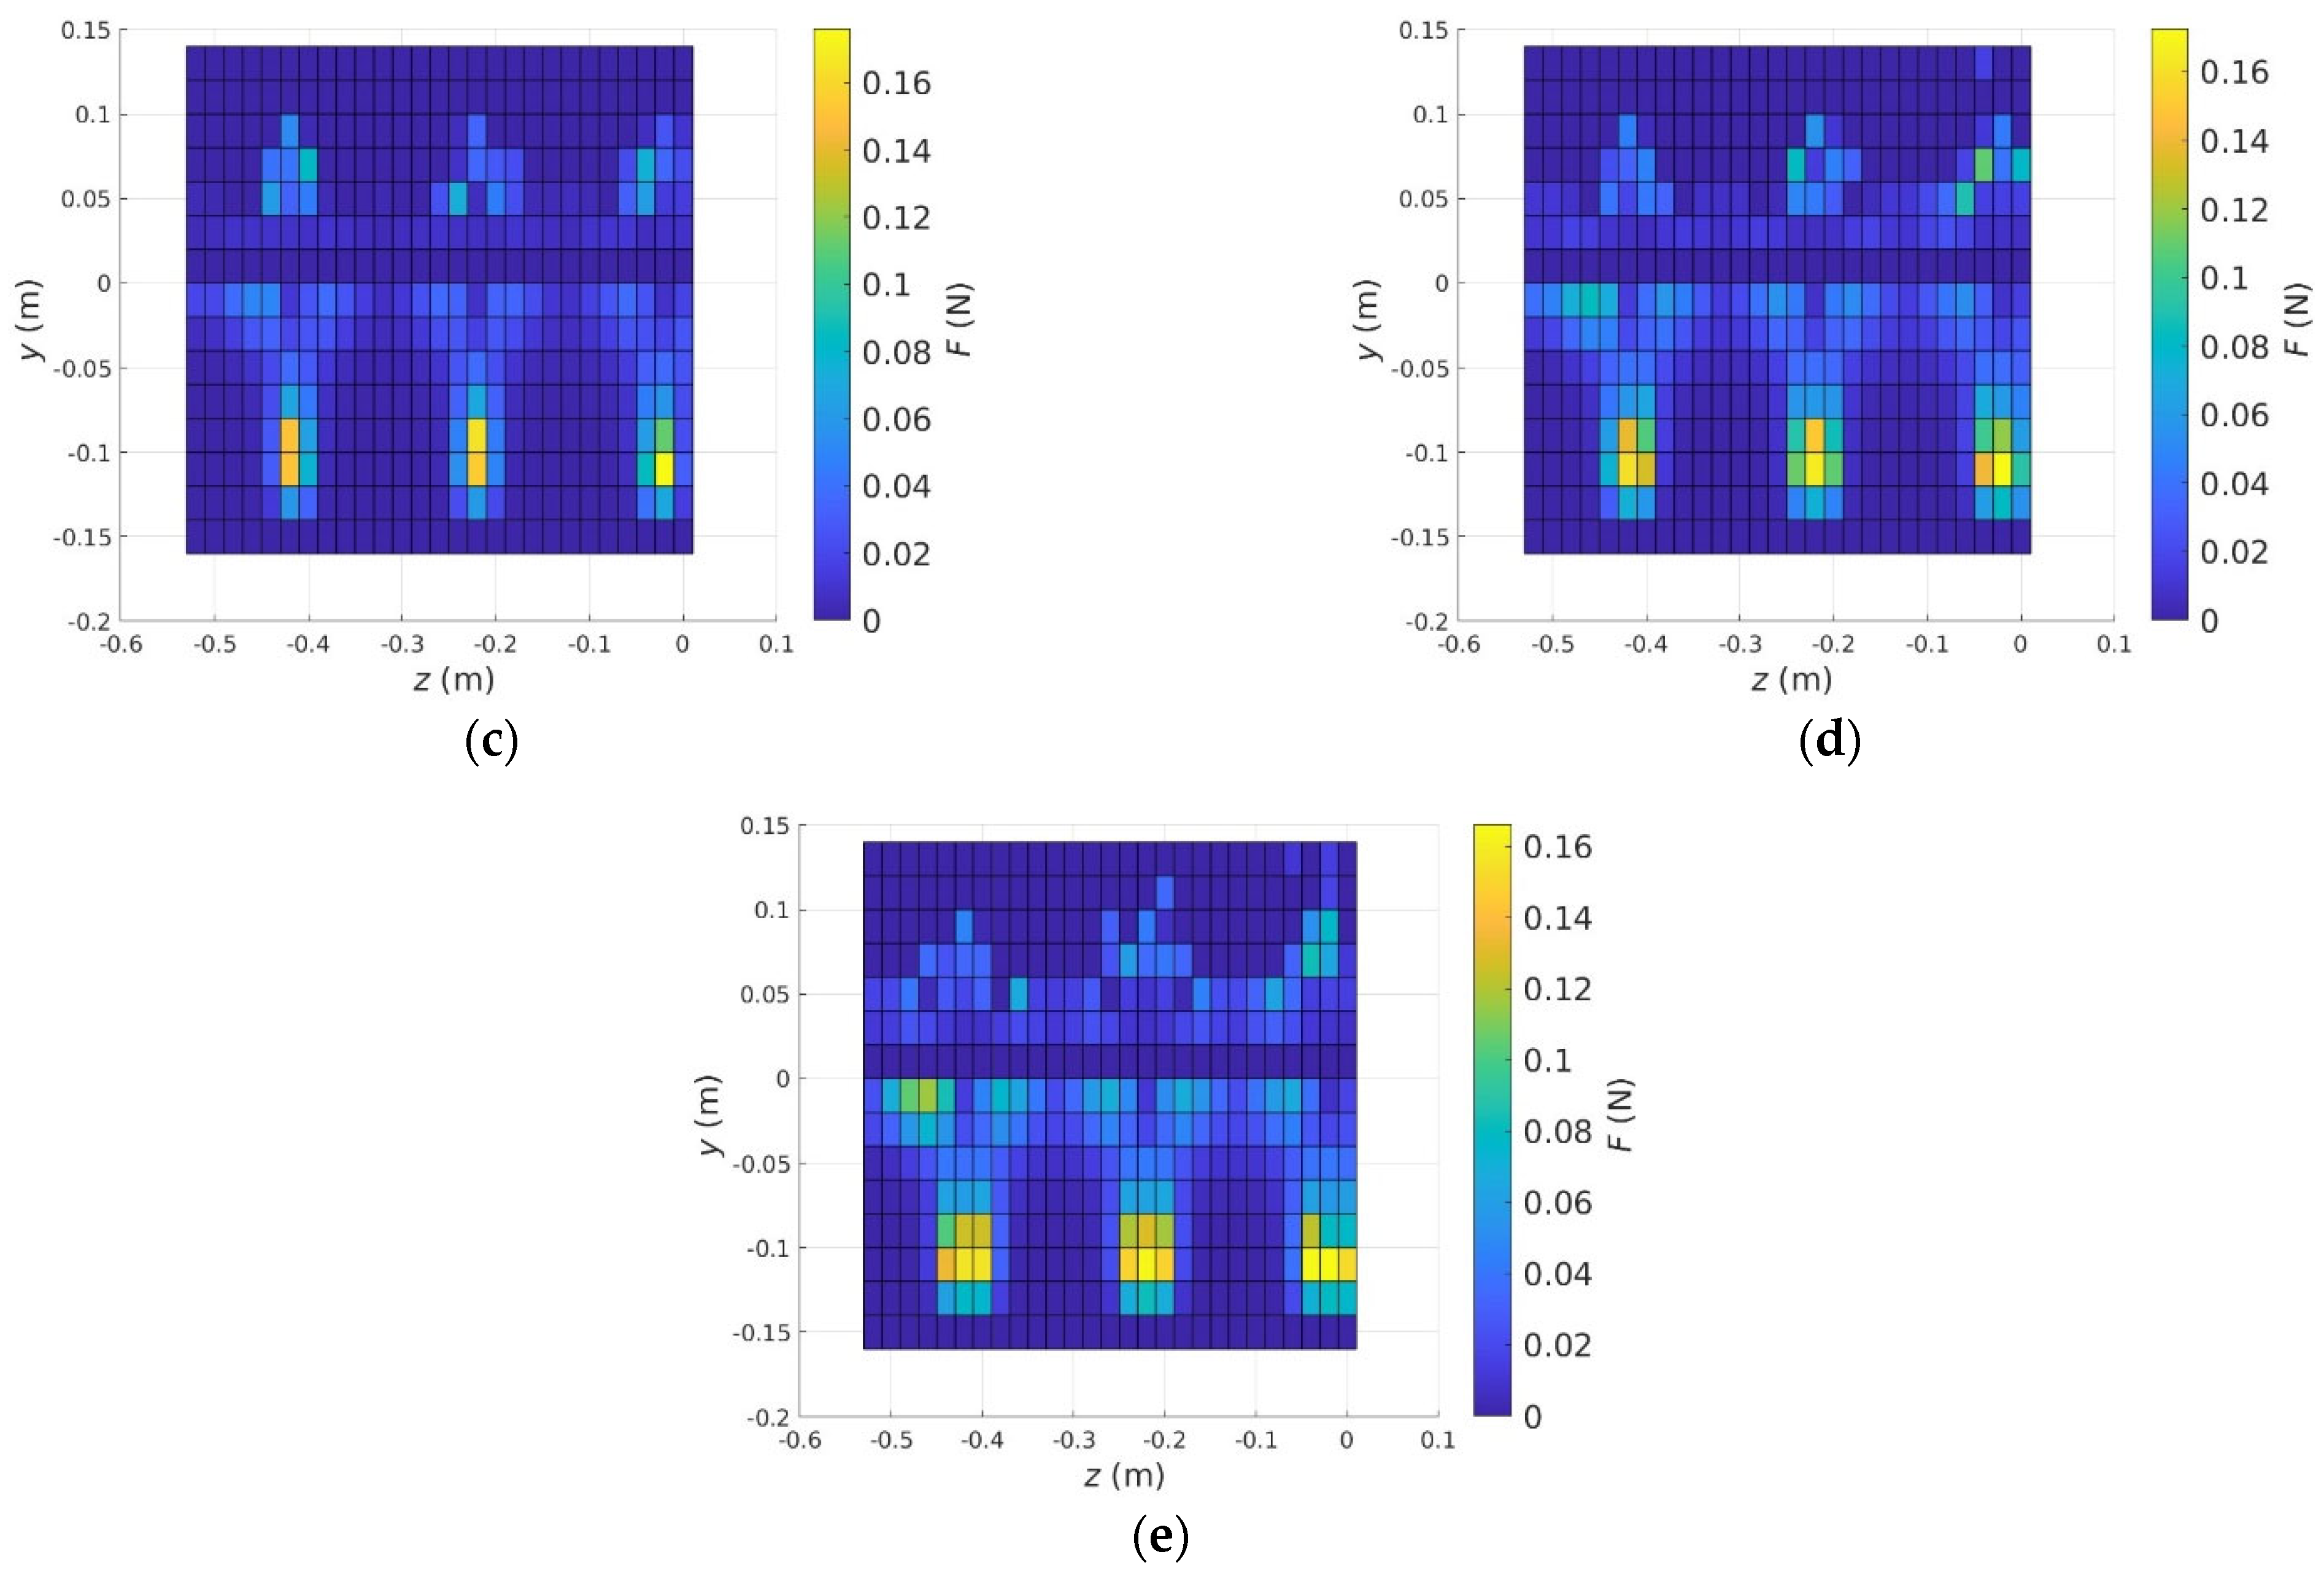
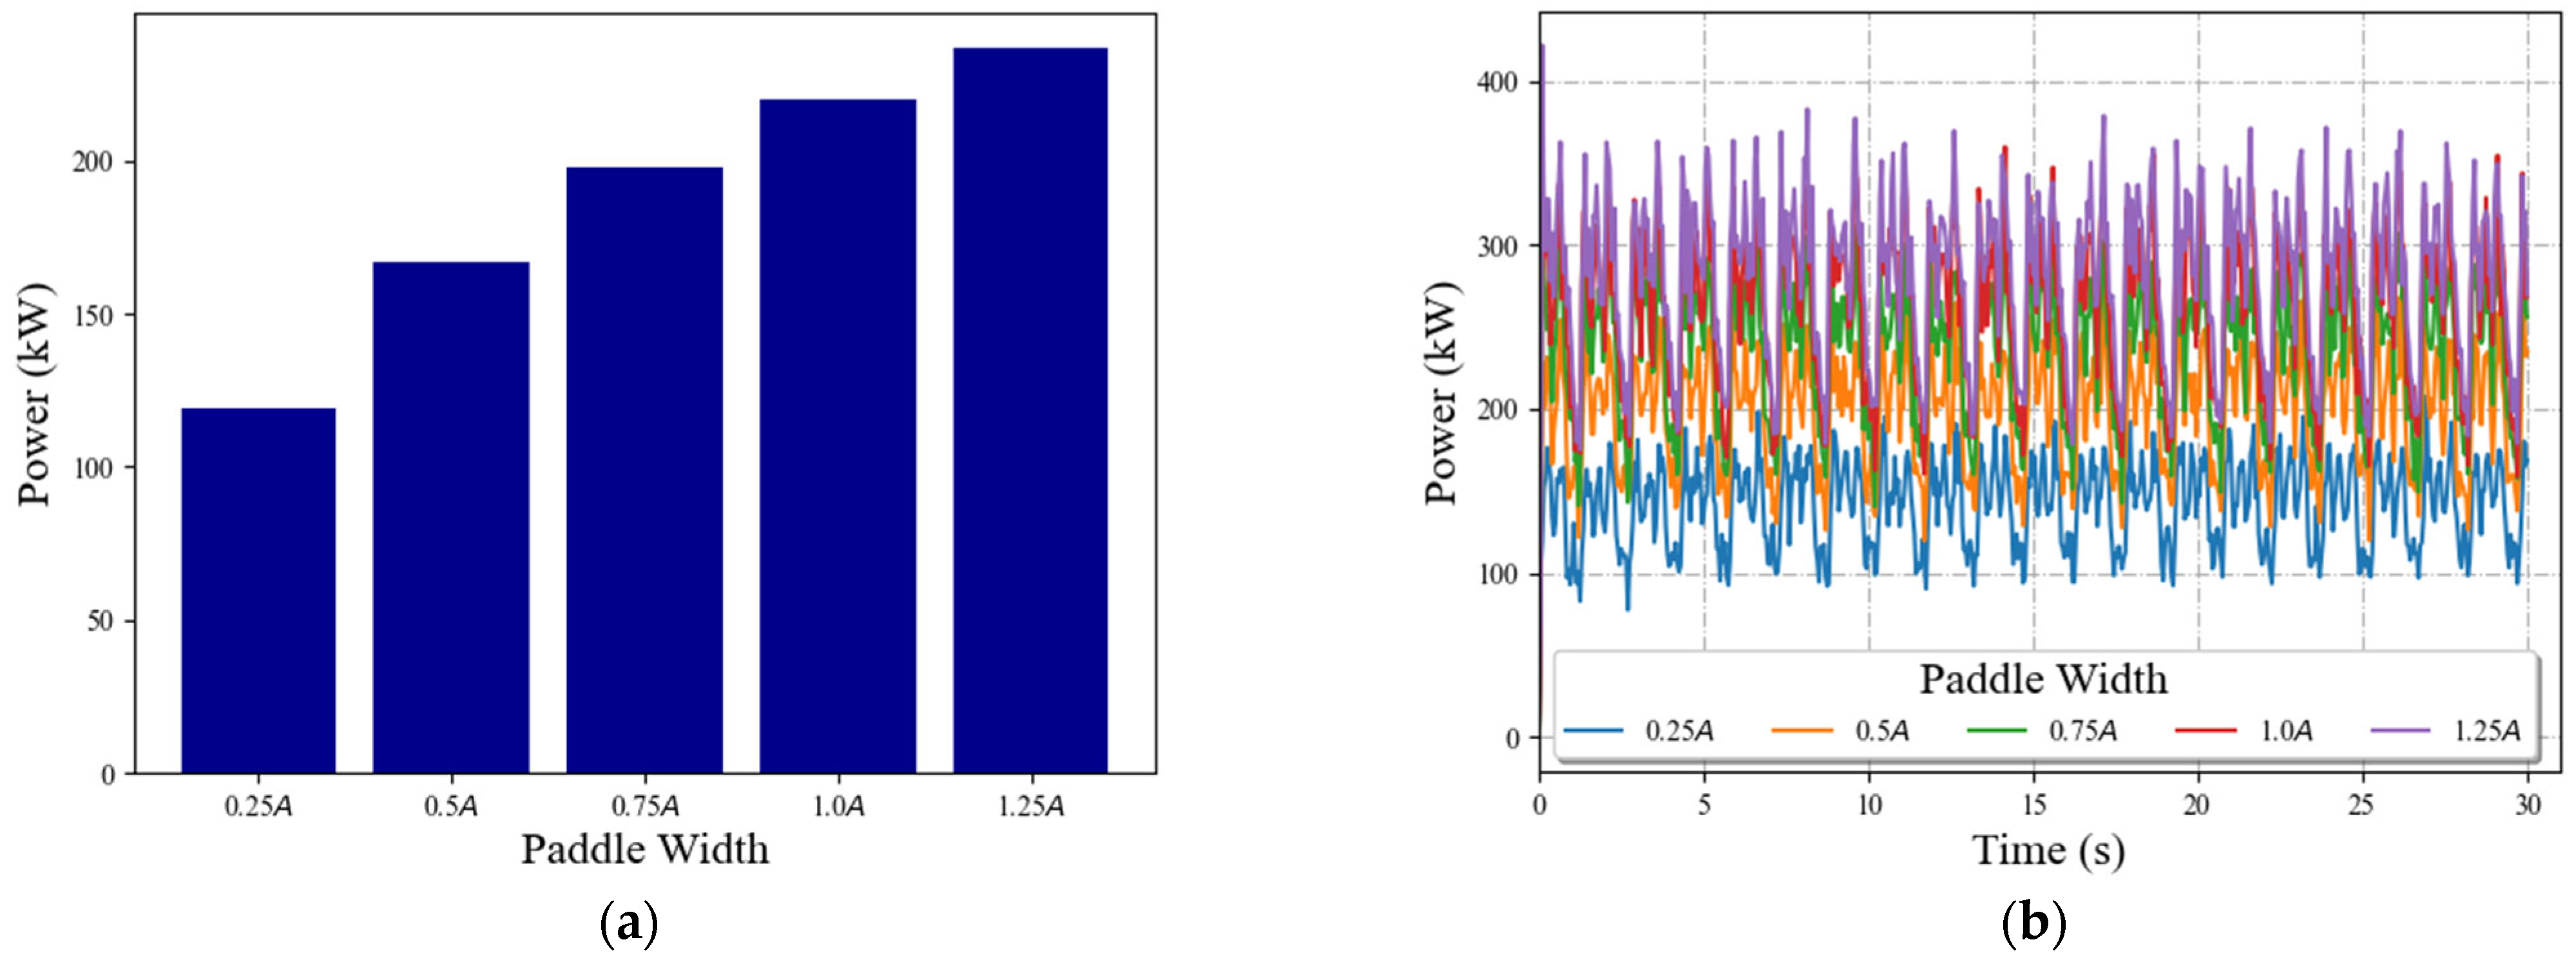
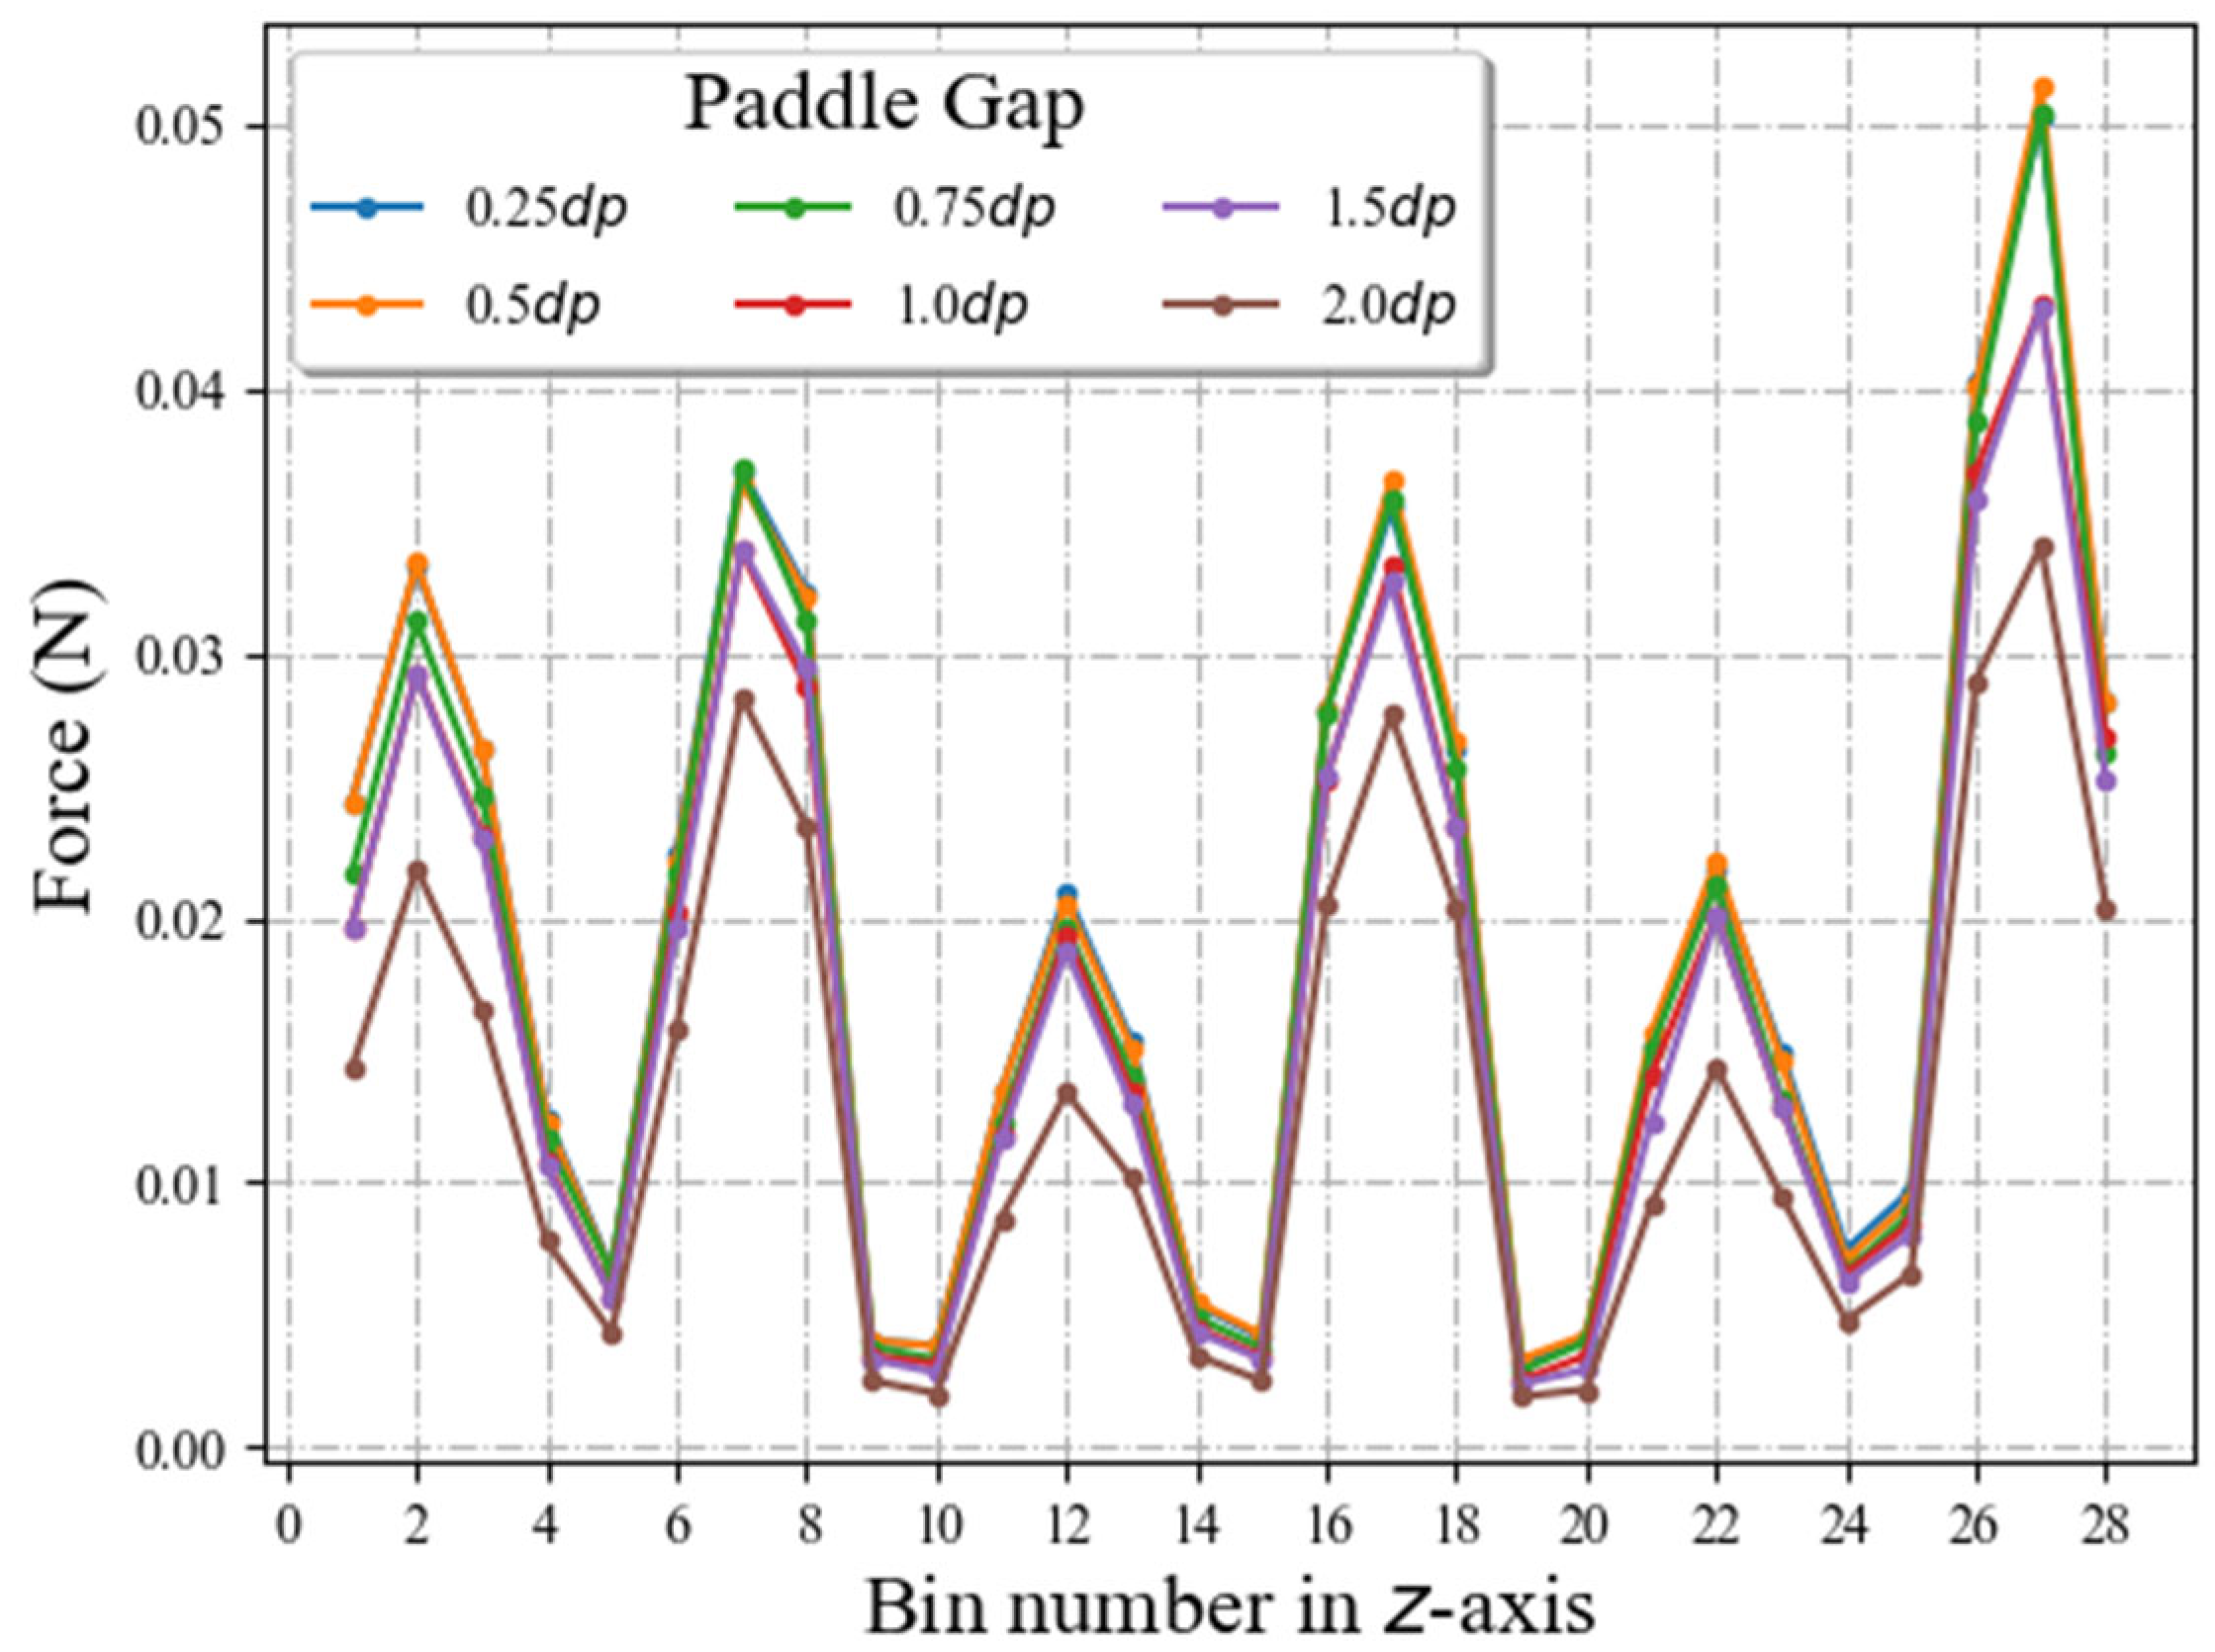
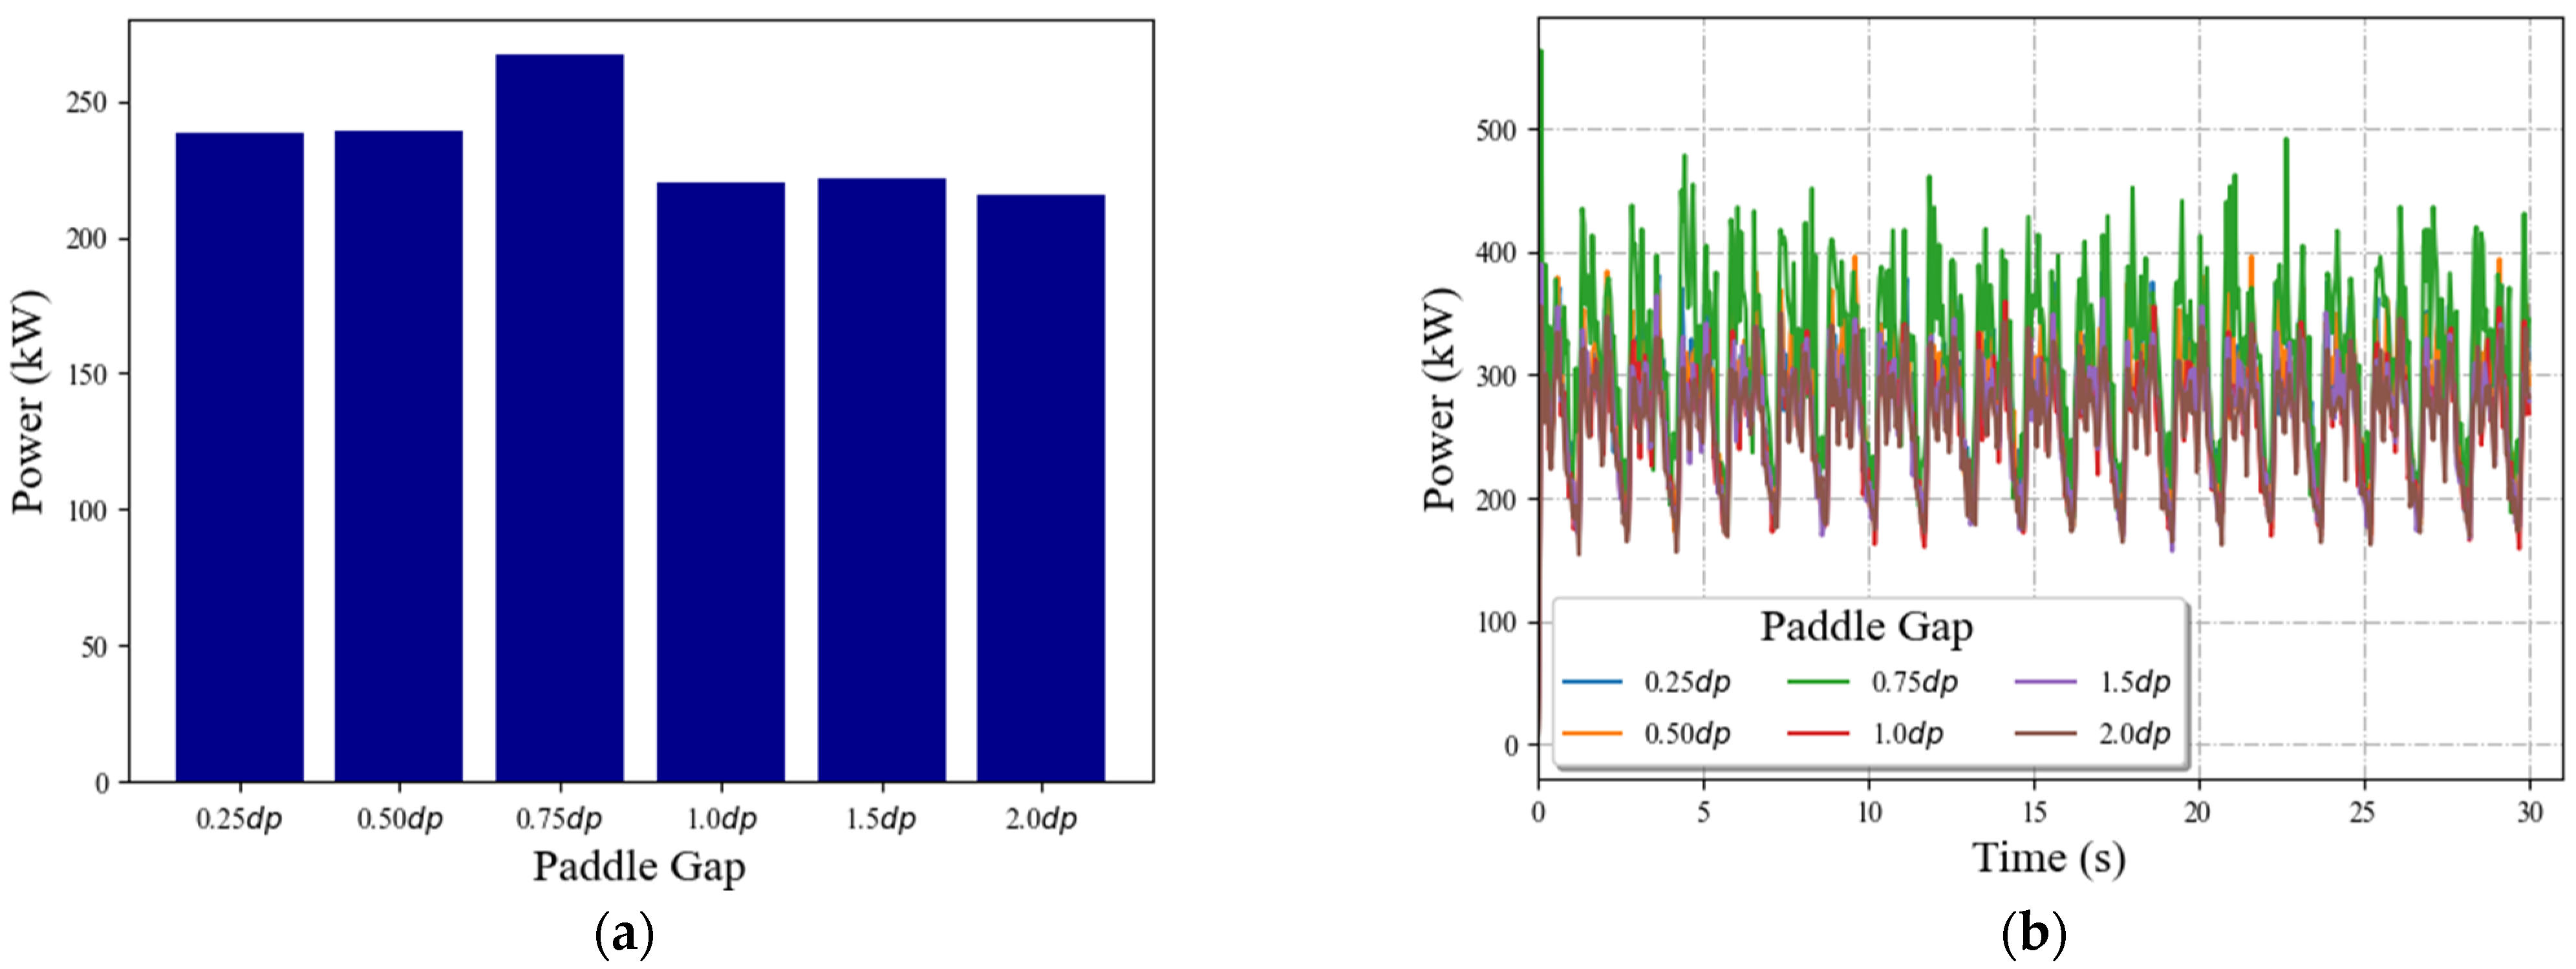
3.4. Forces Acting on Particles and the Mixer Power Consumption
4. Conclusions
Author Contributions
Funding
Institutional Review Board Statement
Data Availability Statement
Acknowledgments
Conflicts of Interest
Nomenclature
| A | Paddle width [m] | Greek symbols | |
| di | Spatial dimension [-] | Paddle angle [°] | |
| Particle diameter [m] | Coefficient of rolling friction [-] | ||
| D | Diffusivity coefficient [m2/s] | Coefficient of static friction [-] | |
| Coefficient of restitution [-] | Poisson’s ratio [-] | ||
| Force [N] | Standard deviation [-] | ||
| Shear modulus [Pa] | Particle angular velocity [rad/s] | ||
| Particle moment of inertia [kg.m2] | Particle density () | ||
| Torque [N.m] | Subscripts and superscripts | ||
| Mass [kg] | j | Particle j or direction j | |
| P | Mixer’s power consumption | i | Particle i or direction i |
| N | Number of particles | n | Normal direction |
| Particle linear velocity [m/s] | m | average | |
| Time step [s] | t | Tangential direction or rotational | |
| Particle displacement [m] | r | Rolling resistance | |
| Fluctuation velocity | g | Gravity | |
| Particle’s number fraction | c | Contact list | |
References
- Paul, E.L.; Atiemo-Obeng, V.A.; Kresta, S.M. Handbook of Industrial Mixing: Science and Practice; John Wiley & Sons, Inc.: Hoboken, NJ, USA, 2003. [Google Scholar] [CrossRef]
- Ebrahimi, M.; Yaraghi, A.; Ein-Mozaffari, F.; Lohi, A. The effect of impeller configurations on particle mixing in an agitated paddle mixer. Powder Technol. 2018, 332, 158–170. [Google Scholar] [CrossRef]
- Jadidi, B.; Ebrahimi, M.; Ein-Mozaffari, F.; Lohi, A. Mixing performance analysis of non-cohesive particles in a double paddle blender using DEM and experiments. Powder Technol. 2022, 397, 117122. [Google Scholar] [CrossRef]
- Yaraghi, A.; Ebrahimi, M.; Ein-Mozaffari, F.; Lohi, A. Mixing assessment of non-cohesive particles in a paddle mixer through experiments and discrete element method (DEM). Adv. Powder Technol. 2018, 29, 2693–2706. [Google Scholar] [CrossRef]
- Jadidi, B.; Ebrahimi, M.; Ein-Mozaffari, F.; Lohi, A. Investigation of mixing non-spherical particles in a double paddle blender via experiments and GPU-based DEM modeling. Eng. Proceed. 2022, 19, 12661. [Google Scholar] [CrossRef]
- Ebrahimi, M.; Yaraghi, A.; Jadidi, B.; Ein-Mozaffari, F.; Lohi, A. Assessment of bi-disperse solid particles mixing in a horizontal paddle mixer through experiments and DEM. Powder Technol. 2020, 381, 129–140. [Google Scholar] [CrossRef]
- Alchikh-Sulaiman, B.; Alian, M.; Ein-Mozaffari, F.; Lohi, A.; Upreti, S.R. Using the discrete element method to assess the mixing of polydisperse solid particles in a rotary drum. Particuology 2016, 25, 133–142. [Google Scholar] [CrossRef]
- Cundall, P.A.; Strack, O.D.L. A discrete numerical model for granular assemblies. Géotechnique 1979, 29, 47–65. [Google Scholar] [CrossRef]
- Alian, M.; Ein-Mozaffari, F.; Upreti, S.R. Analysis of the mixing of solid particles in a plowshare mixer via discrete element method (DEM). Powder Technol. 2015, 274, 77–87. [Google Scholar] [CrossRef]
- Rodriguez, V.A.; de Carvalho, R.; Tavares, L.M. Insights into advanced ball mill modelling through discrete element simulations. Miner. Eng. 2018, 127, 48–60. [Google Scholar] [CrossRef]
- Halidan, M.; Chandratilleke, G.; Dong, K.; Yu, A. Mixing performance of ribbon mixers: Effects of operational parameters. Powder Technol. 2018, 325, 92–106. [Google Scholar] [CrossRef]
- Wang, S.; Wu, K.; Yu, J.; Zhang, H. Design optimization and scale-up characteristics of a double-helical ribbon reactor for biomass catalytic pyrolysis. Powder Technol. 2022, 399, 117192. [Google Scholar] [CrossRef]
- Jadidi, B.; Ebrahimi, M.; Ein-Mozaffari, F.; Lohi, A. Mixing and segregation assessment of bi-disperse solid particles in a double paddle mixer. Particuology 2023, 74, 184–199. [Google Scholar] [CrossRef]
- Jadidi, B.; Ebrahimi, M.; Ein-Mozaffari, F.; Lohi, A. A comprehensive review of the application of DEM in the investigation of batch solid mixers. Rev. Chem. Eng. 2022. [Google Scholar] [CrossRef]
- Chandratilleke, G.; Yu, A.; Bridgwater, J. A DEM study of the mixing of particles induced by a flat blade. Chem. Eng. Sci. 2012, 79, 54–74. [Google Scholar] [CrossRef]
- Siraj, M.S.; Radl, S.; Glasser, B.J.; Khinast, J.G. Effect of blade angle and particle size on powder mixing performance in a rectangular box. Powder Technol. 2011, 211, 100–113. [Google Scholar] [CrossRef]
- Siraj, M.S. Single-blade convective powder mixing: The effect of the blade shape and angle. Powder Technol. 2014, 267, 289–301. [Google Scholar] [CrossRef]
- Daraio, D.; Villoria, J.; Ingram, A.; Alexiadis, A.; Stitt, E.; Marigo, M. Investigating grinding media dynamics inside a vertical stirred mill using the discrete element method: Effect of impeller arm length. Powder Technol. 2020, 364, 1049–1061. [Google Scholar] [CrossRef]
- Jin, X.; Wang, S.; Shen, Y. DEM study of the effect of impeller design on mixing performance in a U-shape ribbon mixer. Adv. Powder Technol. 2022, 33, 103334. [Google Scholar] [CrossRef]
- Tsugeno, Y.; Sakai, M.; Yamazaki, S.; Nishinomiya, T. DEM simulation for optimal design of powder mixing in a ribbon mixer. Adv. Powder Technol. 2021, 32, 1735–1749. [Google Scholar] [CrossRef]
- Chandratilleke, G.; Yu, A.; Stewart, R.; Bridgwater, J. Effects of blade rake angle and gap on particle mixing in a cylindrical mixer. Powder Technol. 2009, 193, 303–311. [Google Scholar] [CrossRef]
- Boonkanokwong, V.; Remy, B.; Khinast, J.G.; Glasser, B.J. The effect of the number of impeller blades on granular flow in a bladed mixer. Powder Technol. 2016, 302, 333–349. [Google Scholar] [CrossRef]
- Kloss, C.; Goniva, C. LIGGGHTS—Open Source Discrete Element Simulations of Granular Materials Based on Lammps. In Supplemental Proceedings: Materials Fabrication, Properties, Characterization, and Modeling; John Wiley & Sons, Inc.: Hoboken, NJ, USA, 2011; pp. 781–788. [Google Scholar] [CrossRef]
- Pantaleev, S.; Yordanova, S.; Janda, A.; Marigo, M.; Ooi, J.Y. An experimentally validated DEM study of powder mixing in a paddle blade mixer. Powder Technol. 2017, 311, 287–302. [Google Scholar] [CrossRef]
- Mio, H.; Higuchi, R.; Ishimaru, W.; Shimosaka, A.; Shirakawa, Y.; Hidaka, J. Effect of paddle rotational speed on particle mixing behavior in electrophotographic system by using parallel discrete element method. Adv. Powder Technol. 2009, 20, 406–415. [Google Scholar] [CrossRef]
- Yaraghi, A. Mixing Assessment of Non-Cohesive Mono-Disperse and Bi-Disperse Particles in a Paddle Mixer—Experiments and Discrete Element Method (DEM). Master’s Thesis, Ryerson University, Toronto, ON, Canada, 2018. [Google Scholar]
- Hassanpour, A.; Tan, H.; Bayly, A.; Gopalkrishnan, P.; Ng, B.; Ghadiri, M. Analysis of particle motion in a paddle mixer using Discrete Element Method (DEM). Powder Technol. 2011, 206, 189–194. [Google Scholar] [CrossRef]
- Jadidi, B.; Ebrahimi, M.; Ein-Mozaffari, F.; Lohi, A. Investigation of impacts of particle shape on mixing in a twin paddle blender using GPU-based DEM and experiments. Powder Technol. 2023, 417, 118259. [Google Scholar] [CrossRef]
- Bhalode, P.; Ierapetritou, M. A review of existing mixing indices in solid-based continuous blending operations. Powder Technol. 2020, 373, 195–209. [Google Scholar] [CrossRef]
- Alchikh-Sulaiman, B.; Ein-Mozaffari, F.; Lohi, A. Evaluation of poly-disperse solid particles mixing in a slant cone mixer using discrete element method. Chem. Eng. Res. Des. 2015, 96, 196–213. [Google Scholar] [CrossRef]
- Palmer, J.; Reynolds, G.K.; Tahir, F.; Yadav, I.K.; Meehan, E.; Holman, J.; Bajwa, G. Mapping key process parameters to the performance of a continuous dry powder blender in a continuous direct compression system. Powder Technol. 2020, 362, 659–670. [Google Scholar] [CrossRef]
- Sen, M.; Karkala, S.; Panikar, S.; Lyngberg, O.; Johnson, M.; Marchut, A.; Schäfer, E.; Ramachandran, R. Analyzing the Mixing Dynamics of an Industrial Batch Bin Blender via Discrete Element Modeling Method. Processes 2017, 5, 22. [Google Scholar] [CrossRef]
- Gao, Y.; Muzzio, F.J.; Ierapetritou, M.G. Optimizing continuous powder mixing processes using periodic section modeling. Chem. Eng. Sci. 2012, 80, 70–80. [Google Scholar] [CrossRef]
- Chandratilleke, G.; Dong, K.; Shen, Y. DEM study of the effect of blade-support spokes on mixing performance in a ribbon mixer. Powder Technol. 2018, 326, 123–136. [Google Scholar] [CrossRef]
- Remy, B.; Glasser, B.J.; Khinast, J.G. The effect of mixer properties and fill level on granular flow in a bladed mixer. AIChE J. 2010, 56, 336–353. [Google Scholar] [CrossRef]
- Goldhirsch, I. Introduction to granular temperature. Powder Technol. 2008, 182, 130–136. [Google Scholar] [CrossRef]
- Remy, B.; Khinast, J.G.; Glasser, B.J. Discrete element simulation of free flowing grains in a four-bladed mixer. AIChE J. 2009, 55, 2035–2048. [Google Scholar] [CrossRef]
- Ghotli, R.A.; Shah, R.S.S.R.E.; Raman, A. Effect of disc-blade intercepting angle on mixing performance in a multiphase stirred vessel. Braz. J. Chem. Eng. 2019, 36, 811–821. [Google Scholar] [CrossRef]
- Zuo, Z.; Gong, S.; Xie, G. Numerical investigation of granular mixing in an intensive mixer: Effect of process and structural parameters on mixing performance and power consumption. Chin. J. Chem. Eng. 2021, 32, 241–252. [Google Scholar] [CrossRef]
- Golshan, S.; Zarghami, R.; Norouzi, H.R.; Mostoufi, N. Granular mixing in nauta blenders. Powder Technol. 2017, 305, 279–288. [Google Scholar] [CrossRef]


| 2.13 × | 1.28 × | 6.70 × | 2.60 × | |
| 1.82 × | 1.21 × | 7.30 × | 3.56 × | |
| 3.88 × | 6.00 × | 6.10 × | 3.80 × |
Disclaimer/Publisher’s Note: The statements, opinions and data contained in all publications are solely those of the individual author(s) and contributor(s) and not of MDPI and/or the editor(s). MDPI and/or the editor(s) disclaim responsibility for any injury to people or property resulting from any ideas, methods, instructions or products referred to in the content. |
© 2023 by the authors. Licensee MDPI, Basel, Switzerland. This article is an open access article distributed under the terms and conditions of the Creative Commons Attribution (CC BY) license (https://creativecommons.org/licenses/by/4.0/).
Share and Cite
Jadidi, B.; Ebrahimi, M.; Ein-Mozaffari, F.; Lohi, A. Effect of the Mixer Design Parameters on the Performance of a Twin Paddle Blender: A DEM Study. Processes 2023, 11, 733. https://doi.org/10.3390/pr11030733
Jadidi B, Ebrahimi M, Ein-Mozaffari F, Lohi A. Effect of the Mixer Design Parameters on the Performance of a Twin Paddle Blender: A DEM Study. Processes. 2023; 11(3):733. https://doi.org/10.3390/pr11030733
Chicago/Turabian StyleJadidi, Behrooz, Mohammadreza Ebrahimi, Farhad Ein-Mozaffari, and Ali Lohi. 2023. "Effect of the Mixer Design Parameters on the Performance of a Twin Paddle Blender: A DEM Study" Processes 11, no. 3: 733. https://doi.org/10.3390/pr11030733
APA StyleJadidi, B., Ebrahimi, M., Ein-Mozaffari, F., & Lohi, A. (2023). Effect of the Mixer Design Parameters on the Performance of a Twin Paddle Blender: A DEM Study. Processes, 11(3), 733. https://doi.org/10.3390/pr11030733