Article

Phase Equilibria Simulation of Biomaterial-Hydrogen Binary Systems Using a Simple Empirical Correlation

1
Department of Business, Data Analysis, The University of Texas Rio Grande Valley (UTRGV), Edinburg, TX 78539, USA
2
Department of Polymer Engineering, Amirkabir University of Technology, Tehran 1591634311, Iran
3
Mechanical Engineering-Energy Conversion, Faculty of Mechanical Engineering, Tabriz University, Tabriz 5166616471, Iran
4
Department of Civil Engineering, Isfahan University of Technology, Isfahan 8415683111, Iran
5
Department of Petroleum and Chemical Engineering, Science and Research Branch, Islamic Azad University, Tehran 1477893855, Iran
6
Institut Energiesysteme und Energietechnik, Technische Universität Darmstadt, Otto-Berndt-Straße 2, 64287 Darmstadt, Germany
7
Department of Chemical Engineering, Faculty of Energy, Kermanshah University of Technology, Kermanshah 6715685420, Iran
*
Author to whom correspondence should be addressed.
Processes 2023, 11(3), 714; https://doi.org/10.3390/pr11030714
Submission received: 30 January 2023 / Revised: 17 February 2023 / Accepted: 22 February 2023 / Published: 28 February 2023
(This article belongs to the Special Issue Advanced Technology of Biomass Gasification Processes)

Abstract

:
This study proposes a simple correlation for approximating hydrogen solubility in biomaterials as a function of pressure and temperature. The pre-exponential term of the proposed model linearly relates to the pressure, whereas the exponential term is merely a function of temperature. The differential evolution (DE) optimization algorithm helps adjust three unknown coefficients of the correlation. The proposed model estimates 134 literature data points for the hydrogen solubility in biomaterials with an excellent absolute average relative deviation (AARD) of 3.02% and a coefficient of determination (R) of 0.99815. Comparing analysis justifies that the developed correlation has higher accuracy than the multilayer perceptron artificial neural network (MLP-ANN) with the same number of adjustable parameters. Comparing analysis justifies that the Arrhenius-type correlation not only needs lower computational effort, it also has higher accuracy than the PR (Peng-Robinson), PC-SAFT (perturbed-chain statistical associating fluid theory), and SRK (Soave-Redlich-Kwong) equations of state. Modeling results show that hydrogen solubility in the studied biomaterials increases with increasing temperature and pressure. Furthermore, furan and furfuryl alcohol show the maximum and minimum hydrogen absorption capacities, respectively. Such a correlation helps in understanding the biochemical–hydrogen phase equilibria which are necessary to design, optimize, and control biofuel production plants.

1. Introduction

Modern life consequences, including industrialization [1], increasing population [2], environmental pollution [3,4], and depletion of hydrocarbon resources [5,6], have convinced researchers to seek new environmentally friendly fuels to satisfy the high energy demand [7,8]. The research mainly focused on developing a scenario to produce energy from sustainable and renewable sources with low greenhouse gas emissions. Solar irradiation [9], wind power [10], biogas [11], biodiesel [12], and biomaterials [13,14] are among the most well-known candidates to replace fossil-derived fuels. Although geography plays an important role in selecting an appropriate option to produce renewable energy [15], almost all countries have the possibility of utilizing different waste materials (i.e., biomass) to produce energy. Biomass may be directly utilized to generate energy or considered as feedstock for synthesizing value-added substances [16]. In this regard, there are several well-established technologies, that is, gasification, combustion, and pyrolysis [17]. Thermal energy is generated by the direct combustion of biomass. The value-added substances can be obtained from biomass by combining the gasification and Fischer–Tropsch processes [18]. Biofuel can be achieved by condensing the vapor stream obtained from biomass decomposition in a pyrolysis unit.
It is often necessary to perform additional processes on bio-based chemicals to improve their heating value and remove their water and oxygen contents [19]. Thermal instability [20], storage difficulty [21], and the reactive nature of the oxygenated substances [22] make biomaterial utilization so difficult that a deoxygenation process is often required. Hydrogenation [23], decarboxylation [24], catalyst-aided [25], and dehydration [26], have been widely applied for hydrodeoxygenation of the biomaterials [27].
Several substances, such as hydrogen, carbon monoxide, and carbon dioxide are often involved in the associated reactions in these processes [15]. Hence, hydrogen solubility in biochemicals is required to construct, optimize, and control the bio-based processes [28,29,30]. This information is also needed for the separation, transportation, and storage of biochemicals [15]. Indeed, the separation process requires reliable information about hydrogen solubility in biochemicals [15]. Jaatinen et al. experimentally investigated the phase equilibria of a furfural–hydrogen binary mixture [28]. They also mathematically studied the furfural–hydrogen equilibrium behavior using the PR (Peng–Robinson), PC-SAFT (perturbed-chain statistical associating fluid theory), and SRK (Soave–Redlich–Kwong) [28]. Ivaniš et al. focused on the experimental investigation of the equilibrium behavior of gaseous hydrogen in the presence of furfuryl alcohol and furfural as two biomaterials [29]. This research group also utilized the SRK, PC-SAFT, and PR to monitor the biochemical–hydrogen phase behaviors [29]. Qureshi et al. experimentally measured hydrogen (H2) solubility in three diverse bio-oils (furan, allyl alcohol, and eugenol) [30]. All possible binary mixtures of the hydrogen/bio-oil have been simulated by the PR equation of state [30].
Since the thermodynamic-based approaches have their challenges to model the phase equilibria of the biochemical–hydrogen systems and often provide a high level of error, this study proposes a simple, easy-to-use, and precise correlation for the considered task. This model only needs pressure and temperature to simulate the biochemical–hydrogen phase equilibrium. The prediction accuracy of the proposed correlation is also validated by the literature data, three equations of state, and the multilayer perceptron artificial neural network (MLP-ANN). The proposed correlation not only is simpler than the equations of state and MLP-ANN, but it also presents higher accuracy than these potential methods. The developed correlation is then employed to monitor the dependency of the hydrogen absorption by different biochemicals on operating conditions and solvent type.

2. Literature Data and Methods

This section presents the hydrogen solubility data in five biomaterials with the industrial application and fundamentals of the Arrhenius correlation.

2.1. Hydrogen Solubility in Biochemicals

Three research groups have experimentally measured hydrogen solubility in furfural [28,29], furfuryl alcohol [29], allyl alcohol [30], furan [30], and eugenol [30]. Table 1 summarizes the phase equilibrium data for different biochemical–H2 binary systems. Ranges of the temperature, pressure, and hydrogen solubility are listed in Table 1. This table also presents the number of collected samples for each biomaterial–H2 binary mixture.
This study develops an empirical correlation to relate hydrogen solubility in biomaterials to pressure and temperature. The proposed correlation has only three adjustable parameters and can be readily used with the lowest computational time/effort. The differential evolution (DE) optimization algorithm [31] uses the literature databank to adjust the coefficients of the proposed correlation. This gathered databank will also be used to compare the accuracy of this correlation and MLP-ANN.

2.2. Arrhenius-Type Correlation

The general form of the Arrhenius correlation [32] is shown by Equation (1).
K = K 0 exp E a / R g T
In Equation (1), K is the dependent variable, K0 shows the pre-exponential coefficient, Rg stands for gas constant, Ea designates activation energy, and T represents the absolute temperature. In the isothermal condition, the dependent variable linearly relates to the pre-exponential coefficient. The second form of the Arrhenius correlation (Equation (2)) can be simply achieved by taking the natural logarithm (ln) of Equation (1).
ln K = ln K 0 E a / R g T
The above equation states that the natural logarithm of the dependent variable linearly relates to the inverse of absolute temperature.

3. Results and Discussion

Monitoring the variation of hydrogen solubility in biomaterials with the pressure and temperature, validating the proposed model by actual data in the literature and multilayer perceptron artificial neural network, and analyzing the effect of biomaterial type and operating conditions on the phase equilibria of biochemical–H2 are investigated in this section.

3.1. General Behavior of Biomaterial–Hydrogen Phase Equilibria

Figure 1 depicts the isothermal variation of hydrogen dissolution in the furfural, eugenol, furfuryl alcohol, allyl alcohol, and furan, as a function of pressure. It is easy to see that hydrogen solubility in all biochemicals linearly relates to the isothermal variation of pressure (i.e., α + β P ).
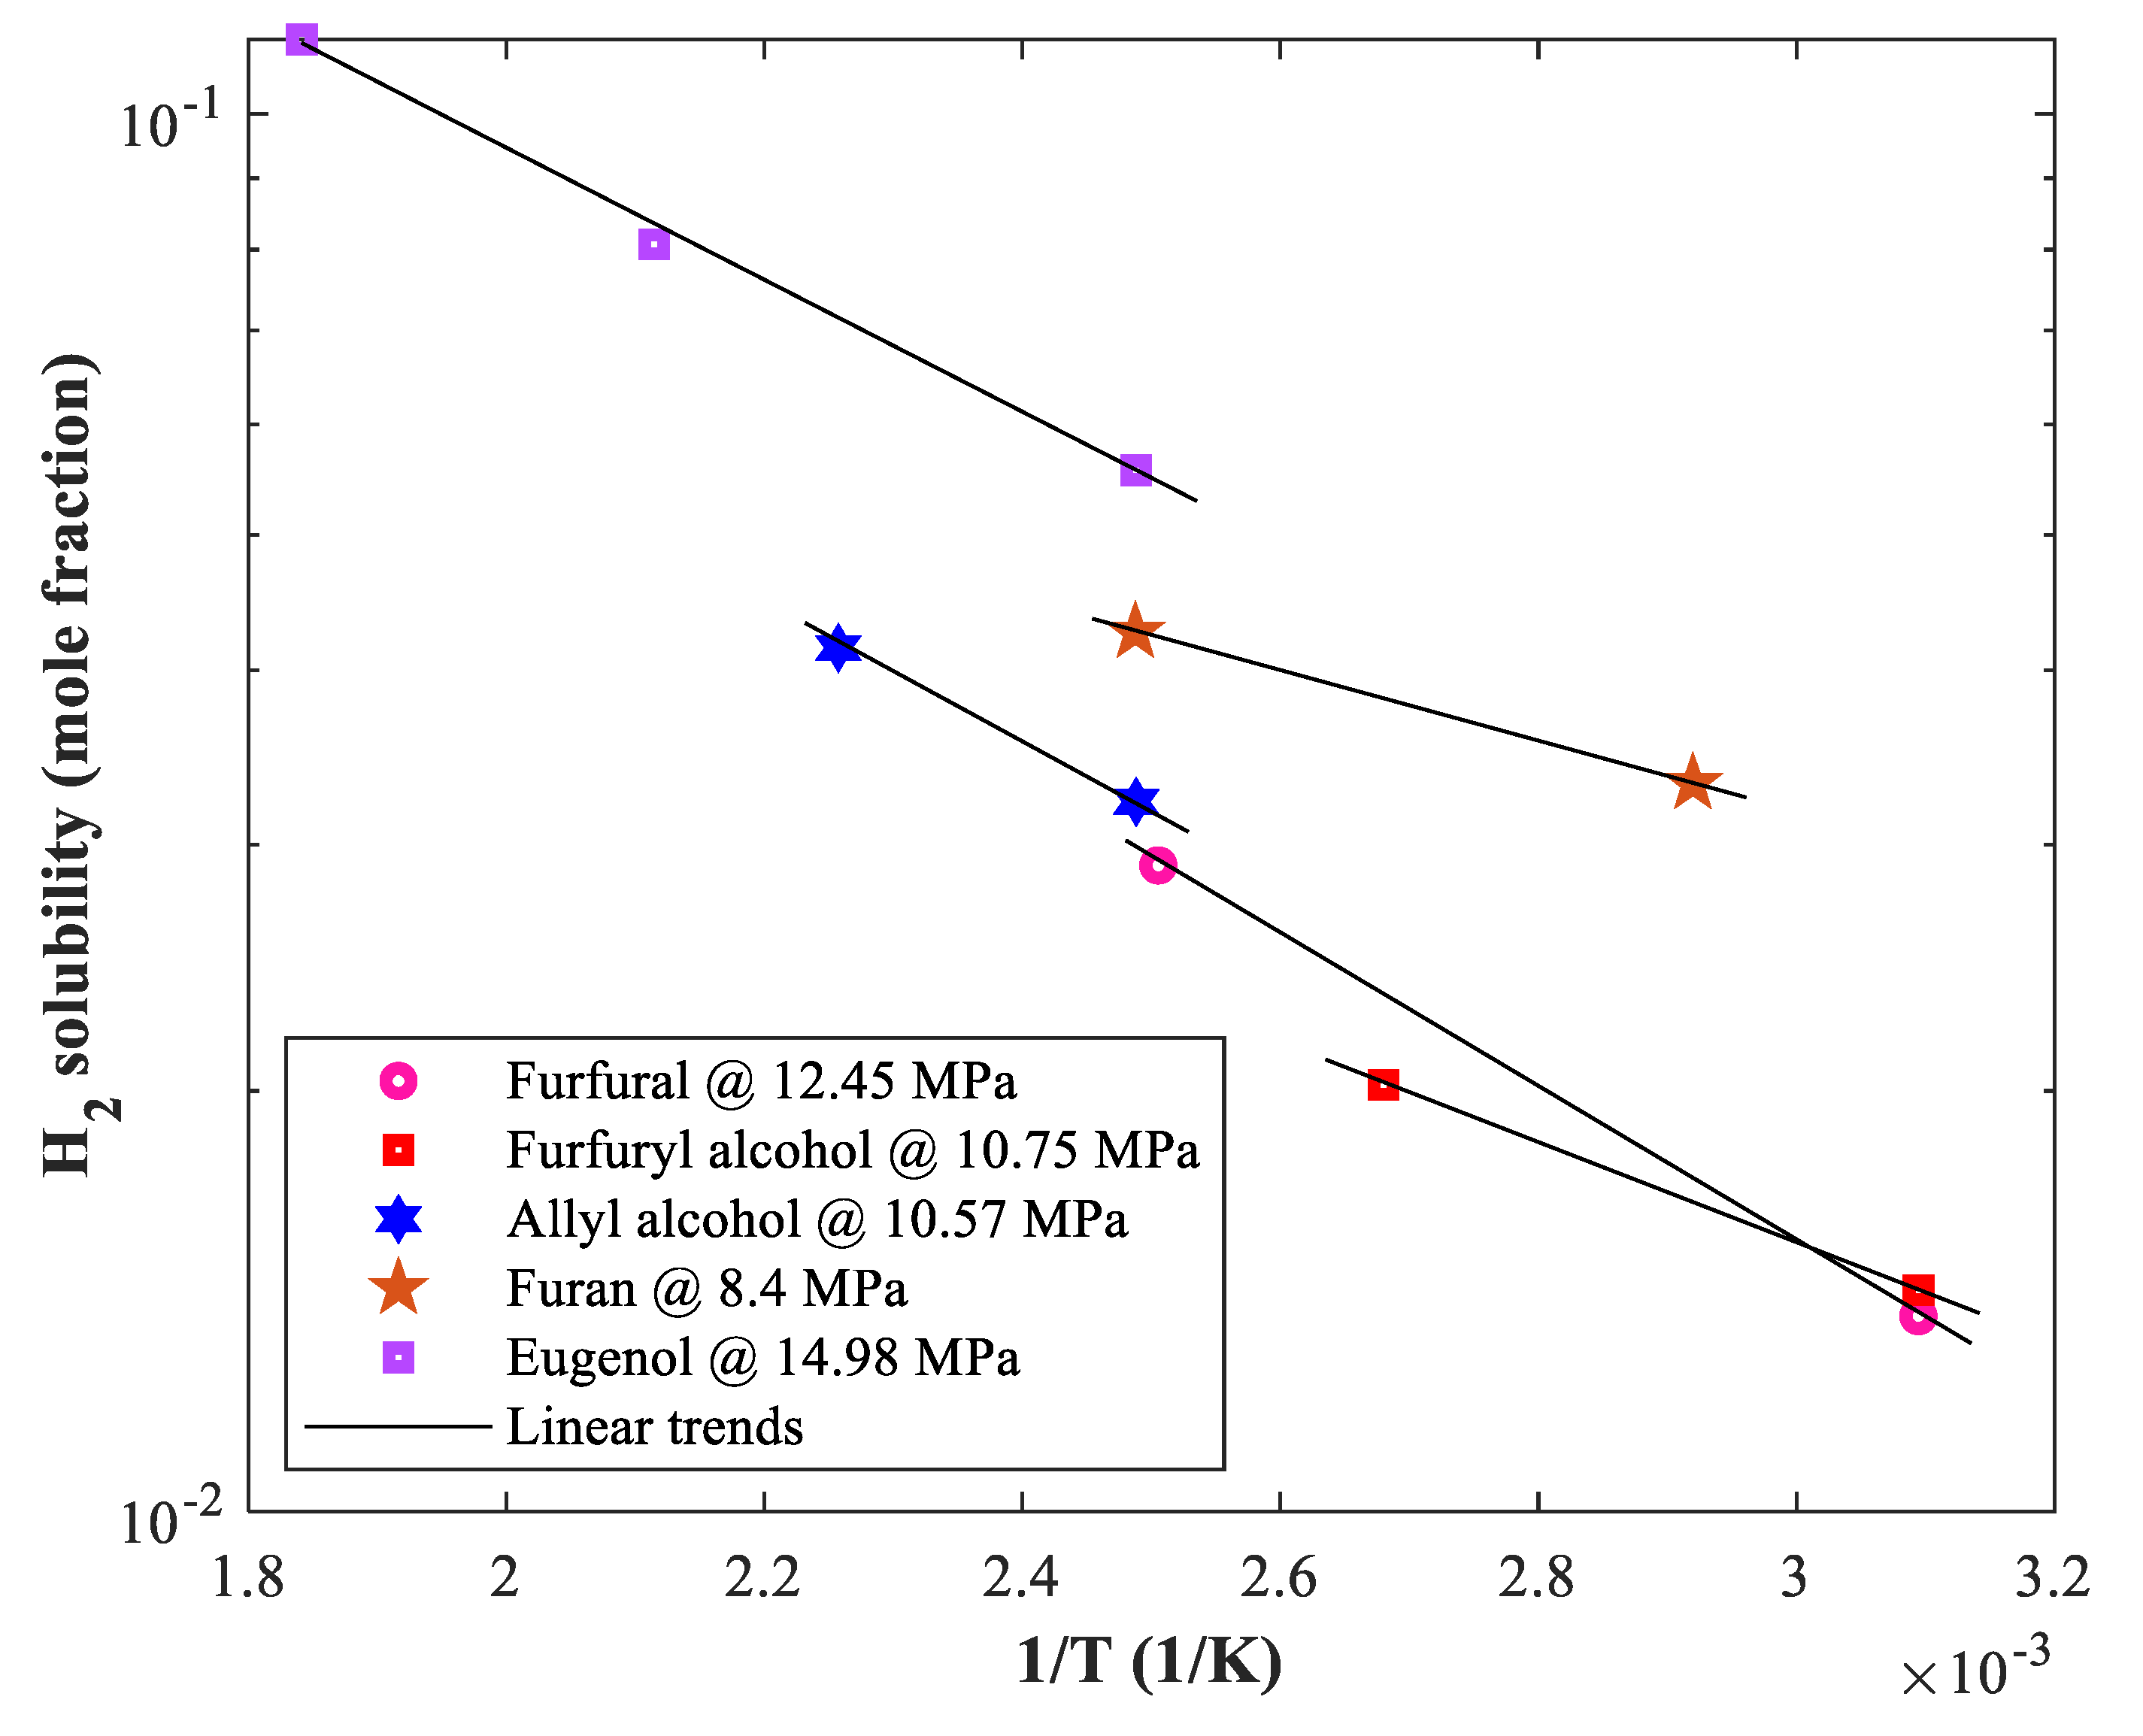
Hydrogen solubility in diverse biomaterials as a function of the isobaric change of the inverse temperature on the semi-logarithm coordination is presented in Figure 2. This figure approves that the natural logarithm of the hydrogen solubility linearly relates to the isobaric change in temperature, that is, exp E a / R g T .

3.2. Model Development

3.2.1. Empirical Correlation

The hydrogen solubility (S) in biomaterials as a function of the pressure (P) and temperature (T) simply appears in the form of Equation (3).
S P , T = α + β P exp E a / R g T
In this equation, α , β ,   and   E a are unknown coefficients of our proposed correlation, and Rg = 8.314 Pa m3/mol K. The DE optimization algorithm adjusts these unknown coefficients using the actual hydrogen solubility data ( S exp ) employing Equation (4) [33].
A A R D % = 100 / N × k = 1 N S k exp S k c a l / S k exp
Indeed, the absolute average relative deviation (AARD%) between actual and estimated hydrogen solubility values is the objective function to be minimized by the DE optimization algorithm.
The adjusted values of unknown coefficients of the proposed model for correlating hydrogen solubility in different biochemicals are reported in Table 2. These coefficients are only needed to put in Equation (3) to calculate the hydrogen solubility in a given biochemical at a desired pressure and temperature.
The proposed model correlated hydrogen dissolution in the furfural, eugenol, allyl alcohol, furan, and furfuryl alcohol with the excellent AARD of 4.67%, 1.23%, 2.46%, 2.34%, and 2.25%, respectively. In addition, the coefficient of determination (i.e., R, Equation (5) [34]) between actual and calculated hydrogen solubilities in the furfural, ally alcohol, furfuryl alcohol, eugenol, and furan is 0.99392, 0.99675, 0.99805, 0.99867, and 0.99892, respectively.
R = 1 k = 1 N S H 2 exp S H 2 p r e d k 2 / k = 1 N S H 2 exp S H 2 exp ¯ k 2
It is worth noting that the developed model correlated all actual datasets with the AARD = 3.02% and R = 0.99815.

3.2.2. Multilayer Perceptron Artificial Neural Network

Machine learning methods are recently engaged in the modeling of different phenomena [35,36,37,38,39]. Multilayer perceptron artificial neural network is likely the most famous black-box methodology in this regard. The developed empirical correlation has 15 adjustable coefficients for all the biochemical–hydrogen binary systems. Therefore, this section designs different MLP-ANNs with the maximum 16 adjustable parameters and compares their accuracy with the proposed empirical correlation. This study adjusts the weights and biases of the MLP-ANN model utilizing the Levenberg–Marquardt optimization method. Table 3 reports the accuracy of different topologies of the MLP-ANN in terms of AARD% and R indices. It can be seen that the MLP-ANN with three hidden neurons (3-3-1 structure) has better AARD% and R values than the other topologies. This MLP-ANN model predicts 134 biochemical–hydrogen equilibrium samples with AARD = 8.18% and R = 0.98983.
Figure 3 presents the schematic of the MLP-ANN model with the highest accuracy to predict hydrogen solubility in biochemical. It should be mentioned that the biochemical molecular weight is used as a solvent indicator in this study.

3.3. Comparison between the Empirical Correlation and MLP-ANN

Table 4 compares the prediction accuracy of the empirical correlation and MLP-ANN in terms of AARD% and R indexes. It can be seen that the empirical correlation provides a more accurate prediction than the MLP-ANN.

3.4. Comparison between the Empirical Correlation and Equations of State

Figure 4 and Figure 5 compare performances of the proposed Arrhenius type correlation with the well-known thermodynamic-based approaches, that is, SRK, PR, and PC-SAFT equations of state for predicting hydrogen solubility in furfuryl alcohol and furfural, respectively. The reported accuracy in the literature for the hydrogen + furfuryl alcohol [29] and hydrogen + furfural [28,29] for these equations of state are used in the current analysis.
It can be seen that the Arrhenius-type correlation has better accuracy than all available equations of state in the literature. The developed correlation presents the best results for predicting hydrogen dissolution in furfuryl alcohol as well as furfural.
The Arrhenius-type correlation predicted hydrogen dissolution in the furfuryl alcohol and furfural with an excellent AARD of 2.25% and 4.67%, respectively. These predictions are 2–6 levels more accurate than those obtained by the SRK and PR equations of state. On the other hand, the PC-SAFT accuracy for predicting H2 solubility in the furfural is almost equal to that presented by the Arrhenius-type correlation. But its prediction for furfuryl alcohol (AARD = 4.62%) is lower than the correlation result (AARD = 2.25%).
It should be noted that the simulation of the biomaterial–hydrogen phase equilibrium with the proposed correlation in this study has a simpler calculation than the equations of state.

3.5. Validation by the Literature Data

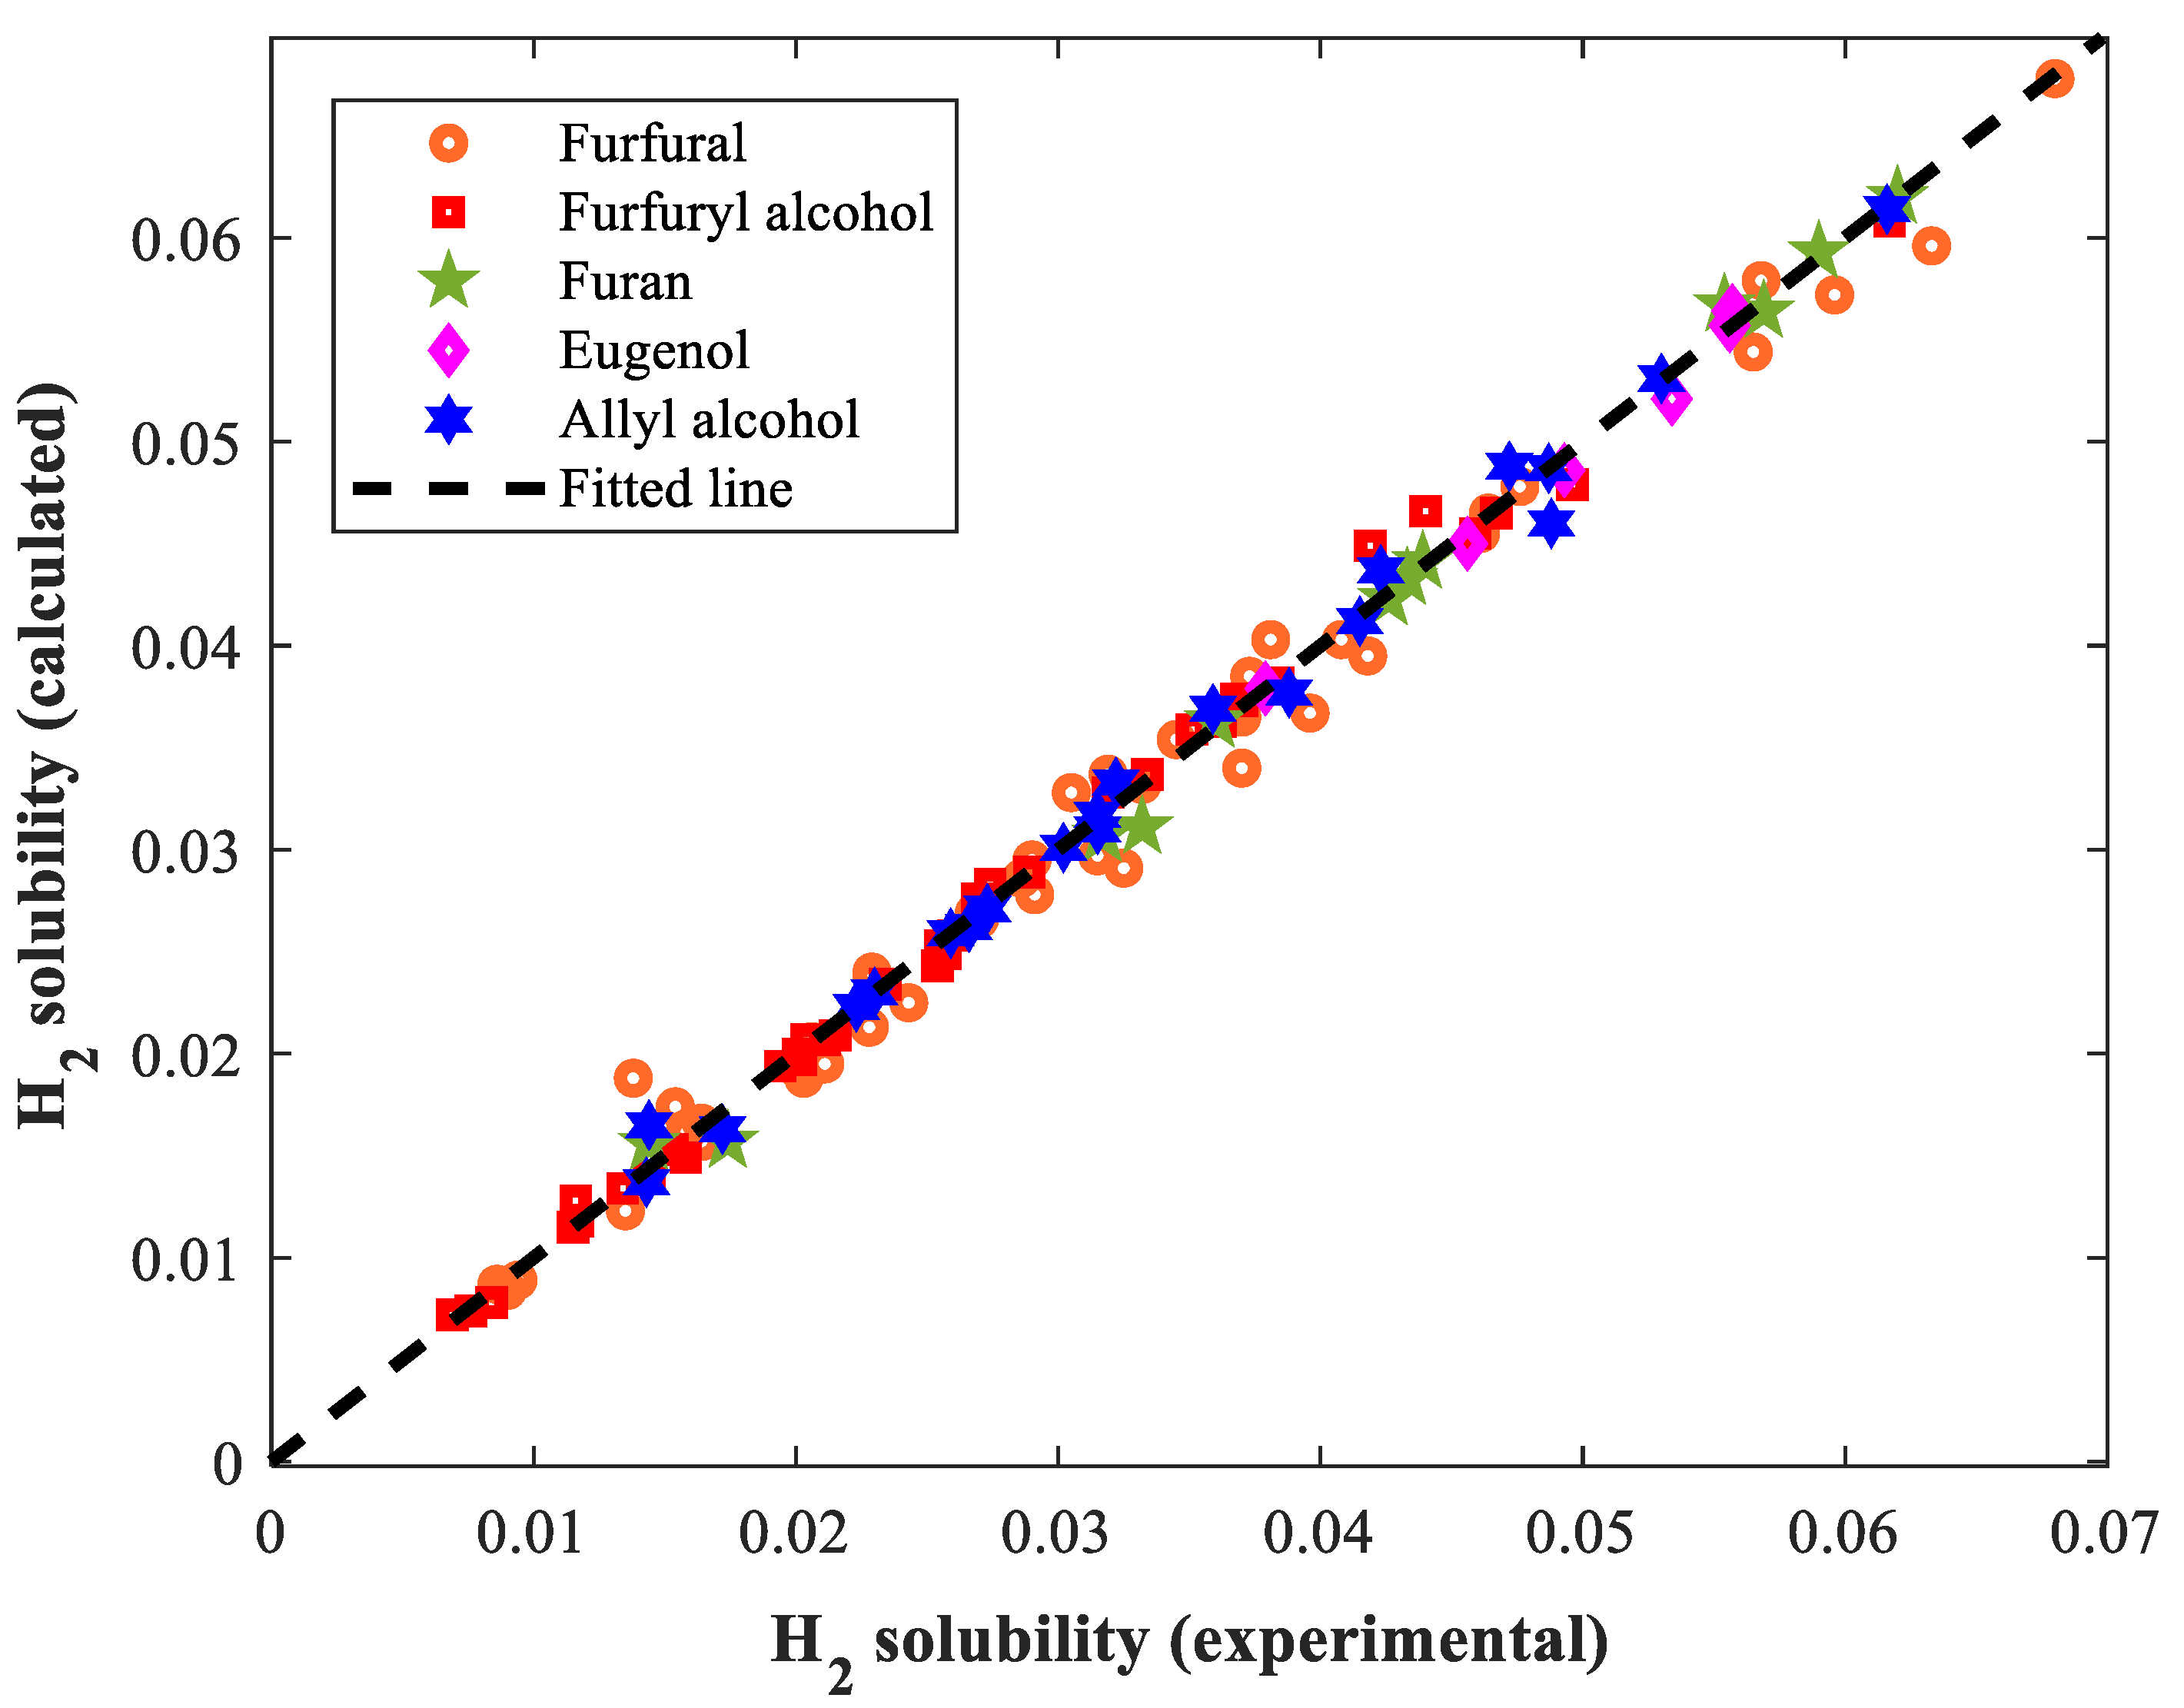
In this section, a cross-plot is employed to validate the efficiency of the proposed correlation using the actual data in the literature. Figure 6 illustrates the predicted and actual values of hydrogen solubility. Since relatively whole symbols are located on the 45⁰ line, the excellent efficiency of the proposed correlation is approved.
It should be highlighted that the considered bio-solvents have different polarity characteristics, and their molecules may interact differently with the nonpolar hydrogen molecules. The topic becomes more interesting when we see that a simple correlation (with only three adjustable coefficients) accurately estimates the hydrogen solubility in different bio-solvents.

3.6. Dependency of Biochemical–H2 Equilibrium on Operating Conditions

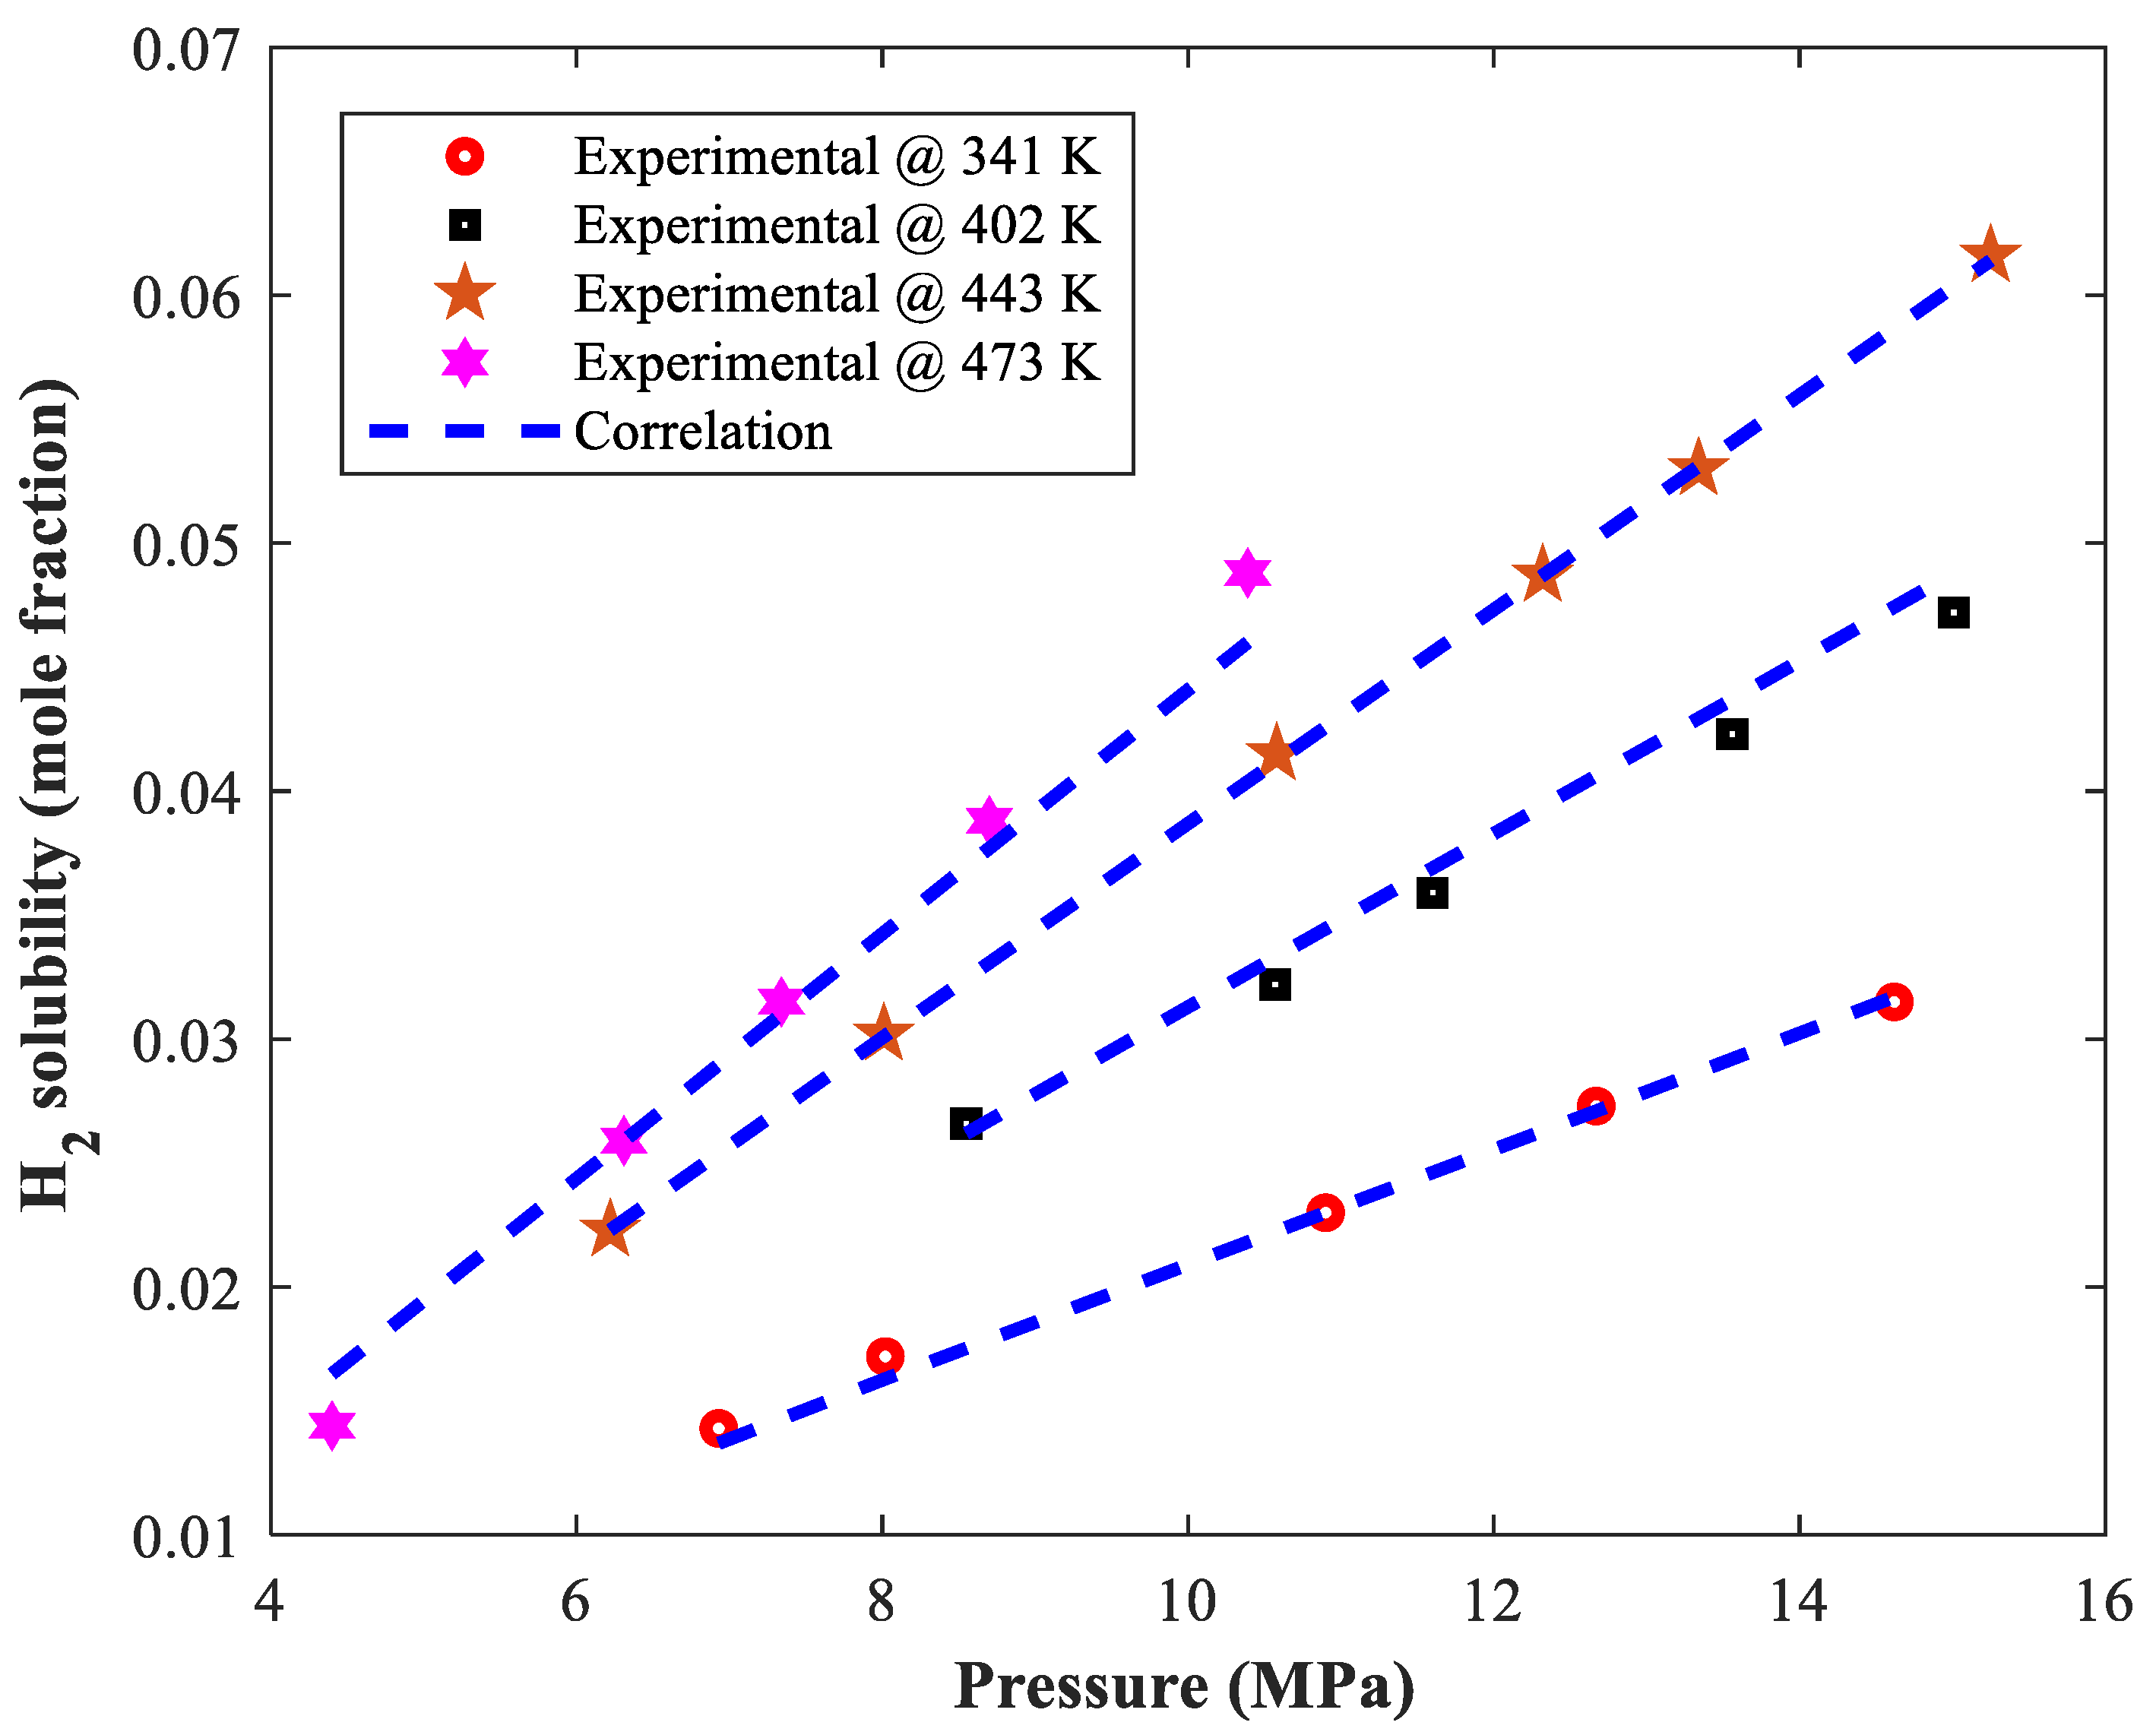
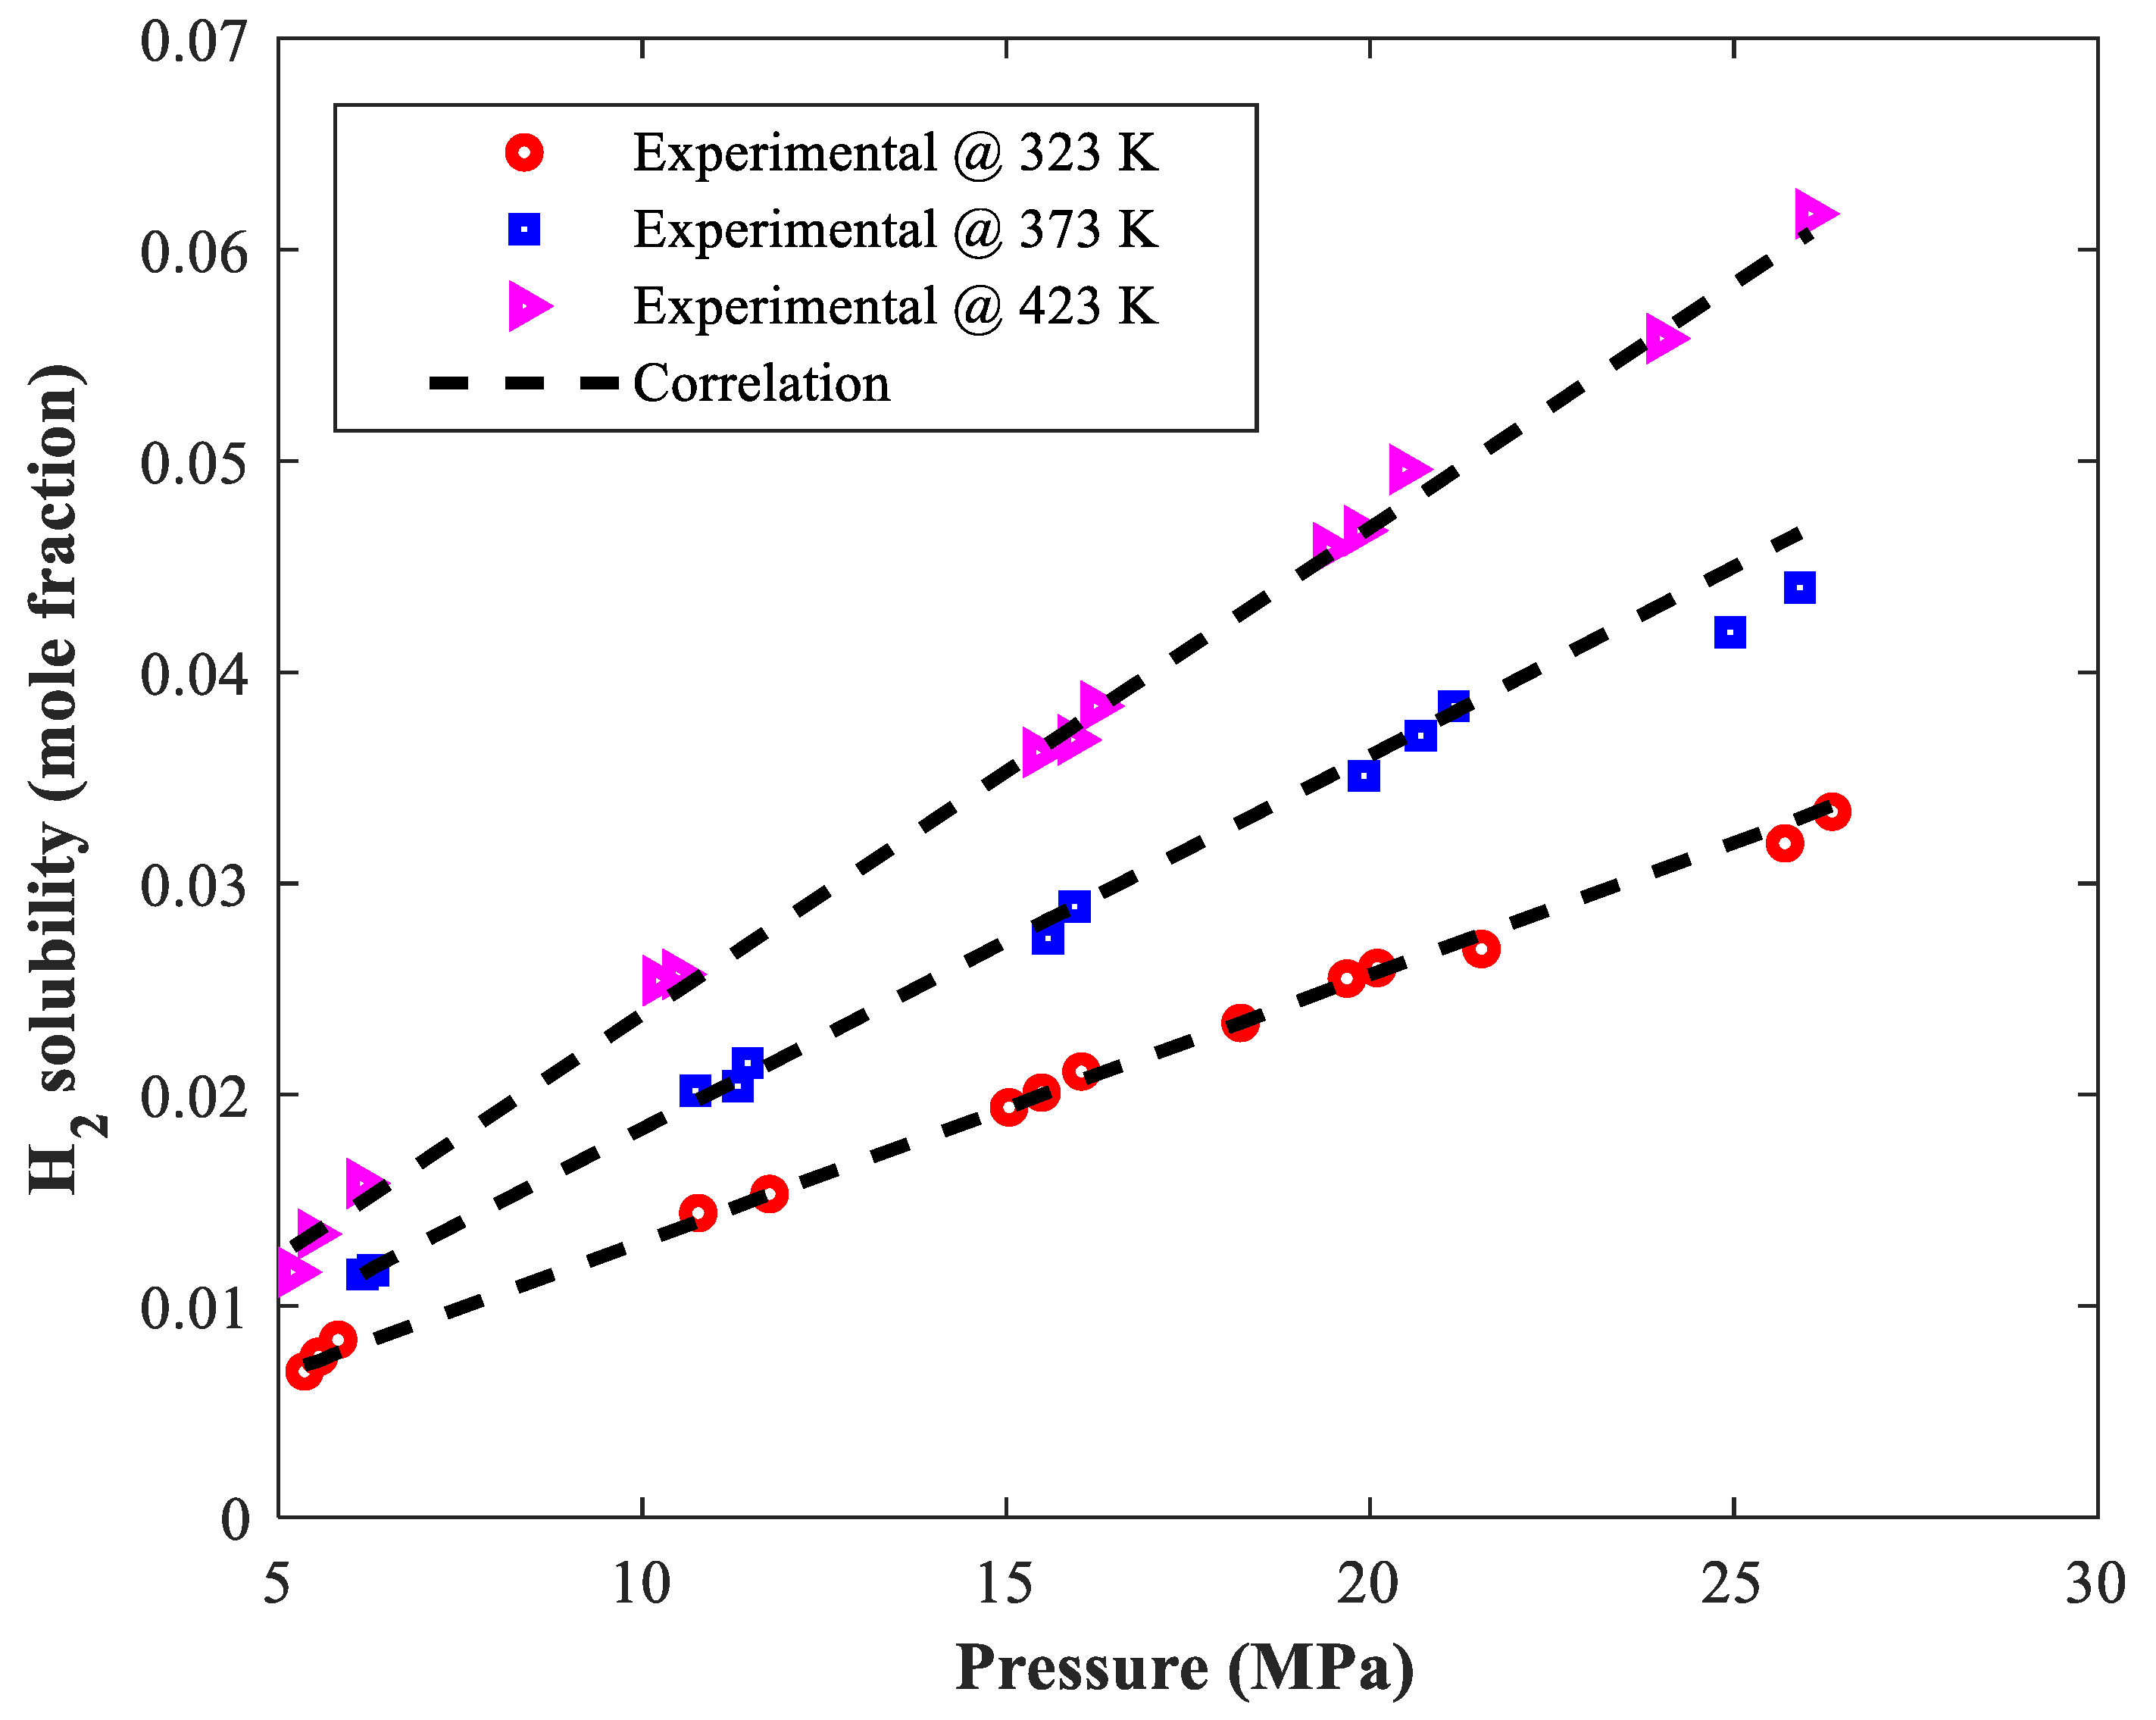
Actual values of hydrogen dissolution in three biochemicals and their corresponding predictions have been depicted in Figure 7 and Figure 8, respectively. All these figures explain the variation of hydrogen dissolution versus the isothermal change in pressure. An acceptable level of agreement exists between laboratory-measured data and prediction findings can be observed from these figures. The suggested correlation precisely persuades the trend of laboratory-measured information and accurately estimates all individual data samples.
Furthermore, both literature data [28,29,30] and modeling findings state that hydrogen solubility in all given biochemicals increases by increasing pressure or temperature. It is well established that pressure increases gas solubility in a liquid by increasing the mass transfer driving force [40]. The effect of temperature on hydrogen solubility is also in complete agreement with a general rule that states that raising the temperature raise enhances the solubility of materials with slight dissolution in liquids [22].

3.7. Analyzing the Impact of Biomaterial Types on the H2 Dissolution

The impact of biomaterial types on hydrogen dissolution from modeling and experimental perspectives are analyzed in this section. Actual data points as well as their corresponding predictions by the empirical correlation for H2 solubility in the concerned biomaterials are shown in Figure 9. This figure expresses that furfuryl alcohol and furan have the minimum and maximum capacity to capture hydrogen molecules. Although the hydrogen dissolution in the furfuryl alcohol and furfural is relatively similar, the first is the worst biomaterial for absorbing the hydrogen due to its higher temperature value. Moreover, it should be highlighted that the furan absorbs the maximum amount of hydrogen at a smaller operating pressure than the other biomaterials. Based on the modeling results, hydrogen solubility in the investigated biomaterials decreases in an order of furan, eugenol, allyl alcohol, furfural, and furfuryl alcohol.
This finding is possibly related to the increased tendency of nonpolar or low-polar biochemicals to dissolve the nonpolar hydrogen substance [29].

4. Conclusions

The current study developed a straightforward correlation to estimate the biomaterial–hydrogen equilibrium behavior from the pressure and temperature. The trend monitoring confirmed that the pre-exponential coefficient of the correlation must linearly relate to the pressure, and its exponential term is a function of the absolute temperature only. The proposed correlation also provides higher accuracy than the MLP-ANN with the same number of adjustable parameters. The proposed correlation estimates hydrogen dissolution in furfural, eugenol, allyl alcohol, furan, and furfuryl alcohol with an excellent AARD of 4.67%, 1.23%, 2.46%, 2.34%, and 2.25%, respectively. In addition, the proposed correlation simulates all the actual data samples with R = 0.99815. These accuracy values are better than those obtained by three well-trusted thermodynamic models in the literature, that is, Peng–Robinson, perturbed-chain statistical associating fluid theory, and Soave–Redlich–Kwong equations of state. Modeling investigations approved that both pressure and temperature increase the hydrogen absorption tendency of all investigated biochemicals. Also, hydrogen solubility in the investigated biomaterials decreases in an order of furan, eugenol, allyl alcohol, furfural, and furfuryl alcohol.

Author Contributions

F.F.: Writing-original draft, Writing-review and editing, Conceptualization, Formal analysis, Investigation, Methodology; A.P.: Writing-original draft, Writing-review & editing, Resources, Data Curation; S.A.A.: Writing-original draft, Writing-review & editing, Visualization, Project administration; M.H.S.: Writing-original draft, Writing-review & editing, Validation; M.M.: Writing-original draft, Writing-review & editing, Methodology; F.A.: Resources, Supervision; B.A.; Writing-Review and editing. All authors have read and agreed to the published version of the manuscript.

Funding

This research received no external funding.

Institutional Review Board Statement

Not applicable.

Informed Consent Statement

Not applicable.

Data Availability Statement

The data that support the findings of this study are available on request from the corresponding author.

Acknowledgments

We acknowledge support by the Deutsche Forschungsgemeinschaft (DFG-German Research Foundation) and the Open Access Publishing Fund of Technical University of Darmstadt.

Conflicts of Interest

The authors declare no conflict of interest.

References

  1. Rehman, A.; Ma, H.; Ozturk, I. Do industrialization, energy importations, and economic progress influence carbon emission in Pakistan. Environ. Sci. Pollut. Res. 2021, 28, 45840–45852. [Google Scholar] [CrossRef] [PubMed]
  2. Avtar, R.; Tripathi, S.; Aggarwal, A.K.; Kumar, P. Population–urbanization–energy Nexus: A review. Resources 2019, 8, 136. [Google Scholar] [CrossRef] [Green Version]
  3. Karimi, M.; Zafanelli, L.F.A.S.; Almeida, J.P.P.; Ströher, G.R.; Rodrigues, A.E.; Silva, J.A.C. Novel insights into activated carbon derived from municipal solid waste for CO2 uptake: Synthesis, adsorption isotherms and scale-up. J. Environ. Chem. Eng. 2020, 8, 104069. [Google Scholar] [CrossRef]
  4. Liang, Y.; Li, J.; Xue, Y.; Tan, T.; Jiang, Z.; He, Y.; Shangguan, W.; Yang, J.; Pan, Y. Benzene decomposition by non-thermal plasma: A detailed mechanism study by synchrotron radiation photoionization mass spectrometry and theoretical calculations. J. Hazard. Mater. 2021, 420, 126584. [Google Scholar] [CrossRef] [PubMed]
  5. Höök, M.; Tang, X. Depletion of fossil fuels and anthropogenic climate change—A review. Energy Policy 2013, 52, 797–809. [Google Scholar] [CrossRef] [Green Version]
  6. Xu, X.; Wang, C.; Zhou, P. GVRP considered oil-gas recovery in refined oil distribution: From an environmental perspective. Int. J. Prod. Econ. 2021, 235, 108078. [Google Scholar] [CrossRef]
  7. Wang, Y.; Cao, Q.; Liu, L.; Wu, Y.; Liu, H.; Gu, Z.; Zhu, C. A review of low and zero carbon fuel technologies: Achieving ship carbon reduction targets. Sustain. Energy Technol. Assess. 2022, 54, 102762. [Google Scholar] [CrossRef]
  8. Liu, L.; Tang, Y.; Liu, D. Investigation of future low-carbon and zero-carbon fuels for marine engines from the view of thermal efficiency. Energy Rep. 2022, 8, 6150–6160. [Google Scholar] [CrossRef]
  9. Si, Z.; Yang, M.; Yu, Y.; Ding, T. Photovoltaic power forecast based on satellite images considering effects of solar position. Appl. Energy 2021, 302, 117514. [Google Scholar] [CrossRef]
  10. Li, P.; Yang, M.; Wu, Q. Confidence interval based distributionally robust real-time economic dispatch approach considering wind power accommodation risk. IEEE Trans. Sustain. Energy 2020, 12, 58–69. [Google Scholar] [CrossRef]
  11. Aghel, B.; Gouran, A.; Behaien, S.; Vaferi, B. Experimental and modeling analyzing the biogas upgrading in the microchannel: Carbon dioxide capture by seawater enriched with low-cost waste materials. Environ. Technol. Innov. 2022, 27, 102770. [Google Scholar] [CrossRef]
  12. Aghel, B.; Gouran, A.; Parandi, E.; Jumeh, B.H.; Nodeh, H.R. Production of biodiesel from high acidity waste cooking oil using nano GO@ MgO catalyst in a microreactor. Renew. Energy 2022, 200, 294–302. [Google Scholar] [CrossRef]
  13. Karimi, M.; Diaz de Tuesta, J.L.; Carmem, C.N.; Gomes, H.T.; Rodrigues, A.E.; Silva, J.A.C. Compost from Municipal Solid Wastes as a Source of Biochar for CO2 Capture. Chem. Eng. Technol. 2020, 43, 1336–1349. [Google Scholar] [CrossRef]
  14. Karimi, M.; Shirzad, M.; Silva, J.A.C.; Rodrigues, A.E. Biomass/Biochar carbon materials for CO2 capture and sequestration by cyclic adsorption processes: A review and prospects for future directions. J. CO2 Util. 2022, 57, 101890. [Google Scholar] [CrossRef]
  15. Qureshi, M.S. Phase Equilibria of Bio-Oil Compounds. PhD Dissertation, Aalto University, Espoo, Finland, 2017. [Google Scholar]
  16. Tun, M.M.; Juchelkova, D.; Win, M.M.; Thu, A.M.; Puchor, T. Biomass energy: An overview of biomass sources, energy potential, and management in Southeast Asian countries. Resources 2019, 8, 81. [Google Scholar] [CrossRef] [Green Version]
  17. Adams, P.; Bridgwater, T.; Lea-Langton, A.; Ross, A.; Watson, I. Biomass conversion technologies. In Greenhouse Gas Balances of Bioenergy Systems; Elsevier: Amsterdam, The Netherlands, 2018; pp. 107–139. [Google Scholar]
  18. Suriapparao, D.V.; Vinu, R. Biomass waste conversion into value-added products via microwave-assisted Co-Pyrolysis platform. Renew. Energy 2021, 170, 400–409. [Google Scholar] [CrossRef]
  19. Vargas-Moreno, J.M.; Callejón-Ferre, A.J.; Pérez-Alonso, J.; Velázquez-Martí, B. A review of the mathematical models for predicting the heating value of biomass materials. Renew. Sustain. Energy Rev. 2012, 16, 3065–3083. [Google Scholar] [CrossRef]
  20. Pannone, P.J. Trends in Biomaterials Research; Nova Publishers: Hauppauge, NY, USA, 2007. [Google Scholar]
  21. Kumar, M.; Sundaram, S.; Gnansounou, E.; Larroche, C.; Thakur, I.S. Carbon dioxide capture, storage and production of biofuel and biomaterials by bacteria: A review. Bioresour. Technol. 2018, 247, 1059–1068. [Google Scholar] [CrossRef]
  22. Xie, J.; Liu, X.; Lao, X.; Vaferi, B. Hydrogen solubility in furfural and furfuryl bio-alcohol: Comparison between the reliability of intelligent and thermodynamic models. Int. J. Hydrogen Energy 2021, 46, 36056–36068. [Google Scholar] [CrossRef]
  23. Alamillo, R.; Tucker, M.; Chia, M.; Pagán-Torres, Y.; Dumesic, J. The selective hydrogenation of biomass-derived 5-hydroxymethylfurfural using heterogeneous catalysts. Green Chem. 2012, 14, 1413–1419. [Google Scholar] [CrossRef]
  24. Bohre, A.; Hočevar, B.; Grilc, M.; Likozar, B. Selective catalytic decarboxylation of biomass-derived carboxylic acids to bio-based methacrylic acid over hexaaluminate catalysts. Appl. Catal. B Environ. 2019, 256, 117889. [Google Scholar] [CrossRef]
  25. Nolte, M.W.; Shanks, B.H. A perspective on catalytic strategies for deoxygenation in biomass pyrolysis. Energy Technol. 2017, 5, 7–18. [Google Scholar] [CrossRef]
  26. Mellmer, M.A.; Sanpitakseree, C.; Demir, B.; Ma, K.; Elliott, W.A.; Bai, P.; Johnson, R.L.; Walker, T.W.; Shanks, B.H.; Rioux, R.M. Effects of chloride ions in acid-catalyzed biomass dehydration reactions in polar aprotic solvents. Nat. Commun. 2019, 10, 1132. [Google Scholar] [CrossRef] [PubMed] [Green Version]
  27. Zhang, Z.; Zijlstra, D.S.; Lahive, C.W.; Deuss, P.J. Combined lignin defunctionalisation and synthesis gas formation by acceptorless dehydrogenative decarbonylation. Green Chem. 2020, 22, 3791–3801. [Google Scholar] [CrossRef]
  28. Jaatinen, S.; Touronen, J.; Karinen, R.; Uusi-Kyyny, P.; Alopaeus, V. Hydrogen solubility in furfural and 2-propanol: Experiments and modeling. J. Chem. Thermodyn. 2017, 112, 1–6. [Google Scholar] [CrossRef] [Green Version]
  29. Ivaniš, G.; Žilnik, L.F.; Likozar, B.; Grilc, M. Hydrogen solubility in bio-based furfural and furfuryl alcohol at elevated temperatures and pressures relevant for hydrodeoxygenation. Fuel 2021, 290, 120021. [Google Scholar] [CrossRef]
  30. Qureshi, M.S.; Touronen, J.; Uusi-Kyyny, P.; Richon, D.; Alopaeus, V. Solubility of hydrogen in bio-oil compounds. J. Chem. Thermodyn. 2016, 102, 406–412. [Google Scholar] [CrossRef]
  31. Safe, M.; Khazraee, S.M.; Setoodeh, P.; Jahanmiri, A.H. Model reduction and optimization of a reactive dividing wall batch distillation column inspired by response surface methodology and differential evolution. Math. Comput. Model. Dyn. Syst. 2013, 19, 29–50. [Google Scholar] [CrossRef]
  32. Logan, S.R. The origin and status of the Arrhenius equation. J. Chem. Educ. 1982, 59, 279. [Google Scholar] [CrossRef]
  33. Hosseini, S.; Vaferi, B. Determination of methanol loss due to vaporization in gas hydrate inhibition process using intelligent connectionist paradigms. Arab. J. Sci. Eng. 2022, 47, 5811–5819. [Google Scholar] [CrossRef]
  34. Safdari Shadloo, M. Application of support vector machines for accurate prediction of convection heat transfer coefficient of nanofluids through circular pipes. Int. J. Numer. Methods Heat Fluid Flow 2021, 31, 2660–2679. [Google Scholar] [CrossRef]
  35. Li, Y.; Niu, B.; Zong, G.; Zhao, J.; Zhao, X. Command filter-based adaptive neural finite-time control for stochastic nonlinear systems with time-varying full-state constraints and asymmetric input saturation. Int. J. Syst. Sci. 2022, 53, 199–221. [Google Scholar] [CrossRef]
  36. Zhao, Y.; Wang, H.; Xu, N.; Zong, G.; Zhao, X. Reinforcement learning-based decentralized fault tolerant control for constrained interconnected nonlinear systems. Chaos Solitons Fractals 2023, 167, 113034. [Google Scholar] [CrossRef]
  37. Cheng, F.; Wang, H.; Zhang, L.; Ahmad, A.M.; Xu, N. Decentralized adaptive neural two-bit-triggered control for nonstrict-feedback nonlinear systems with actuator failures. Neurocomputing 2022, 500, 856–867. [Google Scholar] [CrossRef]
  38. Zheng, Y.; Safdari Shadloo, M.; Nasiri, H.; Maleki, A.; Karimipour, A.; Tlili, I. Prediction of viscosity of biodiesel blends using various artificial model and comparison with empirical correlations. Renew. Energy 2020, 153, 1296–1306. [Google Scholar] [CrossRef]
  39. Alibak, A.H.; Alizadeh, S.M.; Davodi Monjezi, S.; Alizadeh, A.A.; Alobaid, F.; Aghel, B. Developing a Hybrid Neuro-Fuzzy Method to Predict Carbon Dioxide (CO2) Permeability in Mixed Matrix Membranes Containing SAPO-34 Zeolite. Membranes 2022, 12, 1147. [Google Scholar] [CrossRef]
  40. Liu, W.; Zhao, C.; Zhou, Y.; Xu, X. Modeling of Vapor-Liquid Equilibrium for Electrolyte Solutions Based on COSMO-RS Interaction. J. Chem. 2022, 2022, 9070055. [Google Scholar] [CrossRef]
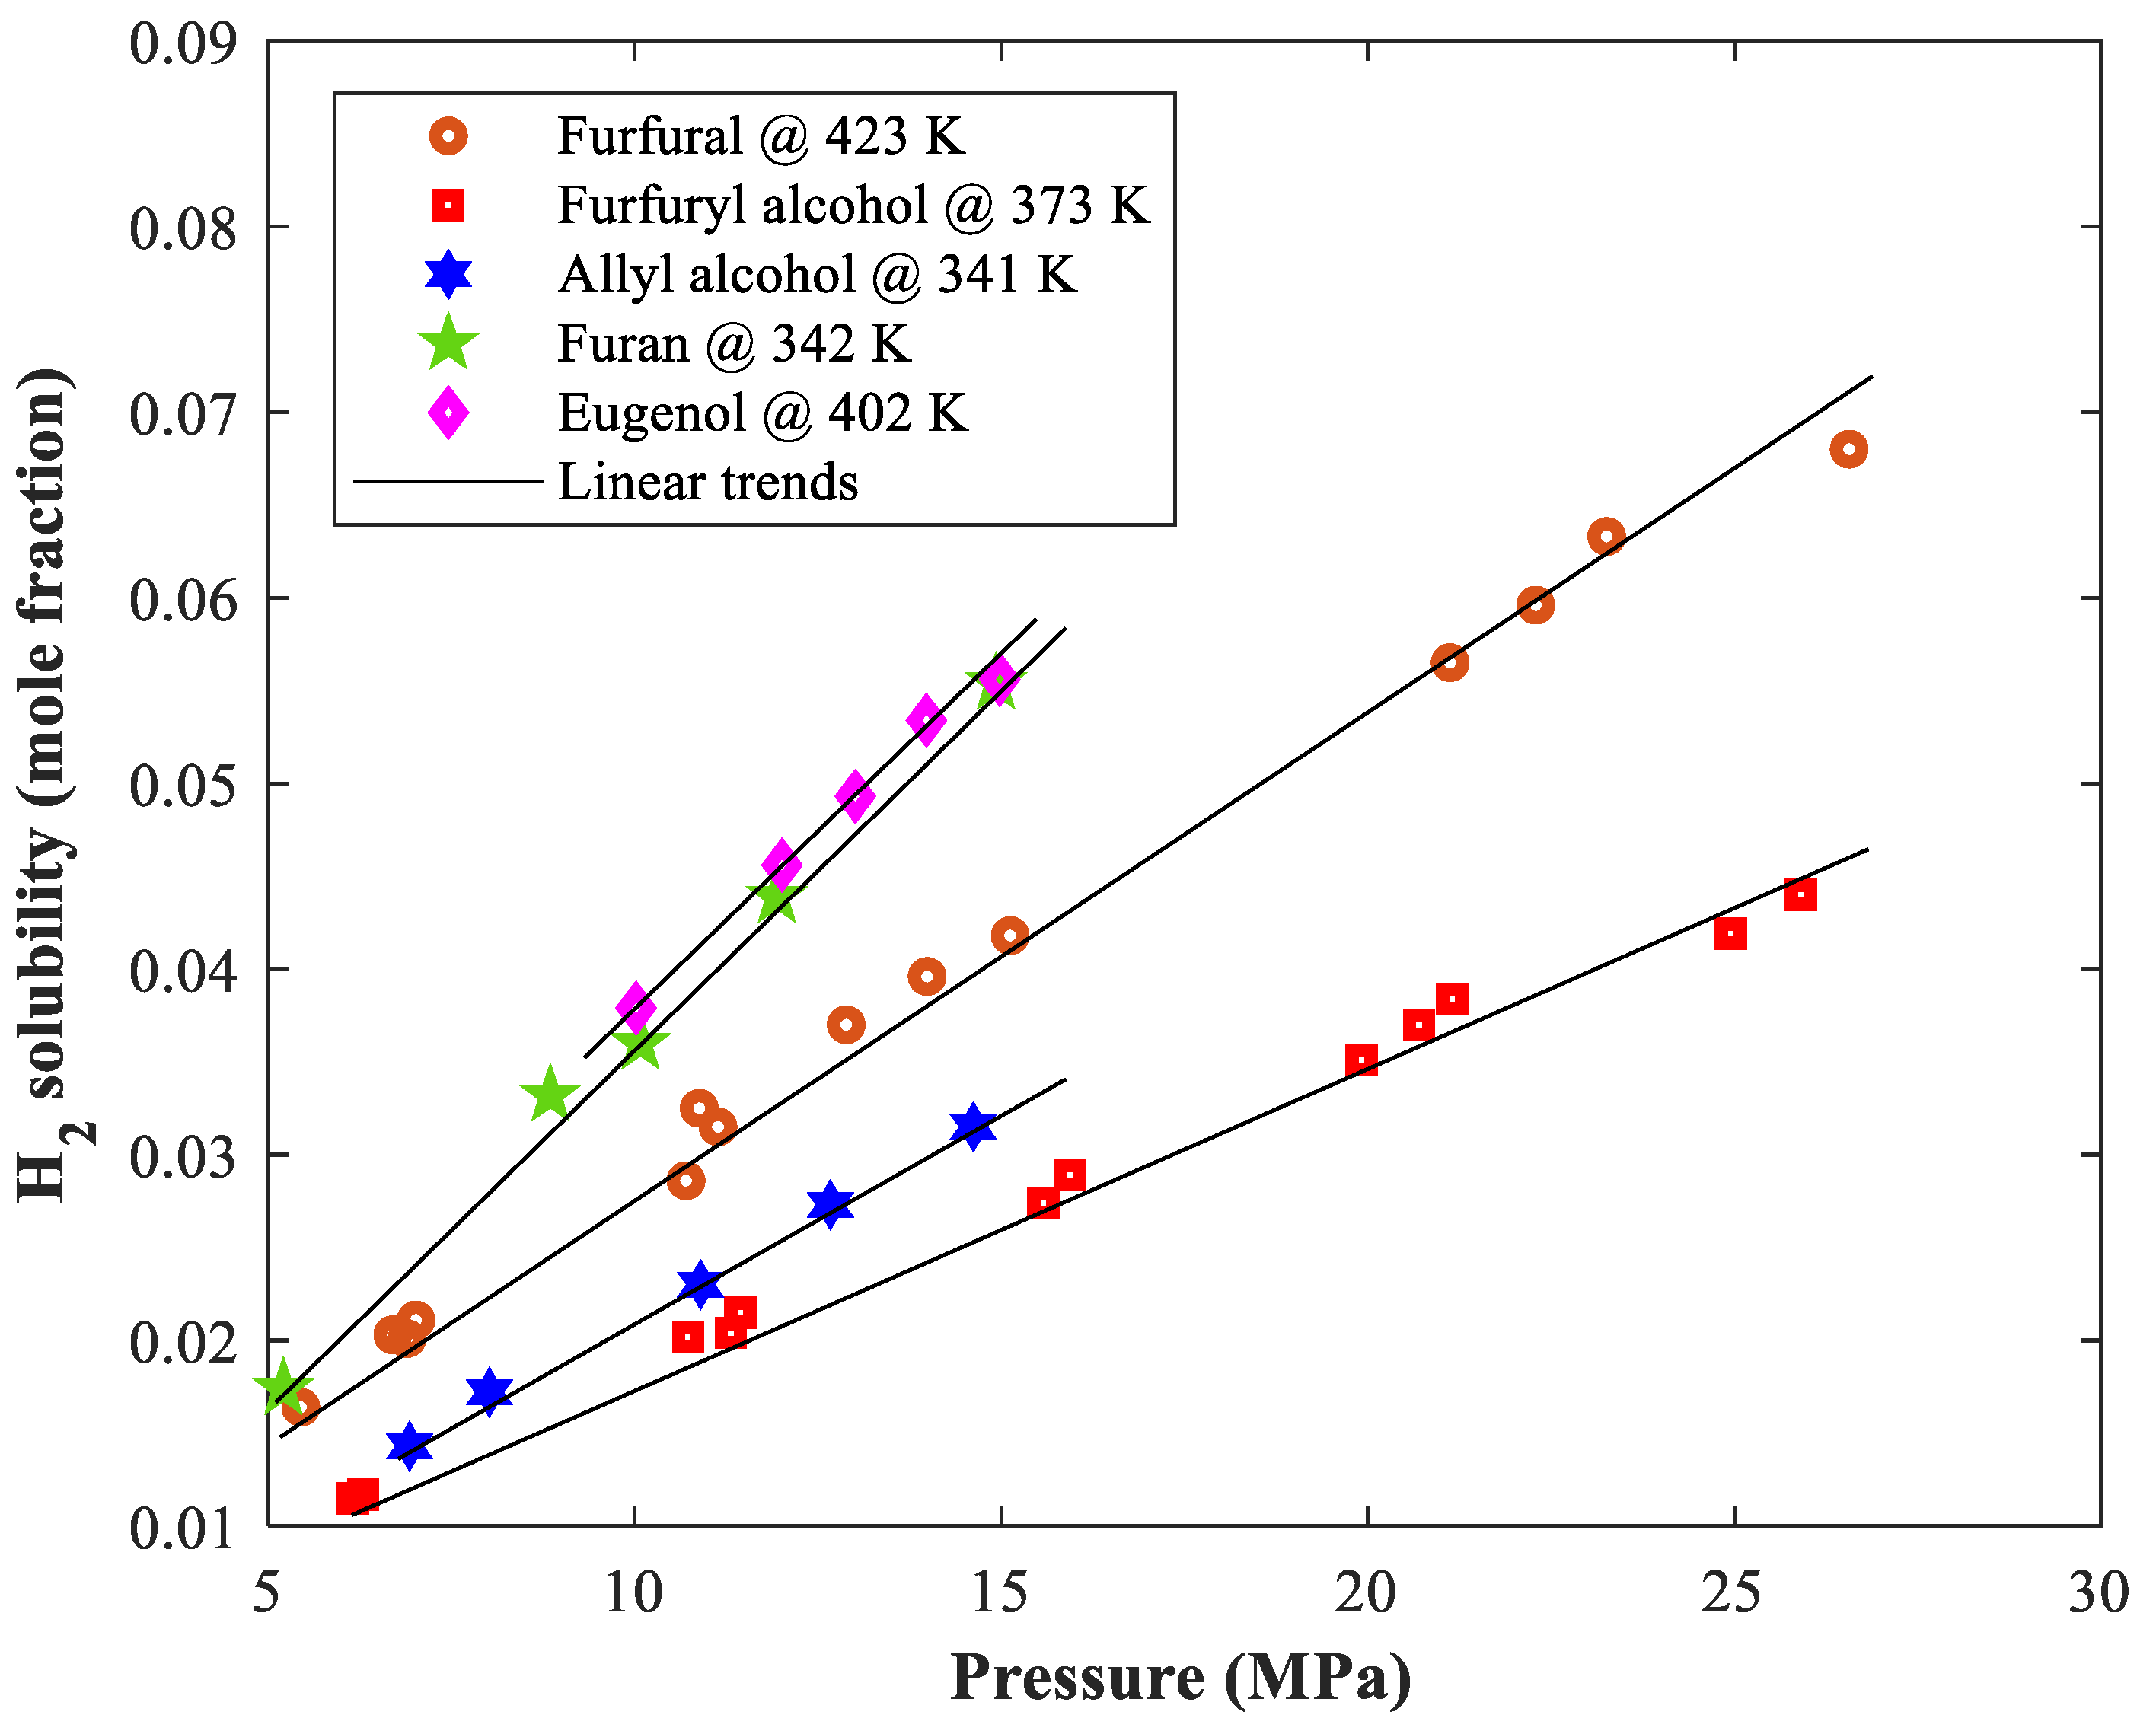
Figure 1. Hydrogen solubility in biomaterials versus working pressure.
Processes 11 00714 g001
Figure 2. Variation of H2 solubility by temperature (semi-logarithm scale).
Processes 11 00714 g002
Figure 3. The topology of MLP-ANN for estimating H2 solubility in biochemicals.
Processes 11 00714 g003
Figure 4. Accuracy of the predicted H2 solubility in furfuryl alcohol by the Arrhenius type correlation and equations of state [29].
Processes 11 00714 g004
Figure 5. Accuracy of the predicted H2 solubility in furfural by equations of state [28,29] and the Arrhenius type correlation.
Processes 11 00714 g005
Figure 6. The model predictions versus actual measurements of hydrogen solubility in biomaterials.
Processes 11 00714 g006
Figure 7. Impact of isothermal variation of pressure on H2 dissolution in the allyl alcohol.
Processes 11 00714 g007
Figure 8. Actual and modeling values for the furfuryl alcohol-hydrogen equilibrium behavior.
Processes 11 00714 g008
Figure 9. Actual and modeling results for comparing hydrogen dissolution ability of diverse biomaterials.
Processes 11 00714 g009
Table 1. Summary of the literature data for hydrogen solubility in biomaterials.
Binary MixtureTemperature
(K)
Pressure
(kPa)
H2 Solubility
(Mole Fraction)
CountRef.
Allyl alcohol–Hydrogen341–4734400–15,2500.014–0.06221[30]
Eugenol–Hydrogen402–54310,000–14,9800.038–0.11314[30]
Furan-Hydrogen342–4023890–14,9300.014–0.08114[30]
Furfural–Hydrogen323–4766960–12,4500.014–0.0387[28]
Furfural–Hydrogen323–4235111–26,5650.009–0.06839[29]
Furfuryl alcohol–Hydrogen323–4235197–26,3480.007–0.06239[29]
Table 2. Coefficients of the proposed model for correlating hydrogen solubility in biochemicals.
Hydrogen + α β k P a 1 E a / R g K
Allyl alcohol−0.03633.429 × 10−5917.3
Eugenol0.02895.151 × 10−51071.5
Furan−0.11217.556 × 10−5988.4
Furfural0.01361.523 × 10−5769.8
Furfuryl alcohol0.00571.614 × 10−5823.9
Table 3. Sensitivity analysis on the topology of MLP-ANN.
MLP-ANN StructureOverall AARD%R
3-1-126.810.84011
3-2-115.750.93326
3-3-18.180.98983
Table 4. Comparison between the performance of empirical correlation and MLP-ANN with the same number of adjustable parameters.
ApproachOverall AARD%R
Empirical correlation3.020.99815
MLP-ANN8.180.98983
Disclaimer/Publisher’s Note: The statements, opinions and data contained in all publications are solely those of the individual author(s) and contributor(s) and not of MDPI and/or the editor(s). MDPI and/or the editor(s) disclaim responsibility for any injury to people or property resulting from any ideas, methods, instructions or products referred to in the content.