Article

Onion (Allium cepa L.) Yield and Quality Depending on Biostimulants and Nitrogen Fertilization—A Chemometric Perspective

by
Đorđe Vojnović
1,*,
Ivana Maksimović
1,
Aleksandra Tepić Horecki
2,
Milica Karadžić Banjac
2,
Strahinja Kovačević
2,
Tatjana Daničić
2,
Sanja Podunavac-Kuzmanović
2 and
Žarko Ilin
1
1
Faculty of Agriculture, University of Novi Sad, Dositej Obradović Square 8, 21000 Novi Sad, Serbia
2
Faculty of Technology Novi Sad, University of Novi Sad, Bulevar cara Lazara 1, 21000 Novi Sad, Serbia
*
Author to whom correspondence should be addressed.
Processes 2023, 11(3), 684; https://doi.org/10.3390/pr11030684
Submission received: 23 December 2022 / Revised: 21 February 2023 / Accepted: 22 February 2023 / Published: 23 February 2023
(This article belongs to the Special Issue Advances in Food Processes Modeling)

Abstract

:
The influence of biostimulants (B) and nitrogen (N) fertilization on the yield and quality of onions were investigated. Experiments in the field with directly seeded (DS) onions and those from sets (FS) were carried out in 2021 in the Autonomous Province of Vojvodina (Serbia). HumiBlack® (B1), Tifi® (B2), and Agasi® (B3) were used as B, and there was a control without B. Four N doses were used: 64, 100, 150 (standard dose), and 200 kg N/ha. The highest yields of DS onions (63.9 t/ha) and FS onions (52, 1 t/ha) were measured on treatment B2 × 150 kg N/ha. The highest total sugar content (80.6 g/100 g DM) was measured in FS onions under treatment B2 × 100 kg N/ha. Total nitrogen and protein content were the highest in DS onions treated with B2 × 200 kg N/ha, where total nitrogen was 2.3 g/100 g DM and protein content was 14.5 g/100 g DM. Depending on B and N, titratable acidity ranged from 1.7 to 3.6 g/100 g DM. Principal component analysis (PCA) and hierarchical cluster analysis (HCA) were used to analyze onions and showed that FS onions have lower values of total phenolics and crude fiber content, DPPH, FRAP, and ABTS compared to DS onions. In this study, a chemometric approach was suitable for grouping onions according to treatment effect and main interactions between B and N.

1. Introduction

Onions (Allium cepa L.) are consumed daily, fresh or processed, by a large part of the human population, and constitute an essential raw material in various industries. In 2019, onion consumption per capita reached 11.6 kg worldwide [1]. Onions contain phytochemicals such as polyphenols, flavonoids, organic acids, sugars, and sulfur compounds that are beneficial for human health [2,3]. Nuutila et al. [4] and Khalili et al. [5] reported the antioxidant activity of onions.
Onions can be cultivated as directly seeded (DS), from seedlings, and from sets (FS) [6]. However, regardless of the cultivation method, onions have a great need for nitrogen (N). Due to the shallow root system of onions, the efficiency of applied nitrogen fertilizers is often low, and there is a risk of nitrate leaching losses [7]. As a result of these losses, environmental contamination is notably increasing. Eco-friendly strategies for reducing N fertilizers in cultivation systems include using natural biostimulants [8].
Biostimulants are substances that can modify physiological processes that provide potential benefits for plant growth and development [9]. As a result of these changes, the yield and quality of vegetables can be improved. Humic substances (HS) [10], beneficial microorganisms (e.g., Trichoderma spp.) [11] and seaweed extracts (SWE) [12] can be used as biostimulants in vegetable production.
Using HS as biostimulants improved yield and the content of phenols, flavonoids, and antioxidant activities in pepper fruit [13]. In young maize plants, Schiavon et al. [14] reported that HS could increase the synthesis of phenylalanine and tyrosine ammonia lyases that participate in the biosynthesis of phenols. In garlic, protein content was improved after HS application in field conditions [15]. Jannin et al. [16] recorded that HS increased the expression of genes involved in carbon fixation during the dark phase of photosynthesis, which contributed to a higher starch content in the chloroplasts of rapeseed. Antioxidant activity and the content of phenols in the extract of common yarrow were affected by HS [17].
To improve the yield and quality of vegetables, farmers often use biostimulants based on beneficial microorganisms. According to Lόpez-Bucio et al. [11], Trichoderma spp. belongs to a group of biostimulants based on plant growth-promoting (PGP) abilities. Ji et al. [18] reported an enhanced quality of Chinese cabbage treated with Trichoderma spp. With a similar biostimulant, Vukelić et al. [19] noted a decrease in polyphenol content in the tomato fruit. In addition, the same authors proved that different tomato varieties might react differently to the application of Trichoderma spp. Visconti et al. [20] reported that Trichoderma spp. changed yield and phenolic content in lettuce leaves.
Using SWE as a biostimulant improved zucchini fruit yield and quality, and reduced oxidative stress [21]. In the case of carrots and beans, applying SWE increased flavonoids and anthocyanin content [22,23], while there was increased protein content in lettuce [24]. The sugar and protein content, total phenols, and free amino acids of onions increased by using a seaweed-based biostimulant [25,26].
The supply of N has an important role in controlling the yield and quality of vegetables [27]. For example, applying a different dose of N changed the protein content of sweet corn [28] and the soluble sugars in cucumber fruit [29]. Petropoulos et al. [30] reported a relation between N fertilization and the yield of processed tomatoes. According to Lee et al. [31], fertilization onions with high N doses, such as 240 and 360 kg/ha, can decrease the marketable yield of bulbs. Golubkina et al. [32] observed that insufficient and excessive N nutrition reduces total sugar content and titratable acidity in onion bulbs. Changes in the flavor intensity of onions grown under high N solutions were noted by Randle [33]. In addition, unbalanced N fertilization increases the susceptibility of onion bulbs to disease and pests [34].
Considering the vegetable yield and quality depending on biostimulants and N doses, Di Mola et al. [35] highlighted the positive effect of SWE on baby lettuce quality with a reduced N dose. Rostami et al. [36] reported that HS in interaction with different N inputs improved dry weight and protein content in strawberry fruit. In lettuce, Trichoderma virens strain GV41 increased the yield and uptake of N, under sub-optimal and optimal N doses [37]. In the case of onions, Hafez and Geries [38] noted increasing dry matter content in bulbs after the application of HS under a reduced N dose.
Many studies which investigated the application of biostimulants [25,39,40,41,42] and N fertilization schemes [31,33,38,43,44] in onion production examined onions produced from seedlings. However, there are much fewer results available on the effects of such treatments on directly seeded onions (DS) and those produced from sets (FS).
In order to better understand the impact of agricultural treatments on vegetable yield and bioactive compounds, different mathematical methods, such as chemometrics, can be used. Principal component analysis (PCA) and hierarchical cluster analysis (HCA) are the most useful explorative methods in food and agricultural studies. PCA is based calculating an uncorrelated set of ordered variables so that the first few retain most of the original variables’ variation. PCA results in core and loading plots throughout which dissimilarities among the analyzed data can be revealed. Score plots display patterns or groupings within the data. In contrast, corresponding loading plots refer to the relationships between variables and can be used for identifying the variables that contribute to the positioning of the objects on the score plots. HCA is also a method for dividing a group of objects into clusters while measuring the distance between two samples. The smaller the value measured, the more similar the samples are. The result of this analysis is a tree diagram named a dendrogram, where objects are organized into rows according to their similarities. We used these methods to obtain insight into sample grouping, where PCA additionally revealed to us the variables responsible for the grouping. In this term, there is a wide range of various classification approaches used for the assessment of differences and similarities between investigated samples such as confectionery products [45], sweet corn by-products [46], lettuce [47], beetroot [48], peach pomace [49], and kombucha fermented milk products [50]. Using HCA and PCA, Lu et al. [51] reported the differentiation of onions by type based on antioxidant capacity and total phenol content. Dell’Aversana et al. [52] used PCA to explain the relations between the treatment with SWE and the content of soluble proteins in tomatoes. Additionally, in evaluating peeled tomato quality, Parisi et al. [53] used PCA to explain the relations between reduced N dose and dry matter content.
The main objective of this paper was to investigate the yield and quality of the onions produced from DS and FS under different biostimulants and N fertilization conditions. Additionally, this study aimed chemometric classification analysis, including PCA and HCA. This was conducted in order to detect similarities and dissimilarities among the 32 onion treatments. Onions were produced from two different cultivation methods (DS and FS) in order to reveal the potential grouping of the onion according to treatment effect and main interactions between biostimulants and N fertilization.

2. Materials and Methods

2.1. Plant Material and Growth Conditions

Experiments in the field with directly seeded (DS) onions and those from sets (FS) were carried out in 2021 in the temperate climate of the AP Vojvodina (Serbia). Figure 1 shows the average climatic conditions during the growing season of onions. Both experiments were setup according to the split-plot design with randomized treatments and three replications under black meadow soils, whose chemical properties are shown in Table 1. The main plots involved the following biostimulant treatments: 1. HumiBlack® (B1) by DRN Kimya (Antalya, Turkey), based on humic and fulvic acids 15% and K2O 1.7%; 2. Tifi® (B2) by Italpollina S.P.A. (Rivoli, Italy), based on fungi culture of Trichoderma atroviride 2 × 10⁸ UFC/g; 3. Agasi® (B3) by Agafert S.R.L. (Bari, Italy), based on SWE (Ecklonia radiata, Laminaria spp.)—its composition is 2.64% total N, 1.43% total K2O, and 17.16% organic carbon; 4. Control without biostimulants (clear water). Sub-plots comprised four doses of applied nitrogen fertilizers: 64, 100, 150 (standard dose as control), and 200 kg N/ha.
According to standard practices, basic fertilizer NPK 16:16:16 was applied in the autumn in amounts equivalent to 64 kg N/ha. In the spring, two weeks before DS or FS, pre-planting fertilizer AN (32% N) was applied in amounts equivalent to 0, 36, 86, and 136 kg/ha N.
The biostimulants were applied by drip irrigation two times during the vegetation period, in 14-day intervals, starting three weeks after the DS and FS onions germinated. Biostimulants were used in quantities recommended by the producers: B1, B2, and B3 were applied at 50 L/ha, 3 kg/ha, and 10 L/ha, respectively.
The size of experimental plots was 1.5 × 5 m (7.5 m2) and 1.25 × 5 m (6.25 m2) at DS and FS, respectively. In the DS trial, onions were sown in double rows, with spacing between double rows of 20 cm and spacing between two rows in one double row of 10 cm. FS onions were planted in single rows at a row spacing of 25 cm. The setup dates of DS or FS experiments were on March 27 and 26, respectively.
During the onion growing season, chemical plant protection was performed according to the recommendations of the Agricultural Extension Service, Sombor. Onion harvesting was performed when 80% of the plants had a soft “neck”. Onions were harvested from each plot in order to calculate the fresh biomass yield (comprising bulbs and aboveground biomass) and the total yield of bulbs. Fifteen randomly picked bulbs per plot were used for quality analysis. The collected bulbs were peeled, ground into a pulp, and stored in a freezer at −20 °C prior to analysis.

2.2. Laboratory Procedures

2.2.1. Preparation of Onion Extracts

An amount of 10 g of ground bulbs was weighted into a 50 mL Erlenmeyer flask, and 25 mL of 95% methanol as an extraction agent was added. Erlenmeyer flasks were covered and placed on a laboratory shaker (Unimark 1010, Heidolph instruments GmbH and CoKG, Bielefeld, Germany) for 24 h in the dark. After 24 h, the samples were quantitatively transferred into measuring flasks of 50 mL, which were supplemented with the extraction agent to the nominal volume. The flask’s content was filtered in plastic vials, which were then stored in the refrigerator until the moment of analysis. Methanol extracts were used to measure the content of total phenols (TP), total flavonoids (TF), and antioxidant activities (three tests).

2.2.2. Total Phenolic Content

The TP content of each extract was estimated by the Folin–Ciocalteu method [54] using gallic acid as the standard equivalent. The absorbance of the blue-colored reaction solution was read at 750 nm wavelength (LLG-uniSPEC 2 Spectrophotometer).

2.2.3. Total Flavonoid Content

For the determination of TF content, the colorimetric aluminum chloride assay was used [55]. Absorbance values were observed at 510 nm.

2.2.4. DPPH Assay

A slightly modified DPPH (2,2-diphenyl-1-picrylhydrazyl) free radical scavenging assay was applied to measure the antioxidant activity of methanol onion extracts, mainly described in the research conducted by Brand-Williams et al. [56]. The methanol DPPH solution was freshly prepared to perform the analysis. Methanol was used to adjust the final absorbance of the DPPH reagent to 0.70 (±0.02). A total of 0.1 mL of the liquid of the onion methanol extract was added to 2.9 mL of DPPH reagent. An appropriate volume of solvent (methanol) for the blank sample was added instead of 0.1 mL of the onion extract. After incubation for 60 min at room temperature, the absorbance of each sample was observed at 517 nm using a UV/VIS spectrophotometer (LLG-uniSPEC 2 Spectrophotometer).

2.2.5. FRAP Assay

The potential of the ferric-reducing antioxidant (FRAP) assay was conducted to measure the reducing power of the onion extracts against trivalent ferric ion (Fe3+) [57]. The freshly prepared FRAP reagent contained 10 mM TPTZ (2,4,6-tris (2-pyridil)-s triazine) in 40 mM HCl, 20 mM iron (III)-chloride (FeCl3) aqueous solution and 300 mM acetate buffer, pH 3.6. The working FRAP reagent was prepared just prior to the assay by mixing these three solutions in a 1:1:10 (v/v/v) ratio. Appropriate volumes of onion extracts (0.1 mL) were mixed with 2.9 mL FRAP reagent in glass cuvettes. The absorbance values of the reaction mixture at 593 nm were measured spectrophotometrically (LLG-uniSPEC 2 Spectrophotometer) after incubation for 10 min in the dark, at 37 °C. Freshly prepared aqueous Fe2+ (FeSO4) solution at different concentrations (0–0.23 mM, R2 = 0.999) was taken to construct the standard calibration curve.

2.2.6. ABTS Assay

The antioxidant activity assay with 2,2′-azino-bis-(-3-ethylbenzothiazoline-6-sulfonic acid) diammonium salt) (ABTS) was carried out in accordance with the modified methodology described by Re et al. [58]. The first step to obtain the ABTS reagent involved the reaction of 7 mM aqueous ABTS solution with 2.45 mM aqueous potassium persulfate solution in the dark for 16 h at room temperature. Before the assay, this solution was diluted with acetate buffer (pH 3.6), and the absorbance of the prepared ABTS reagent was adjusted to 0.70 (±0.02). Then, the reaction mixture obtained by adding 2.9 mL of ABTS reagent into 0.1 mL of diluted extracts was incubated for 300 min at room temperature in the dark. After the completion of incubation, absorbance values were recorded at a wavelength of 734 nm. Trolox was used as a reference standard to establish the calibration curve.

2.2.7. Total Solids (Dry Matter)

Total solids were assessed by drying the onion samples at 105 °C until constant weight.

2.2.8. Crude Fibers

Crude fibers were measured according to the Carre–Haynes method [59].

2.2.9. Total Sugars

The total sugar content of onion samples was measured following the Luff–Schoorl method [60].

2.2.10. Titratable Acidity

Titratable acidity measurements were performed by titration using 0.1 M NaOH with phenolphthalein as an indicator [61].

2.2.11. Total Nitrogen and Protein content

Total nitrogen and protein contents were determined according to Kjeldahl method, and protein content was calculated using factor 6.25.

2.3. Chemometric Analysis

Chemometric analysis implied PCA and HCA, as well as K-means clustering analysis. In the first iteration, classification procedures were performed on the data set comprising all 32 treatments from both cultivation methods. The examined onion treatments were analyzed in 13 variables (bioactive compound content, antioxidant activity analysis, and yield). Prior to the analysis, all experimental data were normalized using the min-max normalization method [62]. The min-max normalization method transforms original data using a linear transformation. All experimentally obtained data were scaled in the range of 0.01–0.99. PCA, HCA, and K-means clustering analysis were performed using Statistica v 10.0 software [63].

3. Results and Discussion

3.1. Bioactive Compound Content, Antioxidant Activity Analysis, and Yield

Concentrations of bioactive compounds in onion bulbs and yield are presented in Appendix A Table A1.
Crude fiber in the examined onion samples ranged from 3.6 in treatment 13 (B2, 150 kg N/ha, FS) to 8.741 g/100 g dry matter (DM) in treatment 16 (B2, 200 kg N/ha, DS). In contrast, generally, FS onions had lower crude fiber content than DS onions. The highest total sugar content (80.6 g/100 g DM) was recorded in treatment 11 (B2, 100 kg N/ha, FS), while treatment 27 (C, 100 kg N/ha, FS) had the lowest content at 32.8 g/100 g DM. This could be explained by the ability of Trichoderma spp. to produce indole acetic acid which affects plant metabolism [18]. In the same manner, Vukelić et al. [19] who noted increased content of sugars in tomatoes after Trichoderma spp. treatment. Titratable acidity ranged from 1.7 in treatment 3 (B1, 100 kg N/ha, FS) to 3.6 g/100 g DM in treatment 8 (B1, 200 kg N/ha, DS). These results are in agreement with Wang et al. [64], who reported that titratable acidity increased with increasing N supply. Depending on cultivation methods, FS onions generally had lower titratable acidity values than DS onions. Total nitrogen and protein content were the highest in treatment 16 (B2, 200 kg N/ha, DS), where total nitrogen was 2.3 g/100 g DM and protein content 14.5 g/100 g DM, while the lowest total nitrogen and protein content was in treatment 27 (C, 100 kg N/ha, FS) where total nitrogen content was measured 1.3 g/100 g DM and protein content 8.4 g/100 g DM. The content of polyphenols is often related to their capacity to give flavor, odor, and oxidative stability to foods [65]. In this paper, total phenolics and flavonoid content were the lowest in treatment 13 (B2, 150 kg N/ha, FS), where total phenolics were measured for 392.7 mg/100 g DM and flavonoids for 142.5 mg/100 g DM. The highest total phenolic content was in treatment 26 (C, 64 kg N/ha, DS), where total phenolic content was measured for 1171.8 mg/100 g DM, and the highest flavonoid content was in treatment 16 (B2, 200 kg N/ha, DS) where flavonoid content was measured for 592.6 mg/100 g DM. Generally speaking, FS onions contained lower amounts of total phenolics and flavonoids than DS onions. The effects of cultivation method and genotype feature could explain this. The antioxidants from onions can improve the capacity of the human body to eliminate free radicals and thus avoid their harmful impact on health [66]. DPPH assay analysis revealed that the highest antioxidant potential was measured in treatment 18 (B3, 64 kg N/ha, DS), where DPPH was 0.66 mg/g. The lowest antioxidant potential was recorded in treatment 5 (B1, 150 kg N/ha, FS), and it was 0.24 mg/g. FRAP assay analysis revealed that the highest antioxidant potential was measured in treatment 26 (C, 64 kg N/ha, DS), with 0.64 mg Fe2+/g. In contrast, the lowest antioxidant potential was measured in treatment 5 (B1, 150 kg N/ha, FS), where it was 0.16 mg Fe2+/g. The ABTS values ranged from the highest antioxidant potential in treatment 22 (B3, 150 kg N/ha, DS) to 1.7 mg/g, while the lowest antioxidant potential was measured in treatment 17 (B3, 64 kg N/ha) 0.48 mg/g. Similarly, Di Mola et al. [35] recorded that the application of SWE and N fertilizer enhanced the antioxidant capacity of the baby lettuce. The highest fresh biomass yield and total yield were in treatment 14 (B2, 150 kg N/ha, DS)—fresh biomass yield 74.4 t/ha and total yield 63.9 t/ha. B2 is based on Trichoderma spp., which produces substances that promote plant growth [11]. In addition, 150 kg N/ha is the standard dose of N fertilization in farming practices. The lowest fresh biomass yield was recorded in treatment 32 (C, 200 kg N/ha, DS), and it was 45.2 t/ha, while the lowest total yield was 37.8 t/ha in treatment 17 (B3, 64 kg N/ha, FS) (Appendix A Table A1). Similar results were reported by Gebretsadik et al. [43] decreasing in onion yield under sub- and supra-optimal N nutrition. Additionally, Geisseler et al. [7] highlights that the yield of onions could be depressed at a very high N nutrition dose.

3.2. Classification Analysis

In the first iteration, PCA was carried out on the whole data set, and the 3-component model was obtained, taking into account 84.58% of the total variance (PC1 52.28, PC2 18.08, and PC3 14.22%). These three components had eigenvalues greater than 1: PC1 6.80, PC2 2.35, and PC3 1.85. In Figure 2, the loading plot (a) and score plot (b) for PC1-PC2 are presented. Figure 2 indicates that along the PC1 axis, which covers 52.28% of total variability, the examined onion samples can be distinguished based on the total phenolic content that has a positive coefficient of latent variables (0.9844), as well as based on the ABTS value and crude fiber content that have a negative coefficient of latent variables (−0.9405 and −0.9244). Along the PC1 axis, onion samples from sets (odd treatments) are placed on the positive end of the axis, while directly seeded onion samples (even treatments) are placed towards the negative end of the PC1 axis. Onion samples from sets have lower values of total phenolics and crude fiber content than directly seeded ones. Figure 2 shows that along the PC2 axis, which covers 18.08% of total variability, the investigated onion samples can be distinguished based on the protein content that has a positive coefficient of latent variables (0.6788) and total nitrogen content and total yield that have a negative coefficient of latent variables (−0.6763 and −0.6364). Parisi et al. [53] used PCA analysis and found a correlation between total N and titratable acidity in tomato fruits, and these results are in agreement with this study.
In the first iteration, HCA was carried out on the whole data set, the same as the aforementioned PCA analysis, resulting in a dendrogram in Figure 3. The dendrogram corresponds to a tree diagram where objects are organized into rows by their similarities. In contrast, the vertical axis corresponds to the measure of similarity where objects join a group. The highest linkage distance was around 3. The obtained dendrogram confirmed the separation of samples deriving from 32 treatments into two main clusters, one containing onion samples from sets (odd treatments) and the other having directly seeded onion samples (even treatments). The results of conducted PCA and HCA analysis, including samples deriving from 32 treatments, were confirmed by K-means clustering analysis results. K-means divided the data set into two clusters: in the first one, members are odd treatments (onions from sets), and in the second one, are even treatments (directly seeded).
In order to conduct the detailed analysis of data from both cultivation methods, two data sets were formed, and again the min-max normalization procedure was performed. The first data set consisted of samples of DS onion deriving from 16 treatments, and the second one contained samples of FS onion deriving from 16 treatments. In Figure 4 are presented the results of PCA analysis that included 16 treatments of directly seeded onions. The 4-component model takes into account 84.90% of the total variance with eigenvalues higher than 1: PC1 35.65, PC2 24.57, PC3 16.23, and PC4 8.45%. In Figure 4 are presented the loading plot (a) and score plot (b) for PC1-PC2. Along the PC1 axis, which covers 35.65% of total variability, the examined onion samples that were directly seeded can be distinguished based on the total phenolic content, FRAP, and DPPH that all have a negative coefficient of latent variables (−0.9616, −0.9360 and −0.9284). Along the PC1 axis, onions treated with B1 biostimulant (treatments 14) are placed on the positive end of the axis together with those treated with B2 biostimulant (treatments 57). Onions treated with B1 and B2 biostimulants generally have lower values of total phenolic content, FRAP, and DPPH. Treatment 8 is placed on the negative end of the PC1 axis, while it has slightly higher values of total phenolic content, FRAP, and DPPH. On the negative end of the PC1 axis, onions treated with B3 biostimulant (treatments 911) and the control group of samples (treatments 13, 15, and 16) are placed. These samples treated with B3 biostimulant and the control group generally have higher values of total phenolic content, FRAP, and DPPH. Treatment 12 is being placed on the positive end of the PC1 axis while possibly having slightly lower values of total phenolic content, FRAP, and DPPH. Figure 4 indicates that along the PC2 axis, which covers 24.57% of total variability, the investigated onion samples can be distinguished based on the protein content and total nitrogen content that have a negative coefficient of latent variables (−0.8507) and total solids that has a positive coefficient of latent variables (0.7430).
In the third iteration, PCA analysis that included FS onion samples deriving from 16 treatments was performed (Figure 5). This PCA resulted in a 3-component model taking into account 78.96% of the total variance, and eigenvalues higher than 1 are the following: PC1 33.88, PC2 26.50, and PC3 18.67%. The loading plot (a) and score plot (b) for PC1-PC2n are shown in Figure 5. The obtained onion samples from sets can be distinguished along the PC1 axis based on the FRAP, DPPH, and ABTS all have a positive coefficient of latent variables (0.9606, 0.9433, and 0.9055). Along the PC1 axis, onion samples treated with B1 biostimulant (treatments 14) are positioned on the negative end of the axis along with samples treated with B2 biostimulant (treatments 5, 7, and 8). It can be noticed that those onion samples treated with B1 and B2 biostimulants generally have lower values of FRAP, DPPH, and ABTS. Treatment 6 is placed on the positive end of the PC1 axis, while it has slightly higher values of FRAP, DPPH, and ABTS. Additionally, onion samples 9 and 12, treated with B3 biostimulant, are placed on the negative end of the PC1 axis due to having lower FRAP, DPPH, and ABTS values. In this case, SWE from B3 improved the antioxidant status of FS onions under sub- (64 kg/ha N) and supra-optimal (200 kg/ha N) nitrogen conditions. This is in accordance with Battacharyya et al. [12], who highlight that SWE enhances plants’ performance under abiotic stresses. The other two onion samples treated with B3 biostimulant (treatments 10 and 11) are placed on the positive end of the PC1 while having higher values of FRAP, DPPH, and ABTS. This could be explained by the phytohormones contained in the brown SWE [12]. In addition, El-Gaied et al. [67] noted the impact of phytohormones on the antioxidant status of tomatoes.
Samples being used as a control group (treatments 1316) are positioned on the positive end of the PC1 axis, having the highest FRAP, DPPH, and ABTS values. Similarly, biostimulants based on HS and Trichoderma spp., enhanced the antioxidant activity of onions [68,69]. In the case of SWE, Murtic et al. [70] reported that the application of SWE increased the antioxidant capacity of cherry tomatoes. Observing the PC2 axis, which covers 26.50% of total variability, the investigated onion samples can be distinguished based on protein content that has a negative coefficient of latent variables (−0.7753) and fresh biomass yield and total solids content that have a positive coefficient of latent variables (0.7139 and 0.7125) (Figure 5).
The results of conducted PCA analysis pointed out the features (bioactive compound content, antioxidant activity analysis and yield) in which the studied data set comprising all 32 onion samples differ and which of them the most affect sample grouping. The obtained PCA and HCA results did not reveal any outliers while K-means clustering analysis confirmed obtained results. Generally, based on the PCA and HCA results obtained, it can be seen that in the space of the analyzed variables, the grouping of the onion samples is mainly based on the treatment applied. Similar results have been reported for lettuce and beetroot [47,48].

4. Conclusions

In DS onions, the highest yield of bulbs (63.9 t/ha) was measured in treatment B2, 150 kg N/ha, and the highest content of crude fiber (8.7 g/100 g DM), proteins (14.5 g/100 g DM), and flavonoids (592.6 mg/100 g DM) in treatment B2, 200 kg N/ha. In the case of FS onions, the highest yield of bulbs (52.1 t/ha), as well as the highest antioxidant capacity measured by the ABTS test (0.52), was measured under treatment B2, 150 kg N/ha, and the highest content of flavonoids (312.1 mg/100 g DM) in treatment B3, 64 kg N/ha.
The results of the applied classification methods (PCA, HCA, and K-means clustering) contributed to the grouping and emphasized some differences between examined 32 treatments applied to the onion.
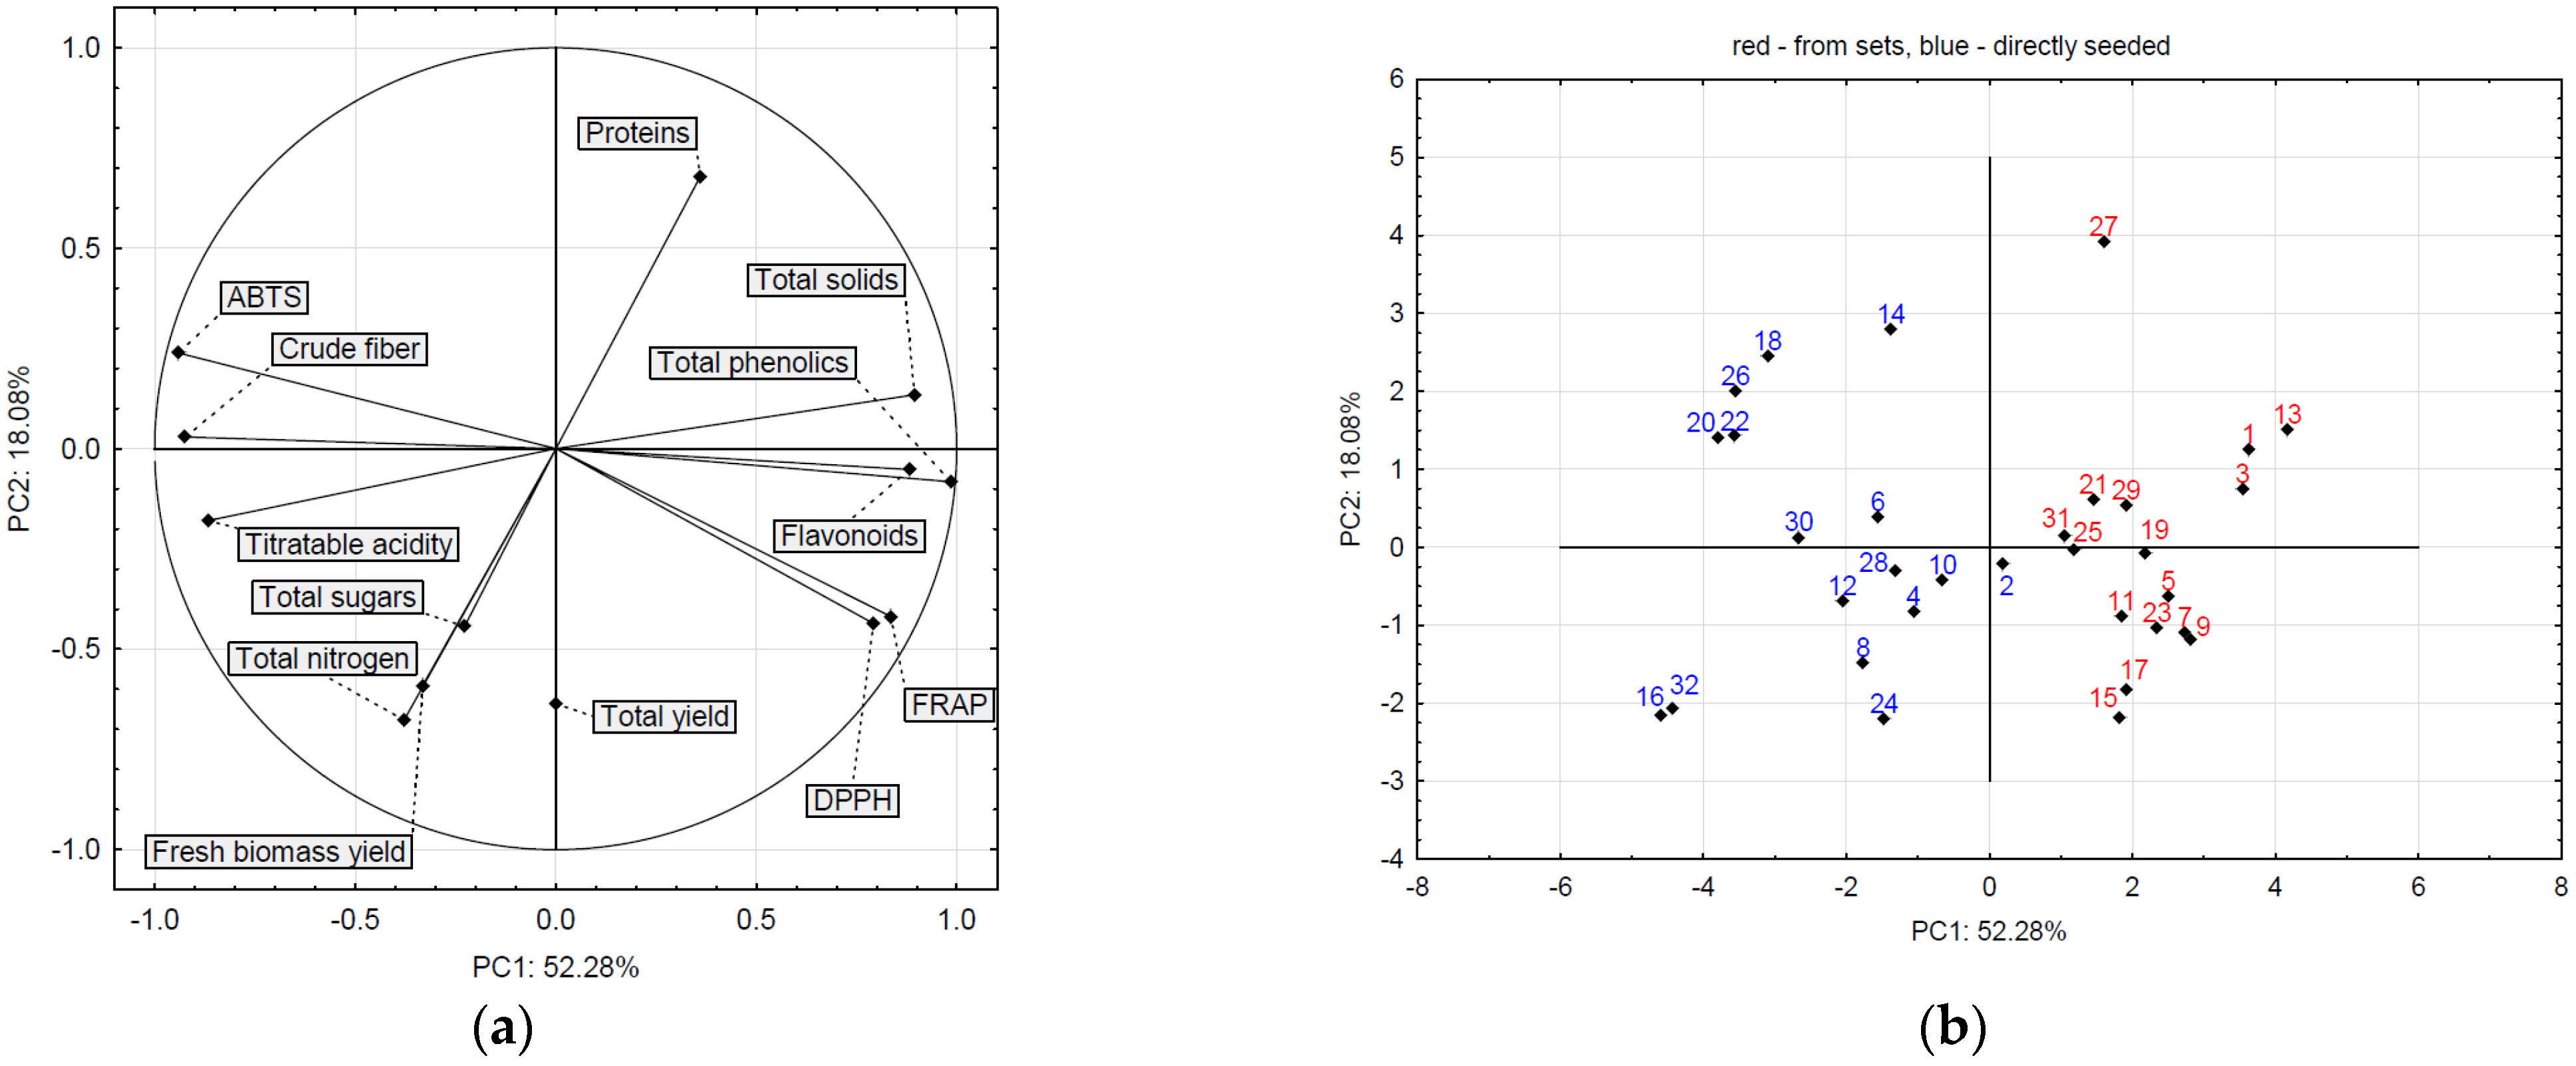
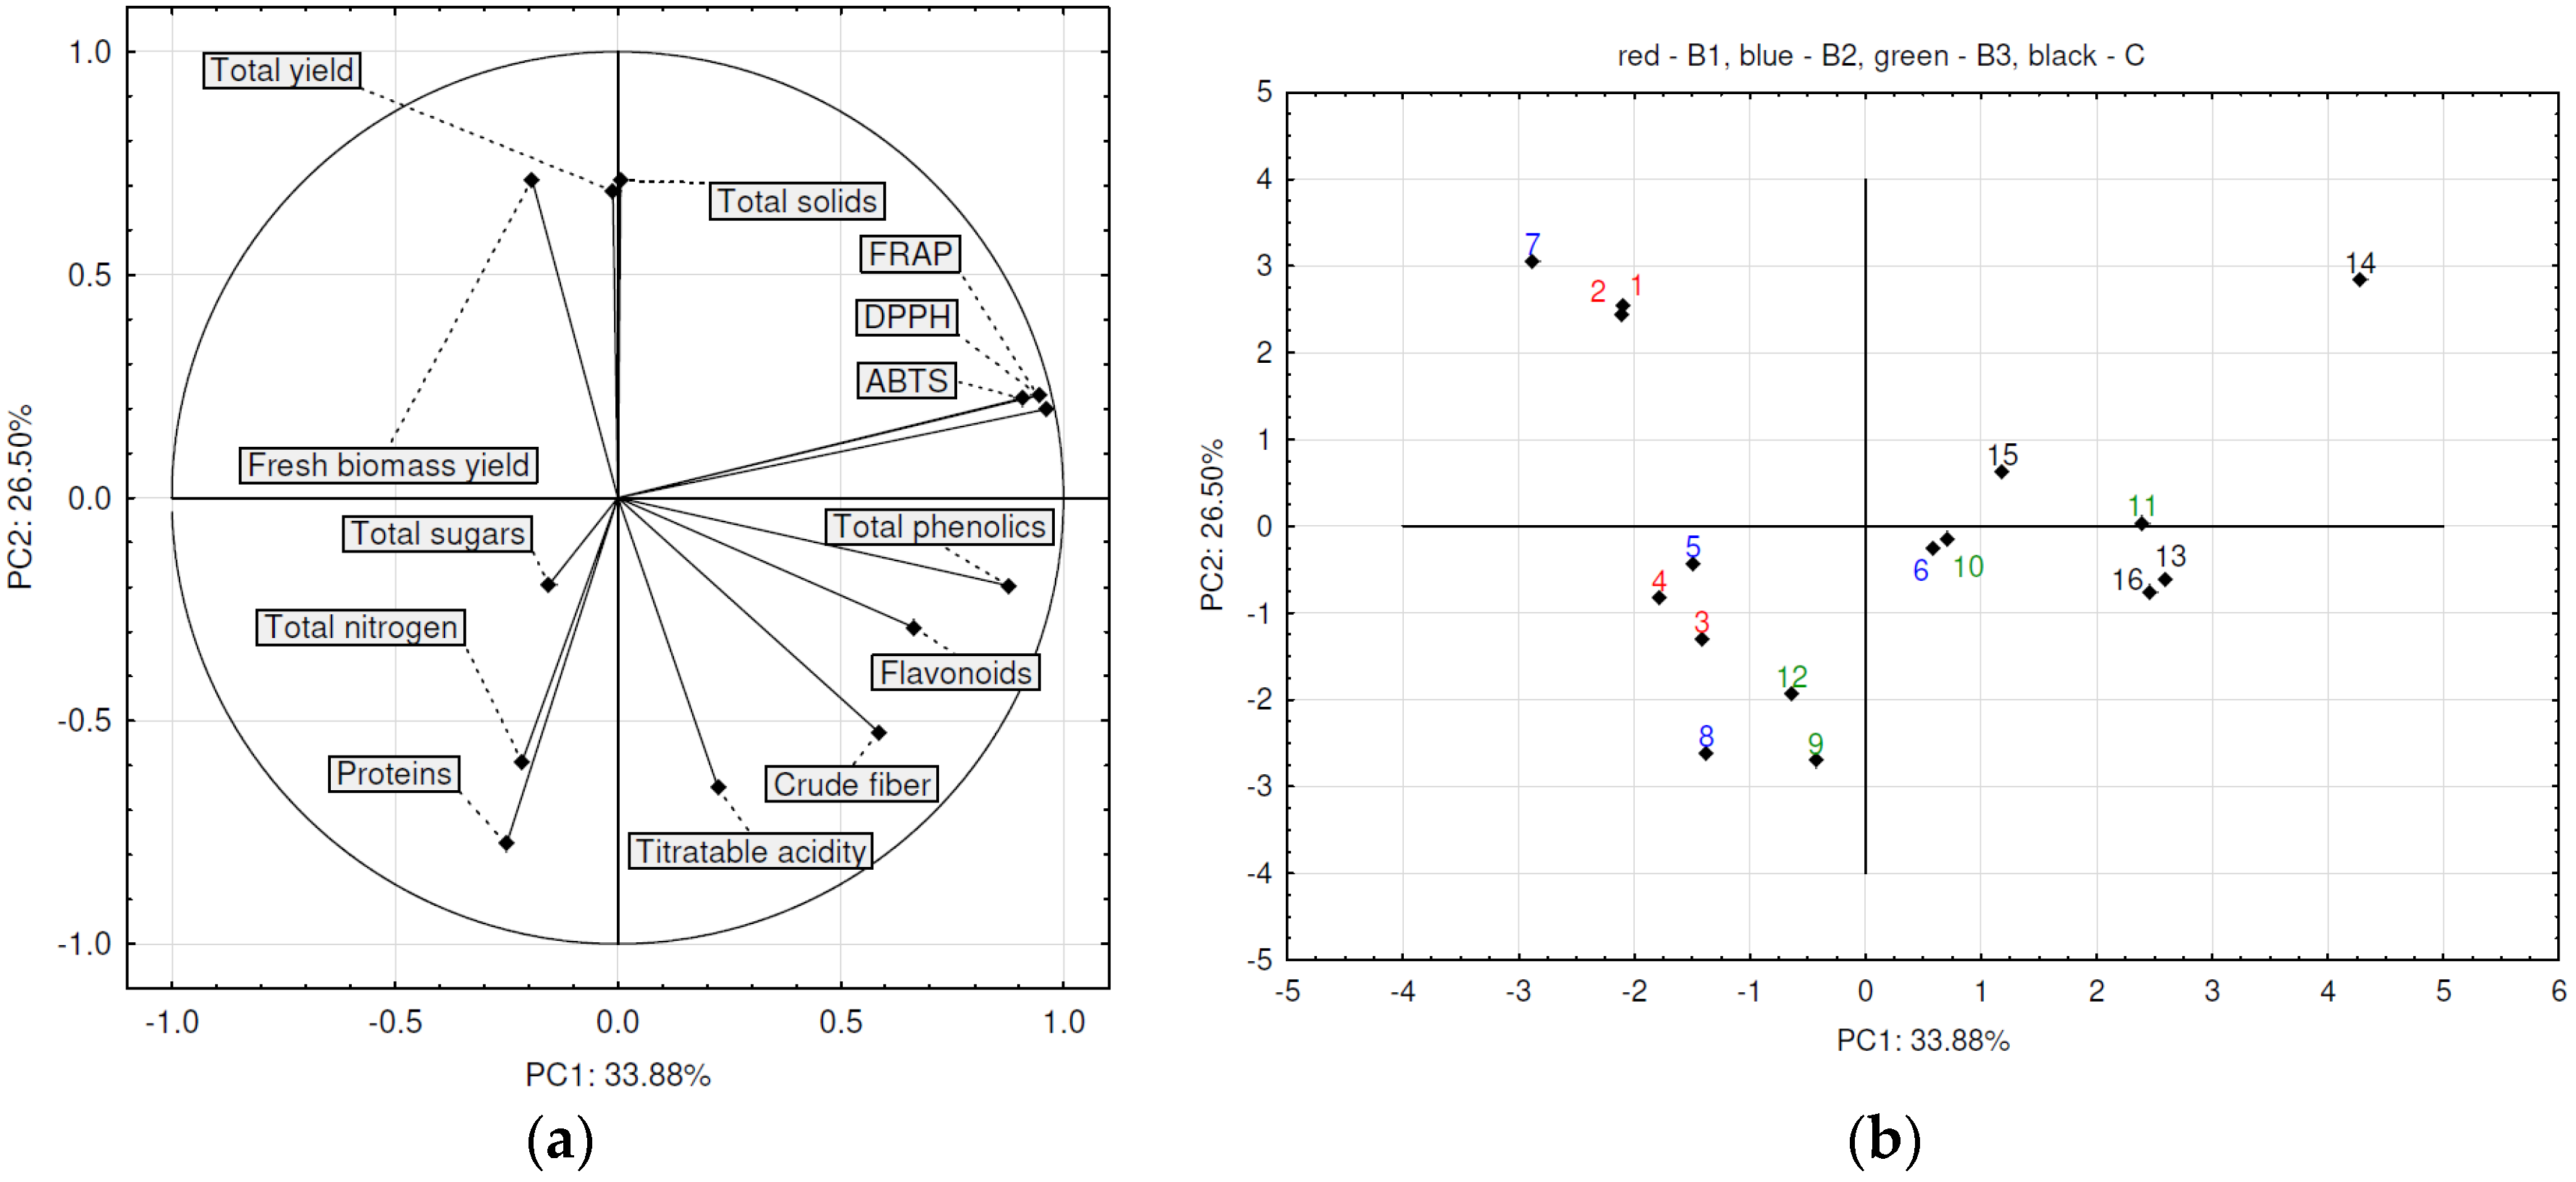
  • In DS onions, treatments 9 (B3, 64 kg N/ha), 10 (B3, 100 kg N/ha), 11 (B3, 150 kg N/ha), 15 (C, 150 kg N/ha), and 16 (C, 200 kg N/ha) positioned on the negative end of the PC1 axis and generally samples from these treatments have higher values of total phenolic content, FRAP, and DPPH.
  • In the negative place of the axis PC2 are positioned as correlated total sugars, titratable acidity, and proteins.
  • FS onions treated with 11 (B3, 150 kg N/ha), 15 (C, 150 kg N/ha), and 16 (C, 200 kg N/ha) were placed on the positive end of the PC1 while having higher values of FRAP, DPPH, and ABTS.
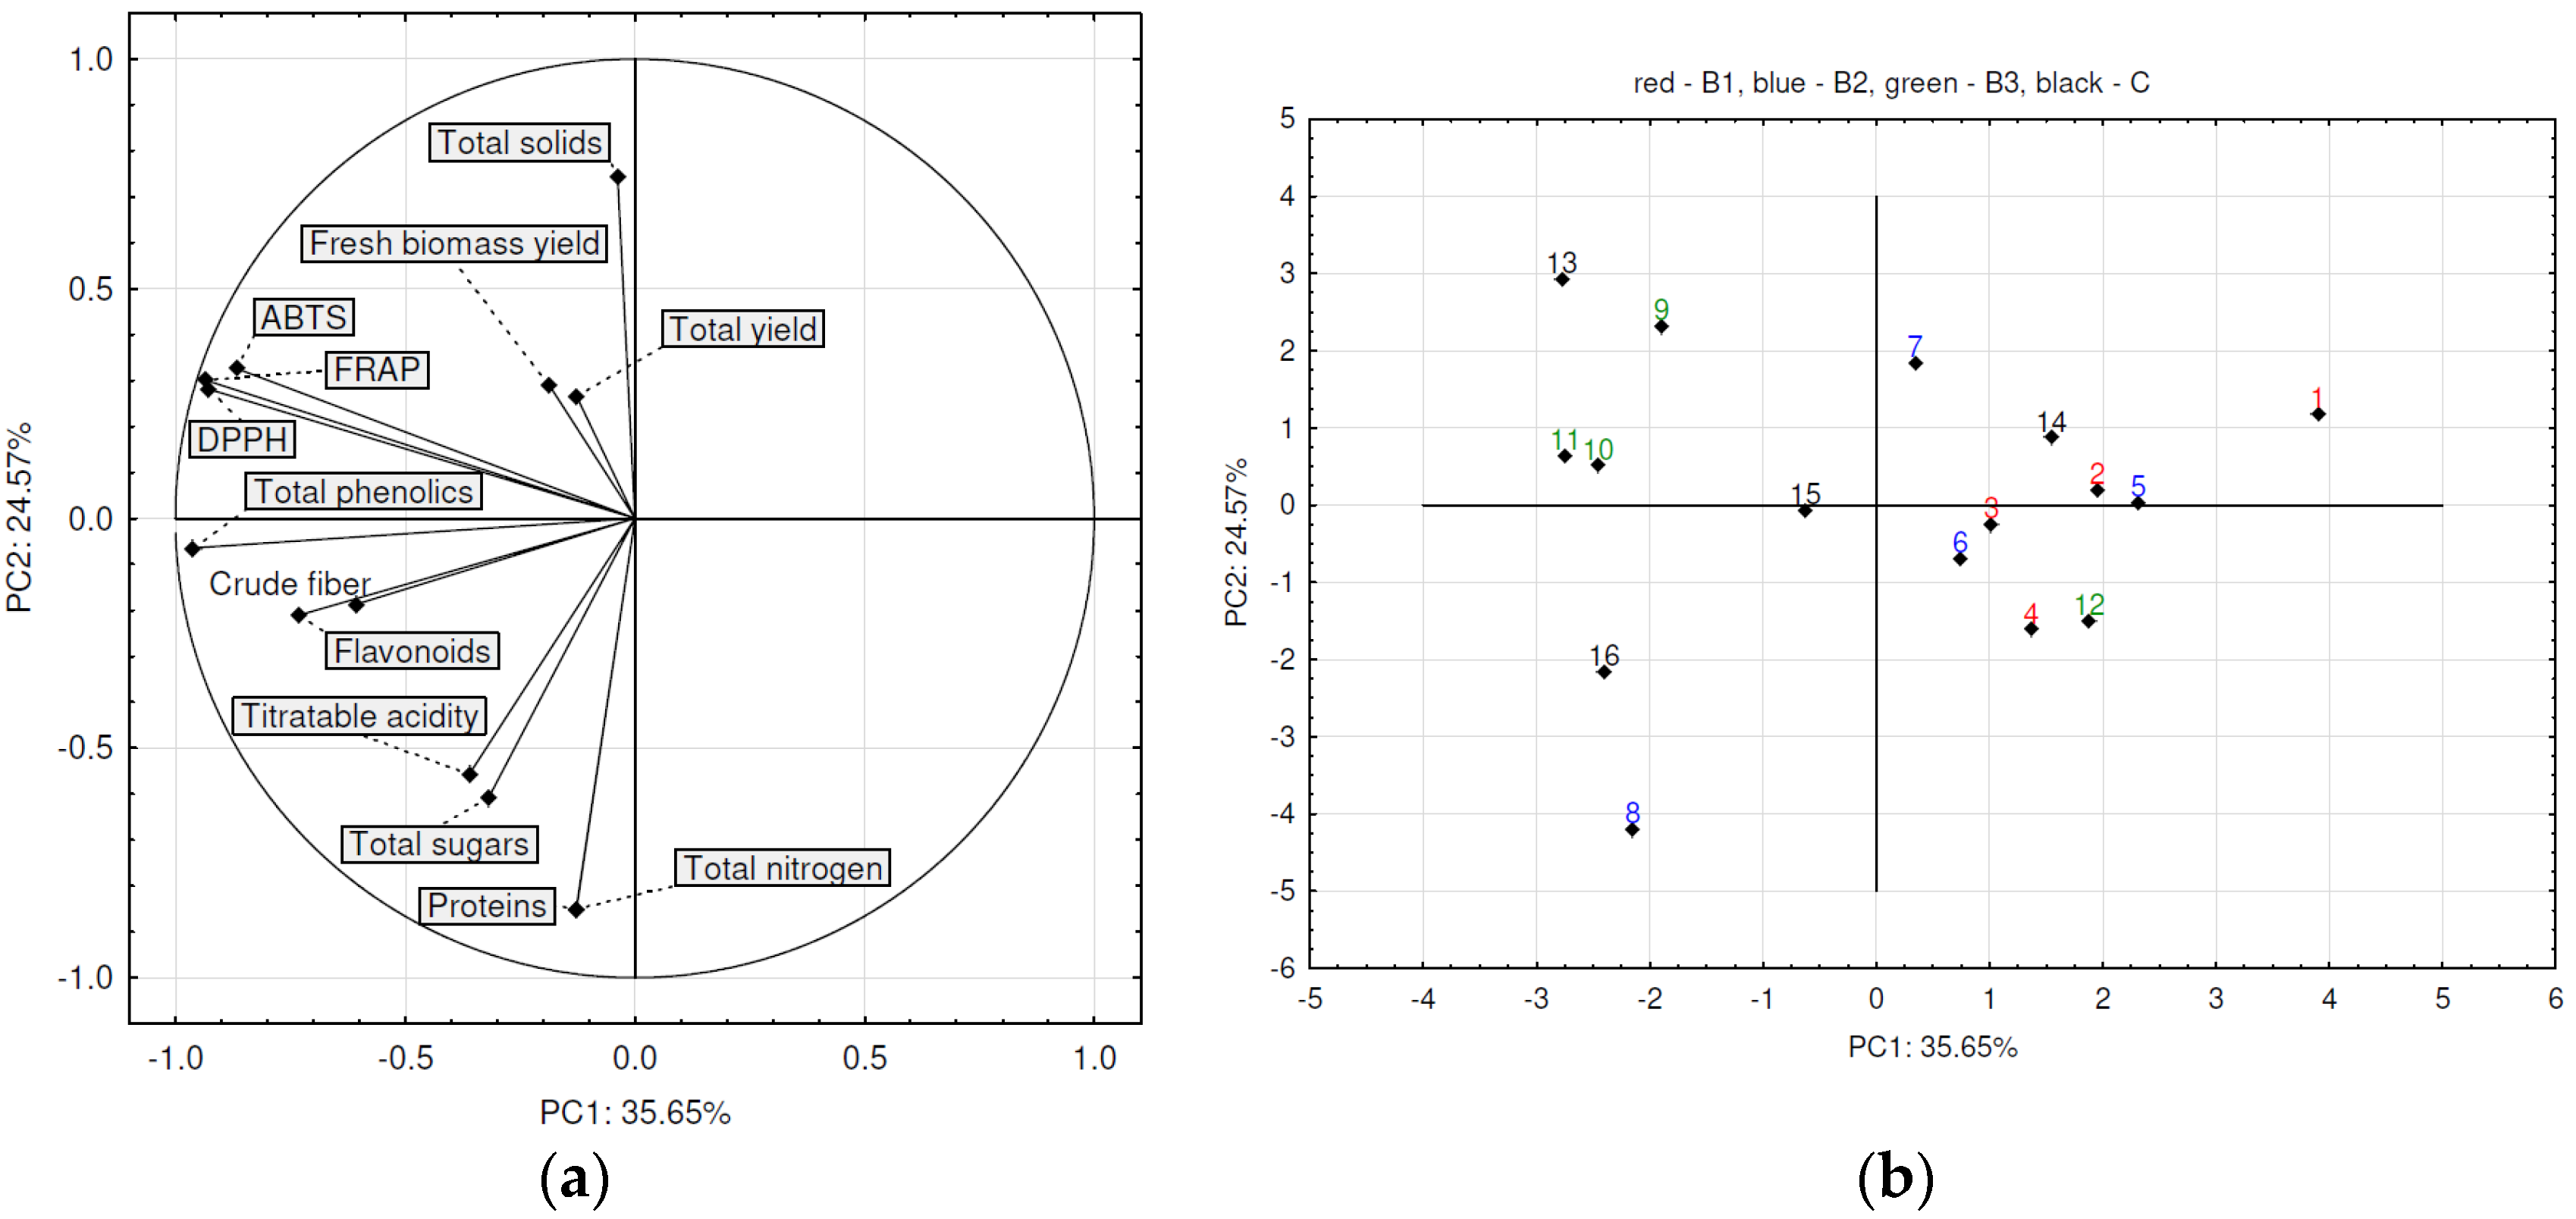
  • In the positive place of the axis PC1 are positioned treatments 13 (C, 64 kg N/ha), 14 (C, 100 kg N/ha), 15 (C, 150 kg N/ha), and 16 (C, 200 kg N/ha), having the highest values of FRAP, DPPH, and ABTS.
Finally, classification analysis grouped onions so that FS onions had lower values of total phenolics, crude fiber content, DPPH, FRAP and ABTS compared to DS onion.

Author Contributions

Conceptualization, methodology, validation, investigation, resources, writing—original draft, writing—review and editing, visualization, and software, Đ.V.; methodology, validation, writing—review and editing, and investigation, I.M. and A.T.H.; software, validation, and formal analysis, M.K.B., software, validation, and visualization, S.K.; validation, visualization, funding and acquisition, T.D.; software, validation, and funding acquisition, S.P.-K.; supervision, methodology, and validation, Ž.I. All authors have read and agreed to the published version of the manuscript.

Funding

This research received no external funding.

Institutional Review Board Statement

Not applicable.

Informed Consent Statement

Not applicable.

Data Availability Statement

Not applicable.

Acknowledgments

The authors express their sincere gratitude to the Agricultural farm Đukić and Extension Service Sombor for technical, and logistical support in conducting experiments. The support of the Ministry of Education, Science and Technological Development of Republic of Serbia (contracts No. 451-03-47/2023-01/200117 and No. 451-03-47/2023-01/200134) is also gratefully acknowledged.

Conflicts of Interest

The authors declare no conflict of interest.

Appendix A

Table A1. Concentration of bioactive compounds, antioxidant activity and yield of onion bulbs (B1-HumiBlack, B2-Tifi, B3-Agasi, C-control, FS-from sets, and DS-directly seeded). The results are expressed as the means of three independent samples.
TreatmentBiostimulantNitrogen Fertilization
(kg/ha)
Cultivation MethodDry Matter
(%)
Crude Fiber
(g/100g DM)
Total Sugars
(g/100g DM)
Titratable Acidity
(g/100 g DM)
Total N
(g/100 g DM)
Proteins
(g/100g DM)
T. Phenolics
(mg/100g DM)
Flavonoids
(mg/100 g DM)
DPPH
(mg/g)
FRAP
(mg Fe2+/g)
ABTS
(mg/g)
Fresh Biomass Yield (t/ha)Total Yield
(t/ha)
1B164FS14.83.959.01.91.59.5458.0158.00.260.170.5668.151.3
2B164DS9.45.549.62.71.610.1781.7240.50.350.241.048.042.8
3B1100FS15.33.768.01.71.410.2454.5158.80.300.180.5764.749.9
4B1100DS9.77.468.72.81.610.3839.0290.00.380.301.145.841.3
5B1150FS14.25.348.72.31.912.2498.9171.90.240.160.5362.648.2
6B1150DS9.17.060.43.21.811.7928.7291.70.400.331.260.454.1
7B1200FS14.04.048.92.11.911.9469.5146.90.290.190.5856.741.4
8B1200DS8.85.669.23.61.811.8943.6262.80.420.331.248.242.8
9B264FS14.94.266.41.91.610.5458.5190.70.300.190.5652.138.7
10B264DS9.16.463.62.01.811.6806.2393.80.340.311.155.746.0
11B2100FS13.43.980.61.91.710.6586.8214.40.380.270.6855.441.4
12B2100DS8.78.155.32.61.811.8977.6388.30.420.351.149.243.0
13B2150FS16.73.647.01.91.59.4392.7142.50.270.160.5263.552.1
14B2150DS9.68.349.32.71.711.2950.2297.00.440.381.274.463.9
15B2200FS13.64.963.22.32.213.9522.6171.70.280.180.5559.247.4
16B2200DS8.18.769.73.52.314.51109.4592.60.500.421.151.445.0
17B364FS13.24.864.32.11.711.1496.6312.10.280.170.4849.037.8
18B364DS9.57.255.32.71.59.41082.4525.90.660.531.455.147.6
19B3100FS14.94.765.62.01.59.5531.0268.90.360.240.6052.141.1
20B3100DS9.18.361.23.21.710.61084.5434.40.640.531.555.247.4
21B3150FS14.04.553.22.01.610.5596.2264.10.430.320.7956.744.9
22B3150DS9.86.866.62.72.012.91083.3419.70.650.551.766.956.2
23B3200FS14.35.042.02.31.811.7546.7168.60.260.210.5553.141.4
24B3200DS9.76.656.12.92.214.3937.9294.00.350.311.052.944.5
25C64FS15.45.170.12.31.610.0535.1227.20.460.370.8050.841.7
26C64DS10.27.357.62.81.49.21171.8401.10.660.641.749.141.3
27C100FS15.35.032.82.11.38.4619.5238.90.540.450.8365.151.7
28C100DS9.67.055.22.81.610.4920.7303.60.430.361.146.738.9
29C150FS14.55.162.01.81.710.8590.4211.10.370.300.7059.949.8
30C150DS9.67.863.23.41.811.41034.1328.00.490.441.355.646.1
31C200FS15.35.549.52.11.912.3587.3231.10.450.360.7858.448.4
32C200DS9.38.067.33.52.213.81137.4399.40.590.481.545.238.0

References

  1. Library, H. Available online: https://helgilibrary.com/indicators/onion-consumption-per-capita/ (accessed on 10 October 2022).
  2. Liguori, L.; Califano, R.; Albanese, D.; Raimo, F.; Crescitelli, A.; Di Matteo, M. Chemical composition and antioxidant properties of five white onion (Allium cepa L.) landraces. J. Food Qual. 2017, 2017, 687361. [Google Scholar] [CrossRef] [Green Version]
  3. Griffiths, G.; Trueman, L.; Crowther, T.; Thomas, B.; Smith, B. Onions—A global benefit to health. Phytother. Res. 2002, 16, 603–615. [Google Scholar] [CrossRef] [PubMed]
  4. Nuutila, A.M.; Puupponen-Pimiä, R.; Aarni, M.; Oksman-Caldentey, K.M. Comparison of antioxidant activities of onion and garlic extracts by inhibition of lipid peroxidation and radical scavenging activity. Food Chem. 2003, 81, 485–493. [Google Scholar] [CrossRef]
  5. Khalili, S.; Saeidi Asl, M.R.; Khavarpour, M.; Vahdat, S.M.; Mohammadi, M. Comparative study on the effect of extraction solvent on total phenol, flavonoid content, antioxidant and antimicrobial properties of red onion (Allium cepa). J. Food. Meas. Charact. 2022, 16, 3578–3588. [Google Scholar] [CrossRef]
  6. Lazić, B.; Marković, V.; Đurovka, M.; Ilin, Ž. Vegetable; University of Novi Sad, Faculty of Agriculture: Novi Sad, Serbia, 1998; pp. 1–472. [Google Scholar]
  7. Geisseler, D.; Ortiz, R.S.; Diaz, J. Nitrogen nutrition and fertilization of onions (Allium cepa L.)—A literature review. Sci. Hortic. 2022, 291, 110591. [Google Scholar] [CrossRef]
  8. Ottaiano, L.; Di Mola, I.; Cozzolino, E.; El-Nakhel, C.; Rouphael, Y.; Mori, M. Biostimulant application under different nitrogen fertilization levels: Assessment of yield, leaf quality, and nitrogen metabolism of tunnel-grown lettuce. Agronomy 2021, 11, 1613. [Google Scholar] [CrossRef]
  9. Rouphael, Y.; Colla, G. Editorial: Biostimulants in agriculture. Front. Plant Sci. 2020, 11, 40. [Google Scholar] [CrossRef] [Green Version]
  10. Canellas, L.P.; Olivares, F.L.; Aguiar, N.O.; Jones, D.L.; Nebbioso, A.; Mazzei, P.; Piccolo, A. Humic and fulvic acids as biostimulants in horticulture. Sci. Hortic. 2015, 196, 15–27. [Google Scholar] [CrossRef]
  11. López-Bucio, J.; Pelagio-Flores, R.; Herrera-Estrella, A. Trichoderma as biostimulant: Exploiting the multilevel properties of a plant beneficial fungus. Sci. Hortic. 2015, 196, 109–123. [Google Scholar] [CrossRef]
  12. Battacharyya, D.; Babgohari, M.Z.; Rathor, P.; Prithiviraj, B. Seaweed extracts as biostimulants in horticulture. Sci. Hortic. 2015, 196, 39–48. [Google Scholar] [CrossRef]
  13. Akladious, S.A.; Mohamed, H.I. Ameliorative effects of calcium nitrate and humic acid on the growth, yield component and biochemical attribute of pepper (Capsicum annuum) plants grown under salt stress. Sci. Hortic. 2018, 236, 244–250. [Google Scholar] [CrossRef]
  14. Schiavon, M.; Pizzeghello, D.; Muscolo, A.; Vaccaro, S.; Francioso, O.; Nardi, S. High molecular size humic substances enhance phenylpropanoid metabolism in maize (Zea mays L.). J. Chem. Ecol. 2010, 36, 662–669. [Google Scholar] [CrossRef] [PubMed]
  15. Lv, D.; Sun, H.; Zhang, M.; Li, C. Fulvic acid fertilizer improves garlic yield and soil nutrient status. Gesunde Pflanz. 2022, 74, 685–693. [Google Scholar] [CrossRef]
  16. Jannin, L.; Arkoun, M.; Etienne, P.; Laîné, P.; Goux, D.; Garnica, M.; Fuentes, M.; Francisco, S.S.; Baigorri, R.; Cruz, F.; et al. Brassica napus growth is promoted by Ascophyllum nodosum (L.) Le Jol. seaweed extract: Microarray analysis and physiological characterization of N, C, and S Metabolisms. J. Plant Growth Regul. 2013, 32, 31–52. [Google Scholar] [CrossRef]
  17. Bayat, H.; Shafie, F.; Aminifard, M.H.; Daghighi, S. Comparative effects of humic and fulvic acids as biostimulants on growth, antioxidant activity and nutrient content of yarrow (Achillea millefolium L.). Sci. Hortic. 2021, 279, 109912. [Google Scholar] [CrossRef]
  18. Ji, S.; Liu, Z.; Liu, B.; Wang, Y.; Wang, J. The effect of Trichoderma biofertilizer on the quality of flowering Chinese cabbage and the soil environment. Sci. Hortic. 2020, 262, 109069. [Google Scholar] [CrossRef]
  19. Vukelić, I.D.; Prokić, L.T.; Racić, G.M.; Pešić, M.B.; Bojović, M.M.; Sierka, E.M.; Kalaji, H.M.; Panković, D.M. Effects of Trichoderma harzianum on photosynthetic characteristics and fruit quality of tomato plants. Int. J. Mol. Sci. 2021, 22, 6961. [Google Scholar] [CrossRef]
  20. Visconti, D.; Fiorentino, N.; Cozzolino, E.; Woo, S.L.; Fagnano, M.; Rouphael, Y. Can Trichoderma-based biostimulants optimize N use efficiency and stimulate growth of leafy vegetables in greenhouse intensive cropping systems? Agronomy 2020, 10, 121. [Google Scholar] [CrossRef] [Green Version]
  21. Rouphael, Y.; De Micco, V.; Arena, C.; Raimondi, G.; Colla, G.; De Pascale, S. Effect of Ecklonia maxima seaweed extract on yield, mineral composition, gas exchange, and leaf anatomy of zucchini squash grown under saline conditions. J. Appl. Phycol. 2017, 29, 459–470. [Google Scholar] [CrossRef]
  22. Kocira, S.; Szparaga, A.; Hara, P.; Treder, K.; Findura, P.; Bartoš, P.; Filip, M. Biochemical and economical effect of application biostimulants containing seaweed extracts and amino acids as an element of agroecological management of bean cultivation. Sci. Rep. 2020, 10, 17759. [Google Scholar] [CrossRef]
  23. Szczepanek, M.; Pobereżny, J.; Wszelaczyńska, E.; Gościnna, K. Effect of biostimulants and storage on discoloration potential of carrot. Agronomy 2020, 10, 1894. [Google Scholar] [CrossRef]
  24. Rasouli, F.; Amini, T.; Asadi, M.; Hassanpouraghdam, M.B.; Aazami, M.A.; Ercisli, S.; Skrovankova, S.; Mlcek, J. Growth and antioxidant responses of lettuce (Lactuca sativa L.) to arbuscular mycorrhiza inoculation and seaweed extract foliar application. Agronomy 2022, 12, 401. [Google Scholar] [CrossRef]
  25. Gemin, L.G.; Mógor, Á.F.; De Oliveira Amatussi, J.; Mógor, G. Microalgae associated to humic acid as a novel biostimulant improving onion growth and yield. Sci. Hortic. 2019, 256, 108560. [Google Scholar] [CrossRef]
  26. Dineshkumar, R.; Subramanian, J.; Arumugam, A.; Rasheeq, A.A.; Sampathkumar, P. Exploring the microalgae biofertilizer effect on onion cultivation by field experiment. Waste Biomass Valorization 2020, 11, 77–87. [Google Scholar] [CrossRef]
  27. Suphachai, A.; Takagaki, M.; Chaireag, S.; Sutevee, S.; Inubushi, K. Effect of amount of nitrogen fertilizer on early growth of leafy vegetables in Thailand. J. Trop. Agric. 2006, 50, 127–132. [Google Scholar] [CrossRef]
  28. Oktem, A.; Oktem, A.G.; Emeklier, H.Y. Effect of nitrogen on yield and some quality parameters of sweet corn. Commun. Soil Sci. Plant Anal. 2010, 41, 832–847. [Google Scholar] [CrossRef]
  29. Wang, H.; Li, J.; Cheng, M.; Zhang, F.; Wang, X.; Fan, J.; Wu, L.; Fang, D.; Zou, H.; Xiang, Y. Optimal drip fertigation management improves yield, quality, water and nitrogen use efficiency of greenhouse cucumber. Sci. Hortic. 2019, 243, 357–366. [Google Scholar] [CrossRef]
  30. Petropoulos, A.S.; Fernandes, Â.; Xyrafis, E.; Polyzos, N.; Antoniadis, V.; Barros, L.; Ferreira, C.F.R.I. The optimization of nitrogen fertilization regulates crop performance and quality of processing tomato (Solanum lycopersicum L. sc. Heinz 3402). Agronomy 2020, 10, 715. [Google Scholar] [CrossRef]
  31. Lee, J.; Moon, J.; Kim, H.; Ha, I.; Lee, S. Reduced nitrogen, phosphorus, and potassium rates for intermediate-day onion in paddy soil with incorporated rice straw plus manure. HortScience 2011, 46, 470–474. [Google Scholar] [CrossRef]
  32. Golubkina, N.; Amalfitano, C.; Sekara, A.; Tallarita, A.; Pokluda, R.; Stoleru, V.; Cuciniello, A.; Agafonov, F.A.; Kalisz, A.; Hamburdă, S.B.; et al. Yield and bulb quality of storage onion cultivars as affected by farming system and nitrogen dose. Sci. Hortic. 2022, 293, 110751. [Google Scholar] [CrossRef]
  33. Randle, M.W. Increasing nitrogen concentration in hydroponic solutions affects onion flavor and bulb quality. J. Amer. Soc. Hort. Sci. 2000, 125, 254–259. [Google Scholar] [CrossRef]
  34. Amare, G. Review on mineral nutrition of onion (Allium cepa L). Open Biotechol. J. 2020, 14, 134–144. [Google Scholar] [CrossRef]
  35. Di Mola, I.; Cozzolino, E.; Ottaiano, L.; Giordano, M.; Rouphael, Y.; Colla, G.; Mori, M. Effect of vegetal- and seaweed extract-based biostimulants on agronomical and leaf quality traits of plastic tunnel- grown baby lettuce under four regimes of nitrogen fertilization. Agronomy 2019, 9, 571. [Google Scholar] [CrossRef] [Green Version]
  36. Rostami, M.; Shokouhian, A.; Mohebodini, M. Effect of humic acid, nitrogen concentrations and application method on the morphological, yield and biochemical characteristics of strawberry ‘Paros’. Int. J. Fruit Sci. 2022, 22, 203–214. [Google Scholar] [CrossRef]
  37. Fiorentino, N.; Ventorino, V.; Woo, S.L.; Pepe, O.; De Rosa, A.; Gioia, L.; Romano, I.; Lombardi, N.; Napolitano, M.; Colla, G.; et al. Trichoderma-based biostimulants modulate rhizosphere microbial populations and improve N uptake efficiency, yield, and nutritional quality of leafy vegetables. Front. Plant Sci. 2018, 9, 743. [Google Scholar] [CrossRef] [PubMed] [Green Version]
  38. Hafez, E.; Geries, L. Effect of nitrogen fertilization and biostimulative compounds on onion productivity. Certec. Agron. Mold. 2018, 1, 75–90. [Google Scholar] [CrossRef] [Green Version]
  39. Shehata, A.S.; Abdelgawad, F.K.; El-Mogy, M.M. Quality and shelf-life of onion bulbs influenced by biostimulants. Int. J. Veg. Sci. 2017, 23, 362–371. [Google Scholar] [CrossRef]
  40. Abbas, M.; Anwar, J.; Zafar-Ul-Hye, M.; Khan, R.I.; Saleem, M.; Rahi, A.A.; Danish, S.; Datta, R. Effect of seaweed extract on productivity and quality attributes of four onion cultivars. Horticulturae 2020, 6, 28. [Google Scholar] [CrossRef]
  41. Metwally, A.R. Arbuscular mycorrhizal fungi and Trichoderma viride cooperative effect on biochemical, mineral content, and protein pattern of onion plants. J. Basic Microbiol. 2020, 60, 712–721. [Google Scholar] [CrossRef]
  42. Gupta, S.; Strik, A.W.; Plačková, L.; Kulkarni, G.M.; Doležal, K.; Van Staden, J. Interactive effects of plant growth-promoting rhizobacteria and a seaweed extract on the growth and physiology of Allium cepa L. (onion). J. Plant Physiol. 2021, 262, 153437. [Google Scholar] [CrossRef]
  43. Gebretsadik, K.; Dechassa, N. Response of onion (Allium cepa L.) to nitrogen fertilizer rates and spacing under rain fed condition at Tahtay Koraro, Ethiopia. Sci. Rep. 2018, 8, 9495. [Google Scholar] [CrossRef] [Green Version]
  44. Bekele, M.; Mohammed, A. Effects of different levels of nitrogen, phosphorus and potassium fertilization on growth and yield of onion (Allium cepa L.) at Jima, South Wester Ethiopia. J. Nat. Sci. Res. 2018, 8, 1–19. [Google Scholar]
  45. Kovačević, S.; Lončarević, I.; Pajin, B.; Fišteš, A.; Vasiljević, I.; Lazović, M.; Mrkajić, D.; Banjac, M.K.; Podunavac-Kuzmanović, S. Toward identification of the risk group of food products: Chemometric assessment of heavy metals content in confectionery products. Food Addit. Contam. A 2019, 36, 1068–1078. [Google Scholar] [CrossRef] [PubMed]
  46. Vulić, J.; Šeregelj, V.; Šaponjac, V.T.; Banjac, M.K.; Kovačević, S.; Šovljanski, O.; Ćetković, G.; Čanadanović-Brunet, J.; Jevrić, L.; Podunavac-Kuzmanović, S. From sweet corn by-products to carotenoid-rich encapsulates for food applications. Processes 2022, 10, 1616. [Google Scholar] [CrossRef]
  47. Jevrić, L.R.; Karadžić, M.Ž.; Podunavac-Kuzmanović, S.O.; Horecki, A.N.T.; Kovačević, S.Z.; Vidović, S.S.; Sumić, Z.M.; Ilin, Ž.M. New guidelines for prediction of antioxidant activity of Lactuca sativa L. varieties based on phytochemicals content and multivariate chemometrics. J. Food Process. Pres. 2018, 42, 13355. [Google Scholar] [CrossRef]
  48. Kovačević, S.Z.; Tepić, A.N.; Jevrić, L.R.; Podunavac-Kuzmanović, S.O.; Vidović, S.S.; Šumić, Z.M.; Ilin, Ž.M. Chemometric guidelines for selection of cultivation conditions influencing the antioxidant potential of beetroot extracts. Comput. Electron. Agr. 2015, 118, 332–339. [Google Scholar] [CrossRef]
  49. Vulić, J.; Bibovski, K.; Šeregelj, V.; Kovačević, S.; Banjac, M.K.; Čanadanović-Brunet, J.; Ćetković, G.; Četojević-Simin, D.; Šaponjac, V.T.; Podunavac-Kuzmanović, S. Chemical and biological properties of peach pomace encapsulates: Chemometric modeling. Processes 2022, 10, 642. [Google Scholar] [CrossRef]
  50. Malbaša, R.; Jevrić, L.; Lončar, E.; Vitas, J.; Podunavac-Kuzmanović, S.; Milanović, S.; Kovačević, S. Chemometric approach to texture profile analysis of kombucha fermented milk products. J. Food Sci. Technol. 2015, 52, 5968–5974. [Google Scholar] [CrossRef] [Green Version]
  51. Lu, X.; Wang, J.; Al-Qadiri, H.M.; Ross, C.F.; Powers, J.R.; Tang, J.; Rasco, B.A. Determination of total phenolic content and antioxidant capacity of onion (Allium cepa) and shallot (Allium oschaninii) using infrared spectroscopy. Food Chem. 2011, 129, 637–644. [Google Scholar] [CrossRef]
  52. Dell’Aversana, E.; Cirillo, V.; Van Oosten, M.J.; Di Stasio, E.; Saiano, K.; Woodrow, P.; Ciarmiello, L.F.; Maggio, A.; Carillo, P. Ascophyllum nodosum based extracts counteract salinity stress in tomato by remodeling leaf nitrogen metabolism. Plants 2021, 10, 1044. [Google Scholar] [CrossRef]
  53. Parisi, M.; Burato, A.; Pentangelo, A.; Ronga, D. Towards the optimal mineral N fertilization for improving peeled tomato quality grown in Southern Italy. Horticulturae 2022, 8, 697. [Google Scholar] [CrossRef]
  54. Singleton, V.L.; Rossi, J.A. Colorimetry of total phenolics with phosphomolybdic-phosphotungstic acid reagents. Am. J. Enol. Vitic. 1965, 16, 144–158. [Google Scholar]
  55. Harborne, J.B. Methods of Plant Analysis; Springer: Dordrecht, The Netherlands, 1984. [Google Scholar] [CrossRef]
  56. Brand-Williams, W.; Cuvelier, M.E.; Berset, C. Use of a free radical method to evaluate antioxidant activity. LWT Food Sci. Technol. 1995, 28, 25–30. [Google Scholar] [CrossRef]
  57. Benzie, I.F.F.; Strain, J.J. The ferric reducing ability of plasma (FRAP) as a measure of “antioxidant power”: The FRAP assay. Anal. Biochem. 1996, 239, 70–76. [Google Scholar] [CrossRef] [PubMed] [Green Version]
  58. Re, R.; Pellegrini, N.; Proteggente, A.; Pannala, A.; Yang, M.; Rice-Evans, C. Antioxidant activity applying an improved ABTS radical cation decolorization assay. Free Radic. Biol. Med. 1999, 26, 1231–1237. [Google Scholar] [CrossRef] [PubMed]
  59. Vračar, L. Handbook for Quality Control of Fresh and Processed Fruit, Vegetables and Mushrooms, and Refreshing Non-Alcoholic Beverages; Faculty of Technology: Novi Sad, Serbia, 2001; pp. 1–226. [Google Scholar]
  60. Rulebook of Methods of Sampling and Carry Out the Chemical and Physical Analysis for Quality Control of Fruit and Vegetables Products (“Official Gazette of SFRY”, no. 29/83). Available online: https://www.tehnologijahrane.com (accessed on 3 February 2022).
  61. ISO 750:1998; Fruit and Vegetable Products—Determination of Titratable Acidity. ISO: Geneva, Switzerland, 1998. Available online: https://www.iso.org/standard/22569.html (accessed on 1 February 2022).
  62. Miller, J.N.; Miller, J.C. Statistics and Chemometrics for Analytical Chemistry, 6th ed.; Pearson: London, UK, 2010; pp. 1–278. [Google Scholar]
  63. StatSoft Inc.: 2300 East 14th Street, Tulsa, OK, USA. Available online: http://www.statsoft.com/ (accessed on 9 September 2022).
  64. Wang, Y.; Huang, S.; Liu, R.; Jin, J. Effects of nitrogen application on flavor compounds of cherry tomato fruits. J. Plant Nutr. Soil Sci. 2007, 170, 461–468. [Google Scholar] [CrossRef]
  65. Mutha, E.R.; Tatiya, U.A.; Surana, J.S. Flavonoids as natural phenolic compounds and their role in therapeutics: An overview. Future J. Pham. Sci. 2021, 7, 25. [Google Scholar] [CrossRef] [PubMed]
  66. Younes, N.A.; Rahman, M.M.; Wardany, A.A.; Dawood, M.F.A.; Mostofa, M.G.; Keya, S.S.; Latef, A.A.H.A.; Tran, L.S.P. Antioxidants and bioactive compounds in licorice root extract potentially contribute to improving growth, bulb quality and yield of onion (Allium cepa). Molecules 2021, 26, 2633. [Google Scholar] [CrossRef]
  67. El-Gaied, L.F.; El-Heba, G.A.A.; El-Sherif, N.A. Effect of growth hormones on some antioxidant parameters and gene expression in tomato. GM Crop. Food 2013, 4, 67–73. [Google Scholar] [CrossRef]
  68. Abd-Alrahman, H.; Marzouk, M.N.; El-Sawy, M.S.; Abou-Hussein, D.S. Improving growth, yield, and quality of onion plants by amino and humic acids under sandy soil conditions. Middle East J. Appl. Sci. 2021, 11, 637–648. [Google Scholar] [CrossRef]
  69. Bayoumi, Y.; Taha, N.; Shalaby, T.; Alshaal, T.; El-Ramady, H. Sulfur promotes biocontrol of purple blotch disease via Trichoderma spp. and enhances the growth, yield and quality of onion. Appl. Soil Ecol. 2019, 134, 15–24. [Google Scholar] [CrossRef]
  70. Murtic, S.; Oljaca, R.; Smajic-Murtic, M.; Vranac, A.; Koleska, I.; Karic, L. Effects of seaweed extract on the growth, yield and quality of cherry tomato under different growth condition. Acta Agric. Slov. 2018, 111, 315–325. [Google Scholar] [CrossRef] [Green Version]
Figure 1. The average monthly temperature (°C, blue line) and monthly precipitation (mm, orange line) during the growing season of onions. The long-term average monthly temperature (black line) and monthly precipitation (green line) are presented as interrupted lines.
Processes 11 00684 g001
Figure 2. PC1-PC2 presentations as a result of PCA of onion samples deriving from 32 treatments (for the legend, see Appendix A): (a) loadings and (b) scores plot.
Processes 11 00684 g002
Figure 3. HCA analysis of all 32 onion samples deriving from 32 treatments (for the legend, see Appendix A).
Processes 11 00684 g003
Figure 4. PC1-PC2 presentations as a result of PCA of onion samples deriving from 16 treatments of directly seeded (DS) onion: (a) loadings and (b) scores plot. Legend: 1, no 2 in appendix A; 2, no 4 in Appendix A; 3, no 6 in Appendix A; 4, no 8 in Appendix A; 5, no 10 in Appendix A; 6, no 12 in Appendix A; 7, no 14 in Appendix A; 8, no 16 in Appendix A; 9, no 18 in Appendix A; 10, no 20 in Appendix A; 11, no 22 in Appendix A; 12, no 24 in Appendix A; 13, no 26 in Appendix A; 14, no 28 in Appendix A; 15, no 30 in Appendix A; 16, no 32 in Appendix A.
Processes 11 00684 g004
Figure 5. PC1-PC2 presentations as a result of PCA of onion samples deriving from 16 treatments of from sets (DS) onion: (a) loadings and (b) scores plot. Legend: 1, no 1 in Appendix A; 2, no 3 in Appendix A; 3, no 5 in Appendix A; 4, no 7 in Appendix A; 5, no 9 in Appendix A; 6, no 11 in Appendix A; 7, no 13 in Appendix A; 8, no 15 in Appendix A; 9, no 17 in Appendix A; 10, no 19 in Appendix A; 11, no 21 in Appendix A; 12, no 23 in Appendix A; 13, no 25 in Appendix A; 14, no 27 in Appendix A; 15, no 29 in Appendix A; 16, no 31 in Appendix A.
Processes 11 00684 g005
Table 1. Agrochemical analysis of the research area soil.
Depth (m)pHCaCO3 (%)Humus (%)N (%)P2O5K2O
KClH2O(mg 100 g−1)
0.37.547.354.892.430.1316.7830.54
Disclaimer/Publisher’s Note: The statements, opinions and data contained in all publications are solely those of the individual author(s) and contributor(s) and not of MDPI and/or the editor(s). MDPI and/or the editor(s) disclaim responsibility for any injury to people or property resulting from any ideas, methods, instructions or products referred to in the content.

