Article

Shear Strength Performance of Electrokinetic Geosynthetics Treated Soft Clay after Water Immersion

1
School of Transportation and Civil Engineering, Nantong University, Nantong 226019, China
2
Key Laboratory of New Technology for Construction of Cities in Mountain Area, Ministry of Education, Chongqing University, Chongqing 400045, China
3
Guangxi Key Laboratory of Disaster Prevention and Engineering Safety, Guangxi University, Nanning 530004, China
4
Jiangsu Zhongnan Construction Industry Group Co., Ltd., Haimen 226199, China
*
Author to whom correspondence should be addressed.
Processes 2023, 11(2), 529; https://doi.org/10.3390/pr11020529
Submission received: 19 January 2023 / Revised: 31 January 2023 / Accepted: 8 February 2023 / Published: 9 February 2023

Abstract

:
The strength aspect of clay soil is a critical concern in practical engineering design. Electroosmosis (EO) has been adopted as a foundation treatment technology in some projects to increase the strength of soft clay. In order to widen the understanding on shear strength performance of EO-treated soil, the behavior of EO-treated soft clay using electrokinetic geosynthetics (EKG) as electrodes under the effect of water immersion was evaluated and compared with that of vacuum preloading (VP) treated soft clay under similar conditions. The main finding was that the EO-treated soil when immersed in water offered more resistance to the change in average water content than VP-treated soil. The average shear strength of EO-treated soil fell by 36.6% during 4 extra days of immersion. When the immersion time was extended to 10 days, the average shear strength fell by 65.4%. In contrast, the immersion time had little influence on the shear strength of VP-treated soil. Hence, if EO-treated soft clays are to be subjected to short-term water immersion, the shear strength of the treated foundations should be reappraised to ensure the safety of the engineering projects.

1. Introduction

As a result of socio-economic development and population growth, the shortage in land resources has increasingly called for immediate attention. Soft clay deposits are widespread, and they present high water content, high fine grain content and low permeability. Various projects, such as those for buildings, roads, slopes and embankments, have to be constructed on soft clay [1,2,3,4,5,6]. Soft clay treatment poses abundant engineering challenges. Ground improvement techniques such as electroosmosis (EO) and vacuum preloading (VP) have been adopted in some projects to increase the shear strength and reduce the post-construction settlement [7,8,9]. Moreover, soft clay after treatment may be subjected to rainfall infiltration, flooding and dew before construction of the building foundation, roadbed, slope, subway, etc. Even in construction projects that have been completed, clay foundations may still be affected by rising groundwater levels [10]. Such severe climatic conditions result in moisture variation, deformation and other failures in the soil. Hence, it is crucial to consider the possible effects of water immersion on the mechanical behavior of treated soils in the design phase. Many studies have focused on the consolidation effect of the EO and VP methods [11,12,13,14]. A number of engineers in the field of foundation design have been concerned by the immersion weakening effect of treated foundations. However, few studies of the water immersion performance of EO-treated soil have been reported.
Foundation failures and large settlements in soft clay are comparatively common [3,15]. Any reduction in shear strength can cause costly damages and also put human life at risk. More importantly, the effect of infiltration reduces the soil shear strength. The common cause of soil strength deterioration is the bond dissolution [16]. For example, a slide in the upstream slope of California’s San Luis Dam in 1981 was caused by a loss of strength in the soaking stiff clay in the foundation beneath the slope [17]. A number of studies have been performed in order to analyze the behavior of expansive soils [18], collapsible loess [19,20,21,22] (An et al. 2018; Xu et al. 2020; Lu et al. 2020; Weng et al. 2021), stiff clays [17], gypsiferous soils [23], and residual soils [24,25] under the action of water immersion or cyclic wetting and drying. Ying et al. [26] found that silty soil volume change and deterioration of strength are strongly correlated to the dissolution of carbonates and changes in the soil particle size distribution. Aziz et al. [27] observed in lime and cement treated soil that there is an alternate decrease and increase in compressive strength after the initial wetting and drying cycle. These studies are relevant to a certain extent but do not fully reflect the performance of EO-treated soft clay that has experienced water immersion. The reinforcement mechanism of EO includes drainage consolidation and electrochemical consolidation, which are influenced by the electrode material, voltage gradient, and drainage measures. Remarkably, electrokinetic geosynthetics (EKG) have exhibited little to no corrosion, good conductivity and drainage properties in engineering applications leading to batch production by a few manufacturers in China [28]. Resulting from the lack of research work reporting on the durability of EO-treated clayey soils subjected to immersion, this paper sought to analyze the behavior of soft clay treated using the EO method with different immersion times. Moreover, the behavior of EO-treated soft clay using electrokinetic geosynthetics (EKG) as electrodes under the effect of water immersion was compared with that of soft clay treated under the same conditions with the common method of vacuum preloading (VP). The reinforcement mechanism of VP is to reduce the pore water pressure and discharge water and gas in the soil through the transmission of vacuum degree. Vacuum degree is an important factor affecting the reinforcement effect of VP [29]. The influence of water immersion on EO- and VP-treated soils may have some differences. A series of laboratory water immersion tests were conducted and studied, and through this, the water immersion aspect of soft clay treated by EO was evaluated by observing the changes in water content and shear strength.
Immersion tests are of great theoretical and practical value to the construction of buildings, slopes, subways and other structures. The results obtained can be applied to the engineering design, construction and stability evaluation of EO-treated soils. Therefore, the current study is of paramount importance because it provides a deeper understanding of the weakening effect of water immersion on EO-treated soft clay, thus ensuring that this technique can be successfully applied in the field.

2. Materials and Test Schemes
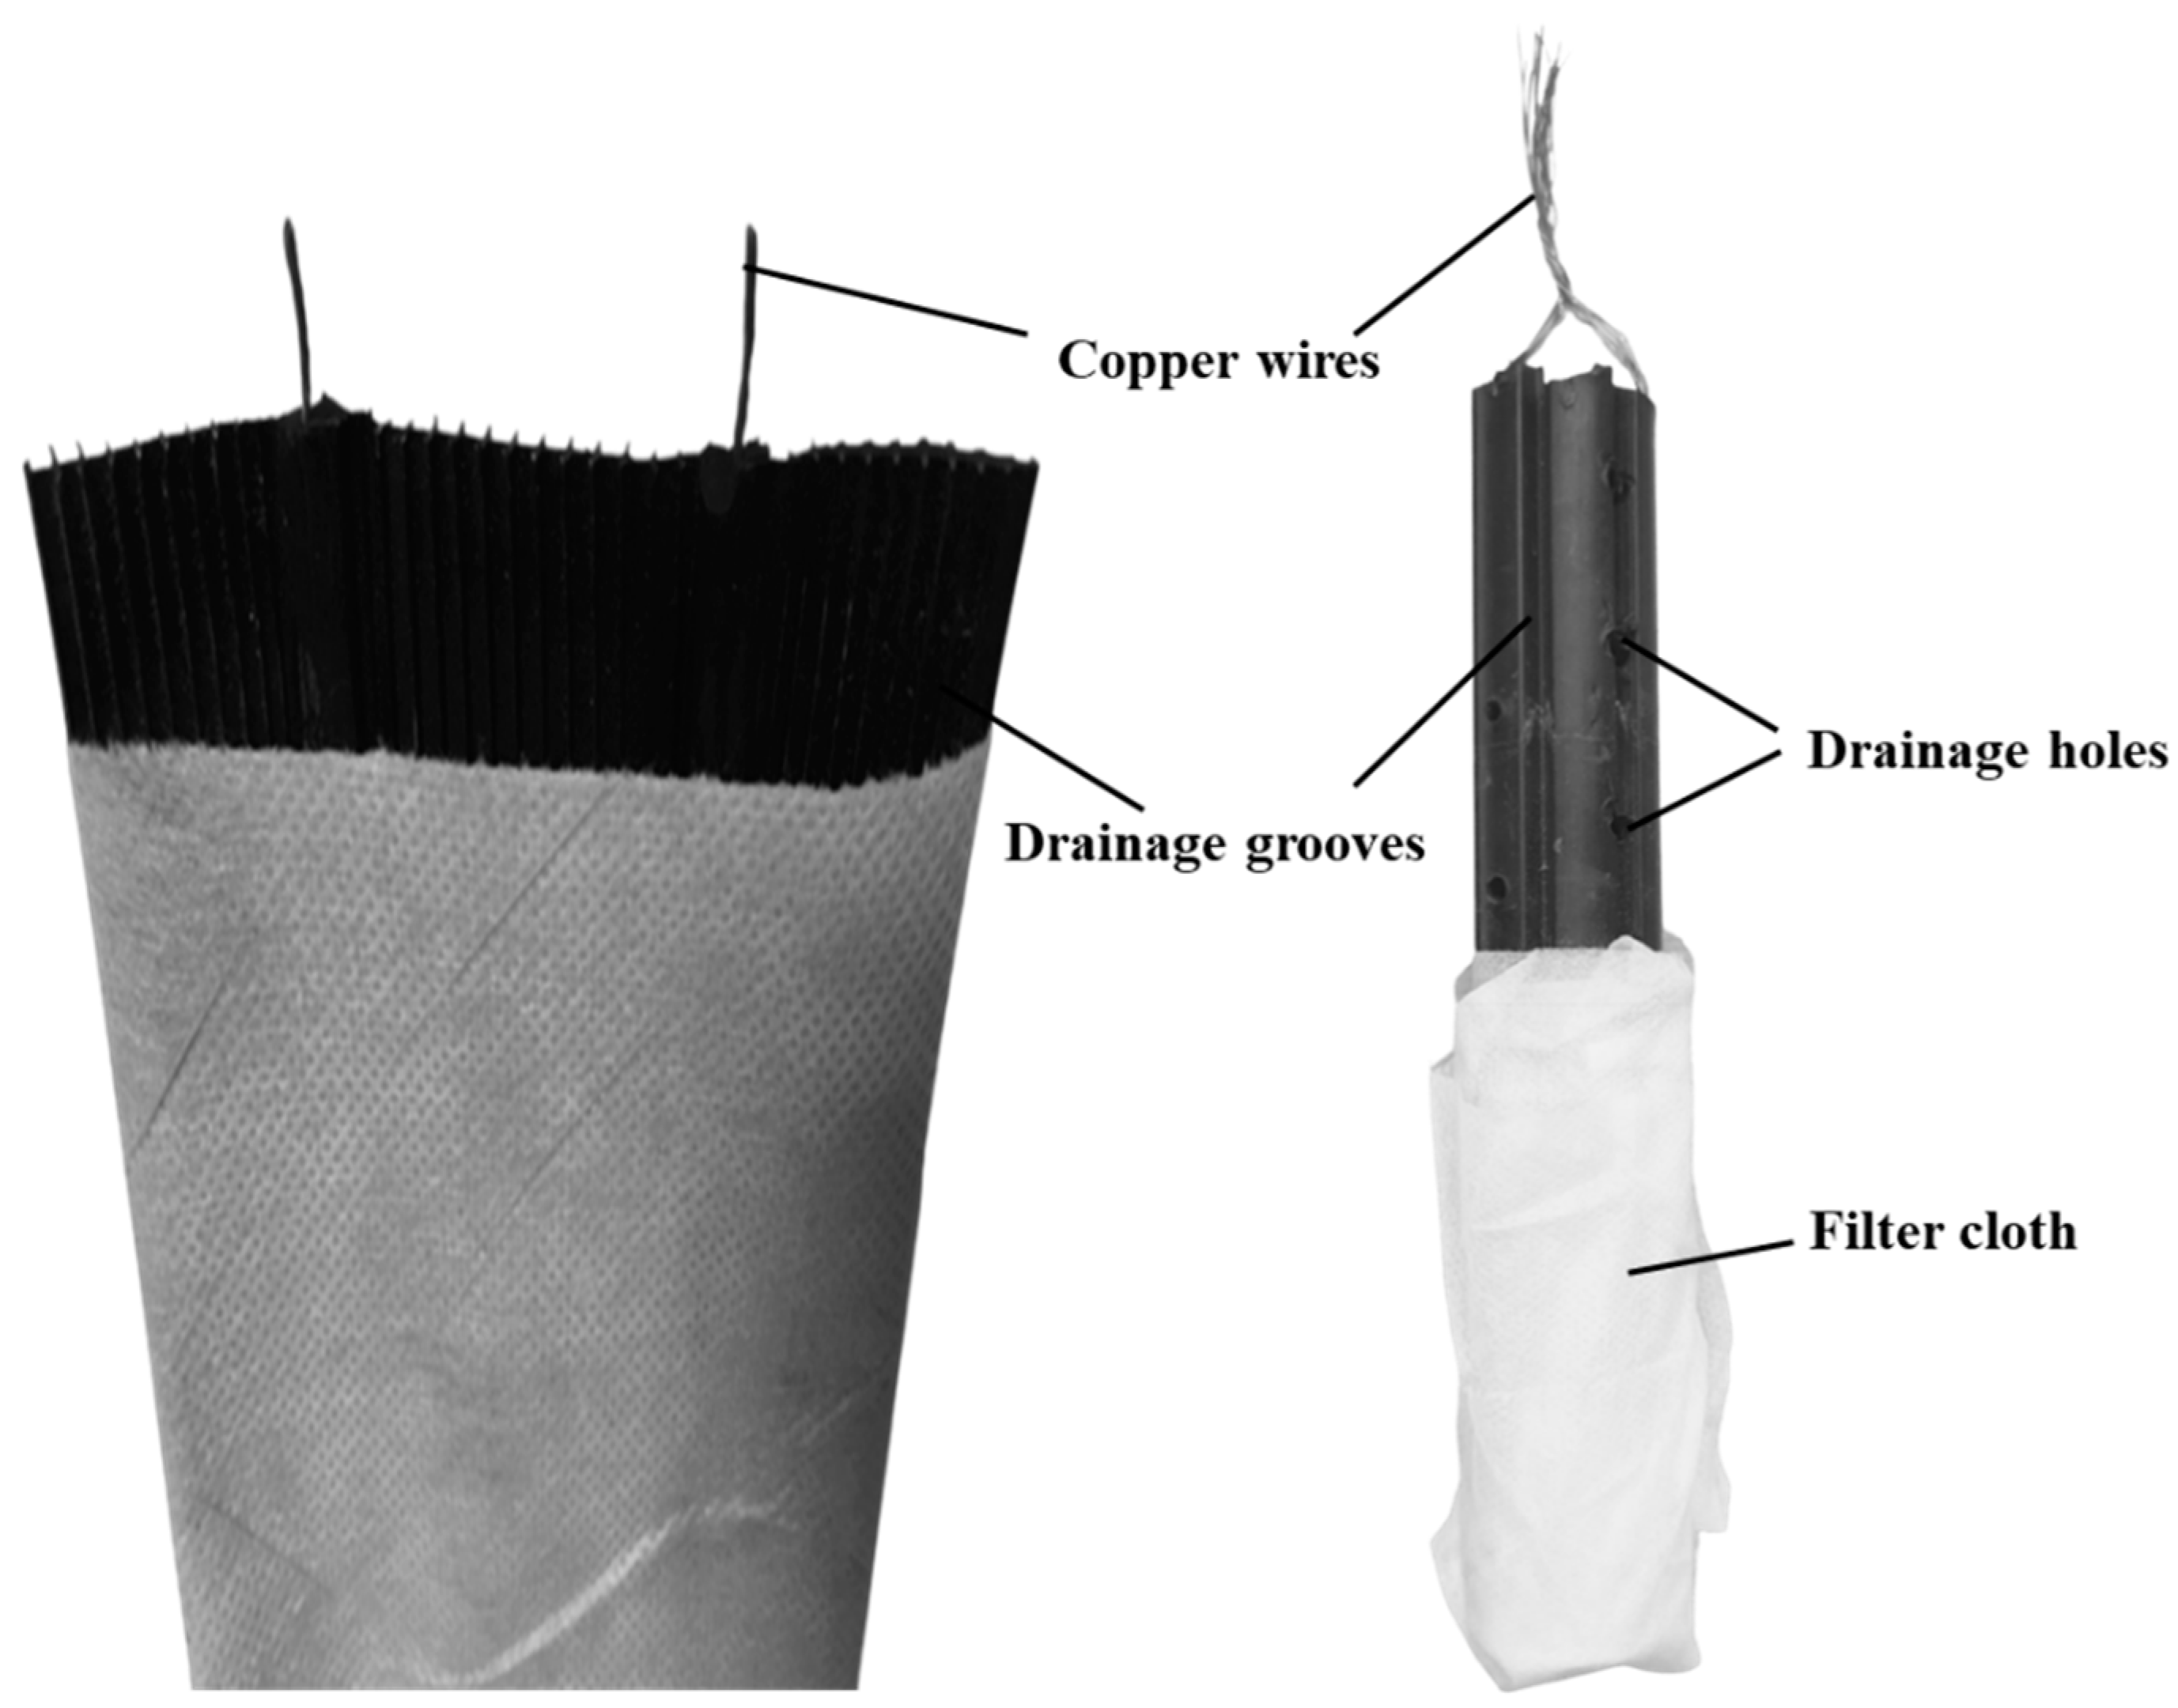
2.1. Materials

The internal dimensions of a cuboid model box were 410 mm, 260 mm, and 180 mm. For the EO tests, tubular and flat EKGs were chosen as the electrodes. These were made of polyethylene, carbon black and graphite with good conductivity and corrosion resistance [30]. The tubular and flat EKGs consisted of copper wires, drainage grooves, and filter cloth, as shown in Figure 1. Furthermore, the tubular EKG had drainage holes drilled all around. The inner and outer diameters of the tubular EKG were 17 mm and 27 mm, respectively. The flat EKG had width and thickness of 96 mm and 6.8 mm, respectively. The direct-current power supply (RXN-605D) had a digital display feature and steady output voltage with maximum output power of 60 V× 5 A. Rubber-insulated copper electric wires were used to connect the electrodes and DC power supply.
For the VP tests, a prefabricated vertical drain (PVD) with the dimensions of 130 mm×100 mm×4 mm was used as the vertical drainage. A sand cushion was used as horizontal drainage and consisted of medium coarse sand with good grading and hard texture. In order to maintain the vacuum degree in the model box above 75 kPa, transparent plastic bags were used to seal the soil samples.
For water drainage, a device consisting of transparent polyurethane tubing, graduated collecting bottle and a water circulating multi-purpose vacuum pump (SHB-IIIA) was used to suck water from the EO and VP soil specimens. The inner and outer diameters of the polyurethane tubing were 5 mm and 8 mm, respectively. The power, maximum vacuum degree and single tap air sucking capacity of the vacuum pump were 180 W, 0.085 MPa and 10 L/min, respectively. A 1000 mL collecting bottle with minimum scale of 1 mL was used for collecting and measuring the discharged water.
The soil powder was obtained from a mining company in Jiangning District, Nanjing, China. The soil powder had to be mixed with distilled water to reach the target moisture content used for the tests. In order to obtain geotechnical parameters of the purchased soil powder, laboratory tests were carried out based on the canonical standard ASTM, as shown in Table 1.
The water content and plasticity index of the soil were 4.2% and 25, respectively. Sieving and hydrometer methods (ASTM D422) were applied to analyze the soil particle size. The percentage of particle grain sizes less than 0.075 mm and 0.005 mm were 85.2% and 36.0%, respectively, as shown in Figure 2. The soil constituents were clay (36%), silt (49.2%) and sand (14.8%). According to the ASTM D2487-06 classification, the soil samples were classified as clay of low plasticity and symbolized by CL.

2.2. Test Schemes

Table 2 shows the test program and conditions. The soil test samples E0–E4 were treated by EO before water immersion, while samples V1–V3 were treated by VP, and the effects of different immersion times on the behavior of soil samples was observed. For each test, 12 kg of clay soil powder with 4.2% water content was measured and mixed with 4.7 kg of distilled water by a mechanical mixer to reach 45% water content. The target water content was determined according to some soft soil foundation treatment projects with an average water content of 40–50% located in Nantong, China. The actual water content of the soil for each test is shown in Table 2. The weight of each sample in the test was 16.4 kg. To remove air bubbles, the soil sample was slowly layered and gently pressed in the test device. The height of the soil sample in each test before treatment was about 120 mm.
E0 was the preliminary test, which used four flat EKGs as anodes and a tubular EKG as cathode. The remaining EO tests all used tubular EKGs as electrodes, whereby four anodes and a cathode were vertically inserted into the soil at the corner and center locations of the model box, respectively, as shown in Figure 3a,c. The voltage was increased in a step-like manner from 10 V to 50 V. Polyurethane tubes were inserted into the bottom of the tubular cathodes to suck out the discharged electroosmotic flow. The EO test samples were exposed to air and subjected to evaporation during the process of treatment to simulate actual on-site engineering.
The arrangement of PVDs in the VP tests is shown in Figure 3b,d. One end of the polyurethane tubing wrapped with filter cloth was placed in the sand cushion to suck out the air and water transferred into the vertical and horizontal drainage. The model box was wrapped with several layers of large transparent plastic bags, and they were airtight enough to maintain the vacuum degree. The VP tests were finished when the drainage rate was lower than 2 mL/h.
The water discharge, electric current and vacuum degree were monitored during the experiments. After treatment, the samples E0, E1 and V1 were not immersed in water for test comparison purposes. For the remaining treated soil samples, water was injected to keep the water levels higher than the soil surface. The immersion durations for E2 and V2, E3 and V3, and E4 were 1 day, 5 days and 10 days, respectively. Finally, the water content and shear strength at different locations in the soil samples with different water immersion durations were tested. The locations for monitoring and testing are shown in Figure 3e,f. The strength tests conforming to ASTM 2001 were conducted using a dynamoelectric vane shear (TT-LVS) manufactured by Zhejiang Geotechnical Instrument. The vane shear apparatus has blades that are 25.4 mm in diameter, 25.4 mm in height, and 0.01 mm in thickness. The values for the shear stress and rotation angle were automatically recorded. The details of the experimental program in the present study are summarized in Figure 4 as a flow chart.

3. Results

3.1. Electric Current, Vacuum Degree and Water Discharge

Figure 5a illustrates the changes in electric current for the EO tests. The voltage was stepped up according to the drainage rate as shown in Figure 5b. As the voltage increased, the current and the drainage rate for each test also increased differently. The electrodes of E1 and E4 were connected in parallel with the DC power. E2 and E3 had a similar arrangement. The water discharge curve of E1 almost coincided with that of E4 under the same experimental conditions, as was the case for E2 with E3. The cumulative water discharge of E0 was lower than that of E1 and E4 but higher than that of E2 and E3. The initial current in the E1 and E4 circuit was a marginally higher than that in the E2 and E3 circuit, which resulted in the initial drainage rate of E1 and E4 being higher than that of E2 and E3. The current of E2 and E3 was two to three times higher than that of the solely electrified E0 under 10 V voltage, but their water discharge curves coincided during this stage.
At different steps of voltage, the current of E0 was consistently lower than 0.1 A and varied widely with other EO tests, especially at the applied voltage over 30 V. This indicated that the electrical conductivity of flat EKG was inferior to that of tubular EKG. However, the drainage rate of flat EKG in E0 was not inferior to that of tubular EKG in E2 and E3 because the former had a larger contact surface area with the soil. From the above analysis, it was observed that the initial current and contact surface area of electrodes to the soil had an important influence on the initial drainage rate.
The drainage rates of E0, E1 and E4 under 10 V voltage increased initially but then dropped; the voltage was stepped up to 20 V when the drainage rate dropped to the initial value. It appeared that the drainage rate notably increased as the voltage was stepped up from 10 V to 20 V. The drainage rate was closely associated with the electric current, soil water content, etc. when the voltage was stepped up in a short time from 10 V to 20 V for these tests. The soil water content was still at a higher level, and the increased electric current in the soil promoted the drainage of more water from the soil. Hence, the drainage rate notably increased. However, the voltages of E2 and E3 were stepped up when the drainage rate was lower than 2 mL/h under each voltage. The longest drainage time of 70 h for E2 and E3 under voltage of 10 V resulted in relatively severe influence of subsequent current and water discharge. The drainage rate changed slightly, while the current appeared to have a sharp increase when the voltage was stepped up. When the voltage was stepped up to over 30 V, the current of E1 and E4, and especially of E2 and E3, increased sharply. However, the drainage rate was not proportional to the increased current. In the later stage, even though strong current was used, no water could be drained out. Hence, the electricity applied in the early stage had an important influence on water discharge and current. To induce a higher current and drainage rate, the voltage needed to be stepped up from 10 V to 20 V when the drainage rate dropped to the initial value. Figure 5b also demonstrates the temporal evolution of water discharge for the VP tests. The vacuum degree of V1 and V3 was kept at 75–76 kPa during the treatment, in which model boxes were wrapped with four layers of large transparent plastic bags. The vacuum degree of V2 was kept at 80–82 kPa, in which model boxes were wrapped with five layers of large transparent plastic bags. The total water discharge volume for the VP method was close to that of E2 and E3. The total water discharge for V1 and V3 was close to but lower than that of V2. The higher vacuum degree helped improve the water discharge. The drainage rate and water discharge volume of V2 were significantly greater than those of all EO tests before 40 h. After that, E0, E1 and E4 had absolute predominance in water discharge.

3.2. Effect of Water Immersion on Soil Water Content

The water used in immersion was sucked out by a vacuum pump once the immersion time had elapsed, and then the water content was immediately measured. The immersion time of each test is shown in Table 2. The detailed water content test locations for each EO test (18 test points) and VP test (21 test points) from top view and side view are shown in Figure 3e,f, respectively. The water content of the soil treated by EO or VP with different water immersion times and different depths and distances from the cathode or PVD in each test is shown in Figure 6. Similarly to the field engineering, the soil water content basically appeared to increase as the depth increased despite the EO or VP method being used. That was because the voltage gradient for EO and the vacuum degree for VP decreased as the depth increased. This rule did not change when the soil experienced water immersion. The average water content of E0 was higher than that of E1, again coinciding with their water discharge during EO treatment. Although the total water discharge of E2 and E3 was the lowest of all tests during the treatment with EO, their average water content after water immersion was close to that of E4 and lower than that ofE0 because of the high current during the late stage resulting in soil temperature rise and serious water evaporation in E2 and E3.
E3 had four more days of immersion than E2. Therefore, during the four extra days of immersion, the average water content of EO-treated soil increased by 0.7%. In addition, E4 had 10 more days of immersion than E1, resulting in a 2.1% increase in water content. During five extra days of immersion comparing with V1 and V3, the average water content increased by 2.1%. This indicates that when immersed in water, the EO-treated soil offered more resistance to the change in average water content than the VP-treated soil. The average water content of the soil treated by VP was higher than that of the soil treated by EO regardless of being immersed or not. The coefficient of variation in water content of VP-treated soil increased as the water immersion time increased, but the influence was insignificant in the EO-treated soil.

3.3. Effect of Water Immersion on Soil Shear Strength

The undrained shear strength of the soil samples was tested immediately after treatment or immersion. The locations of test points are shown in Figure 3e,f. Figure 7 shows the relationship of shear strength with water content of soil subjected to different experiences. It is clear that the dispersion of shear strength and its corresponding water content in the EO tests was remarkably greater than that in the VP tests. The water immersion duration had a significant influence on the shear strength of EO-treated soils compared to that of the VP-treated soils. The shear strength decreased as the water content increased. Shear strength and water content in the EO tests had an almost linear correlation.
The immersion duration for E3 was 4 days more than that of E2, and its average shear strength fell by 36.6%. When immersion was extended to 10 days, the average shear strength fell by 65.4%. E0 and E1 were not subjected to immersion, and the difference between their average water content was 19.6%. The average shear strength of E1 was about four times greater than that of E0. In contrast, the immersion time had little influence on the shear strength of VP-treated soils. The water immersion time for V3 was 5 days more than that of V1, and its average shear strength only fell by 12.7%. The overall shear strength of soil treated by VP was significantly lower than that of soil treated by EO regardless of immersion. Hence, the shear strength of EO-treated soil was more sensitive to water content, meaning a relatively small increase in water content would greatly reduce its shear strength.

4. Discussion

The average water content and shear strength of soils treated by EO were obviously better than those of soils treated by VP, whether they were immersed or not. This was mainly because there were some small water content values distributed in some locations near the anodes with larger shear strength in each EO test. As shown in Table 3, the minimum water content in the EO tests was significantly lower than that in the VP tests, and their maximum values was close. The dispersion of water content and shear strength in the EO tests was remarkably greater than that in the VP tests. The coefficients of variation (COV) were also calculated for comparison. The COV for water content in the EO tests ranged from 13% to 21%, while that in the VP tests ranged from 6% to 7%. The unidirectional electroosmotic flow from the anode to the cathode induced by the electric field using EO technology made the distribution of water content and shear strength extremely uneven. Water immersion could not reduce the uneven distribution of water content and shear strength.
The average water content increased slightly when the EO-treated soils were exposed to water immersion for 10 days, while the shear strength of the soil decreased significantly. Even though there was a decrease in shear strength, it still remained better than that of the VP-treated soils. The reason is closely related with the mechanism of EO, which is primarily due to the exchangeable cations in the diffusion layer and free pore water of soil being attracted to the cathode, which drags the adsorbed water to the cathode simultaneously, and secondarily due to certain electrochemical effects near the anode and cathode. The ion exchange reaction in the soil sample at the anode causes the sodium ions in the electric double layer and the crystal layer to be replaced by high-valent ions [31,32]. This behavior leads to the reduction of the electric double layer thickness, resulting in reduced chances of clay particles adsorbing weakly bound water. However, VP only drained out the free water in the soil. The replacement of the sodium ions inside the crystal layer by high-valent ions increased the spacing and bonding force of the crystal layer, which made it more difficult for water molecules to penetrate the crystal layer. Hence, the EO-treated soils subjected to immersion in water offered more resistance to the change in water content than the VP-treated soils. On the other hand, the reduction in thickness of the clay double layer made the clay particles denser, thus increasing the shear strength. An increase in the shear strength of the soil can also be related to precipitates in the soil [33]. Calcium silicate hydrate, calcium carbonate, iron hydroxide, aluminum hydroxide and magnesium hydroxide precipitates may be generated in the vicinity of electrodes and, depending on the chemical composition of the soil as shown in Table 1, lead to the cementation of soil particles. This process can be described as follows:
Anode reaction:
2H2O − 4e → 4H+ + O2
Fe2O3 + 6H+ → 2Fe3+ + 3H2O
Ca2+ + SiO32+ + H2O → CSH ↓
Cathode reaction:
2H2O + 2e → 2OH + H2
Ca2+ + 2OH → Ca(OH)2
Ca(OH)2 + CO2 → CaCO3 ↓ + H2O
Fe3+ + 3OH → Fe(OH)3
Al3+ + 3OH → Al(OH)3
Mg2+ + 2OH → Mg(OH)2
As shown in Figure 8a, the soil near the electrodes presented blocky structures with high rigidity. However, the uneven distribution of precipitates resulted in cracks developing between the blocky structures. After immersion, well-defined and tiny cracks developed on the surface of the EO- and VP-treated soils, as shown in Figure 8b,c. Moreover, another cause of soil strength deterioration might be the dissolution of the cementation precipitates under the water immersion effect [16] (Zhang et al. 2022). Hence, the shear strength of EO-treated soils decreased significantly after immersion.

5. Conclusions

Electroosmosis technology is usually used to treat soft clay. In this investigation, an experimental program was conducted to evaluate the behavior or effect of EO using EKG as electrodes in treated soft clay under water immersion. From the results, the following conclusions can be drawn.
The soil treated by EO subjected to immersion in water offered more resistance to the change in average water content than the VP-treated soil. The average water content of the EO-treated soil increased by 0.7% during four extra days of immersion and by 2.1% during 10 extra days of immersion. The average water content of VP-treated soil increased by 2.1% during five extra days of immersion. That was because the replacement of sodium ions inside the crystal layer with high-valent ions increased the spacing and bonding force in the crystal layer, which made it difficult for water molecules to penetrate the crystal layer.
Water immersion significantly influenced the shear strength of EO-treated soils. The average shear strength of EO-treated soils fell by 36.6% during four extra days of immersion. When the immersion time was extended to 10 days, the average shear strength fell by 65.4%. In contrast, the immersion time had little influence on the shear strength of VP-treated soils. The average shear strength of VP-treated soils fell by 12.7% during five extra days of immersion. This was due to the uneven distribution of precipitates as a result of cracks between the blocky structures induced by EO treatment. The cracks had more influence on the shear strength. Hence, if EO-treated soft clays are to be subjected to short-term water immersion, the shear strength of the treated foundation should be reappraised to ensure the safety of engineering projects.

Supplementary Materials

The following supporting information can be downloaded at: https://www.mdpi.com/article/10.3390/pr11020529/s1.

Author Contributions

All authors contributed to the study conception and design. Material preparation, data collection and analysis were performed by Z.S., L.L., J.G., G.W. and W.Y. The first draft of the manuscript was written by Z.S., and all authors commented on previous versions of the manuscript. All authors have read and agreed to the published version of the manuscript.

Funding

This work was supported by Project of Key Laboratory of New Technology for Construction of Cities in Mountain Area (LNTCCMA-20230108), Systematic Project of Guangxi Key Laboratory of Disaster Prevention and Engineering Safety (2021ZDK015) and National Natural Science Foundation of China (42207189).

Data Availability Statement

The data presented in this study are available in Supplementary Materials.

Acknowledgments

The authors appreciate Cauderty Munashe Kasu from the Nantong University, China, for linguistic assistance during the preparation of this manuscript.

Conflicts of Interest

The authors declare no conflict of interest.

References

  1. Tant, K.; Craig, W.H. Bearing capacity of circular foundations on soft clay of strength increasing with depth. Soils Found. 1995, 35, 21–35. [Google Scholar] [CrossRef]
  2. Cai, Y.Q.; Guo, L.; Jardine, R.J.; Yang, Z.X.; Wang, J. Stress–strain response of soft clay to traffic loading. Geotechnique 2017, 67, 446–451. [Google Scholar] [CrossRef]
  3. Hinchberger, S.D.; Rowe, R.K. Geosynthetic reinforced embankments on soft clay foundations: Predicting reinforcement strains at failure. Geotext. Geomembr. 2003, 21, 151–175. [Google Scholar] [CrossRef]
  4. Wu, W.; Wang, Z.; Zhang, Y.; El Naggar, M.H.; Wu, T.; Wen, M. Semi-analytical solution for negative skin friction development on deep foundations in coastal reclamation areas. Int. J. Mech. Sci. 2023, 241, 107981. [Google Scholar] [CrossRef]
  5. Cui, C.; Meng, K.; Xu, C.; Wang, B.; Xin, Y. Vertical vibration of a floating pile considering the incomplete bonding effect of the pile-soil interface. Comput. Geotech. 2022, 150, 104894. [Google Scholar] [CrossRef]
  6. Wu, W.; Zhang, Y. A Review of Pile Foundations in Viscoelastic Medium: Dynamic Analysis and Wave Propagation Modeling. Energies 2022, 15, 9432. [Google Scholar] [CrossRef]
  7. Saowapakpiboon, J.; Bergado, D.T.; Youwai, S.; Chai, J.C.; Wanthong, P. Measured and predicted performance of prefabricated vertical drains (PVDs) with and without vacuum preloading. Geotext. Geomembr. 2010, 28, 1–11. [Google Scholar] [CrossRef]
  8. Casagrande, I.L. Electro-osmosis in soils. Geotechnique 1949, 1, 159–177. [Google Scholar] [CrossRef]
  9. Burnotte, F.; Lefebvre, G.; Grondin, G. A case record of electroosmotic consolidation of soft clay with improved soil electrode contact. Can. Geotech. J. 2004, 41, 1038–1053. [Google Scholar] [CrossRef]
  10. Wang, D.Y.; Tang, C.S.; Cui, Y.J.; Shi, B.; Li, J. Effects of wetting–drying cycles on soil strength profile of a silty clay in micro-penetrometer tests. Eng Geol. 2016, 206, 60–70. [Google Scholar] [CrossRef]
  11. Martin, L.; Alizadeh, V.; Meegoda, J. Electro-osmosis treatment techniques and their effect on dewatering of soils, sediments, and sludge: A review. Soils Found. 2019, 59, 407–418. [Google Scholar] [CrossRef]
  12. Xiao, F.; Guo, K.; Zhuang, Y. Study on electroosmotic consolidation of sludge using EKG. Int. J. Geosynth. Groun. 2021, 7, 1–11. [Google Scholar] [CrossRef]
  13. Wu, Y.; Xu, Y.; Zhang, X.; Lu, Y.; Chen, G.; Wang, X.; Song, B. Experimental study on vacuum preloading consolidation of landfill sludge conditioned by Fenton’s reagent under varying filter pore size. Geotext. Geomembr. 2021, 49, 109–121. [Google Scholar] [CrossRef]
  14. Wang, J.; Cai, Y.; Fu, H.; Hu, X.; Cai, Y.; Lin, H. Experimental study on a dredged fill ground improved by a two-stage vacuum preloading method. Soils Found. 2018, 58, 766–775. [Google Scholar] [CrossRef]
  15. Leonards, G.A. Investigation of failures. J. Geotech. Eng. Div. 1982, 108, 187–246. [Google Scholar] [CrossRef]
  16. Zhang, W.; Zou, J.-Q.; Bian, K.; Wu, Y. Thermodynamic-based cross-scale model for structural soil with emphasis on bond dissolution. Can. Geotech. J. 2022, 59, 1–11. [Google Scholar] [CrossRef]
  17. Stark, T.D.; Duncan, J.M. Mechanisms of strength loss in stiff clays. J. Geotech. Eng. 1991, 117, 139–154. [Google Scholar] [CrossRef]
  18. Estabragh, A.R.; Parsaei, B.; Javadi, A.A. Laboratory investigation of the effect of cyclic wetting and drying on the behaviour of an expansive soil. Soils Found. 2015, 55, 304–314. [Google Scholar] [CrossRef]
  19. An, P.; Zhang, A.; Xing, Y.; Zhang, B.; Ni, W.; Ren, W. Experimental study on settling characteristics of thick self-weight collapsible loess in Xinjiang lli region in China using field immersion test. Soils Found. 2018, 58, 1476–1491. [Google Scholar] [CrossRef]
  20. Xu, J.; Li, Y.; Wang, S.; Wang, Q.; Ding, J. Shear strength and mesoscopic character of undisturbed loess with sodium sulfate after dry-wet cycling. Bull. Eng. Geol. Environ. 2020, 79, 1523–1541. [Google Scholar] [CrossRef]
  21. Lu, Q.; Liu, Y.; Peng, J.; Li, L.; Fan, W.; Liu, N.; Sun, K.; Liu, R. Immersion test of loess in ground fissures in Shuanghuaishu, Shaanxi Province, China. Bull. Eng. Geol. Environ. 2020, 79, 2299–2312. [Google Scholar] [CrossRef]
  22. Weng, X.; Zhou, R.; Rao, W.; Wang, D. Research on subway shield tunnel induced by local water immersion of collapsible loess. Nat. Hazards 2021, 108, 1197–1219. [Google Scholar] [CrossRef]
  23. Razouki, S.S.; El-Janabi, O.A. Decrease in the CBR of a gypsiferous soil due to long-term soaking. Q. J. Eng. Geol. Hydrogeol. 1999, 32, 87–89. [Google Scholar] [CrossRef]
  24. Gasmo, J.M.; Rahardjo, H.; Leong, E.C. Infiltration effects on stability of a residual soil slope. Comput Geotech. 2000, 26, 145–165. [Google Scholar] [CrossRef]
  25. Hadi, B.A.; Noor, M.J.M.; Ibrahim, A.; Ismail, B.N.; Ahmad, J.; Zakariah, Z. The effect of soaking on shear strength of a Malaysian granitic residual soil. IOP Conf. Ser. Earth Environ. Sci. 2020, 476, 012049. [Google Scholar] [CrossRef]
  26. Ying, C.; Hu, X.; Zhou, C.; Siddiqua, S.; Makeen, G.M.H.; Wang, Q.; Xu, C. Analysis of chemo-mechanical behavior of silty soil under long-term immersion in saline reservoir water. Bull. Eng. Geol. Environ. 2021, 80, 627–640. [Google Scholar] [CrossRef]
  27. Aziz, M.; Sheikh, F.N.; Qureshi, M.U.; Rasool, A.M.; Irfan, M. Experimental study on endurance performance of lime and cement-treated cohesive soil. KSCE J. Civ. Eng. 2021, 25, 3306–3318. [Google Scholar] [CrossRef]
  28. Sun, Z.; Gao, M.; Yu, X. Vacuum preloading combined with electro-osmotic dewatering of dredger fill using electric vertical drains. Dry. Technol. 2015, 33, 847–853. [Google Scholar]
  29. Chu, J.; Yan, S.W.; Yang, H. Soil improvement by the vacuum preloading method for an oil storage station. Geotechnique 2000, 50, 625–632. [Google Scholar] [CrossRef]
  30. Sun, Z.; Yao, K.; Yang, C.; Liang, M. Improvement of soft clay by vacuum preloading incorporated with electroosmosis using electric vertical drains. Mar. Georesour Geotec. 2021, 39, 1339–1349. [Google Scholar] [CrossRef]
  31. Shang, J.Q.; Lo, K.Y.; Quigley, R.M. Quantitative determination of potential distribution in Stern–Gouy double-layer mode. Can. Geotech. J. 1994, 31, 624–636. [Google Scholar] [CrossRef]
  32. Van Olphen, H. An introduction to clay colloid chemistry. Soil Sci. 1964, 97, 290. [Google Scholar] [CrossRef]
  33. Ou, C.Y.; Chien, S.C.; Wang, Y.G. On the enhancement of electroosmotic soil improvement by the injection of saline solutions. Appl. Clay Sci. 2009, 44, 130–136. [Google Scholar] [CrossRef]
Figure 1. Tubular and flat EKG.
Processes 11 00529 g001
Figure 2. Particle size analysis.
Processes 11 00529 g002
Figure 3. Schematic configuration: (a) structure plan graph of EO test, (b) structure plan graph of VP test, (c) physical picture of EO test, (d) physical picture of VP test, (e) top view and side view of test points in EO test, and (f) top view and side view of test points in VP test (unit mm).
Processes 11 00529 g003aProcesses 11 00529 g003b
Figure 4. Flow chart of the testing program.
Processes 11 00529 g004
Figure 5. (a) Current variation, and (b) water discharge.
Processes 11 00529 g005
Figure 6. Water content of soil treated by EO and VP with different immersion duration: (a) E0, E1 and E4, (b) E2 and E3, (c) V1, V2 and V3.
Processes 11 00529 g006
Figure 7. Relationship of shear strength with water content in each test.
Processes 11 00529 g007
Figure 8. Soil after treatment with or without water immersion. (a) EO-treated soil without water immersion. (b) Surface of EO-treated soil after water immersion. (c) Surface of VP-treated soil after water immersion.
Processes 11 00529 g008
Table 1. Properties of kaolin powder used in the experiments.
SoilSpecific Gravity aWater Content (%) bLiquid Limit (%) cPlastic Limit (%) cChemical Composition (%) d
SiO2Al2O3Fe2O3K2O, Na2OCaO, MgOOthers
Clay soil2.744.2452051241.62.81.319.3
a Pycnometer method (ASTM D854-92), b oven drying method (ASTM D2216-98), c Atterberg limits test (ASTM D4318-10), d energy dispersive spectroscopy (EDS) method.
Table 2. Test schemes.
Treatment MethodTest NumberInitial Soil Water Content (%)Electrode/Drainage BodyVoltage/Vacuum Degree Immersion Duration (d)
ElectroosmosisE048.4Flat EKG 10 V-20 V-30 V-40 V-50 V0
E145.7Tubular EKG0
E2451
E3455
E446.410
Vacuum preloadingV146.2PVD75 kPa0
V243.680 kPa1
V347.675 kPa5
Table 3. Variability of water content.
Test NumberNo. of DataRange (%)Mean (%)COV (%)
E01827–4436.513
E11817–4330.521
E21823–4332.620
E31825–4233.317
E41820–4732.620
V12135–4239.46
V22136–4639.97
V32138–4841.57
Disclaimer/Publisher’s Note: The statements, opinions and data contained in all publications are solely those of the individual author(s) and contributor(s) and not of MDPI and/or the editor(s). MDPI and/or the editor(s) disclaim responsibility for any injury to people or property resulting from any ideas, methods, instructions or products referred to in the content.

