Article

Study on the Equivalence of Metallic-Cerium-Simulated Uranium-Aerosol Generation under Fire

1
College of Nuclear Science and Technology, Naval University of Engineering, Wuhan 430033, China
2
Military Representative Office of the Shenyang Bureau of the Navy in Huludao, Huludao 125000, China
*
Authors to whom correspondence should be addressed.
Processes 2023, 11(2), 419; https://doi.org/10.3390/pr11020419
Submission received: 16 December 2022 / Revised: 13 January 2023 / Accepted: 25 January 2023 / Published: 30 January 2023

Abstract

:
Uranium aerosols are released from uranium-containing materials in high-temperature environments caused by nuclear accidents or other processes. Research on the generation characteristics of uranium aerosols under such conditions is an important part of nuclear-safety analysis. In this experiment, the similarity between metal cerium aerosols and uranium material aerosols was evaluated from the aspects of particle size distribution and source term. Combined with the experiment data, the effect of air flow rate and sampling time is discussed. The calculation result of the air release fraction (ARF) is 6.07 × 10⁻³–4.8 × 10⁻², and the respirable fraction (RF) is 0.810–0.978, respectively, showing that the size distribution of particles and ARF of the cerium aerosol are different from the results of the uranium aerosols in the literature, while the RF is similar to the results obtained by using the uranium–niobium alloy in the literature.

1. Introduction

Uranium is an important material in the nuclear industry and military industry, which is widely used in neutron-shielding materials, depleted-uranium armor-piercing projectiles, and protective materials. During the production, processing, transportation, use, and storage of uranium materials, the leakage of uranium aerosols may occur due to fire accidents, endangering personnel safety. It is of great significance to study the characteristics of uranium aerosol produced by uranium materials under fire conditions for the prevention and disposal of nuclear accidents caused by fire.
In combustion environments caused by fire, uranium aerosols will be released from uranium-containing materials, polluting and harming the surrounding environment and the human body [1,2,3]. Therefore, it is important and necessary to study uranium aerosols in a combustion environment. At present, only few experiment studies have been carried out on uranium aerosols in combustion environments, and most of them focus on the aerosol-release characteristics of radioactive-contaminated materials [4,5,6,7]. There are fewer direct studies of uranium materials, including J. C. Elder and M. C. Tinkle [8,9] who used different fuels to study the aerosol-generation laws of depleted-uranium penetrators, and Carter R. F. and Stewart K [8,9] who studied the release of uranium and plutonium aerosol under combustion conditions. The available reference is very limited.
On the other hand, due to the limitation of uranium materials and the harmfulness of aerosols and other factors, it is impractical to carry out extensive uranium-aerosol-generation experiments [10,11]. Therefore, relevant research at home and abroad is mostly based on surrogate materials for simulation research. The alternative materials involved in the current research include CeO2, Mo, Co, ZrO2, Ag, Eu, etc. [7,12,13]. Among these available materials, cerium and its compounds have better similarities with uranium in physical and chemical properties, and are recognized as an appropriate substitute for uranium and plutonium in related experiments [14,15]. However, there is no relevant research about cerium aerosols in combustion environments [15,16,17]. Therefore, this article uses metallic cerium to conduct aerosol-generation experiments to obtain information including the source term and size distribution of particles of cerium aerosols; explore the influence of sampling time and air flow rate; and evaluate the similarities based on experiment results and literature references.

2. Materials and Methods

2.1. Theoretical Feasibility of Cerium Simulation of Uranium

Actinides are generally radioactive, while lanthanides, which have similar valence-electron arrangements to actinides, are mostly nonradioactive, and the two elements are similar because of the valence-electron arrangement. Select elements from the lanthanide series that can simulate metallic uranium. In the lanthanides, the valence-electron arrangement of the elements satisfies 4f1–14d0–16s2; that is, the arrangement of electrons only differs in the 4f and 5d orbitals of the inner layer, which leads to very similar chemical properties between the elements.
Cerium (Ce) is the 58th element of the periodic table and is the rare-earth element with the highest content in nature. The density of metal cerium is 6.773 g/cm3, the melting point is 799 °C, the boiling point is 3443 °C, the outer electron arrangement is 4f15d16s2, and the common valence is +3 or +4. Its oxide is mainly CeO2 and the density is 7.65 g/cm3. There are four allotropes of cerium under normal pressure, and the detailed data are shown in Table 1. It can be seen from Table 1 that cerium in the delta phase has a body-centered cubic structure with a forward transition temperature of 726 °C, which is similar to the uranium in the γ phase, which belongs to the cubic crystal system and has a stable temperature of 774.8 °C [18]. Additionally, in this experimental device, the combustion temperature is about 850 °C; cerium and uranium are transformed into the δ phase and the γ phase, respectively; and the structural similarity between them is higher. The melting point of cerium is 798 °C, the boiling point is 3424 °C, and the density is 6.77 g/cm3. The melting point of uranium is 1135 °C, the boiling point is 3424 °C, and the density is 19.05 g/cm3. Both uranium and cerium can react with oxygen to form oxides at high temperatures.
Considering the above factors, cerium was selected as an alternative material for uranium in this study. By conducting experiments on cerium-aerosol generation under fire conditions and obtaining data on the particle size distribution, ARF, and RF of cerium aerosol, we evaluate and analyze the simulation effect of cerium as uranium-aerosol-generation characteristics under this experimental condition.

2.2. Instrument and Materials

In this experiment, the aerosol generation and sample collection were realized using an integrated high-temperature experiment apparatus. The schematic diagram is shown in Figure 1 [19]. The apparatus uses preheated kerosene as fuel to simulate the combustion environment. A two-stage cooling system composed of water and coolant was used to cool the combustion chamber and exhaust ducts. The generated aerosol was led out of the system through a ventilation system. In order to monitor the operating status of the system, thermocouples were installed in the combustion chamber and the front section of the exhaust valve and integrated into the temperature-monitoring and -recording system. The collection of aerosol samples was achieved using an impactor sampler with a glass-fiber filter. The mass median diameter (MMD) of the impactor and the range of the collected particle size are shown in Table 2.
The manufacturer and model of the used equipment are shown in Table 3. The chemicals in the experiment and analysis are shown in Table 4. In the post-processing process, disposable plastic products were used to contain and process the liquid sample, including 50 mL centrifuge tubes, 10 mL centrifuge tubes, and needle filters. Gun pipettes and volumetric flasks were used for standard solution configuration. The aerosol samples were dissolved with 10% dilute nitric acid.

2.3. Analysis Method

We cut 3/4 of the glass-fiber filter into small pieces and digested with 20 mL of dilute nitric acid for one day to obtain cerium. We filtered about 10 mL to measure the cerium ion concentration use a disposable syringe filter. We selected appropriate parts from the remaining 1/4 aerosol samples and carry out transmission electron microscopy (TEM), X-ray diffraction analysis (XRD) and X-ray photoelectron spectroscopy (XPS) tests together with the weighed combustion products to obtain information on the microscopic morphology of the particles, the phase composition of the particles and products, and the particle distribution on the glass-fiber filter.
The 413.3 nm characteristic spectral line of cerium was selected as the ICP-AES working wavelength to obtain the mass–particle size distribution data of cerium aerosols [20].
The relative atomic mass was used to convert the combustion product mass to the cerium mass according to the element composition information of the combustion product, and the change in the cerium sample mass was used to calculate the air release fraction (ARF) of the cerium aerosol using Formula (1). In order to detect the cerium element that may be contained in the sampling-system exhaust gas, two dilute-nitric-acid glass wash bottles as a collection medium were settled at the end of the sampling system, and the cerium element was measured with ICP-AES. Combined with the above data, the respirable fraction (RF) of cerium aerosol was calculated according to Formula (2).
A R F = m C e m C e m C e
R F = m C e t o t a l m C e 0 m C e t o t a l
in which:
m C e : initial mass of cerium;
m C e : cerium mass in the combustion products;
m C e t o t a l : total mass of cerium in the sampler;
m C e 0 : cerium mass in the 0-stage of sampler.

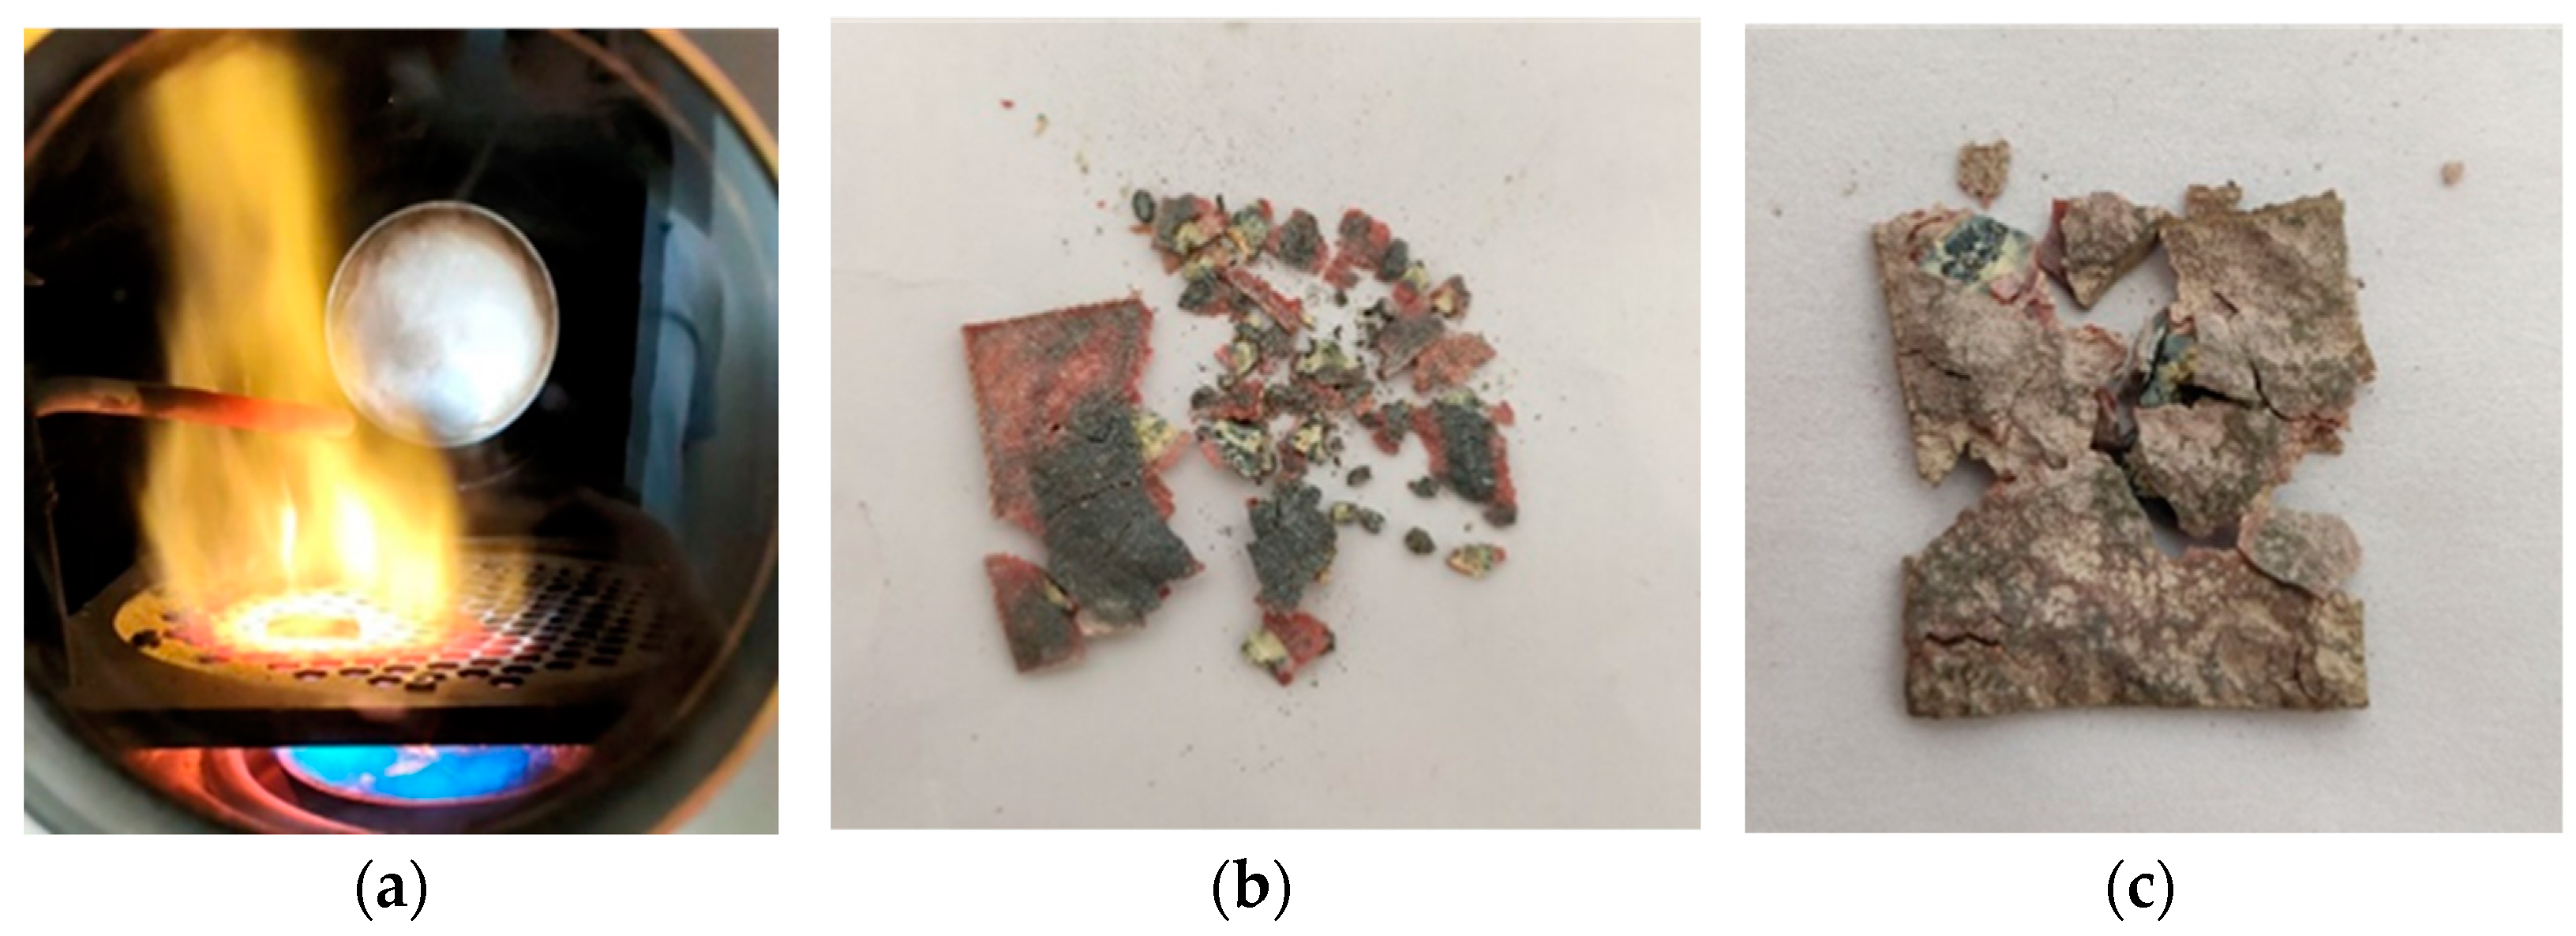
2.4. Fire Experiment of Metal Cerium Aerosol Formation

2.4.1. Experimental Conditions

The experimental conditions for each experiment are shown in Table 5. In these experiments, the air flow rate and sampling time during the experiment were changed, respectively, and the particle size distribution and related data of the aerosol were measured. The influence of temperature was not studied, mainly because the temperature fluctuated between 750 °C and 850 °C in the case of stable combustion during the experiment, so it was of little significance to conduct temperature-influence experiments. In Experiment 2, the particles in the sampled exhaust gas were collected by adding a two-stage glass wash bottle at the end of the sampling line to analyze the data of the cerium aerosol not collected by the sampler.

2.4.2. Experimental Phenomena

The mass of the cerium sample used in the experiment was 4.2 g, and the size was 25 × 25 × 1 mm. The cerium sample was placed on a stainless-steel disc with a grid. After ignition and combustion, the combustion of the cerium sample is shown in Figure 2a. The surface of the cerium metal gradually darkened in the high-temperature flame. This shows that the surface of cerium metal reacts with oxygen at high temperature to form a black oxide. It could be observed that the metal cerium sample underwent slow oxidation due to oxidation under high-temperature conditions. During the experiment, the combustion temperature experienced a process of first rising and then falling, which should be caused by the exothermic oxidation of the cerium metal which caused the temperature to rise, and the temperature dropped after the oxidation. The combustion products are shown in Figure 2b,c. It can be seen that the combustion products of cerium were complete, and the substances such as carbon black adsorbed on the surface were not obvious.
The filter paper after cerium-aerosol sampling is shown in Figure 3, from right to left and top to bottom, with stages 0–7 and F, respectively. The first line is 0, 1, and 2 stages from right to left. The second line is 3, 4, and 5 stages from right to left. The third line is 6, 7, and F stage from right to left.

2.4.3. Experimental Method

The measurement of cerium aerosol first used ICP-MS to measure the characteristic emission spectrum of cerium at 413.3 nm.

3. Results

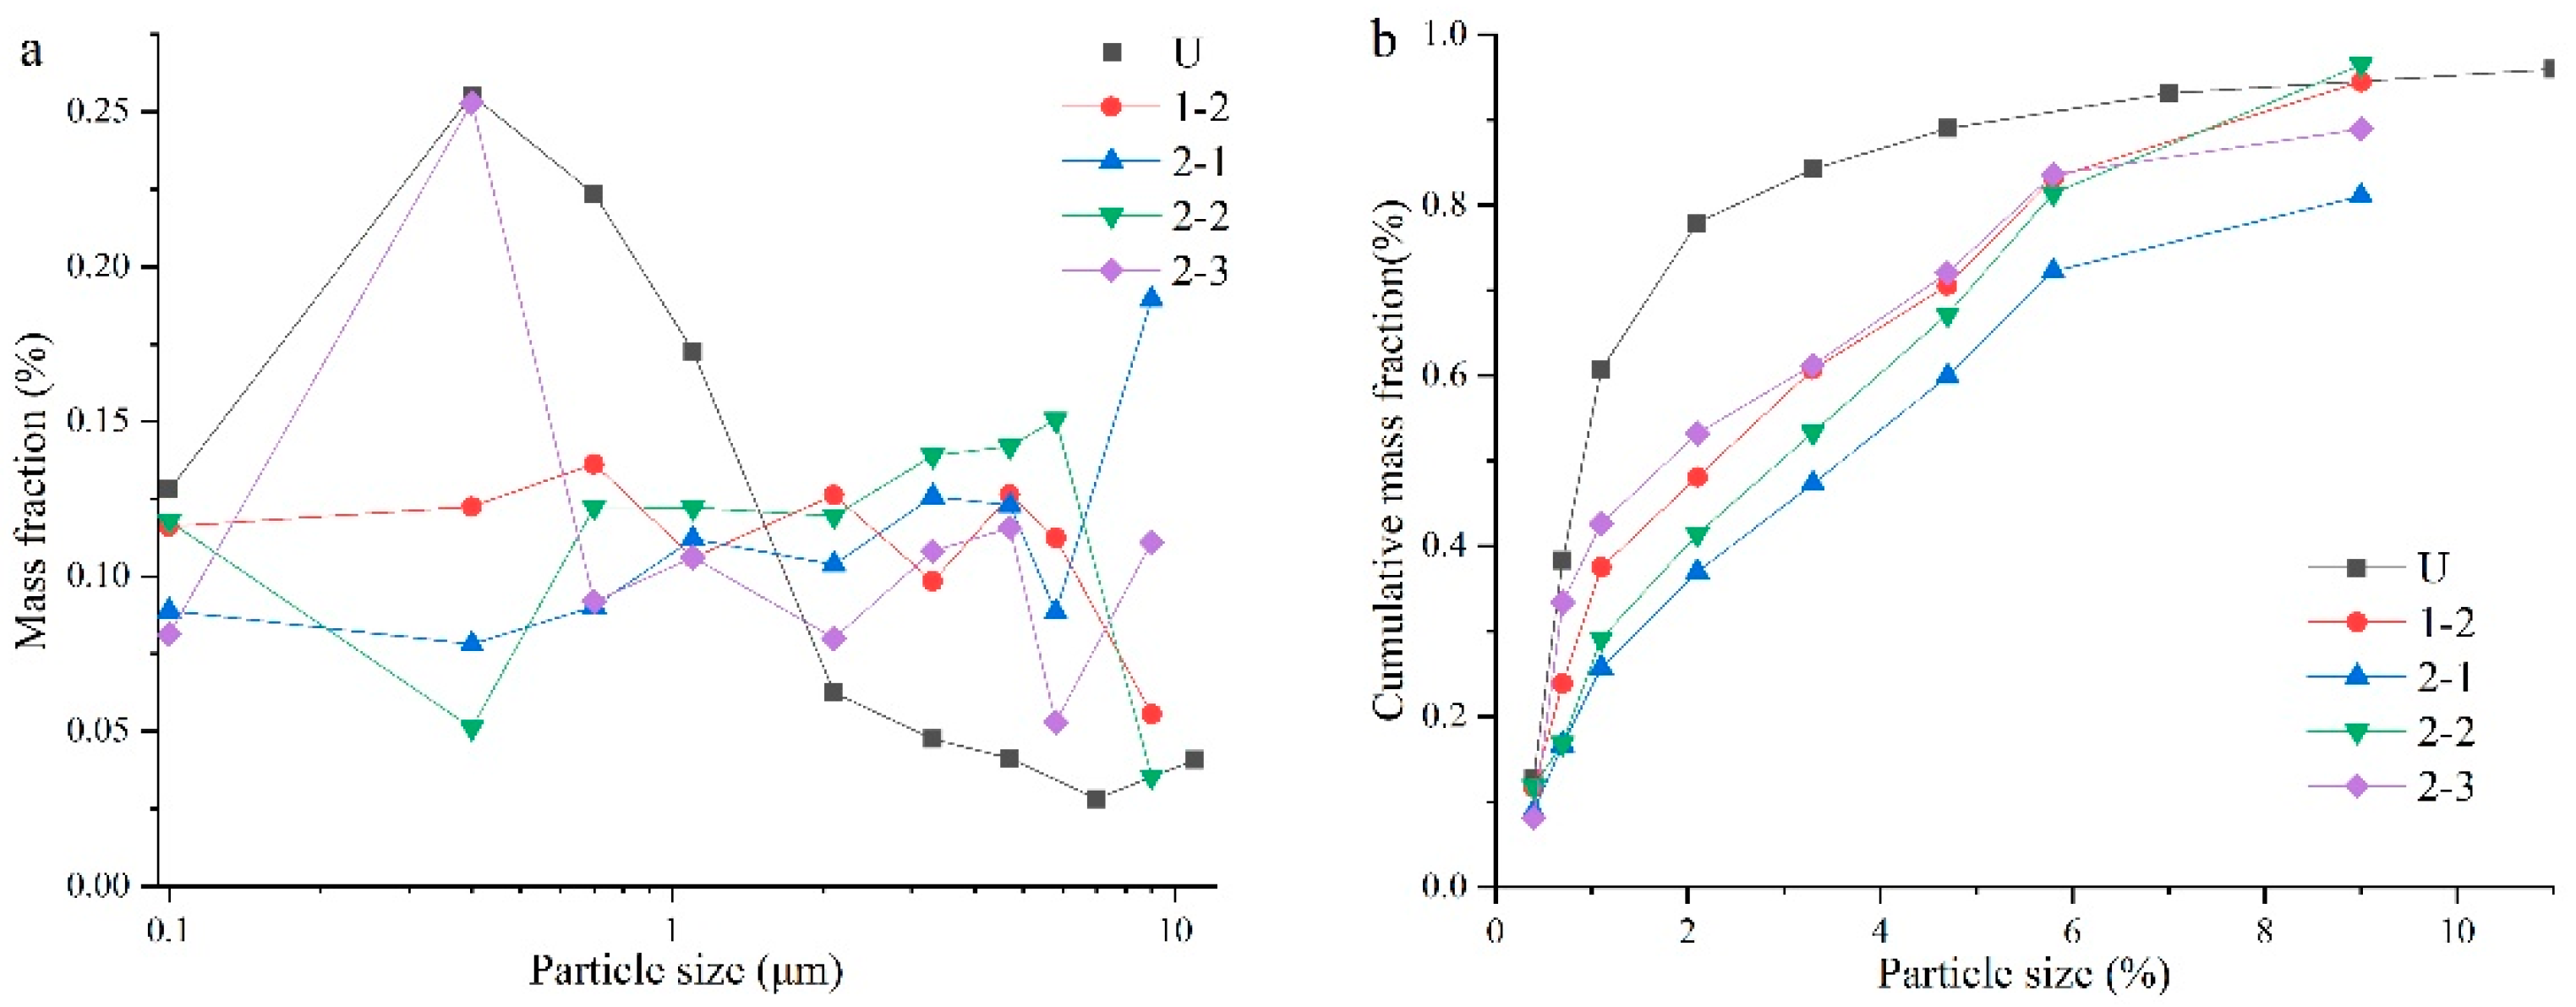
3.1. Particle size Distribution and Assessment

The available particle-size-distribution data of cerium aerosol obtained from six experiments are summarized in Table 6. Exp. 1-1 and Exp. 2-4 are not available. For the convenience of calculation and processing, the MMD of the F-stage sampler was selected as 0.1 μm.
The data in Table 6 were used to make the fraction distribution of mass and the fraction distribution of cumulative mass, as shown in Figure 4. In Figure 4, we compare the results of cerium aerosols with those of uranium aerosols obtained in the literature by Surya Narayan using strong-current instantaneous gasification of UO2 fuel assemblies [21]. Combining Table 5 and Figure 4, we can see that the particle size distribution of cerium aerosols was greatly affected by environment conditions (air flow rate and sampling time), and even under the same experiment conditions, there were differences between the results of 1-2 and 2-2, indicating that the results were greatly affected by other factors (temperature and humidity). At the same time, there was a difference between the particle size distribution of the cerium aerosols and the uranium aerosols, indicating that the simulation effect of the cerium aerosol was not good enough in replacing the uranium aerosols. Aerosol particles had better stability in the larger particle size range. As can be seen in Figure 4b, the aerosol particle size distribution varied significantly at smaller scales, while it exhibited very similar trends at larger scales.

3.2. Source Term Analysis and Assessment

In this experiment, the cerium mass was calculated according to the mass of the metal cerium combustion product and the cerium aerosol by relative atomic mass. The cerium mass in aerosol samples can be measured directly, and the calculation cerium mass in the combustion products requires characterization of the combustion products to obtain information such as their chemical composition and phase composition.

3.2.1. Characterization and Analysis of Element Composition

Figure 5 shows the TEM images of the cerium aerosol. Table 7 shows the corresponding semiquantitative analysis data. It can be seen from Figure 5 that the particle size selected for analysis was between 400 and 1200 nm, and the particle was irregular. Figure 5a,b clearly show the adsorption of small particles, indicating that the independence and dispersion of the cerium aerosol particles were not good, and there were aggregation and clustering phenomena. From the atomic ratio composition in Table 7, it can be seen that the chemical composition on the surface of the colloidal particles was mainly cerium oxide.
The results of XRD analysis of combustion products of Exp. 1-1 and Exp. 1-2, for example, are shown in Figure 6. It can be seen that the 2θ peak of the product and the standard peak of CeO2 in the PDF2-2004 card can be corresponded within 90°, indicating that the main component of the product was CeO2, and it contained almost no impurities, indicating that the metal cerium sample was fully oxidized under burning.
Figure 7 shows the XPS results of the cerium combustion products. Table 8 shows the semiquantitative analysis results.
The result of the semiquantitative analysis of combustion products showed that its main component was CeO2, which was consistent with the XRD test results. In addition to cerium, the carbon in the product comes from carbon black produced by the incomplete combustion of kerosene, and the zinc comes from the residual particles attached to the inner wall of the combustion chamber from the previous zinc-aerosol-generation experiment.

3.2.2. Calculation of Source Term

Exp. 1-2 measured the cerium contained in the sampling-system exhaust gas (Table 9). Among them, 10% 1 g/cm3 dilute nitric acid was adopted as the collected medium, and ICP-AES was used to measure the concentration of cerium and calculate its mass. It can be seen from Table 9 that the total mass of the cerium collected in the exhaust gas of the sampling system with a particle size of less than 0.4 μm was 31.92 μg, while the total mass of the cerium collected by the sampler can be calculated from Table 5 to be 54.15 μg. The ratio between the two parts was 0.589, which shows that a considerable part of the cerium aerosol particles was not collected by the sampler. Combined with the adsorption of small particles in Figure 5a,b, it can be seen that the cerium aerosol had a concentrated distribution in the small particle size range (<0.4 μm), which cannot be shown in Figure 4.
From the analysis above and the data in Table 8, it can be seen that the use of Formula (2) to calculate the RF ignores the contribution of smaller particles. Therefore, Formula (3) was used. The other experiments used two methods to calculate the RF, respectively. Among them, the mass of cerium in the tail gas was converted by the total mass of cerium obtained in the sampler according to the ratio of 0.589 obtained in Exp. 1-2. Based on this, the total mass of combustion products obtained in each experiment and the ARF and RF are summarized in Table 10.
R F = m C e t o t a l + m C e t a i l m C e 0 m C e t o t a l + m C e t a i l
where:
m C e t o t a l : the total cerium mass in the glass-fiber filter;
m C e t a i l : the cerium mass in the sample exhaust gas;
m C e 0 : the cerium mass in the 0 stage of the sampler;

3.2.3. Evaluation of Source Term Simulation Effect

Comparing the ARF and RF obtained in the experiment with that (Table 11) given by Clark et al. using coal as fuel at a temperature of about 600 °C, it can be seen that the ARF value had a deviation of orders of magnitude, and the lower limit of the experiment result of RF was closer to the upper limit of the result given by the uranium–niobium alloy [22]. In the calculation of the ARF, the combustion product’s mass obtained in Exp. 1-2 was obviously lower than that in Exp. 1-1 and Exp. 2-4, which was caused by some fragments falling into the preheating chamber during the combustion process and the aerosol-collection process. In the calculation of the RF, the RF was similar to the results obtained by using the uranium–niobium alloy in the literature. Based on the above experiment results, it can be seen that the ARF simulation effect of cerium aerosol on uranium aerosol is poor, but the simulation effect on the RF is better.

3.3. Influence of Environment Factors

3.3.1. Sampling Time

Judging from the particle size distribution results of 2-1 and 2-2 in Figure 4, the particles larger than 9 μm increased as the sampling time. The reason is that while increasing the sampling time, it also increases the air flow time in the experiment device so that the large particles originally adsorbed and deposited on the pipe wall and the valve have a chance to enter the sampling system, increasing the proportion of large particles and indirectly leading to a reduction in the RF. During the experiment, it could be observed that the metal cerium sample could be completely burned within the sampling time of 10 min, so the effect of increasing the sampling time on the ARF was not obvious.

3.3.2. Air Flow Rate

Combining the particle-size-distribution diagrams obtained in Exp. 2-1 and Exp. 2-3, we can see that the particle size distributions of the two roughly followed similar laws, but the proportion of particles in the range of 0.4–0.7 μm in Exp. 2-3 was significantly higher than the results of Exp. 2-1. This result shows that after increasing the air flow rate, the large particles originally formed via aggregation or adsorption are dispersed, which leads to an increase in the proportion of small particles and an increase in the RF. The influence of the air flow rate on the ARF remains to be studied.

4. Discussion

4.1. Generate Feature Similarity Analysis

The distribution of cerium aerosols was similar between different experiments. The particle size distribution in the range of 1.1–4.7 μm had little difference, while in the range of less than 1.1 μm and greater than 4.7 μm, the distribution increased or decreased obviously, and the change trend of the size and particle size was consistent. For uranium aerosols, the results of the parallel experiments showed log-normal distribution and bimodal distribution, respectively, and the mass median aerodynamic diameter (MMAD) of the normal distribution was 2.13 ± 0.45 μm, while the two peaks of the bimodal distribution were located near 1 μm and 6 μm, respectively, which was quite different from the distribution of the cerium aerosols’ particle size. Therefore, purely from the results in this experiment, cerium aerosols have no effective equivalence with uranium aerosol at the size distribution of particles.
The ARF values obtained with cerium aerosol were 4.84 × 10⁻² and 6.20 × 10⁻³, respectively, which were also quite different from the results obtained with uranium aerosol of 0.525–0.620. Therefore, purely from the experimental results, the similarity was not high.
In terms of the RF, the RF value of cerium aerosol ranged from 0.881 to 0.978, while that of uranium aerosol was 0.99 to 1.0, and the similarity between the two was high. Considering that the experimental conditions of the two were the same, and the RF is an important evaluation index for the inhalation hazard of aerosols, it can be seen from the experimental results that cerium aerosols can better simulate the RF of uranium aerosols.

4.2. Discussion of Experimental Results

From the experimental results, the simulation effect of cerium aerosol RF is better. However, from the comprehensive point of view of experimental conditions and experimental settings, the simulation effect of particle size distribution and ARF still needs more experimental verification. On the one hand, the uranium material used in the experiment is quite different from the material specification of cerium. From the comparison of the results of uranium aerosol generation at home and abroad, the specification of the material is also a key factor affecting the aerosol-generation characteristics. It is necessary to unify the specifications of materials in the experiment as much as possible; on the other hand, the accuracy of the experimental data will have been affected to a certain extent due to factors such as the long sampling pipeline of the experimental device, the many sampling pipeline valves, and the deposition on the inner wall of the sampling pipeline.
Therefore, in general, this study cannot simply evaluate the suitability of cerium aerosol as a substitute material for uranium aerosol from the perspective of experimental data, but should analyze the reference value and significance of the obtained experimental data and help understand the experimental results. On the basis of fully solving various problems encountered in this research, more experiments are being carried out to make more scientific and reasonable conclusions.

4.3. Conclusions

The calculation result of the air release fraction (ARF) is 6.07 × 10⁻³–4.8 × 10⁻², and the respirable fraction (RF) is 0.810–0.978, respectively, showing that the size distribution of particles and the ARF of cerium aerosol are different from the results of the uranium aerosols in the literature, while the RF is similar to the results obtained by using uranium–niobium alloy in the literature. The RF of cerium aerosol can be approximated to simulate the RF of uranium aerosol. It is possible to use cerium aerosol instead of uranium aerosol for RF study experiments.

Author Contributions

Methodology, Y.W. and M.G.; Validation, B.L.; Formal analysis, B.L.; Resources, F.W.; Data curation, J.T.; Writing—original draft, H.M.; Writing—review & editing, M.Z. and Y.W.; Project administration, D.M.; Funding acquisition, M.G. All authors have read and agreed to the published version of the manuscript.

Funding

The equipment pre research project (41426030107), the construction project of key universities and key disciplines (430183), and the key construction project of universities and disciplines (430618).

Data Availability Statement

The data is unavailable due to privacy or ethical restrictions.

Acknowledgments

We are very grateful to the Institute of Nuclear Physics and Chemistry, China Academy of Engineering Physics for their support in the experiments.

Conflicts of Interest

The authors declare no conflict of interest.

References

  1. Ran, Y.; Wang, S.; Zhao, Y.; Li, J.; Ran, X.; Hao, Y. A review of biological effects and treatments of inhaled depleted uranium aerosol. J. Environ. Radioact. 2020, 222, 106357. [Google Scholar] [CrossRef] [PubMed]
  2. Valdes, M. Estimating the lung burden from exposure to aerosols of depleted uranium. Radiat. Prot. Dosim. 2009, 134, 23–29. [Google Scholar] [CrossRef] [PubMed] [Green Version]
  3. Petrina, L.S. Chemical and Radiation Danger of Uranium Aerosols. At. Energy 2008, 105, 65–70. [Google Scholar] [CrossRef]
  4. Halverson, M.; Ballinger, M.; Dennis, G.W. Combustion Aerosols Formed during Burning of Radioactively Contaminated Materials: Experimental Results; U.S. Department of Energy Office of Scientific and Technical Information: Oak Ridge, TN, USA, 1987.
  5. Mishima, J.; Schwendiman, L.C. Fractional airborne release of uranium (representing plutonium) during the burning of contaminated wastes. Creat. Innov. Manag. 1973, 4, 110–119. [Google Scholar]
  6. Fernandez, Y.; Burghoffer, P. Radioactive Aerosols Emission in Fires. Aerosol Sci. Technol. 1995, 23, 231–238. [Google Scholar] [CrossRef]
  7. Buijs, K.; De Dalmassy, B.C.; Pickering, S. The dispersion of radioactive aerosols in fires. J. Nucl. Mater. 1989, 166, 199–207. [Google Scholar] [CrossRef]
  8. Elder, J.C.; Tinkle, M.C. Oxidation of Depleted Uranium Penetrators and Aerosol Dispersal at High Temperatures; Los Alamos Scientific Lab.: Los Alamos, NM, USA, 1980; pp. 1–50.
  9. Carter, R.F.; Stewart, K. On the oxide fume formed by the combustion of plutonium and uranium. Inhaled Part. 1971, 2, 819. [Google Scholar]
  10. Roszell, L.E.; Hahn, F.F.; Lee, R.B.; Parkhurst, M.A. Accessing the renal toxicity of Capstone Depleted Uranium oxides and other uranium compounds. Health Phys. 2009, 96, 343–351. [Google Scholar] [CrossRef] [PubMed]
  11. Hodgson, A.; Pgd, P.; Stradling, G.N. Influence of Nephrotoxicity on Urinary Excretion of Uranium; Health Protection Agency: St. Leonards, NSW, Australia, 2007. [Google Scholar]
  12. Di Lemma, F.G.; Colle, J.Y.; Ernstberger, M.; Rasmussen, G.; Thiele, H.; Konings, R.J. RADES an experimental set-up for the characterization of aerosol release from nuclear and radioactive materials. J. Aerosol Sci. 2014, 70, 36–49. [Google Scholar] [CrossRef]
  13. Gregson, M.W.; Brockmann, J.E.; Loiseau, O.; Klennert, L.A.; Nolte, O.; Molecke, M.A.; Autrusson, B.A.; Koch, W.; Pretzsch, G.G.; Brucher, W.; et al. Spent Fuel Sabotage Test Program, Characterization of Aerosol Dispersal: Interim Final Report; Sandia National Laboratories: Albuquerque, NM, USA, 2008; 99p.
  14. Borek, T.T., III; Thompson, N.S.; Sorenson, K.B.; Hibbs, R.S.; Nolte, O.; Molecke, M.A.; Autrusson, B.; Young, F.I.; Koch, W.; Brochard, D.; et al. Surrogate/Spent Fuel Sabotage: Aerosol Ratio Test Program and Phase 2 Test Results; Sandia National Laboratories: Albuquerque, NM, USA, 2004; 102p.
  15. Moore, M.E.; Tao, Y. Aerosol Physics Considerations for Using Cerium Oxide CeO2 as a Surrogate for Plutonium Oxide PuO2 in Airborne Release Fraction Measurements for Storage Container Investigations; Los Alamos National Lab: Los Alamos, NM, USA, 2017. [Google Scholar]
  16. Marra, J.C. Cerium as a Surrogate in the Plutonium Immobilized Form; Savannah River Site (SRS): Aiken, SC, USA, 2001; pp. 381–388.
  17. Kolman, D.G.; Park, Y.; Stan, M.; Hanrahan Jr, R.J.; Butt, D.P. An Assessment of the Validity of Cerium Oxide as a Surrogate for Plutonium Oxide Gallium Removal Studies; Los Alamos National Lab: Denton, TX, USA, 1999.
  18. Speight, J.G. Lange’s Handbook of Chemistry, 16th ed.; McGraw-Hill Education: New York, NY, USA, 2005. [Google Scholar]
  19. Min Zhu, H.M.; Liang, D. Simulation of particle size distribution and source term for uranium aerosols based on zinc generated under fire conditions. AIP Adv. 2022, 12, 015020. [Google Scholar]
  20. Plionis, A.A.; Peterson, D.S.; Tandon, L.; Lamont, S.P. Alpha Spectrometric Characterization of Process-Related Particle Size Distributions from Active Particle Sampling at the Los Alamos National Laboratory Uranium Foundry; IOP Conference Series: Materials Science and Engineering; IOP Publishing: Bristol, UK, 2010. [Google Scholar]
  21. Surya Narayana, D.S.; Sundararajan, A.R.; Harvey, J. Characterization of Uranium Oxide Aerosols. J. Aerosol Sci. 1994, 25, 909–922. [Google Scholar] [CrossRef]
  22. Clark, D.K. Characterization of Respirable Uranium Aerosols from Various Uranium Alloys in Fire Events. Aerosol Sci. Technol. 2015, 49, 188–195. [Google Scholar] [CrossRef] [Green Version]
Figure 1. High-temperature experiment apparatus.
Processes 11 00419 g001
Figure 2. Figure of the burning Cerium and combustion products. (a): The combustion diagram of the cerium sample. (b,c): The combustion products of the cerium sample.
Processes 11 00419 g002
Figure 3. The filter paper after cerium-aerosol sampling.
Processes 11 00419 g003
Figure 4. Comparison of distributions between Ce and U [21] “Adapted with permission from Ref. [Characterization of Uranium Oxide Aerosols]. 1994, Surya Narayana, D.S.” and Ce. (a): The fraction distribution of mass. (b) The fraction distribution of cumulative mass.
Processes 11 00419 g004
Figure 5. TEM Images of Ce aerosol particles. (a): Electronic image of cerium aerosol particles at 600 nm. (b): Electronic image of cerium aerosol particles at 500 nm. (c): Electronic image of cerium aerosol particles at 400 nm. (d): Electronic image of cerium aerosol particles at 100 nm.
Processes 11 00419 g005
Figure 6. XRD spectra of combustion products.
Processes 11 00419 g006
Figure 7. XPS results of combustion products.
Processes 11 00419 g007
Table 1. Allotrope of Cerium.
PhaseDensity (g/cm3)Crystal StructureForward Transition TemperatureReverse Transition Temperature
α8.16Face-centered cubic-−228 °C
β6.689Double-hexagonal closest packing−148 °C−16 °C
γ6.77Face-centered cubic139 °C-
δ6.65Body-centered cube726 °C-
Table 2. The mass median diameter (MMD) of the impactor.
Stage01234567F
MMD (μm)95.84.73.32.11.10.70.4<0.4
Size range (μm)>99–5.85.8–4.74.7–3.33.3–2.12.1–1.11.1–0.70.7–0.4<0.4
Table 3. The manufacturer and model of equipment.
EquipmentManufacturerModel
ICP-AESThermo Fisher ScientificIcap 7000
TEMZeissLabra200Kv
XRDPANalyticalXpert pro
XPSPANalyticalAxios
Table 4. Materials of the experiment.
MaterialsCASPuritySpecificationMass
Ce231-154-999.90%25 × 25 × 1 mm4.2 g
Ce231-154-91000 μg/mL50 mL-
HNO37697-37-2GR500 mL-
H2O7732-18-515 MΩ/cm--
Table 5. Conditions of the experiments.
Serial Number1-11-22-12-22-32-4
Flow rate of air (m/s)42.72.72.742.7
Sampling time (min)101030103020
Table 6. Particle size distribution data of cerium aerosol.
Serial Number1-22-12-22-3
StageMMD (μm)Mass (μg)Mass (ng)Mass (ng)Mass (ng)
093.0128848.76202.32
15.86.088134.32208.2296.64
24.76.838186.88196.1211.04
33.35.33191.28192197.2
42.16.836157.84165.2145.92
51.15.742170.24168.86193.52
60.77.382137.36169.04167.6
70.46.632118.870.64461.2
F0.16.29135.04162.88148.32
Table 7. Results of Semiquantitative analysis.
No.O (%)Zn (%)Ce (%)Estimated Density (g/cm3)
a55.63−0.1544.516.1
b59.38−0.8441.476.01
c60.07−2.342.236
d64.37−1.0936.725.86
Mean59.9−1.141.26.0
Table 8. XPS semiquantitative analysis results.
Ce Powder
PeaksBE (eV)FWHM
(eV)
Atom %
Ce3d898.482.9519.56
O1s529.192.8861.13
Zn2p1021.773.125.02
C1s284.641.6114.29
Table 9. Mass of Ce collected in the exhaust gas of Exp. 1-2.
Serial NumberTotal Mass (g)Volume
(mL)
Concentration
(μg/mL)
Mass
(μg)
Ce-138.90438.9040.444517.29
Ce-232.182932.18290.454614.63
Table 10. Results of ARF and RF.
Serial Number1-11-22-12-22-32-4
Mass of Ce4.204.204.204.204.204.39
Combustion products (g)4.913.87---5.36
ARF0.050.25---6.07 × 10⁻³
RF-0.9440.8100.9650.889-
RF *-0.9650.8800.9780.930-
RF *: RF calculated by Equation (3).
Table 11. Results from Clark et al. [22]. “Reprinted with permission from Ref. [Characterization of Respirable Uranium Aerosols from Various Uranium Alloys in Fire Events]. 2015, Clark, D.K.”
ParameterGeometric MeanArithmetic Average
U-TiUU-NbU-TiUU-Nb
ARF2 × 10 −51 × 10 −65 × 10 −84 × 10 −51 × 10 −66 × 10 −8
RF0.470.330.770.490.330.78
Disclaimer/Publisher’s Note: The statements, opinions and data contained in all publications are solely those of the individual author(s) and contributor(s) and not of MDPI and/or the editor(s). MDPI and/or the editor(s) disclaim responsibility for any injury to people or property resulting from any ideas, methods, instructions or products referred to in the content.

