Article

Sorption of Phosphate on Douglas Fir Biochar Treated with Magnesium Chloride and Potassium Hydroxide for Soil Amendments

1
Department of Chemistry, Mississippi State University, Mississippi State, MS 39762, USA
2
Department of Chemistry, Gulu University, Gulu P.O. Box 166, Uganda
*
Author to whom correspondence should be addressed.
Processes 2023, 11(2), 331; https://doi.org/10.3390/pr11020331
Submission received: 1 November 2022 / Revised: 3 January 2023 / Accepted: 5 January 2023 / Published: 19 January 2023
(This article belongs to the Section Environmental and Green Processes)

Abstract

:
With increasing climate variability, a sustainable crop production approach remains an indispensable concern across the globe. In this study, P retention/availability of MgCl2.6H2O/KOH modified Douglas fir biochar was assessed. The MgCl2·6H2O/KOH treated Douglas fir biochar was prepared by sequentially treating Douglas fir biochar with magnesium chloride and potassium hydroxide solutions. The biochar’s surface area, pore volume, morphology, and elemental compositions were determined using BET, SEM, SEM/EDS, and powder X-ray analyzes. Both surface area and pore volume were reduced by more than 97% following modification. Similarly, the morphology and elemental compositions changed after modification. The maximum P adsorbed corresponding to Langmuir–Freundlich model was 41.18 mg g−1. P sorption on biochar soil mixture was pH dependent. More studies are required to establish the field applicability of P-laden MgCl2 ·6H2O/KOH-modified Douglas fir biochar as a soil additive.

1. Introduction

Globally, fertilizer and manures are the primary sources of phosphorus (P) for improved crop yield. However, the constant use of fertilizers and manure for food and fiber production is considered the primary cause of eutrophication and its related problems [1,2]. Eutrophication is associated with algae blooms and the insufficiency of oxygen in the water for aquatic animals. Furthermore, in such anaerobic conditions, methanogens decompose organic matter into methane, a gas with higher contributions to global warming than carbon dioxide per unit [3]. The United State Environmental Protection Agency (USEPA), in an attempt to minimize eutrophication, has set limits for total phosphate concentrations at 0.05 mg L−1 and 0.1 mg L−1 in streams entering lakes and flowing water bodies, respectively [4,5].
Biochar, a solid by-product formed from the anaerobic combustion of various biomass, has caught the attention of many researchers due to its multiple environmental benefits [6]. Recently, biochar’s ability to adsorb environmental pollutants has been reported [7]. Moreover, it is known that the sorption capacity of biochar can be improved by modification [8]. Common treatment agents include; oxidants (HCl, HNO3, H2O2, H3PO4), reducing agents (NaOH, KOH, and NH4OH), and metal salts (Fe3+, Mg2+, Al3+, Zn2+, Mn2+ and Ag+). However, for soil amendment, phytotoxicity due to excess Fe2+, Al3+, and Mn2+ as treatment agents may occur [9,10]. Excess Fe2+ in plant cells accelerates redox reactions by acting as an electron donor [11]. Al3+ inhibits root elongation, root hair growth, lateral root development, and rhizobial infection of the roots [12], while Mn2+ causes phytotoxicity by producing reactive oxygen species and interfering with the metabolism of essential metals [13]. In addition, P sorption by clay minerals, Ca2+, and oxides of iron or aluminum in soil-forming insoluble complexes and precipitates has been extensively documented [14,15]. Akgül et al. [16] observed that biochar modified with Mg2+ had higher sorption capacity for PO43− in comparison to Fe3+, Al3+, and Mn2+ ions. Additionally, other studies indicated that the adsorbed phosphate could be released in soil for plant uptake as nutrients [17,18].
Modified P-laden Douglas fir biochar, made from the sequential treatment of biochar with magnesium chloride, potassium hydroxide, and aqueous potassium phosphate solution, can be a cheap and eco-friendly alternative for soil P management. Moreover, in addition to P, the P-laden modified Douglas fir biochar could supply the soil with other essential plant nutrients, including Mg and K. To date, however, information on P retention/availability of modified Douglas fir biochar as a soil additive is still scanty. In addition, despite several studies on the sorption of Phosphate by modified biochar, commercial biochar such as Douglas fir biochar has received less attention regardless of its low cost and availability. Therefore, this study evaluated the P retention/availability of modified Douglas fir biochar for its potential use as a soil additive. The study estimated the pH range over which modified Douglas fir biochar sorbs phosphate, determined the P sorption capacity of magnesium chloride/potassium hydroxide modified Douglas fir biochar, and examined the sorption of P by modified Douglas fir biochar/soil mixture.

2. Materials and Methods

2.1. Source of Biochar Used

Biochar used for this study was derived from Douglas fir as a by-product of waste wood gasification to syngas. Raw Douglas fir chips (~3inch lengths) were auger-fed into an updraft gasifier for a ~1 s residence time at about 900–1000 °C. The resulting biochar was carefully washed several times with water to remove ash and other impurities before drying in air. The dried biochar (DFB) was ground, sieved through 50 mm mesh, and stored in closed vessels for further use.

2.2. Preparation of Modified Biochar (MBK)

Modified biochar was made by sequential mixing and drying of Douglas fir biochar (DFB) with solutions of magnesium chloride and potassium hydroxide, respectively. The choice of both magnesium chloride and potassium hydroxide as treatment agents for biochar modification was because Mg2+ is known to have good P sorption capacity [19]. In addition, both Mg2+ and K+ are essential to plant nutrients [20]. Although Fe, Mn, and Zn are useful for plant growth, they are micronutrients that are needed by plants in small quantities [21]. A substantial quantity of Al3+ and Mn2+ in the soil is toxic to plants. Al_ toxicity inhibits root growth by altering root membrane structure and functions [22], while Mn-toxicity restricts shoot growth through metabolic alterations [23]. Moreover, phosphate deficiency in acid soils is linked to elevated amounts of Al3+, Mn2+, and Fe3+ [24].
Depending on pH, phosphate sorption on MgO-modified biochar’s surface “s” may involve complexation [25], precipitations [17], and electrostatic interactions [18].
MgCl 2 aq + 2 KOH aq Mg OH 2 s + 2 KCl aq
Then               Mg OH 2 s + heat MgO   s + H 2 O   g
Complex formation
Mononuclear
sMgO OH 2 + aq + H 2 PO 4 aq sMgO H 2 PO 4   s + H 2 O   l
Binuclear
2 sMgO OH 2 + aq + HPO 4 2 aq s MgO 2 HPO 4 s + 2 H 2 O l
Trinuclear
3 sMgO OH 2 + aq + PO 4 3 aq sMgO 3 PO 4 s + 3 H 2 O   l
Precipitation
MgO   s + H 2 O   l Mg OH 2 aq Mg 2 + aq + 2 OH - aq
Then
Mg 2 + aq + H 2 PO   4 - aq Mg   H 2 PO 4 2   s
Mg 2 + aq + HPO   4 2 - aq MgHPO 4 s
Mg 2 + aq + PO 4 3 - aq Mg 3 PO 4 2 s
Electrostatic attraction
Also, protonation can occur.
MgO s + H 2 O   ( l ) Mg - OH + ( aq ) + OH - ( aq )
Then
MgOH + aq + H 2 PO   4 - aq MgOH + - H 2 PO 4 - ( aq )
MgOH + aq + HPO   4 2 aq MgOH + - HPO 4 2 - ( aq )

2.2.1. Preparation of Magnesium Chloride Modified Douglas Fir Biochar (MB)

To a clean 2000 mL glass beaker, 200 g of previously ground and sieved (<2 mm mesh) Douglas fir biochar (DFB) was added. To the biochar, a solution of magnesium chloride (0.52 M) made by dissolving 84.7 g of MgCl2 ·6H2O in 800 mL of deionized water was slowly added with constant stirring until a uniform mixture was formed. The mixture was then left on a magnetic stirrer for 6 h at 24 °C. After 24 h of standing, excess solution was filtered, and the residue dried in an oven at 100 °C to constant weight and stored in airtight polythene bags for further treatment.

2.2.2. Preparation Modified Biochar (MBK) from MB

To MB prepared previously (in Section 2.2.1) in a 2000 mL glass beaker, 800 mL of 5 M solution of potassium hydroxide, prepared by weighing 280.5 g of potassium hydroxide pellets and dissolving in 1000 mL of deionized water in a volumetric flask was added with constant stirring until a uniform slurry was formed. The slurry was stirred for 6 h with a magnetic stirrer and left to stand for 24 h, filtered, and the residue dried in an oven at 100 °C to constant weight. The modified biochar formed (MBK) was stored in tight plastic containers at room temperature, about (24 °C) until use.

2.3. Characterization of Biochar

2.3.1. Surface Analysis

The surface analysis of Douglas fir biochar and modified biochar were determined by Brunner–Emmet–Teller (BET) nitrogen gas physisorption. Before the adsorption measurements, the samples were degassed for about 6 h at 180 °C. Briefly, 0.1 g of each biochar sample was used to obtain the surface area and pore size from N2 isotherms at about 77.3 K with a MicroActive TriStar II Plus (GA, USA) Version 2.03. The specific surface area and pore volume were calculated using Dubinin–Astakhov equation [ log a = log a o Dlog n P o P ] and the density function theory [ W o = 44000   a o ρ ] , respectively [26]. Where a = the quantity of gas adsorbed per unit mass of adsorbent (mol g−1), a o = the micropore capacity (mol g−1), D = a constant, P and P o = the equilibrium and saturated vapor pressures of the adsorbate at temperature T(K), respectively,
Wo = the limiting micropore volume (cm3 g−1) and
ρ = the density of adsorbed gas (gcm−3).

Determination of Surface Morphology, Structural Chemical Composition, and Functional Groups

The morphology, surface textures, and qualitative elemental composition of DFB, MBK, and post sorption MBK here designated as P-enriched biochar (PEM) were examined with scanning electron microscopy (SEM) and SEM-EDX techniques at 5 kV using a JEOL JSM-6500F FE instrument (USA). Also, their structural and chemical compositions were analyzed by X-ray diffraction (XRD) using a SmartLab X-ray diffractometer (USA) by scanning 2θ from 0° to 90° at 1°/min. An XRD spectrum was obtained using the SmartLab X-ray diffraction system under the same conditions. The surface functional groups were studied by attenuated total reflectance Fourier Transformed Infrared Spectroscopy (ATR-FTIR) (ThermoScientific, USA).

2.3.2. Phosphate Adsorption Study

The phosphate stock solution (1000 mg P/L) was prepared by dissolving anhydrous potassium phosphate monobasic KH2PO4 (Sigma-Aldrich) in deionized water. The working solutions were obtained by diluting the stock solution with deionized water.

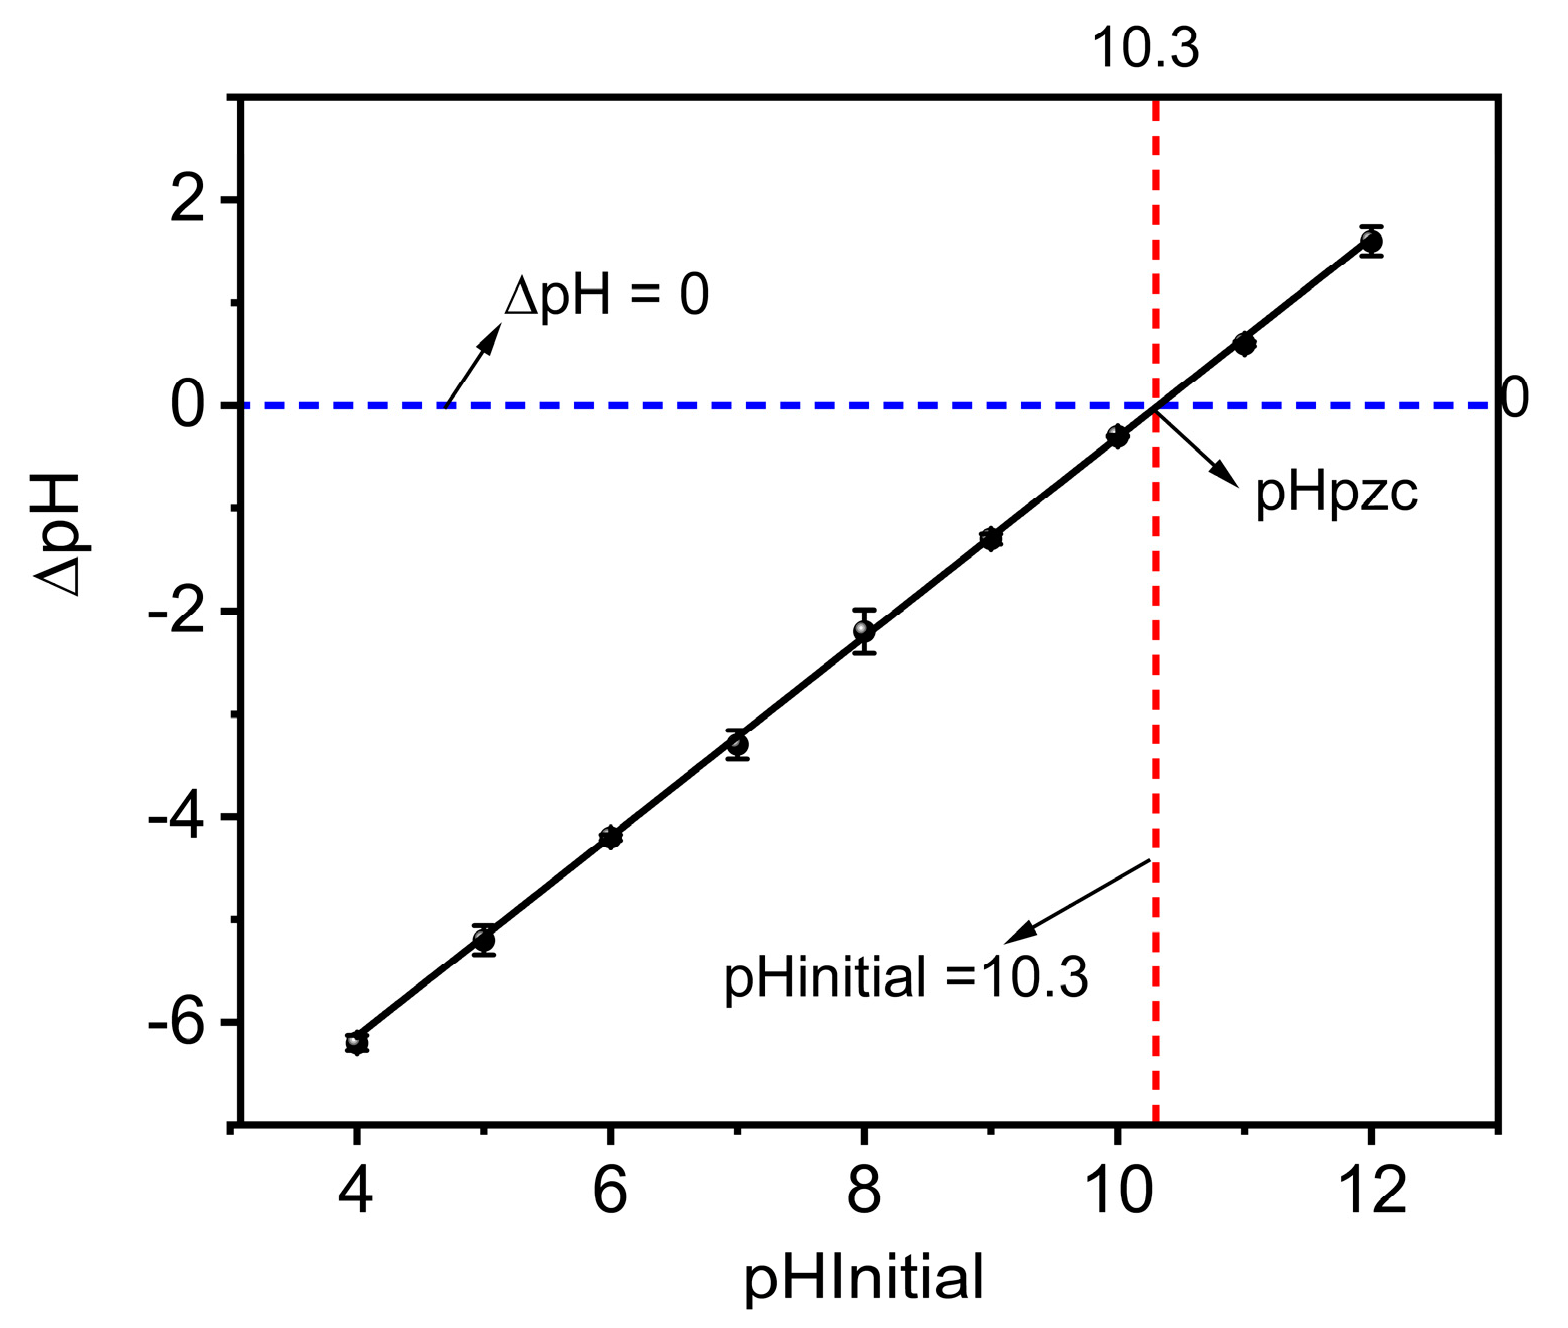
2.3.3. Determining the Point of Zero Charge (pHpzc)

The pHpzc for MBK was determined using the solid addition method [27]. Briefly, 0.01 M NaCl aqueous solution with pHinitial values varying from 4 to 12 was added to 0.05 g of MBK in a 50 mL polypropylene tube. The pHinitial values were adjusted with either 0.1 M NaOH or 0.1 M HCl solutions. After agitating the tubes and their contents for 24 h at room temperature (23 °C), the supernatants were filtered using Whatman number 1 filter papers, and their pH was finally measured using a HI3221 pH meter. The pHpzc was obtained from the plot of ∆pH (∆pH= pHinitial−pHfinal) against pHinitial.

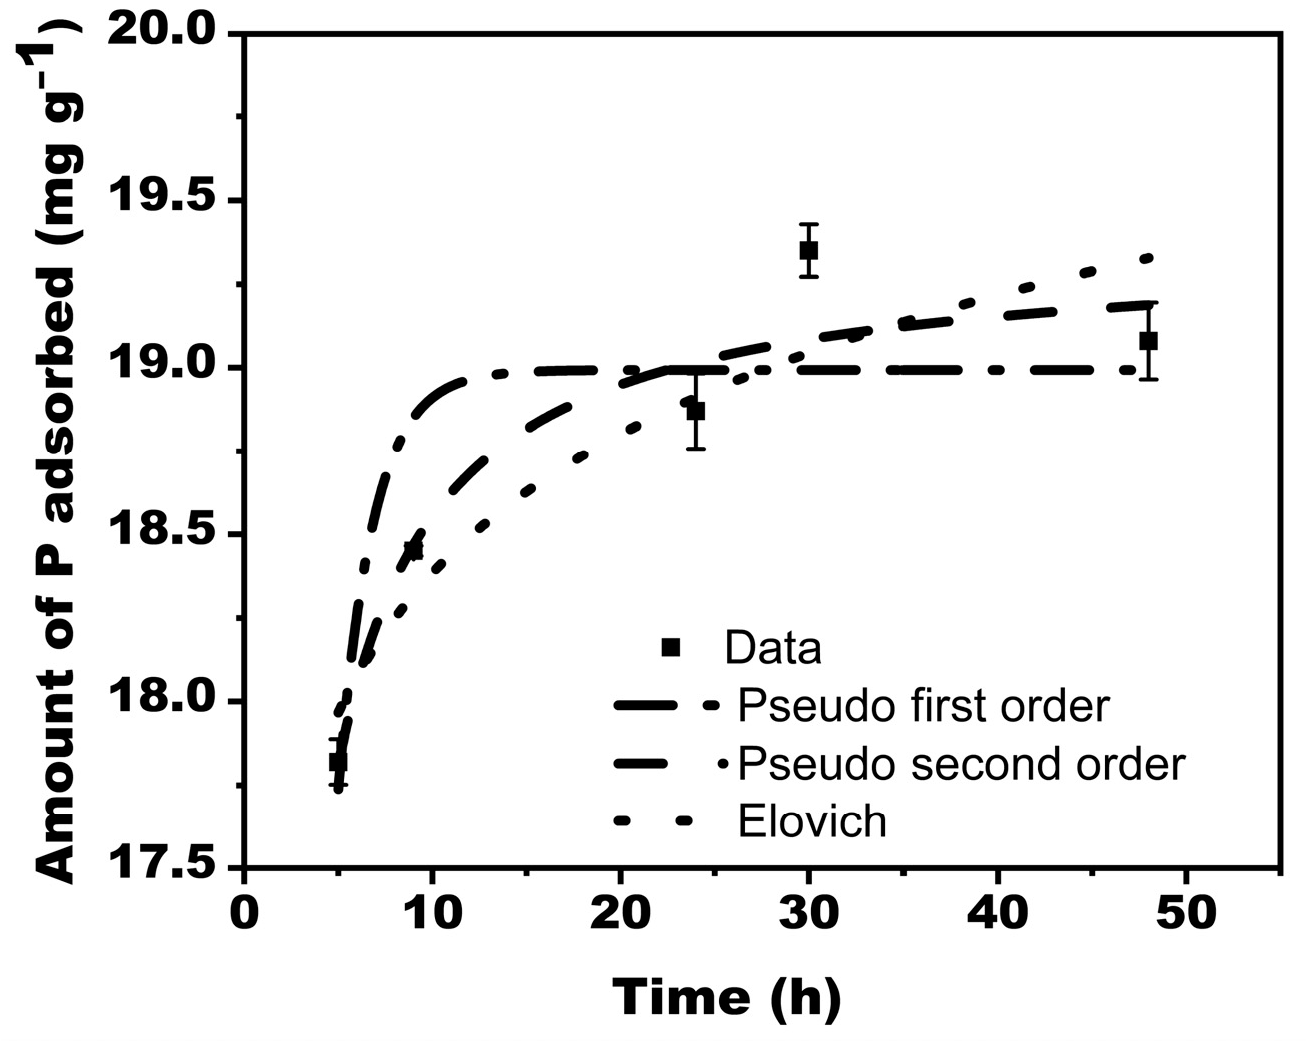
2.3.4. Kinetic Studies

The batch kinetic study of phosphate sorption on MBK was performed by mixing 0.1 g of MBK in a 50 mL centrifuge tube with 30 mL of 100 mg P/L solution. The tubes were then shaken in a mechanical shaker at 200 RPM for varying time intervals. At a time, the tubes were withdrawn, and their contents filtered through Whatman filter paper number 1. The Phosphate concentration in the filtrate was determined by the ascorbic acid method using a UV spectrophotometer (model) at 830 nm wavelength.
The amount of Phosphate adsorbed at equilibrium (qe, mg P/g) was calculated using equation q e = C i - C e V M , where Ci and Ce (mg P/L) are the initial and equilibrium Phosphate concentrations, respectively, V (L) is the volume of the solution, and M (g) is the mass of the adsorbent (MBK).

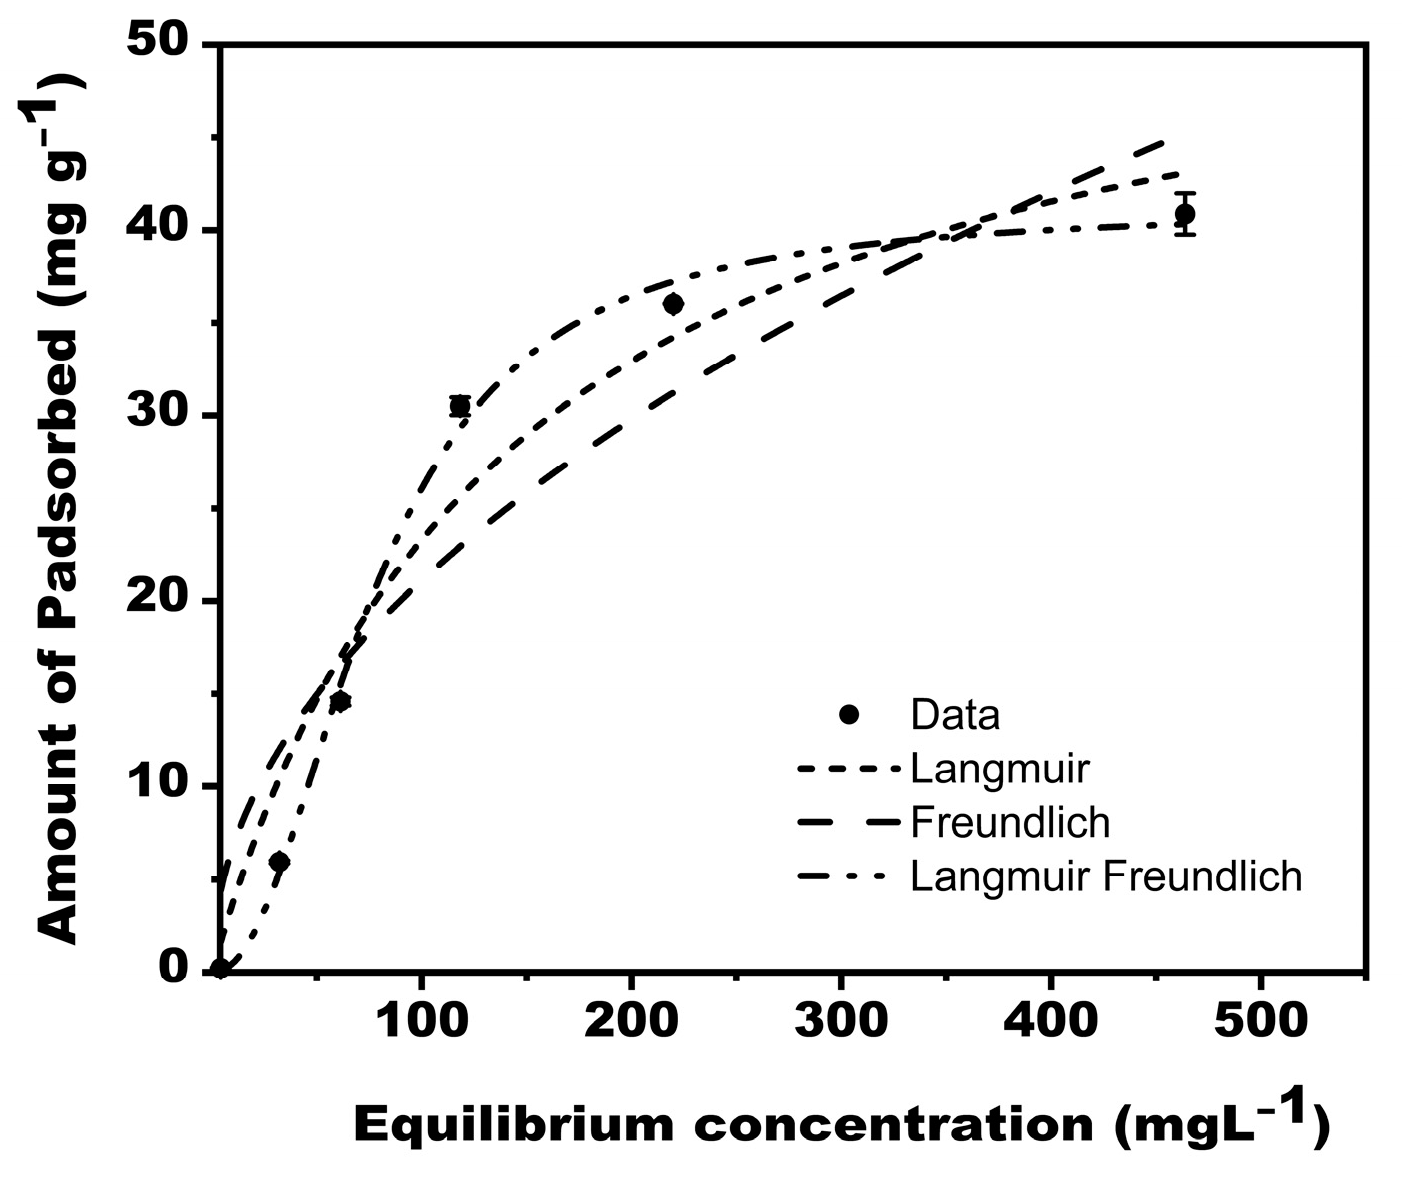
2.3.5. Isotherm Studies

The adsorption isotherms were determined by mixing 0.1 g of MBK with 30 mL phosphate solution of concentrations 5, 52, 110, 220, 340, and 600 mg P L−1 in a 50 mL centrifuge tube. The tubes were shaken for 48 h in a mechanical shaker (200 rpm) at room temperature (about 23 °C). Shaking was done for 48 h to ensure that reactions at all concentrations used reached equilibrium. After this, the samples were removed, filtered through Whatman filter paper number 1, and the corresponding phosphate concentration of the filtrate determined as in Section 2.3.4.

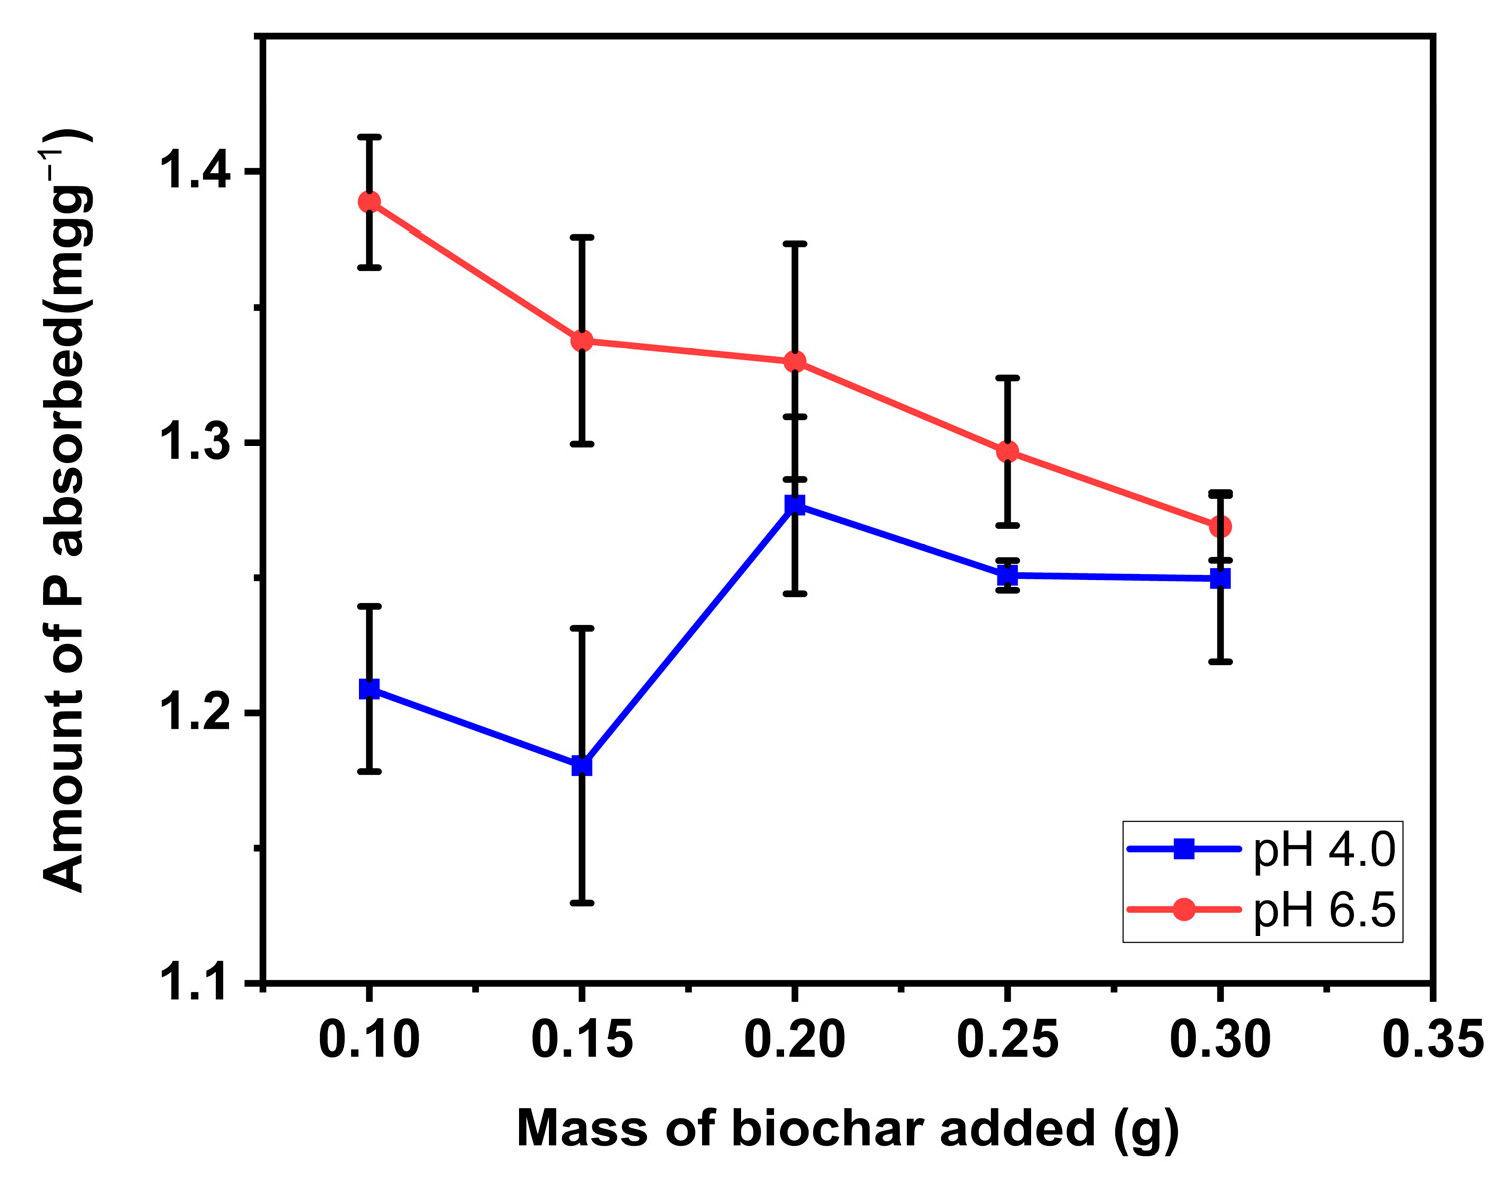
2.4. P Sorption by Biochar Soil Mixture

Adsorption by soil biochar mixture was examined to assess the efficiency of biochar amendments as a method for increased P retention in soil. To appropriate amounts of soil (initial pH = 5.3), 0.1, 0.15, 0.2, 0.25, and 0.3 g of MBK biochar were added in a 50 mL polypropylene tube to bring the total mass of soil/biochar mixture to 2 g and thoroughly mixed. To the mixture, 30 mL of 100 mg/L P was added, and the mixture was shaken at 200 rpm at room temperature in a mechanical shaker after adjusting pH to 4.0 and 6.5 with 0.1 M HCl or 0.1 NaOH. After 48 h of shaking, the content of the tubes was filtered using Whatman filter paper number 1, and the phosphate concentration of the filtrate determined as previously described in Section 2.3.4.
To examine P retention by soil/biochar mixture, 1.8 g of soil (pH = 5.3) was mixed with 0.2 g of biochar. 30 mL of 20, 30, 40, 50, and 70 mg/L P solution were added, and the mixture was shaken for 24 h in a shaker. The supernatant was then filtered, and the P concentration determined as above.

3. Results and Discussions

3.1. BET Surface Analysis

The BET surface analysis results showed that both surface area and pore volume decreased after modification of DFB. The surface area was reduced by more than 99% (from 528.1025 m2/g to 2.3942 m2/g). Similarly, pore volume decreased by ~ 97% (from 0.041971 cm3/g to 0.001141 cm3/g). However, the adsorption average pore diameters increased from 2.7044 Å to 26.088 Å (Table 1). The decrease in the surface area following the modification of DFB is due to pore blockage by the modification agents and their aggregate. This incomplete blockage obstructs the passage of N2 to micropores. According to Thi et al. [28], the reduction in the amount (volume) of nitrogen adsorbed by biochar manifests in the decrease in its surface area. This finding agrees with those of Fahmi et al. [29].

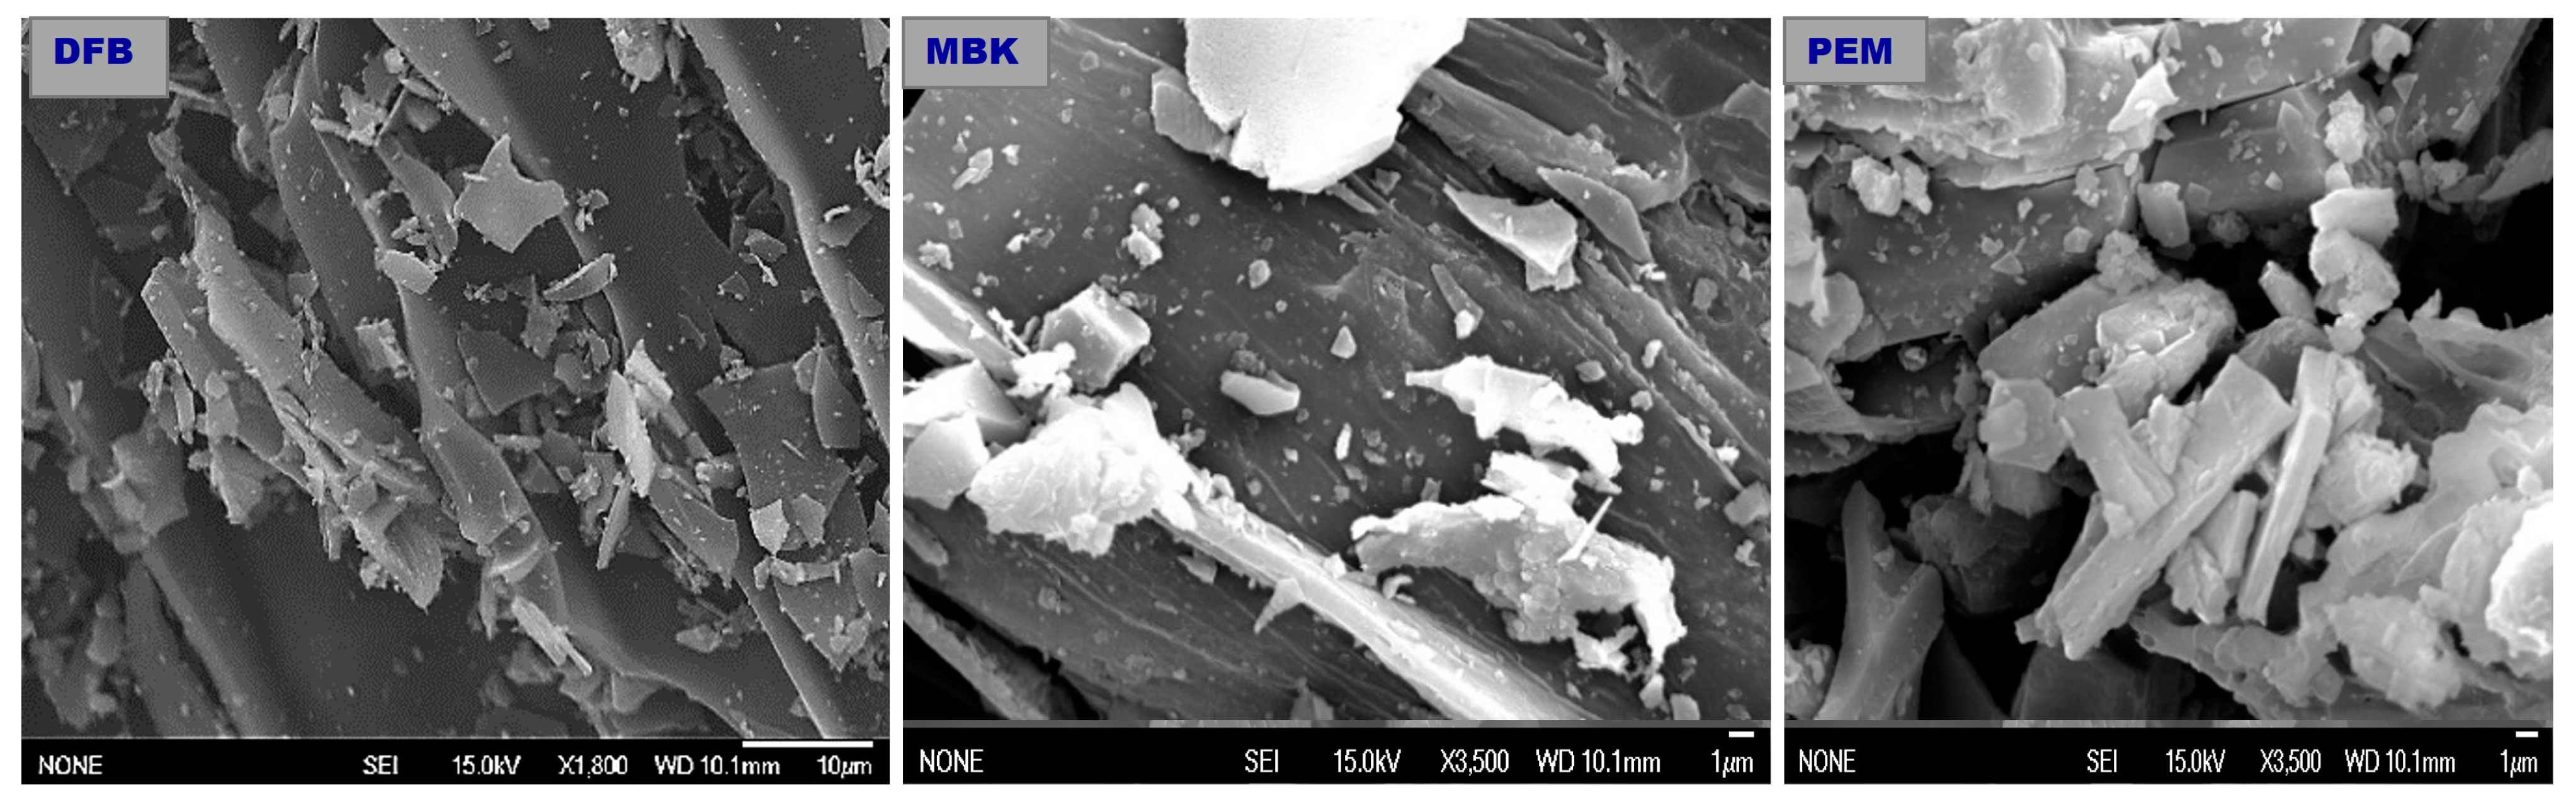
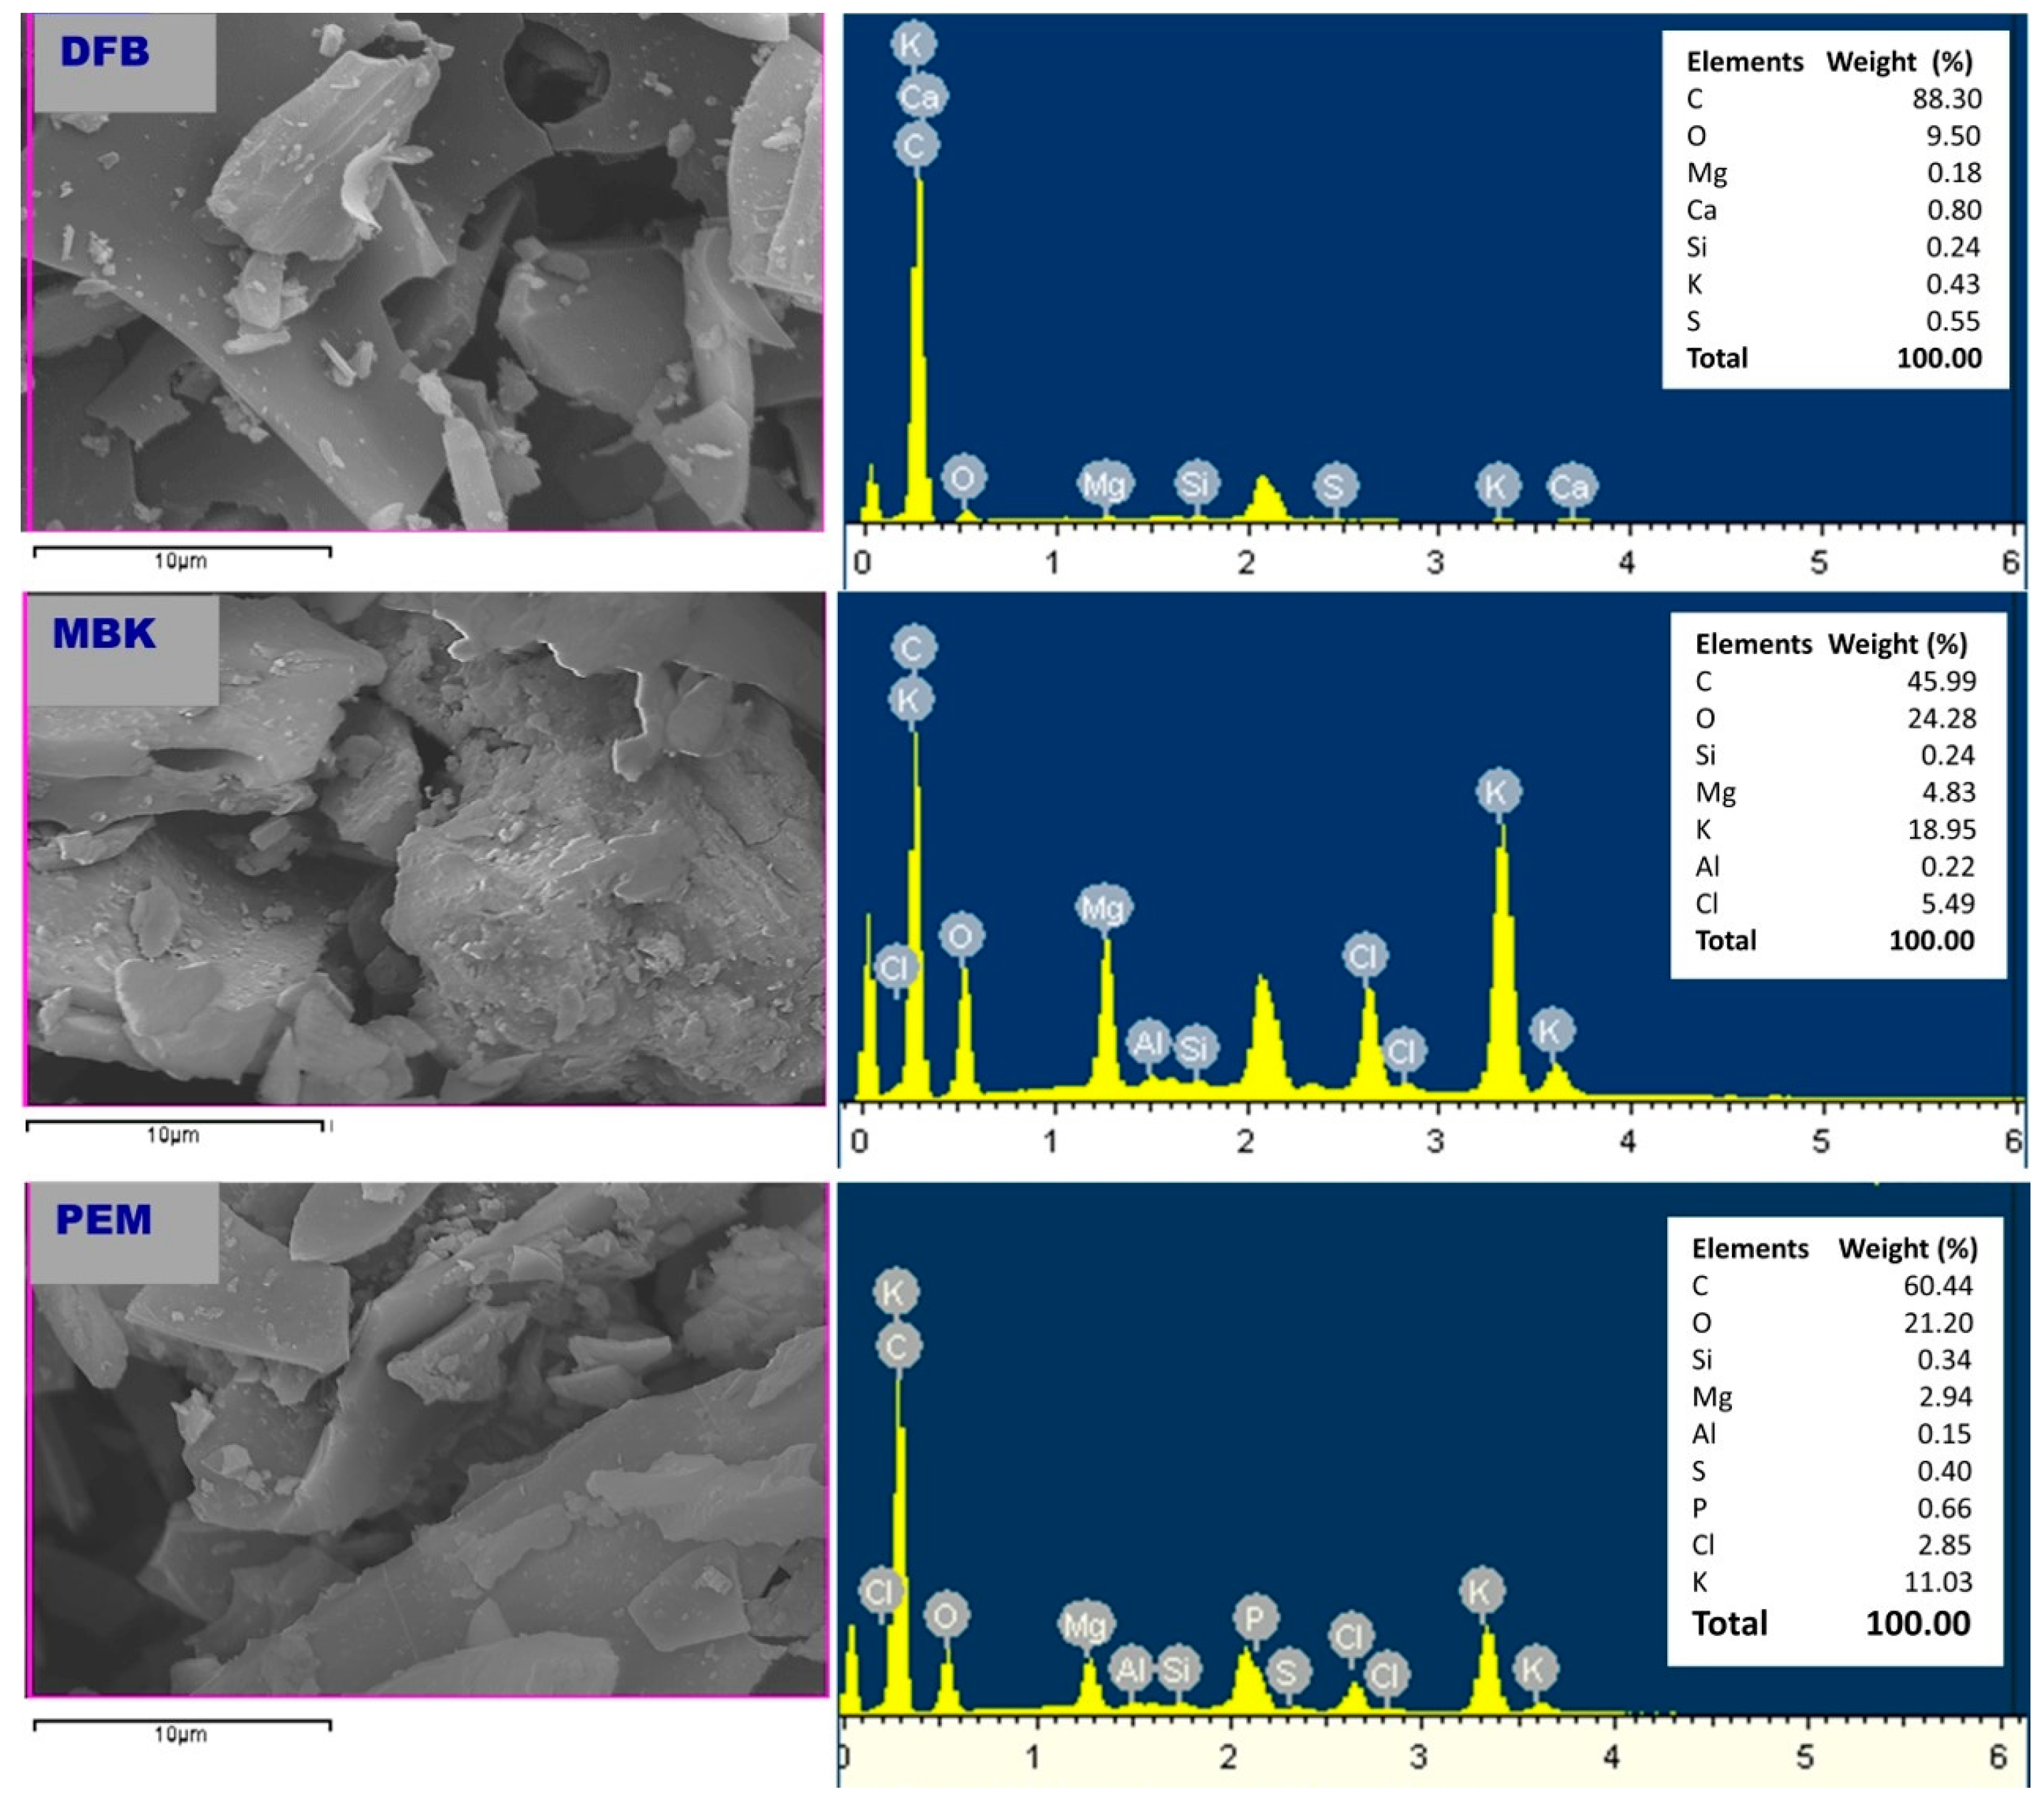
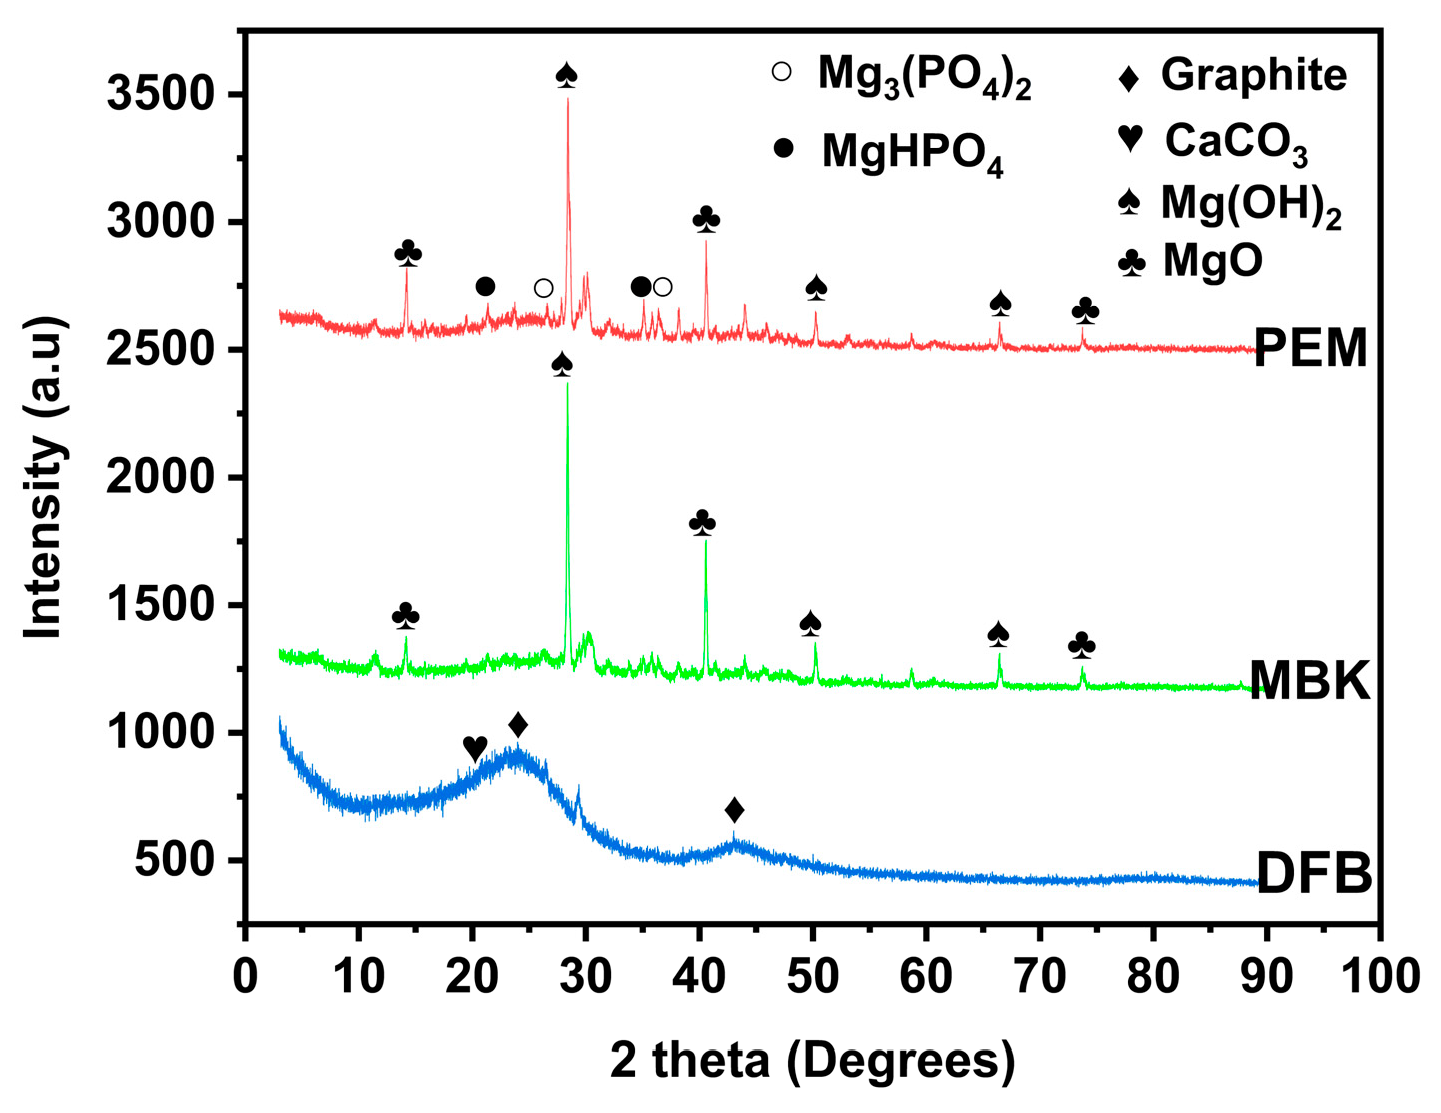
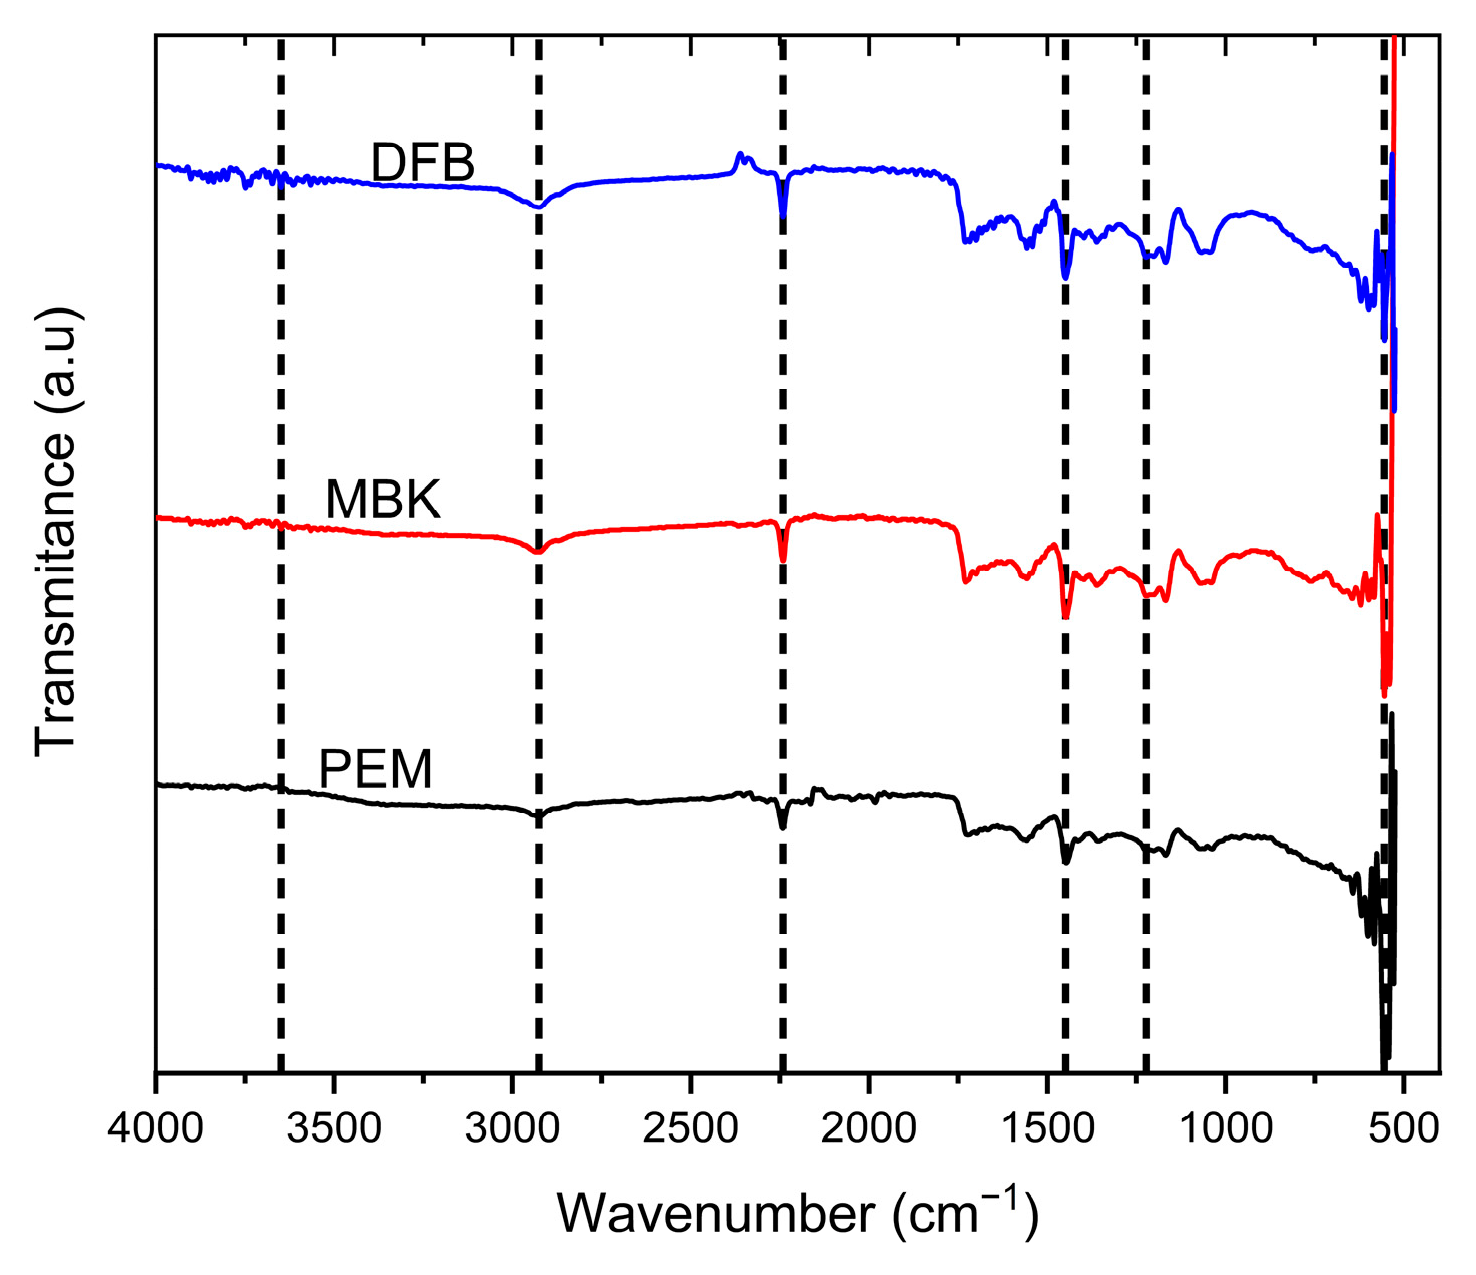
3.2. Surface Morphology, Structural Chemical Composition, and Functional Groups Determination

Scanning electron microscopy (SEM) and SEM/EDS (Energy Dispersive Spectroscopy) was performed to characterize DFB, MBK, and PEM. Corresponding micrographs and spectra are shown in Figure 1 and Figure 2, respectively.
The SEM images of DFB, MBK (biochar after modification with magnesium chloride and potassium hydroxide), and PEM (MBK after sorption of phosphate) is shown in Figure 1. Before treatment, DFB had a distinguishable honeycomb structure with micropores. Consequently, DFB had the highest BET surface area compared to MBK and PEM. After modification and sorption of phosphate, however, the biochar surfaces became more heterogeneous, with crystal particles trapped on them. The decrease in the surface area demonstrated by MBK could be due to the infiltration of micropores in DFB by modification reagent resulting in the collapse of micropores and the subsequent creation of mesopores and macropores, which is manifested by the increase in pore diameter.
The SEM-EDX results (Figure 2) indicated that the main elements in DFB are C (88.3%), O (9.5%), Ca (0.8%), S (0.55%), K (0.43%), Si (0.24%), and Mg (0.18%). In addition to the major elements found in DFB, Cl (5.49%) and Al (0.22%) were also found in MBK. Furthermore, MBK had a higher amount of K and Mg than DFB, showing that Mg, K, Cl, and Al (impurity in modification reagents probably) were loaded to the DFB through the process of modification with magnesium chloride and potassium hydroxide. In addition to the main elements in MBK, PEM had P (0.66%), confirming its ability to adsorb phosphate.
In addition, the structural compositions of DFB, MBK, and PEM were examined with X-ray diffraction techniques (Figure 3). The peaks were identified by matching in qualX 2.0 Software. XRD patterns for DBF reveal the existence of two broad peaks like that of graphene between 2θ = 20° to 30° and 40° to 50°. These peaks could be due to graphite diffraction [30,31]. Other sharp peaks showed mixed inorganic components of calcite [32], quartz, lime, brucite, dolomite, and periclase [30]. New peaks emerged in MBK, providing evidence for the presence of MgO at 2θ = 38° (1 1 1), 42° (200), 67° (3 1 1) [33] and Mg(OH)2 at 2θ = 7.96° (0 0 1), 13.79° (1 0 0), 15.94° (1 0 −1), 21.15° (1 0 −2), 24.01° (2 −1 0), 27.82° (1 0 −3), and 45.01° (3 0 2) [34,35]. Furthermore, additional peaks emerged in PEM due to hydrated Mg3(PO4)2 at 2θ = 4.65° (0 0 2), 6.16° (1 0 0) [36], and, MgHPO4 at 2θ = 4.65° (1 1 0), 5.73° (0 2 0), 6.80° (1 2 0), 13.18° (3 2 −1), and 16.51° (0 5 1) [33,36,37].
The ATR-FITR analysis of biochar sample surface functional groups is shown in (Figure 4). The spectra are comparable in wavenumber range, and the peaks occurred at similar wavelengths. The peaks showed that the biochar surfaces consist of monosubstituted aromatic and aliphatic hydrocarbons. The peaks were observed at wavelengths 3648.82 cm−1, 2925.44 cm−1, 2241.19 cm−1, 1448.84 cm−1, 1222.76 cm−1, between 600–900 cm−1 and 554.87 cm−1 corresponding to O-H (alcohol/phenol), V(C-H) vibration in CH3 or CH2, C=O stretch (aliphatic aldehydes), C=C stretch (aromatic), Aromatic C-O stretching, MgO, and P=O or P-O stretches, respectively [38,39].

3.3. Sorption of Phosphate on MBK

While adsorption describes a phenomenon in which solute particles attach themselves to the surface of an absorbent, adsorption kinetics refers to a curve displaying the rate at which a solute is retained or released from a solution to a solid phase interface for a given quantity of adsorbent at a particular temperature, flow rate or pH [40]. For this study, batch experiments were performed at room temperature (~25 °C) to determine sorption kinetic and isotherm.

3.3.1. Point of Zero Charge (pHpzc)

The plot of ∆pH against the initial pH was used to determine the point of zero charges (pHpzc) for MBK. The pHpzc defines the pH at which the overall charge on the surface of an adsorbent is zero [27]. For MBK, the pHpzc was ~10.3 (Figure 5), indicating that its surface would be positively charged for pH values below 10.3 but negatively charged for pH values above 10.3. According to Nguyen et al. [41], adsorption of cationic and anionic species is favored due to electrostatic attraction between the adsorbent and the sorbate when the adsorbent surface is negatively charged (pH > pHpzc,) or positively charged (pH< pHpzc). Therefore, for MBK, the adsorption of phosphate (anionic species) would be favored for pH values < pHpzc (10.3) because the positive charge surface of MBK would attract the negatively charged phosphate ions.

3.3.2. Sorption Kinetics

Three models were used to describe phosphate sorption kinetics on MBK (Figure 6). The fitted pseudo-first order, pseudo-second order, and, Elovich kinetic models are shown by Equations (13)–(15).
q t = q e 1 exp k 1 t         Pseudo first order
q t = k 2 q e 2 t 1 + k 2 q e t                                                   Pseudo second order
where k1 and k2 are the rate constants for pseudo-first-order (h−1) and pseudo-second-order models (g mg−1 h−1), respectively. While qt and qe signify the adsorbed amounts of Phosphate at a given time and equilibrium (mgg−1), respectively.
q t = 1 B ln AB + 1 B ln t           Elovich
qt denotes sorption capacity at time t (mgg−1), A is the initial sorption rate (mgg−1min−1), and B signifies desorption constant (gmg−1) for a given experiment.
Whereas the pseudo-first-order model describes reversible reactions in which equilibrium exists between the solid and liquid phases, the Elovich model defines chemical adsorption mechanism in nature, and the pseudo-second-order model often favors chemisorption processes that involve valency forces through sharing or exchange of electrons between the adsorbate and adsorbent as a covalent force.
For this study, the experimental data was best simulated by second-order kinetics (R2 = 0.93), showing chemical processes-controlled adsorption. The R2 corresponding to the Elovich and pseudo-first-order kinetics were 0.86 and 0.78, respectively (Table 2).
The largest P adsorbed for the model and experimental data were 19.36 mgg−1 and 19.35 mgg−1, respectively. For proper plant growth, the sufficient concentration of available soil P required is 2 mg/g [42].
Many adsorption mechanisms responsible for phosphate sorption on metal oxide/hydroxides have been reported in the literature [43]. The probable reaction mechanisms driving phosphate sorption on MBK are ion exchange, electrostatic force of attraction, and Lewis acid–base interactions. For pH < pHpzc, phosphate sorption is primarily driven by ion exchange, in which the H2PO4 or HPO4 2− group is exchanged for the OH group to form complexes, this occurrence is accompanied by an increase in the solution pH after adsorption due to exchange of OH- as shown by Equations (16) and (17):
Mg OH 2 s + H 2 PO 4 aq Mg H 2 PO 4 2 s + 2 OH aq
Mg OH 2 s + HPO 4 2 aq MgHPO 4 s + 2 OH aq
In the Lewis acid–base interactions, oxygen anions of the phosphate groups are attracted to the metal active sites forming M-O coordinate bonds (Equations (18)–(20)):
M gO   s + H 2 O l MgO H 2 O + aq
MgO H 2 O + aq + 2 H 2 PO 4 aq Mg H 2 PO 4 2 + 2 OH aq
MgO H 2 O + aq + HPO 4 2 aq MgHPO 4 s + 2 OH aq
In addition to the above, the positive charge surface MBK attracts the negatively charged phosphate ion by the electrostatic force of attraction resulting in a strong bond formation. This result agrees with those reported by Takaya et al. [18].

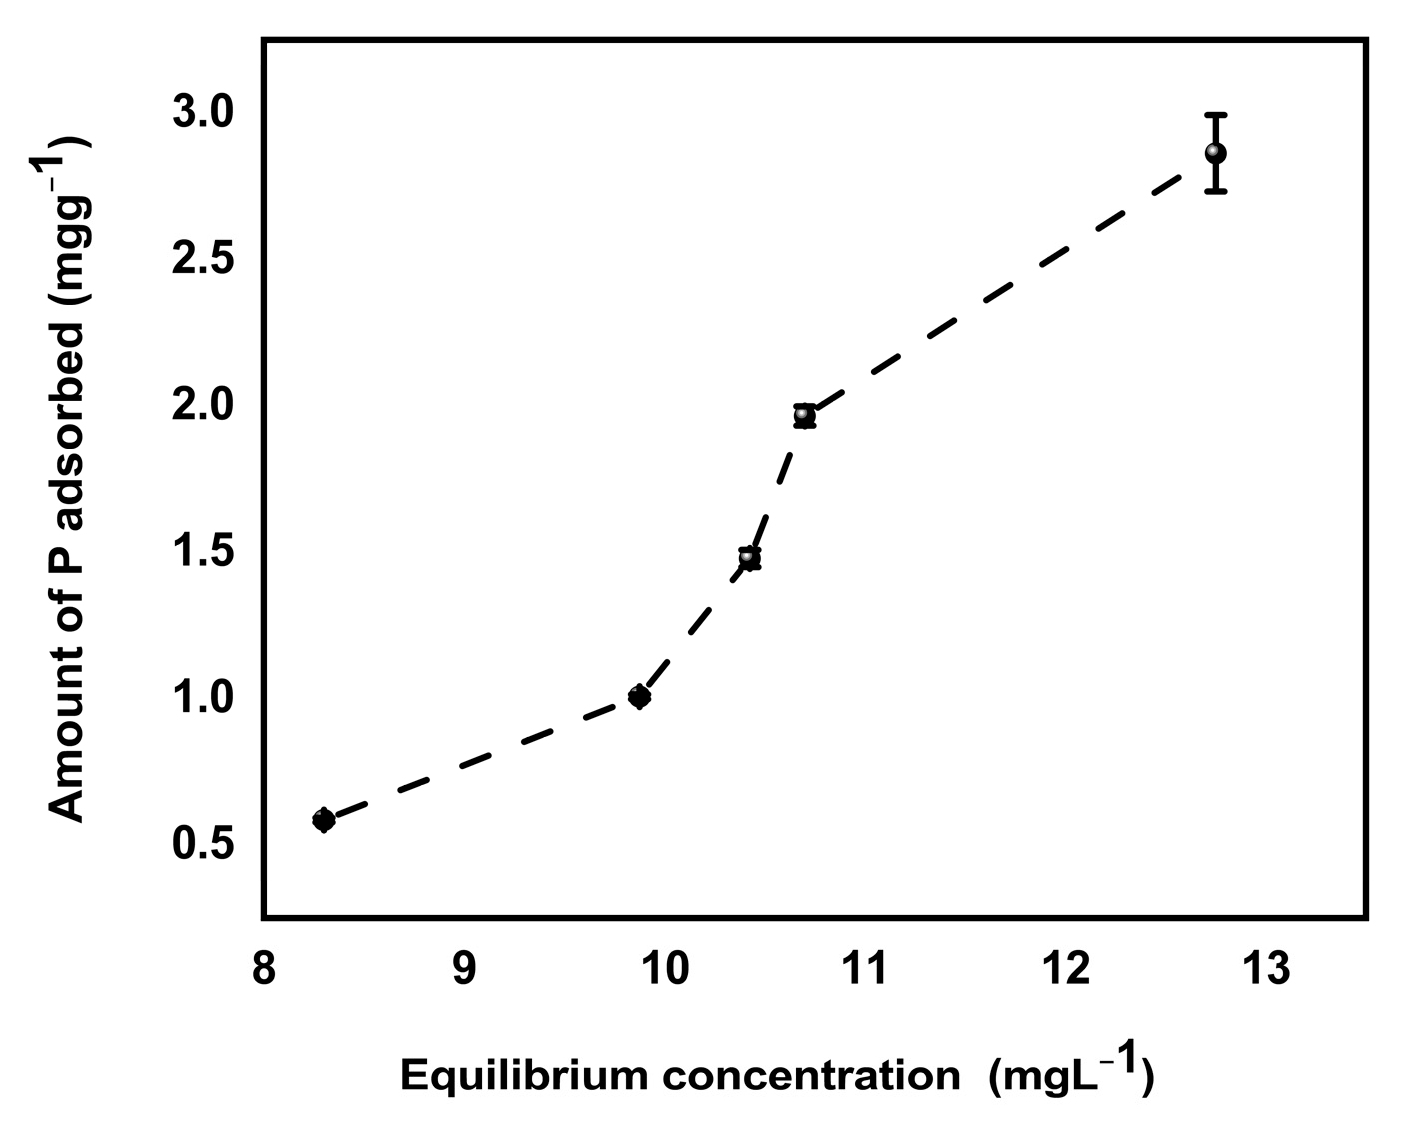
3.3.3. Sorption Isotherms

Adsorption isotherms were used to quantify the phosphate sorption capacity of MBK biochar. Three models, the Langmuir, Freundlich, and Langmuir–Freundlich were employed to simulate the adsorption of phosphate on MBK (Equations (21)–(23)):
qe = K L C e Q 1 + K L C e         Langmuir
qe = K F C e 1 n     Freundlich Isotherm
qe = K L * QCe n 1 + K L Ce n   Langmuir   Freundlich   Isotherm  
where KL and KF represent the Langmuir bonding term related to interaction energies (Lmg−1) and the Freundlich affinity coefficient (mg(1−n) Ln g−1), respectively. Q denotes the Langmuir maximum adsorption capacity (mgg−1), Ce is the equilibrium solution concentration (mgL−1) of the sorbate, qe = the amount of solute adsorbed per gram of the adsorbent at equilibrium (mgg−1) and, n is the Freundlich linearity constant.
The Langmuir–Freundlich adsorption isothermal equation defines the combined empirical adsorption isothermal equations of Freundlich and Langmuir. While the Freundlich model is empirical equations, the Langmuir model assumes monolayer adsorption onto a homogeneous surface with no interactions between the adsorbed molecules [44].
The models used replicated the isotherm data well (Figure 7), with R2 ranging from 0.888 to 0.997 (Table 3). The experimental data fitted Langmuir–Freundlich model best (R2 = 0.997), suggesting that the adsorption of phosphate on MBK is heterogeneous.
The nature of adsorption can be reflected by the value of the separation factor or equilibrium parameter R L ,   defined by R L = 1 1 + 1 + K L C o , where KL (L/mg) represents the Langmuir constant, and Co is the adsorbate initial concentration (mg/L). According to Foo and Hameed [44], adsorption is considered favorable if (0 < RL < 1), unfavorable if (RL > 1), linear for (RL = 1), and irreversible.
If (RL = 0) and, the lower the value R L , the more favorable the adsorption is likely. From our result (Table 3), the maximum monolayer coverage capacity (Q) and the corresponding Langmuir isotherm constant KL were 56.15559 mgg−1 and 0.00709 L/mg, respectively. The experimental separation factors (RL) for different initial concentrations ranged from 0.16 to 0.49, and the R2 value was 0.975, indicating that the equilibrium sorption was favorable. However, the sorption data fitted better to the Langmuir–Freundlich Isotherm model (R2 = 0.997), revealing that the sorption process was heterogeneous. Furthermore, adsorption capacity can be estimated by the constant KF. Whereas 1 n is a function of adsorption’s strength in the adsorption process [45], it signifies heterogeneity. The larger the value of 1 n , the less heterogeneity it shows, and vice versa [46]. Foo and Hameed [44] argued that chemisorption and cooperative adsorption processes are evidence if values of 1 n are less than or greater than one, respectively. For this study, the value of 1 n for Freundlich and Langmuir–Freundlich isotherms were 0.49 and 0.46, respectively (Table 3), implying that chemical processes drove the sorption of Phosphate onto MBK. The R2 values corresponding to the Freundlich and Langmuir–Freundlich model in this study were 0.888 and 0.997, respectively.

3.4. P Retention and Availability in Soil

Batch adsorption by soil/biochar mixture was done to assess the efficiency of biochar amendments on P retention in soil. Results showed that the influence of biochar addition to soil was pH-dependent (Figure 8). At low pH (4), the sorption of P on soil biochar mixture generally improved with increasing mass of biochar added. At low pH, soil dominated by hydroxides of iron and aluminum possess a positive charge due to the association of hydrogen ions with the surface of the hydroxide groups. As a result, the hydroxyl group may be exchanged for other anions (anion exchange), for example, phosphate. A similar result was reported by Hainje [47] in which biochar addition to soil enhanced P retention in different soil types, including sandy soil, whose P retention capacity is naturally very low. This observation is also consistent with the findings of Xu et al. [48]. However, at pH (6.5), P sorption reduced as more quantity of biochar was added to the soil. Since the anion exchange is a reversible phenomenon, part of the adsorbed phosphate ion gained by soil minerals becomes readily available when soil is dominated with hydroxide ions (high pH). Therefore, as more biochar was added to the soil, the soil was more dominated by OH due to its liming property, and consequently, more phosphate was desorbed from the soil. This finding is in accordance with those of Hovi et al. [49]. They discovered that for course texture soil (<2% clay), P adsorption diminished by increasing the mass of biochar in the soil. They ascribed the reduction in P adsorption to anionic molecules in biochar, which adsorb onto soil adsorption sites as natural organic anions resulting in competition for sorption sites, and consequently improving P availability by inhibiting PO4 adsorption.
Retention of phosphate by soil (pH = 5.3) biochar mixture increased with increasing concentration of P added to soil biochar mixture (Figure 9). The enhanced sorption of phosphate at low soil pH can be due to the reaction of available P with hydroxides/oxides of iron and aluminum in soil [50,51], leading to the formation of less soluble compounds such as strengite (FePO4 ·2H2O) and variscite (AlPO4 ·2H2O) as shown by Equation (24). The hydroxides and oxides of metals on soil surfaces adsorbed phosphate ions because oxygen atoms of the phosphate ion donate a lone pair of electrons to fill the outer electron shell of metal atoms which are coordinated with oxygen and hydroxide ions exposed at the surfaces of soil constituents. According to Bolland et al. [51], phosphate ion replaces other anions because it is more strongly adsorbed or forms a more stable compound on soil surfaces which may later diffuse into the crystal lattice of the soil constituents. In addition, MBK biochar had a net positive charge which attracted negatively charged phosphate ions at low pH, as indicated by pHpzc earlier in this study.
If soil pH is increased, however (at least 6.0), the absorbed phosphate in (FePO4 ·2H2O and AlPO4.2H2O) can be released in the soil for plant uptake [52]. Changes in soil pH affect phosphate retention on the soil surfaces by adsorption or release of hydrogen ions. At lower pH, adsorption of hydrogen ions on the soil surface makes it more positively charged, while removing hydrogen ions from the soil surface at higher pH creates a more negative charge on the soil surface [51]. Since phosphate ions are negatively charged, they are attracted to the positively charged soil constituent at low pH and less attracted to the negative charge surface at higher pH. Also, since MBK biochar has liming property, its application in such acid soil raises soil pH, increasing the negative charge on the soil surface and making P more available for plant uptake. Similar findings were reported by Abebe [53]. However, as H2PO4 decreases with P uptake, strengite dissolves to maintain soluble P concentrations Equation (25).
Processes 11 00331 i001
FePO4 ·2H2O + H2O ⇌ H2PO4- + H+ + Fe (OH)3

4. Conclusions

The current study evaluated the P availability of p-enriched modified Douglas fir biochar for probable practicality as an alternative slow-release P fertilizer. Before sorption, the point of zero charges of Douglas fir modified biochar was determined. Results showed that phosphate sorption was favored at a pH less than 10.3, implying that for soil with low pH, P availability would be reduced.
In each case, three models were used to simulate reaction kinetics and isotherm. Results indicated that the sorption of P on MBK was heterogeneous and driven by chemical processes. The maximum P adsorbed corresponding to the best model was 41.19 mg g−1. The smallest and sufficient available soil P concentration required for plant growth has been estimated at 0.0002 mg g−1 [54] and 2 mg g−1 [42], respectively.
P sorption on biochar soil mixture was pH dependent. At lower pH = 4, P sorption improved with increasing mass of biochar added. However, at pH = 6.5, less P was adsorbed as more biochar was added to the soil. At low pH, less P would be available for plants as sorption of P on biochar and soil/biochar would be favored. In contrast, at pH close to neutral, less P is adsorbed and can be available for plants. Therefore, for very low pH, the use of P-enriched Douglas fir biochar should be accompanied by liming to increase the pH and hence P availability. More studies should be done to validate the practicability of P-enriched Douglas fir biochar as soil amendments.

Author Contributions

Conceptualization, B.A. and T.M.; methodology, B.A. and C.N.; software, C.N. and B.A.; validation, C.N., B.A. and N.K.D.; formal analysis, B.A., C.N., N.K.D. and A.H.; investigation, B.A.; resources, T.M.; data curation, B.A. and C.N.; writing—original draft preparation, B.A.; writing—review and editing, B.A. and C.N.; visualization, B.A.; supervision, T.M.; project administration, T.M.; funding acquisition, T.M. All authors have read and agreed to the published version of the manuscript.

Funding

This research received no external funding.

Data Availability Statement

The data that support the findings of this study are available from the corresponding author upon request.

Acknowledgments

Department of Chemistry Mississippi State University, Fulbright organization, and US Department of State for the scholarship awarded to B.A.

Conflicts of Interest

The authors declare no conflict of interest.

Abbreviations

ATR-FTIRAttenuated total reflectance Fourier Transformed Infrared Spectroscopy
BETBrunner–Emmet–Teller
DFBDouglas fir biochar
EDXEnergy dispersive spectroscopy
MBMagnesium chloride modified Douglas fir biochar
MBKMagnesium chloride plus potassium hydroxide modified Douglas fir biochar
PEMP-enriched biochar (post sorption MBK)
pHpzc)pH point of zero charge
SEMScanning electron microscopy
US EPAUnited States Environmental Protection Agency
XRDX-ray diffraction

References

  1. Ngatia, L.W.; Hsieh, Y.P.; Nemours, D.; Fu, R.; Taylor, R.W. Potential Phosphorus Eutrophication Mitigation Strategy: Biochar Carbon Composition, Thermal Stability and PH Influence Phosphorus Sorption. Chemosphere 2017, 180, 201–211. [Google Scholar] [CrossRef] [PubMed] [Green Version]
  2. Kim, K.; Vikrant, K.; Kim, K.; Sik, Y.; Tsang, D.C.W.; Fai, Y. Engineered/Designer Biochar for the Removal of Phosphate in Water and Wastewater. Sci. Total Environ. 2017, 616, 1242–1260. [Google Scholar] [CrossRef]
  3. Geoghegan, E.K.; Cardon, Z.; Vallino, J.J. Decomposition and Methane Production in Anaerobic Environments: A Case Study in a Methanogenic Bioreactor; 2016; pp. 1–20. Available online: https://scholar.google.com/citations?view_op=view_citation&hl=en&user=6kfVFL4AAAAJ&citation_for_view=6kfVFL4AAAAJ:Y0pCki6q_DkC (accessed on 4 June 2020).
  4. Keplinger, K.O.; Houser, J.B.; Tanter, A.M.; Hauck, L.M.; Beran, L. Cost and Affordability of Phosphorus Removal at Small Wastewater. Available online: https://p2infohouse.org/ref/34/33892.pdf (accessed on 4 June 2020).
  5. Litke, D.W. Review of Phosphorus Control Measures in the United States and Their Effects on Water Quality; US Department of the Interior, US Geological Survey: Washington, DC, USA, 1999.
  6. Ogonek, P. Phosphorus Adsorption through Engineered Biochars Produced from Local Waste Products; University of Dayton: Dayton, OH, USA, 2016. [Google Scholar]
  7. Torabian, S.; Qin, R.; Noulas, C.; Lu, Y.; Wang, G. Biochar: An organic amendment to crops and an environmental solution. AIMS Agric. Food 2021, 6, 401–415. [Google Scholar] [CrossRef]
  8. Yang, X.; Zhang, S.; Ju, M.; Liu, L. Preparation and Modification of Biochar Materials and Their Application in Soil Remediation: Review. Appl. Sci. 2019, 9, 1365. [Google Scholar] [CrossRef] [Green Version]
  9. Genon, J.G.; de Hepcee, N.; Duffy, J.E.; Delvaux, B.; Hennebert, P.A. Iron Toxicity and Other Chemical Soil Constraints to Rice in Highland Swamps of Burundi. Plant Soil 1994, 166, 109–115. [Google Scholar] [CrossRef]
  10. Panda, S.K.; Baluska, F.; Matsumoto, H. Aluminum Stress Signaling in Plants. Plant Signal. Behav. 2009, 4, 592–597. [Google Scholar] [CrossRef] [Green Version]
  11. Onyango, D.A.; Entila, F.; Dida, M.M.; Ismail, A.M.; Drame, K.N. Mechanistic Understanding of Iron Toxicity Tolerance in Contrasting Rice Varieties from Africa: 1. Morpho-Physiological and Biochemical Responses. Funct. Plant Biol. 2019, 46, 93–105. [Google Scholar] [CrossRef] [Green Version]
  12. Jaiswal, S.K.; Naamala, J.; Dakora, F.D. Nature and Mechanisms of Aluminium Toxicity, Tolerance and Amelioration in Symbiotic Legumes and Rhizobia. Biol. Fertil. Soils 2018, 54, 309–318. [Google Scholar] [CrossRef]
  13. Tripathi, D.K.; Singh, S.; Singh, S.; Mishra, S.; Chauhan, D.K.; Dubey, N.K. Micronutrients and their diverse role in agricultural crops: Advances and future prospective. Acta Physiol. Plant. 2015, 37, 1–14. [Google Scholar] [CrossRef]
  14. Jiang, S.Y.N. Adsorption of Phosphorus by Modified Clay Mineral Waste Material Relating to Removal of It from Aquatic System. Int. J. Environ. Monit. Anal. 2014, 2, 36. [Google Scholar] [CrossRef]
  15. Nierves, M.C.P.; Salas, F.M. Assessment of Soil Phosphorus and Phosphorus Fixing Capacity of Three Vegetable Farms at Cabintan, Ormoc City, Leyte. World J. Agric. Res. 2015, 3, 70–73. [Google Scholar] [CrossRef]
  16. Akgül, G.; Maden, T.B.; Diaz, E.; Jiménez, E.M. Modification of Tea Biochar with Mg, Fe, Mn and Al Salts for Efficient Sorption of PO3-4 and Cd2+ from Aqueous Solutions. J. Water Reuse Desalin. 2019, 9, 57–66. [Google Scholar] [CrossRef]
  17. Yao, Y.; Gao, B.; Chen, J.; Yang, L. Engineered Biochar Reclaiming Phosphate from Aqueous Solutions: Mechanisms and Potential Application as a Slow-Release Fertilizer. Environ. Sci. Technol. 2013, 47, 8700–8708. [Google Scholar] [CrossRef] [PubMed]
  18. Takaya, C.A.; Fletcher, L.A.; Singh, S.; Okwuosa, U.C.; Ross, A.B. Recovery of Phosphate with Chemically Modified Biochars. J. Environ. Chem. Eng. 2016, 4, 1156–1165. [Google Scholar] [CrossRef]
  19. Fang, C.; Zhang, T.; Li, P.; Jiang, R.F.; Wang, Y.C. Application of Magnesium Modified Corn Biochar for Phosphorus Removal and Recovery from Swine Wastewater. Int. J. Environ. Res. Public Health 2014, 11, 9217–9237. [Google Scholar] [CrossRef] [Green Version]
  20. Uchida, R. Essential Nutrients for Plant Growth. In Plant Nutrient Management in Hawaii’s Soils, Approaches for Tropical and Subtropical Agriculture; Silva, J.A., Uchida, R., Eds.; College of Tropical Agriculture and Human Resources, University of Hawaii at Manoa: Honolulu, HI, USA, 2000; pp. 31–55. [Google Scholar]
  21. Millaleo, R.; Ivanov, A.G.; Mora, M.L.; Alberdi, M. Manganese as Essential and Toxic Element for Plants: Transport, Accumulation and Resistance Mechanisms. J. Soil Sci. Plant Nutr. 2010, 10, 476–494. [Google Scholar] [CrossRef] [Green Version]
  22. Rout, G.; Samantaray, S.; Das, P. Aluminium Toxicity in Plants: A Review. Agronomie 2001, 21, 3–21. [Google Scholar] [CrossRef]
  23. Lauricella, D.; Butterly, C.; Tang, C. Comparison of a Range of Amendments on Alleviating Al and Mn Toxicity in Wheat. Managing SubsoilL Acidity (GRDC DAN00206); 2017. Available online: https://www.dpi.nsw.gov.au/__data/assets/pdf_file/0004/735430/subsoil-factsheet-no.6-ltu-oa.pdf (accessed on 4 June 2020).
  24. Vlamis, J.; Williams, D.E. Liming Reduces Alluminium and Magnese Toxicity in Acid Soils. Available online: http://calag.ucanr.edu/Archive/?article=ca.v016n09p6 (accessed on 18 April 2020).
  25. Yao, Y.; Gao, B.; Inyang, M.; Zimmerman, A.R.; Cao, X.; Pullammanappallil, P.; Yang, L. Removal of Phosphate from Aqueous Solution by Biochar Derived from Anaerobically Digested Sugar Beet Tailings. J. Hazard. Mater. 2011, 190, 501–507. [Google Scholar] [CrossRef]
  26. Karunanayake, A.G.; Navarathna, C.M.; Gunatilake, S.R.; Crowley, M.; Anderson, R.; Mohan, D.; Perez, F.; Pittman, C.U.; Mlsna, T. Fe3O4 Nanoparticles Dispersed on Douglas Fir Biochar for Phosphate Sorption. ACS Appl. Nano Mater. 2019, 2, 3467–3479. [Google Scholar] [CrossRef]
  27. Premalatha, R.; Parameswari, E.; Malarvizhi, P.; Avudainayagam, S.; Davamani, V. Sequestration of Hexavalent Chromium from Aqueous Medium Using Biochar Prepared from Water Hyacinth Biomass. Chem. Sci. Int. J. 2018, 22, 1–15. [Google Scholar] [CrossRef]
  28. Kose, R.; Miyanishi, T.; Okayama, T.; Phuong, M.; Thi, D. Pore Characteristics & Adsorption Capacities of Biochars Derived from Rice Residues as Affected by Variety and Pyrolysis Temperature. Am. J. Innov. Res. Appl. Sci. 2016, 2, 179–189. [Google Scholar]
  29. Fahmi, A.H.; Samsuri, A.W.; Jol, H.; Singh, D. Physical Modification of Biochar to Expose the Inner Pores and Their Functional Groups to Enhance Lead Adsorption. RSC Adv. 2018, 8, 38270–38280. [Google Scholar] [CrossRef] [PubMed] [Green Version]
  30. Dehkhoda, A.M.; Ellis, N.; Gyenge, E. Electrosorption on Activated Biochar: Effect of Thermo-Chemical Activation Treatment on the Electric Double Layer Capacitance. J. Appl. Electrochem. 2014, 44, 141–157. [Google Scholar] [CrossRef]
  31. Siburian, R.; Sihotang, H.; Lumban Raja, S.; Supeno, M.; Simanjuntak, C. New Route to Synthesize of Graphene Nano Sheets. Orient. J. Chem. 2018, 34, 182–187. [Google Scholar] [CrossRef] [Green Version]
  32. Ishizawa, N.; Setoguchi, H.; Yanagisawa, K. Structural evolution of calcite at high temperatures: Phase v unveiled. Sci. Rep. 2013, 3, 9–11. [Google Scholar] [CrossRef] [Green Version]
  33. Yi, M.; Chen, Y. Enhanced Phosphate Adsorption on Ca-Mg-Loaded Biochar Derived from Tobacco Stems. Water Sci. Technol. 2018, 78, 2427–2436. [Google Scholar] [CrossRef]
  34. Nagai, T.; Hattori, T.; Yamanaka, T. Compression mechanism of brucite: An investigation by the structural refinement under pressure Sample: P = 2.5 GPa. Am. Miner. 2000, 85, 760–764. Available online: http://www.crystallography.net/cod/9002349.html (accessed on 4 June 2020). [CrossRef]
  35. Xie, F.; Wu, F.; Liu, G.; Mu, Y.; Feng, C.; Wang, H. Removal of Phosphate from Eutrophic Lakes through Adsorption by in Situ Formation of Magnesium Hydroxide from Diatomite. Environ. Sci. Technol. 2013, 48, 582–590. [Google Scholar] [CrossRef]
  36. Schroeder, L.W.; Mathew, M.; Brown, W.E. XO4n- ion hydration. The crystal structure of magnesium phosphate docosahydrate. J. Phys. Chem. 1978, 82, 2335–2340. [Google Scholar] [CrossRef]
  37. Qian, C.X.; Sun, L.Z.; Yu, X.N. Chemosynthesis of Nano-Magnesium Phosphates and Its Characterization. Dig. J. Nanomater. Biostruct. 2016, 11, 1099–1103. [Google Scholar]
  38. Lustosa Filho, J.F.; Penido, E.S.; Castro, P.P.; Silva, C.A.; Melo, L.C.A. Co-Pyrolysis of Poultry Litter and Phosphate and Magnesium Generates Alternative Slow-Release Fertilizer Suitable for Tropical Soils. ACS Sustain. Chem. Eng. 2017, 5, 9043–9052. [Google Scholar] [CrossRef]
  39. Dhananasekaran, S.; Palanivel, R.; Pappu, S. Adsorption of Methylene Blue, Bromophenol Blue, and Coomassie Brilliant Blue by α-Chitin Nanoparticles. J. Adv. Res. 2016, 7, 113–124. [Google Scholar] [CrossRef] [PubMed]
  40. Kajjumba, G.W.; Emik, S.; Öngen, A.; Kurtulus Özcan, H.; Aydın, S. Modelling of Adsorption Kinetic Processes—Errors, Theory and Application. Adv. Sorpt. Process Appl. 2018. [Google Scholar] [CrossRef] [Green Version]
  41. Nguyen, T.H.; Pham, T.H.; Nguyen Thi, H.T.; Nguyen, T.N.; Nguyen, M.V.; Tran Dinh, T.; Nguyen, M.P.; Do, T.Q.; Phuong, T.; Hoang, T.T.; et al. Synthesis of Iron-Modified Biochar Derived from Rice Straw and Its Application to Arsenic Removal. J. Chem. 2019, 2019, 5295610. [Google Scholar] [CrossRef]
  42. Barak, P. Macronutrients and Micronutrients. Available online: https://soils.wisc.edu/facstaff/barak/soilscience326/macronut.htm (accessed on 20 June 2020).
  43. Li, M.; Liu, J.; Xu, Y.; Qian, G. Phosphate Adsorption on Metal Oxides and Metal Hydroxides: A Comparative Review. Environ. Rev. 2016, 24, 319–332. [Google Scholar] [CrossRef]
  44. Foo, K.Y.; Hameed, B.H. Insights into the Modeling of Adsorption Isotherm Systems. Chem. Eng. J. 2010, 156, 2–10. [Google Scholar] [CrossRef]
  45. Zhou, L.; Zhu, D.; Zhang, S.; Pan, B.; Hu, X.; He, M.; Li, S.; Wei, Y.; Chen, Z.; Wu, F.; et al. Phosphorus Recovery from Biogas Fermentation Liquid by Ca–Mg Loaded Biochar. J. Environ. Sci. 2015, 29, 106–114. [Google Scholar]
  46. Everaert, M.; Warrinnier, R.; Baken, S.; Gustafsson, J.-P.; De Vos, D.; Smolders, E. Phosphate-Exchanged Mg-Al Layered Double Hydroxides: A New Slow Release Phosphate Fertilizer. ACS Sustain. Chem. Eng. 2016, 4, 4280–4287. [Google Scholar] [CrossRef]
  47. Hainje, D. Phosphorus Retention in a Variety of Soils Amended with Biochar or Fe-Coated Biochar. In GSA Annual Meeting in Indianapolis, Indiana, USA—2018); Geological Society of America Abstracts with Programs: Indianapolis, Indiana, 2018; Volume 50, p. 95-25. [Google Scholar] [CrossRef]
  48. Xu, G.; Wei, L.L.; Sun, J.N.; Shao, H.B.; Chang, S.X. What Is More Important for Enhancing Nutrient Bioavailability with Biochar Application into a Sandy Soil: Direct or Indirect Mechanism? Ecol. Eng. 2013, 52, 119–124. [Google Scholar] [CrossRef]
  49. Hovi, J.; Soinne, H.; Tammeorg, P.; Turtola, E.; Helenius, J. Phosphorus Sorption in Biochar Amended Soils. In Proceedings of the 2nd Nordic Biochar Seminar, Helsinki, Finland, 14–15 February 2013; p. 50. [Google Scholar]
  50. Fariha, N.; Idrus, M.; Jamion, N.A.; Omar, Q.; Ahmad, S.; Sheikh, I.; Majid, Z.A.; Yong, S.K. Magnesium-Impregnated Biochar for the Removal of Total Phosphorous from Artificial Human Urine. Int. J. Eng. Technol. 2018, 7, 218–222. [Google Scholar] [CrossRef]
  51. Bolland, M.D.A.; Allen, D.G.; Barrow, N.J. Sorption of Phosphorus by Soils: How It Is Measured in Western Australia; Bulletin 4591; Department of Primary Industries and Regional Development: Perth, Australia, 2003; p. 4591. [Google Scholar]
  52. Bohn, H.L.; Myer, R.A.; George, A.O. Soil Chemistry; John Wiley & Sons: Hoboken, NJ, USA, 2002. [Google Scholar]
  53. Abebe, M. Nature and Management of Acids Soils in Ethiopia. Available online: http://hdl.handle.net/123456789/2185 (accessed on 31 July 2020).
  54. Idris, O.A.A.; Ahmed, H.S. Phosphorus Sorption Capacity as a Guide for Phosphorus Availability of Selected Sudanese Soil Series. Afr. Crop Sci. J. 2012, 20, 59–65. [Google Scholar]
Figure 1. Scanning electron microscope (SEM) images of untreated Douglas fir biochar (DFB), DFB treated with MgCl2 ·6H2O + KOH solutions (MKB), and MBK treated with KH2PO4 solution (PEM).
Processes 11 00331 g001
Figure 2. Energy-dispersive X-ray (EDX) spectra of untreated Douglas fir biochar (DFB), DFB treated with MgCl2 ·6H2O + KOH solutions (MKB), and MBK treated with KH2PO4 solution (PEM).
Processes 11 00331 g002
Figure 3. XRD spectra of untreated Douglas fir biochar (DFB), DFB treated with MgCl2 ·6H2O + KOH solutions (MKB), and MBK treated with KH2PO4 solution (PEM).
Processes 11 00331 g003
Figure 4. ATR FTIR Spectra of untreated Douglas fir biochar (DFB), DFB treated with MgCl2 ·6H2O + KOH solutions (MKB), and MBK treated with KH2PO4 solution (PEM).
Processes 11 00331 g004
Figure 5. Point of zero charges of Douglas fir biochar treated with MgCl2 ·6H2O + KOH solutions (MKB).
Processes 11 00331 g005
Figure 6. Phosphate adsorption kinetics for Douglas fir biochar treated with MgCl2 ·6H2O + KOH solutions (MKB).
Processes 11 00331 g006
Figure 7. adsorption isotherm for Phosphate on MBK.
Processes 11 00331 g007
Figure 8. P retention and availability of soil/Douglas fir biochar treated with MgCl2 ·6H2O + KOH solutions (MKB) mixture. (Values shown are mean of n = 3, error bars shown as standard deviation).
Processes 11 00331 g008
Figure 9. P retention of soil/Douglas fir biochar treated with MgCl2 ·6H2O + KOH solutions (MKB) mixture. (Values shown are mean of n = 3, error bars shown as standard deviation).
Processes 11 00331 g009
Table 1. BET Surface analysis of DFB, MBK, and PEM.
SampleBET Surface Area (m2 g−1)Adsorption Average Pore Diameter (Å)Total Pore Volume (cm3 g−1)
MBK2.3926.080.001
PEM137.2312.720.048
DFB528.102.700.042
DFB = untreated Douglas fir biochar, MBK = DFB treated with MgCl2 ·6H2O + KOH solutions, and PEM = MBK treated with KH2PO4 solution. The DFB pore diameter value may be uncertain due to N2′s diameter being (~3 Å) higher than DFB’s pore diameter.
Table 2. MBK Phosphate adsorption Kinetic parameters.
Modelk1 (h−1) or k2 (gmg−1h−1)qe (mgg−1)R2
Pseudo-first-order kinetics0.5418.990.78
Elovich--0.86
Pseudo-second-order kinetics0.1219.360.93
k1 (h−1) and k2 (gmg−1h−1) are the rate constants for pseudo-first order and pseudo-second order models, qe (mgg−1) is the adsorbed amounts of phosphate at equilibrium.
Table 3. MBK phosphate adsorption isotherm parameters.
ModelKL (L/mg)KF (mg(1−n) Lng−1nQ(mg/g)R2Adjusted R2
Langmuir0.00709--56.160.9570.947
Freundlich-2.141762.01272-0.8880.861
Langmuir –Freundlich 8.59 × 10 - 5 -2.1507841.190.9970.995
Q (mg/g) is the maximum adsorption capacity; KL (L/mg) is a Langmuir constant; KF (mg1−n Ln/g) is the Freundlich adsorption constant, n (dimensionless) is the adsorption affinity.
Disclaimer/Publisher’s Note: The statements, opinions and data contained in all publications are solely those of the individual author(s) and contributor(s) and not of MDPI and/or the editor(s). MDPI and/or the editor(s) disclaim responsibility for any injury to people or property resulting from any ideas, methods, instructions or products referred to in the content.

