1. Introduction
Using fluidized bed spray coating, it is possible to adjust the chemical and mechanical properties of solid matter in order to produce tailor-made particles for a variety of applications. Particles functionalized in this way are used in various branches of industry, such as, for example, the food industry [
1,
2], the pharmaceutical industry [
3], and the automotive industry [
4]. During coating in a fluidized bed, particles are fluidized and sprayed with a liquefied material, such as a solution, a suspension, or a hot melt. Depending on the material, the mechanism by which the coating agent solidifies on the particle surface may be one of the following: evaporation of a solvent, crystallization, or a chemical reaction. In this fluidized bed process, the thickness of the coating, its roughness and texture and, thus, the structural and mechanical properties of the coating, can be influenced by the process conditions. Furthermore, it is possible to control the agglomeration of particles by choosing from a range of different coating materials and adjusting the process settings. Since particle agglomeration is detrimental to the application under consideration, it is crucial to be able to control this phenomenon. The particles investigated in this work were intended to be used as crash absorbers during ship collisions. For this purpose, granular matter was used as a filling material in the double-hull of ships in order to reduce the risk of damage, and subsequent environmental pollution, during collisions. Therefore, their mechanical properties were of particular importance, in terms of energy dissipation, but also regarding maintenance and risk of release into the environment.
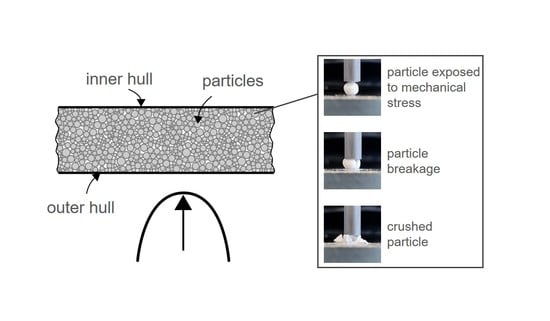
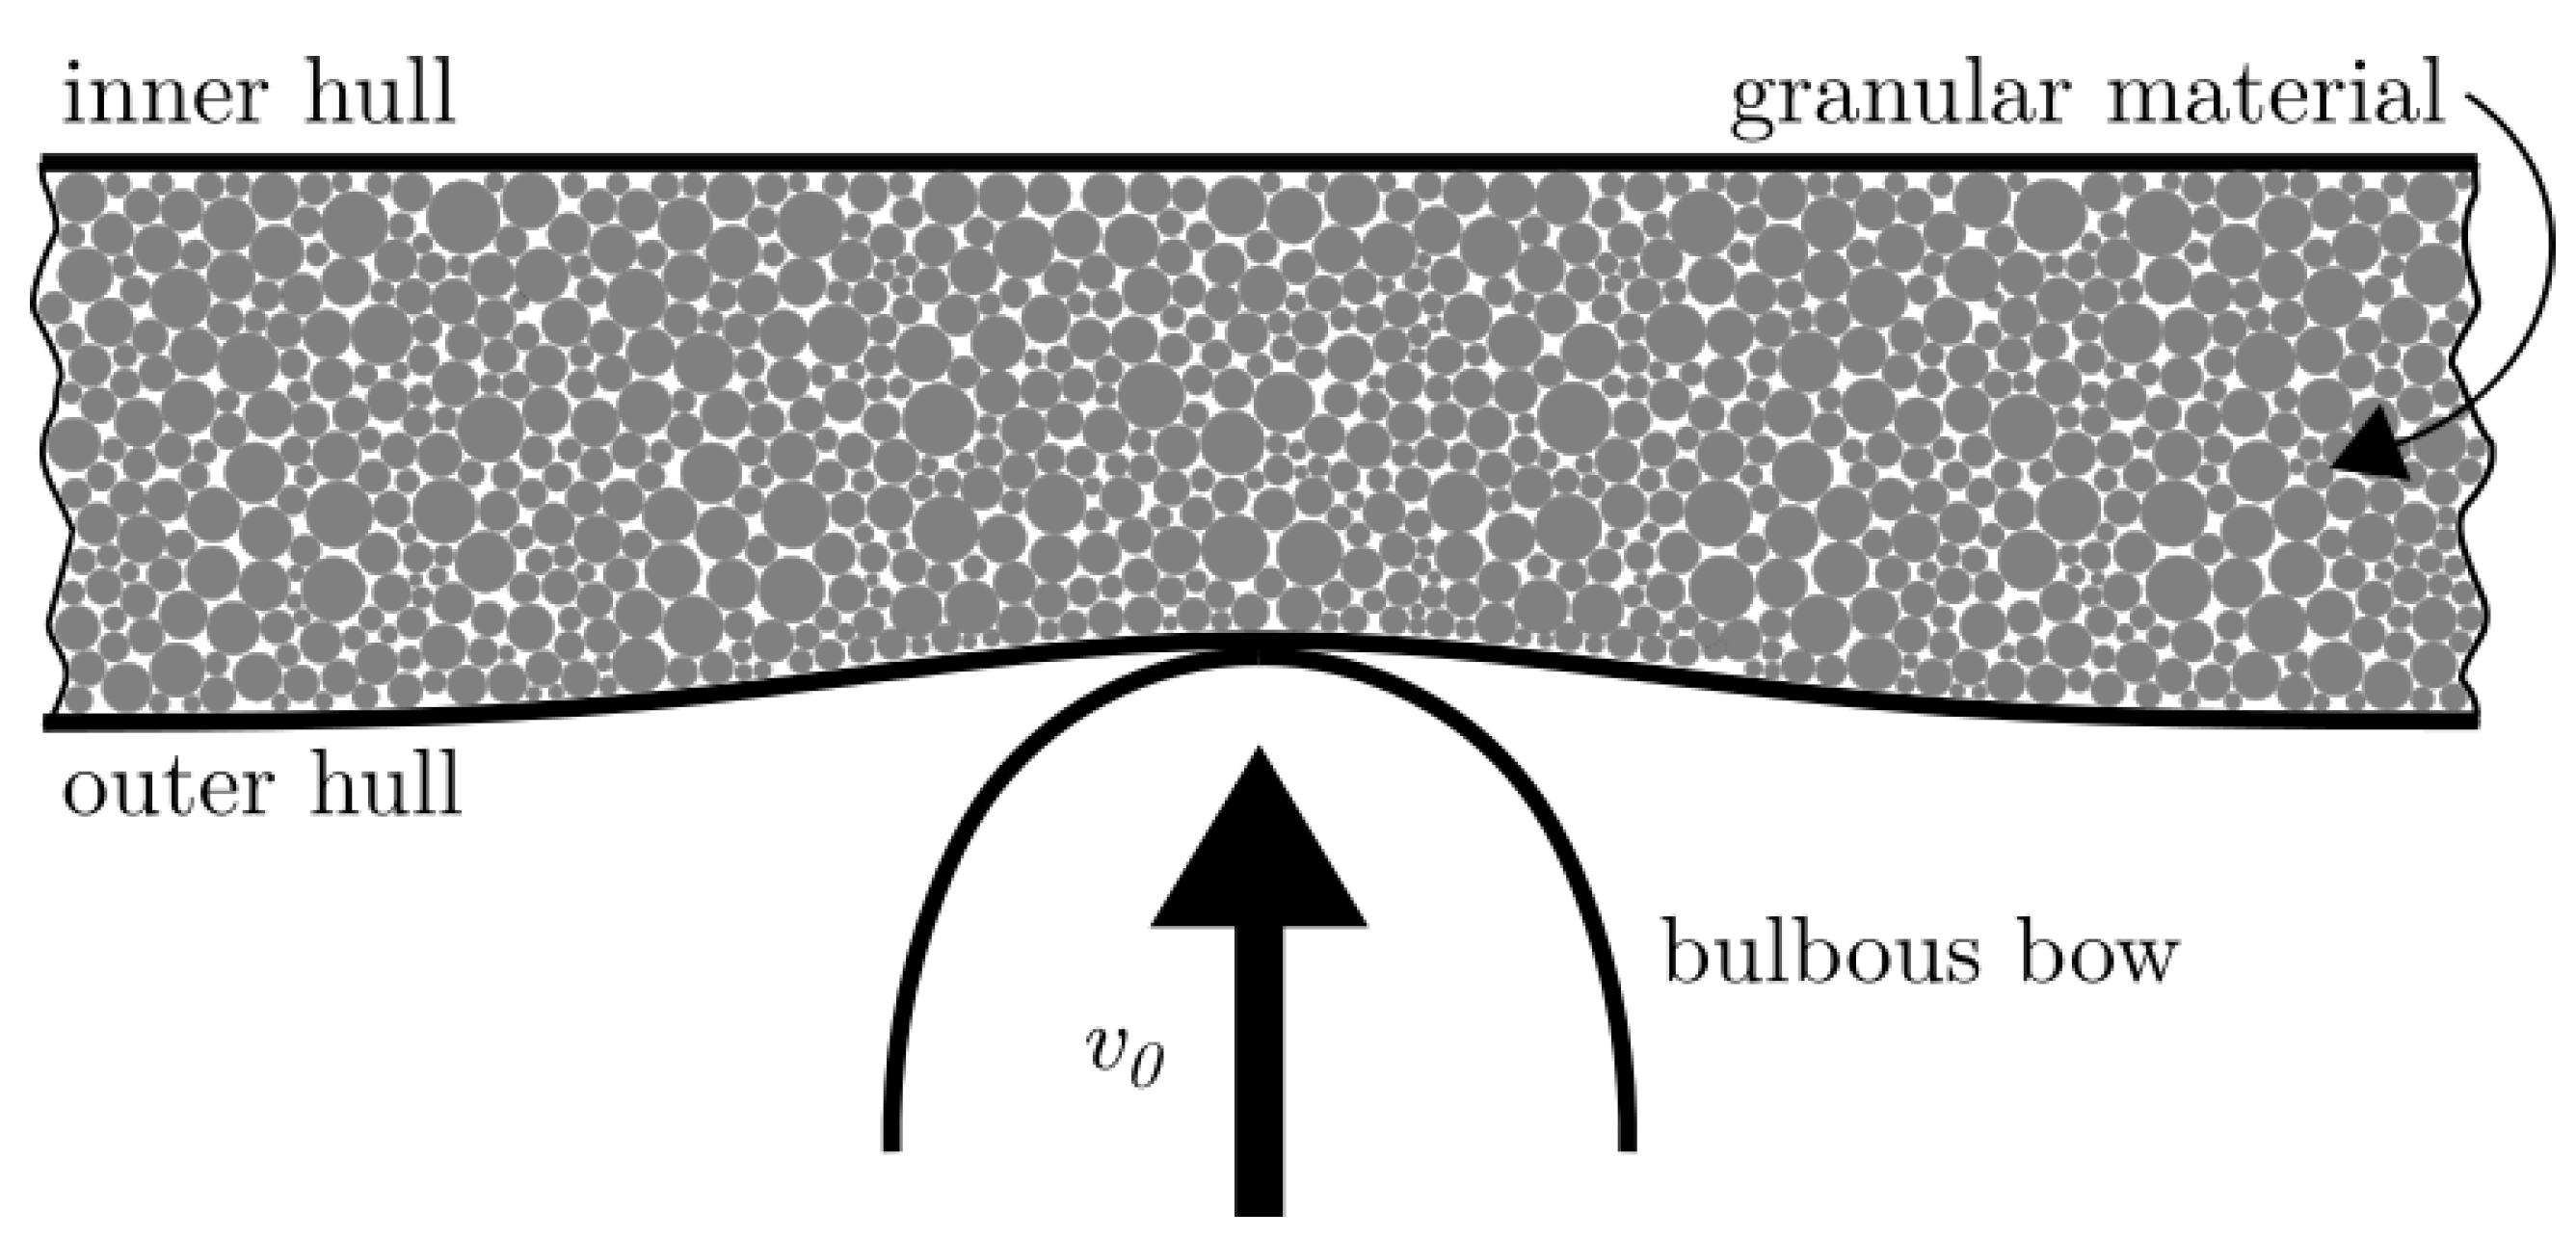
The idea of filling the double-hull of ships with granular material to increase their collision safety has already been investigated in [
5,
6], as depicted in
Figure 1. The concept is based, on the one hand, on the fact that the collision loads are transferred from the outer to the inner hull, which is why the entire structure is involved in the load absorption, and, on the other hand, on the energy dissipation due to the breaking particles. In contrast, if the load is applied exclusively to the outer hull, it ruptures at an early stage, resulting in penetration of the inner hull. This often leads to major structural damage to the ships involved, often in connection with considerable environmental damage [
7]. The influence of granular filling materials on the strength of a double-hull structure has already been investigated [
8,
9]. In model tests with unfilled and filled double-hull structures, into which a punch, in the form of a bulbous bow, was pressed, an increase in energy absorption by an average of 60% was found [
10]. These results, in addition to other tests, led to the conclusion that granular expanded glass was the most suitable material, due to its chemical and mechanical properties [
9]. The idea of increasing the strength of a material by means of a coating has already been investigated in [
11,
12,
13]. In these studies, porous metal foams were coated with nickel to improve their mechanical properties. The coating led to an increase in impact protection and strengthening under dynamic loads.
Based on these findings, a new approach is being pursued, in which the granular material introduced in [
9] is coated with different materials in a fluidized bed spray coating process. This work investigated the influence of two different coating materials on the mechanical properties of the granules, and to what extent these properties could be improved, with the goal of producing new particles tailored to the application in mind. The coatings used have to fulfil the same requirements as the granules themselves, primarily regarding the applicable shipbuilding standards and requirements for environmental friendliness in the event of leakage from the double-hull. All of these requirements can be found in detail in [
5]. In addition to an improvement concerning the energy dissipation upon breakage, such coatings have another decisive advantage. Since particles are constantly in motion against each other and are, thus, exposed to friction in a moving ship, material degradation, due to dynamic load, is one of the main challenges for a granular filling material. If the double-hull is filled or emptied, such as, for example, maintenance reasons, the particles are exposed to additional mechanical stress. This material degradation has a negative effect on the mechanical properties of the granules, thus reducing the strength of the material. With regard to this disadvantage of the material selected, a coating can also provide a remedy.
In order to find a suitable coating material for the given purpose, several experiments, with uncoated and coated particles, were carried out. Single particle compression tests, and abrasion and multi-particle compression tests, served to investigate the material properties of the granules. Moreover, the influence of the coating on the surface roughness and the energy absorption was investigated. In order to present the results of this work, the paper is structured as follows. First, the respective materials, the experimental setups, and the underlying theories are presented in
Section 2. The experimental outcomes and the different influences of the coating materials used on the material properties are shown in
Section 3, together with statistical evaluations of the results. Finally,
Section 4 gives a short conclusion on the findings and an outlook on future work.
2. Materials and Methods
The following section focuses on a description of the materials and procedures for the production of coated particles and on the characterizations and analytical methods used in this study. The latter includes measurements to investigate the structural and mechanical properties of the particles, as well as statistical evaluation of the obtained data.
2.1. Materials
As primary particles, Poraver
® expanded glass particles, with a diameter between 2 and 4 mm, were used. Due to their highly porous structure and, therefore, their low density of 464 kg/m
3, combined with their relatively high mechanical stability, as was apparent from a crushing force of 14–22 N [
9], Poraver
® particles already meet most of the requirements for granular filling materials in ships, as formulated in [
5].
As coating materials, Candelilla wax (Novero GmbH, Hamburg, Germany) and the two-component silicone SILIXON10 (Silikonfabrik.de, Ahrensburg, Germany) were used. The Candelilla wax was composed of hydrocarbons, wax ester, alcohols, sterols and natural resins, free fatty acids, and inorganic residue [
14]. Its melting point was 66.23 ± 0.17 °C and it had a minimum film-forming temperature of 43.3 °C, along with further properties, as determined in [
15]. After solidification, SILIXON10 had elastic material behavior and a hardness of 10 ± 2 ShA°. For better visibility, red dye was added to the liquid coating materials. Both coating materials were chosen based on their promising film forming behaviours and further material properties. Using these materials, the formation of uniform coating layers that reduced abrasion upon dynamic loads and improved mechanical behaviour in a particle bulk, due to their comparatively soft and elastic nature, especially in the case of silicone, could be achieved.
2.2. Coating Experiments
The coating experiments were performed using the
ProCell® 5 LabSystem with the fluidized bed process chamber
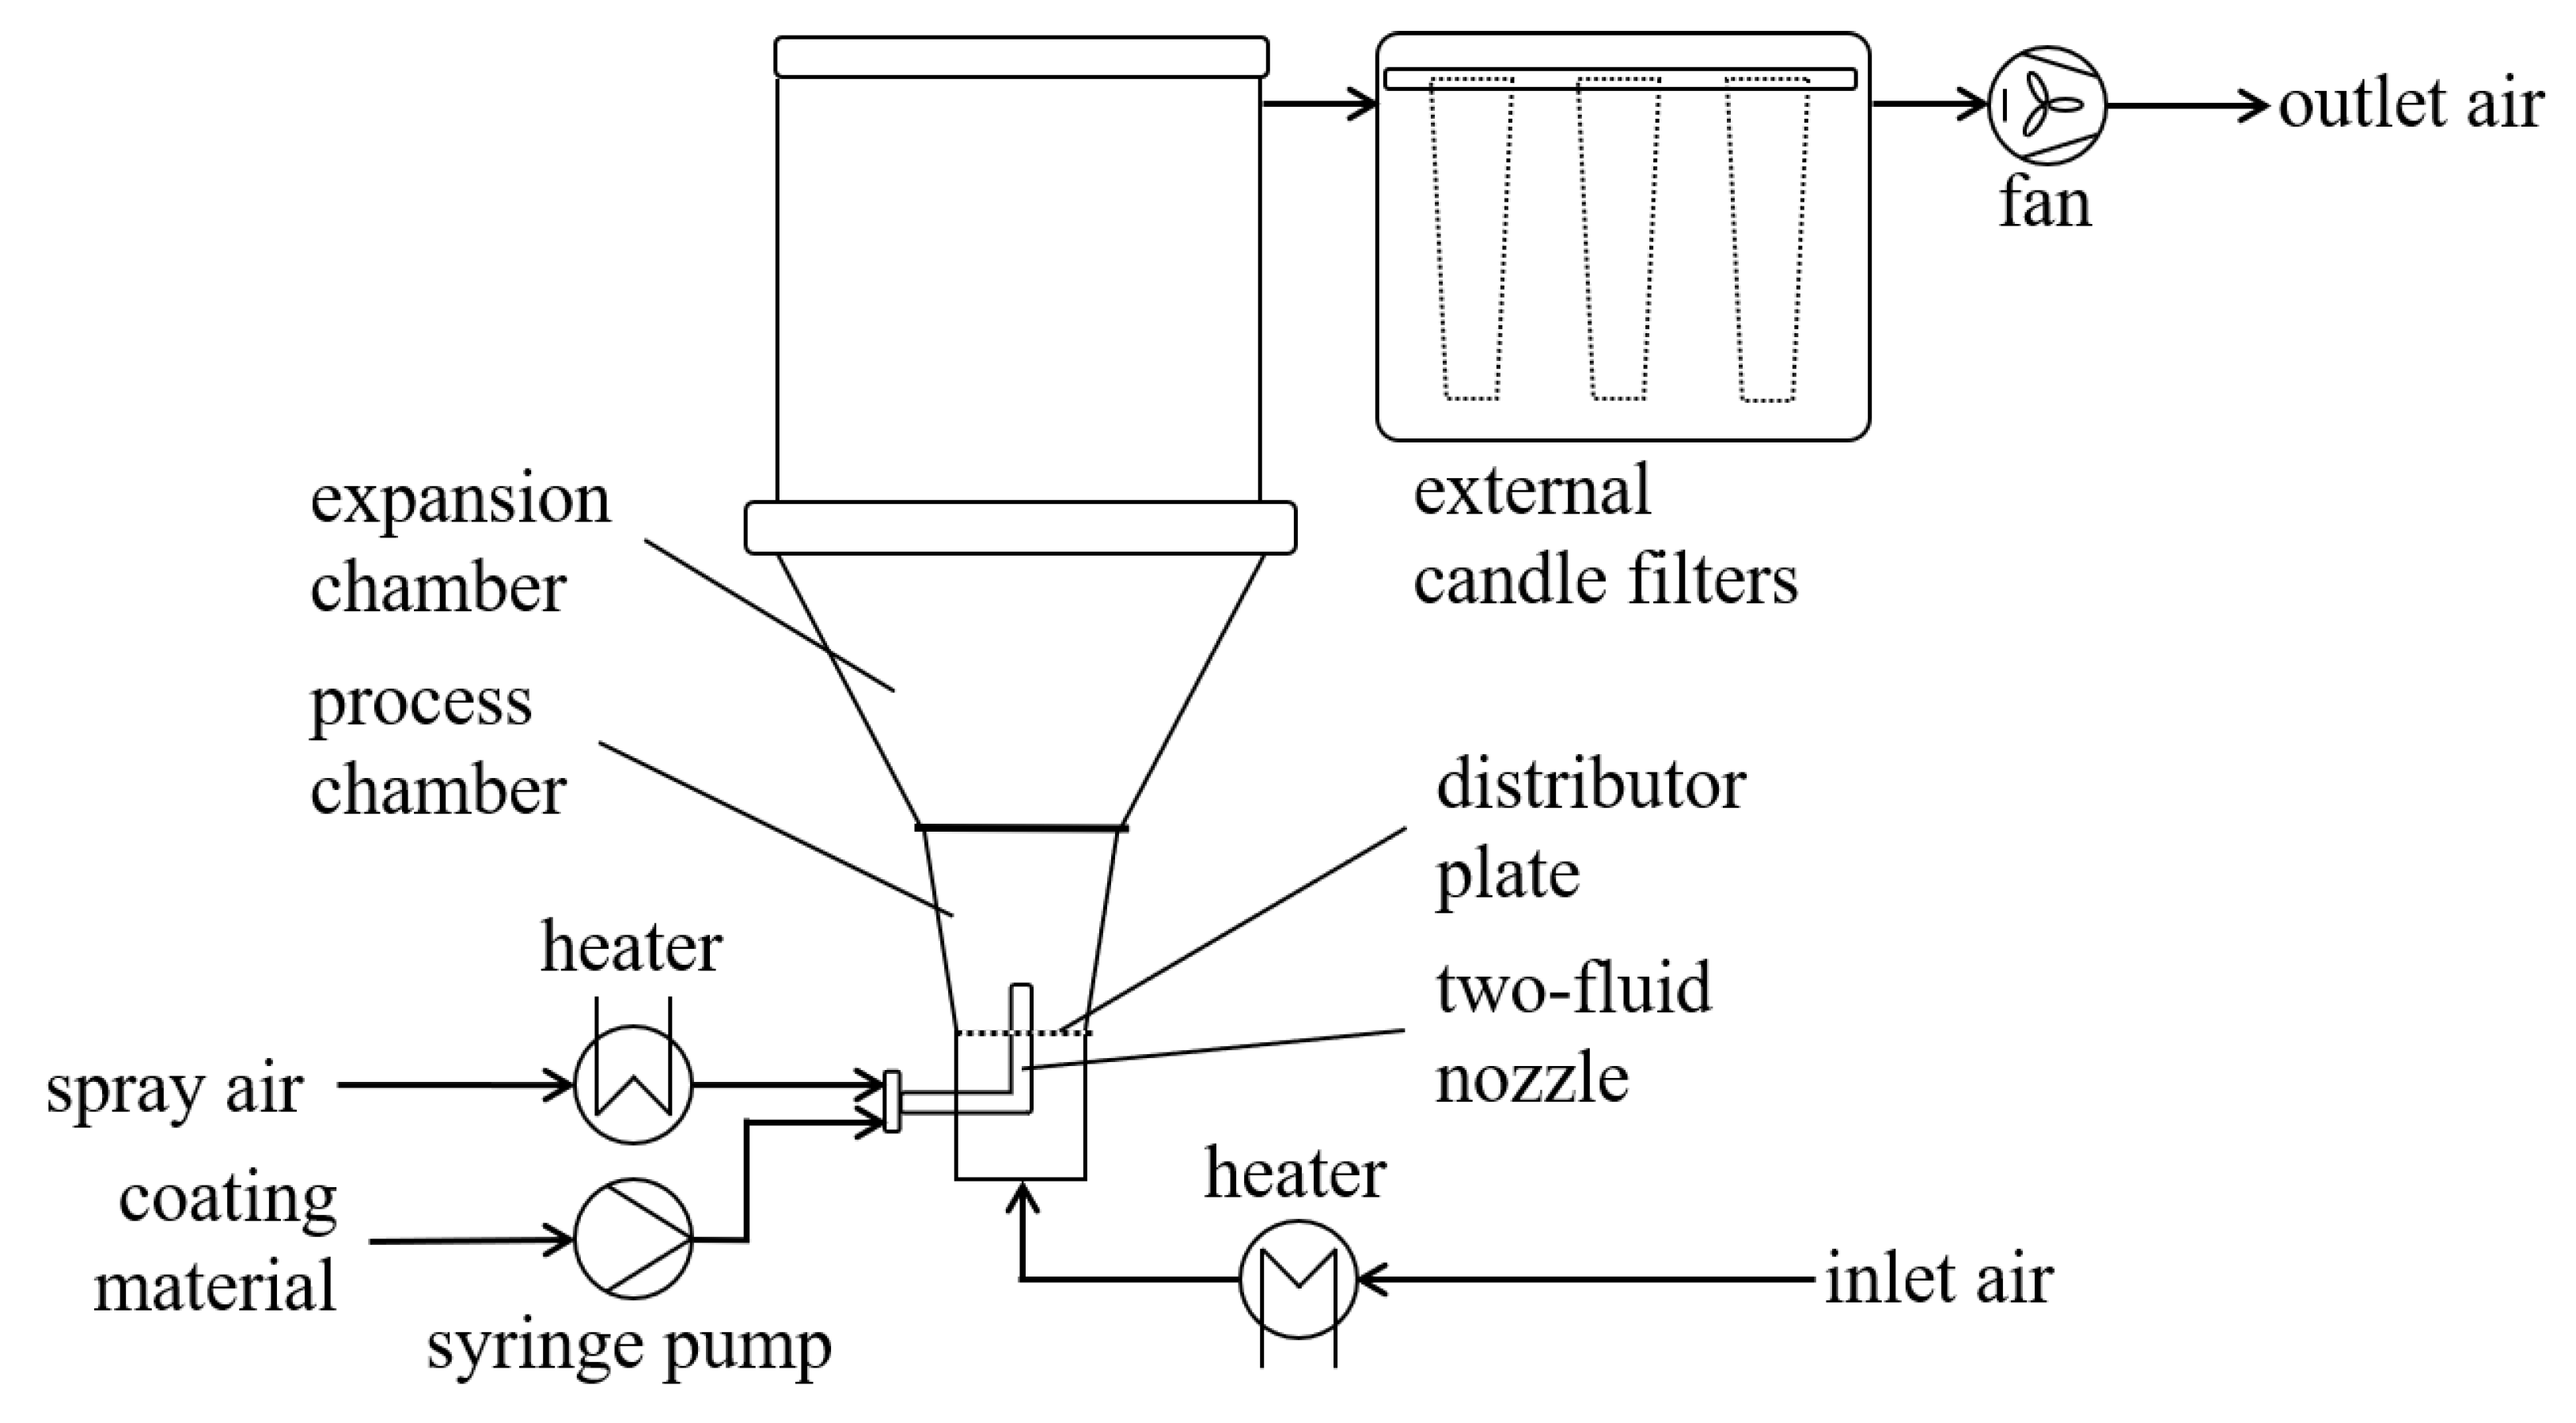
GF3 (Glatt, Weimar, Germany), having a diameter of 180 mm at the gas inlet. As shown in
Figure 2, both the process and the expansion chamber were of conical shape and the outlet air was filtered in an external filter unit. The coating liquid was conveyed via a syringe pump (LA 100, Landgraf Laborsysteme HLL GmbH, Langenhagen, Germany) and atomized with compressed air using a two-fluid nozzle (970-S4, Düsen-Schlick GmbH, Untersiemau, Germany) with an orifice size of 1.2 mm. For the wax coating, the nozzle was installed centrally in the sieve plate distributor (mesh size 105 µm) in bottom-spray configuration. To inject the silicone, top-spray configuration of the nozzle was chosen, due to the shorter distance between syringe and nozzle. The experiments were carried out batch-wise with an initial bed mass of 0.5 kg glass particles. A quantity of 310 mL of the coating material was injected per batch.
Based on several preliminary experiments varying the fluidization air flow rate and temperature, as well es the spray rate and spray air pressure, facilitated the selection of suitable parameters for a wax coating process, as well as a silicone coating process. The experimental parameters for the final run with either material are listed in
Table 1.
For the melt coating, the fluidization air temperature had to be adjusted in such a way that the temperature in the process chamber lay between the melting point and minimum film forming temperature of Candelilla wax, so as to enable solidification and formation of a smooth and uniform layer on the particle surface. Solidification of the silicone occurred due to vulcanization after mixing both components. The vulcanization was temperature-dependent and accelerated at higher temperatures.
2.3. Surface Roughness
The surface roughness of coated and uncoated particles was measured using a
3D Laser Scanning Confocal Microscope VK160K (Keyence, Osaka, Japan). To obtain the three-dimensional surface structure and height information, a defined measurement area was scanned at different positions along the vertical axis, so that the focal point on the sample changed. The resulting 3D surface profile could then be evaluated with regard to the surface roughness, described by the sequence of peaks and valleys of varied height, depth, and intervals on the particle surface [
16]. In this work, the arithmetical mean height, according to DIN EN ISO 4287:2010-07 [
17], is used as a roughness quantifier. For each sample, seven particles each were analyzed in two different areas of the surface at 20X magnification.
2.4. Particle Density and Porosity
The particle density was determined using a helium pycnometer AccuPyc 1330 (Micromeritics, Norcross, GA, USA) with a 10 cm3 sample cup. Based on the Boyle–Mariotte law, and using the known volumes and pressures of the sample and reference chamber, the sample volume and, consecutively, the density, were calculated. For each sample, the chamber was filled with helium six times, producing six density values, from which a mean particle density was calculated. To obtain the closed-pore porosity, whereby the pores caould not be accessed by helium, the measurement was repeated using a 1 cm3 sample cup with a portion of the sample crushed manually to ensure that the fine powder did not contain any more pores. As a result, the skeletal density was obtained. From both densities, particle and skeletal, the closed-pore porosity was calculated.
2.5. Mechanical Tests
As initially described, the mechanical properties of coated particles, particularly in comparison to untreated particles, represent one of the most important aspects to take into account when investigating the suitability of the particles as a crash absorber. Thus, several mechanical tests, including single- and multiple-particle experiments, were conducted to mimic the different stresses the particles were likely to endure in the double-hull of a ship.
2.5.1. Abrasion Resistance
To quantify the mass loss due to abrasion, as a result of collisions and friction between several particles, as well as between particles and walls, a mechanical test, inspired by the Los Angeles abrasion test [
18], was conducted. A 1000 mL plastic container was filled with particles up to a height of 3 cm, which corresponded to a volume of approximately 220 mL. The filled container was inserted into a
Turbula® mixer (Type 2F, Willy A. Bachofen AG, Muttenz, Switzerland), where it was rotated in three spatial directions at 72 rpm. After approximately one hour, the rotation was stopped and the content of the container was sieved, thus separating dust and smaller particle fragments from the primary particles. Afterwards, the fractions were weighed and the mass was compared to the initial particle mass to determine the mass loss due to mechanical stress.
2.5.2. Single-Particle Compression Test
In order to investigate the influence of the coating on breakage behavior and the energy-absorbing capabilities of the particles, a uniaxial compression test was carried out. The test was conducted using a
Texture Analyser TA.XTPlus (Stable Micro Systems, Godalming, UK) with a 50 N load cell and a sensitivity of 0.001 N. In this setup, single particles could be crushed between a metal plate and a downward-moving punch. As described in [
19], the particles were sieved beforehand to ensure the results were comparable to experiments with uncoated particles, see [
19]. The wax particles were sieved with mesh sizes of 2 mm, 2.5 mm, 3.25 mm, and 4 mm. However, the silicone-coated particles had to be distributed and measured by hand, due to their stickiness. Since small silicone-coated particles had agglomerated during the coating process, they had to be separated from each other, leading to rupture of the silicone bridges between particles and to possible damage in the coating. Furthermore, the diameter of each particle was determined by measuring the distance between punch and plate, when a load of 0.09 N was detected. Afterwards, the punch was moved downwards with a velocity of 50 µm/s until 35% of the maximum strain was reached. The required number of particles in each sample to guarantee reliable results was calculated using the small-sampling theory, as mentioned in
Section 2.6.
To evaluate the results in a similar manner as in [
19], the Hertzian contact model was used, as described in [
20], to calculate the contact forces
from which the Young’s modulus could then be determined by fitting the first 2% of the stress–strain curves. A prerequisite for this, was that the material between which the particles were crushed could be assumed rigid, i.e., the Young’s modulus of plate and punch was significantly higher than the particle’s Young’s modulus
. The particle’s Poisson’s ratio
was set to 0.3, as recommended in [
21], and the particle’s diameter
, as well as the total displacement
s, were gained from each experiment, respectively. In addition to the Young’s modulus, the crushing strength was calculated
using the force measured at the breakage point
and the measured particle diameter
.
Moreover, the energy absorbed during the crushing was determined by computing the area under each force–displacement curve with the trapezoidal integration method. In this work, the Matlab® function trapz(x,y) was used for these calculations.
2.5.3. Multi-Particle Compression Test
The test setup for the multi-particle uniaxial compression test was based on the oedometer test, which is used in geotechnics to determine the settlement behavior of soils, and is described in DIN 18135 [
22]. This test consisted of a steel cylinder with an inner diameter
of 50 mm, standing on a solid plate made of the same material. The cylinder was loosely filled with particles with a total mass of 7.1 g for all tested samples. It was important to avoid vibration of the cylinder in order to avoid compact filling. However, the top surface was then smoothed to ensure uniform force application by the punch. The punch, the cylinder, and the plate could be assumed to be rigid bodies. For this reason, only vertical strains were observed. The test was carried out at a constant compression rate of 1 mm/min until a maximum strain of approximately 11 mm was reached. The results of this test were used to generate stress–strain curves to determine the Young’s modulus for different phases of the test. In addition, the absorbed energy was calculated in the same way as for the single-particle tests, using the Matlab
® function
trapz(
x,
y).
2.6. Statistical Methods
Due to the structure of Poraver
® particles and their size distribution, the experimental results and, thus, the material properties varied, even though the samples were divided into three diameter fractions, as investigated in [
19] for uncoated particles. For this reason, several granules were tested, also for the coated particles, which is why it was necessary to determine a reasonable and statistically relevant sample size. In order to gain the smallest possible number of tests, while still obtaining meaningful results, the small-sampling theory [
23] was used. As this method was already used to determine sample sizes for the experimental testing of rock properties [
24], which was a similar material to that used in our study, it was determined that it should provide a good approach. Furthermore, in order to evaluate the data gained from single-particle experiments, a correlation analysis was carried out, based on the Pearson correlation coefficient [
25]
with the cross-correlations E between two random variables
a and
b and the standard deviations of these variables
and
. The correlation between the two variables could be confirmed with a positive correlation coefficient.
In order to obtain an averaged curve for the multi-particle pressure tests, the experimental results were first fitted, due to the different data sets. This was done using the least squares method [
23] to generate a polynomial function for each curve. From this, the averaged stress–strain curve could be determined in the next step.
3. Evaluation and Results
This section outlines the results of experiments based on the methods described in the previous section. It highlights the effect on the mechanical properties of uncoated particles. Furthermore, it underlines the differences between Candelilla wax and silicone as coating materials.
3.1. Coating Quality
Using temperature-sensitive or high-viscosity materials to coat particles can make the fluidized bed process challenging. In the case of Candelilla wax, which has a physical state strongly dependent on temperature, a temperature above the melting point has to be ensured along the hose and in the nozzle through which the fluid is conveyed. Otherwise, solidification of the wax is likely to occur, ultimately resulting in a blockage and shutdown of the liquid spray. At the same time, the temperature within the process chamber must be below the melting point to allow the injected wax droplets to cool down and form a film on the particle surface.
An additional challenge is posed by the broad size distribution of the glass particles with a d
3,10 of 2.2 mm and a d
3,90 of 3.8 mm. Thus, segregation might occur which leads to bigger particles being accumulated in the bottom of the bed and smaller particles floating on top of the bed. To achieve a well mixed fluidized bed, the gas velocity needs to be sufficiently high [
26]. However, at higher gas velocities, smaller particles are at risk of being elutriated in addition to the higher collision velocity increasing abrasion and breakage of particles.
Several preliminary experiments were conducted in order to identify suitable operational conditions. Setting the process parameters according to
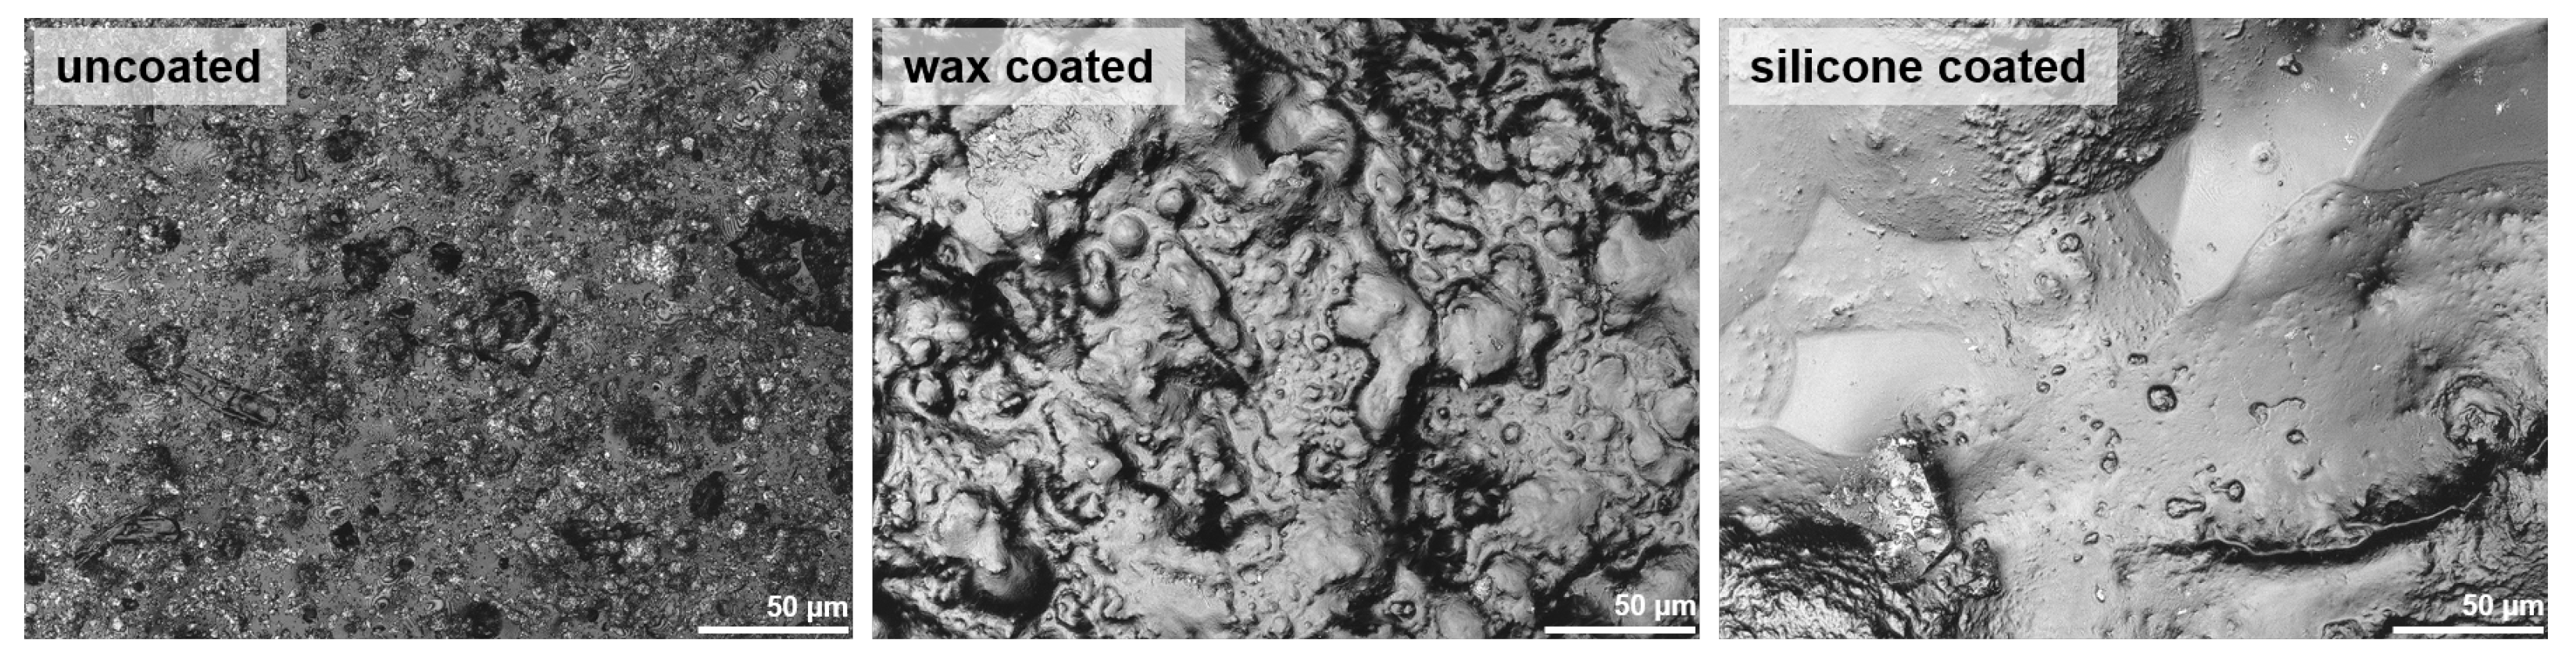
Table 1, an adequate coating was achieved with no noticeable amount of agglomerates or uncoated particles in the product. The fluidization of the particle bed was constantly observed during the experiment. If the fluidization became less pronounced, due te the particles growing in size and density, the volume flow of the fluidization air was adjusted. Between smaller and larger particles, no difference in the coating quality could be detected, so the fluidized bed seemed to be well mixed. The glass particles were completely covered by a uniform wax coating layer with a mean thickness of 101.4 µm, as shown in
Figure 3. A qualitative evaluation of the coating layer, as depicted in
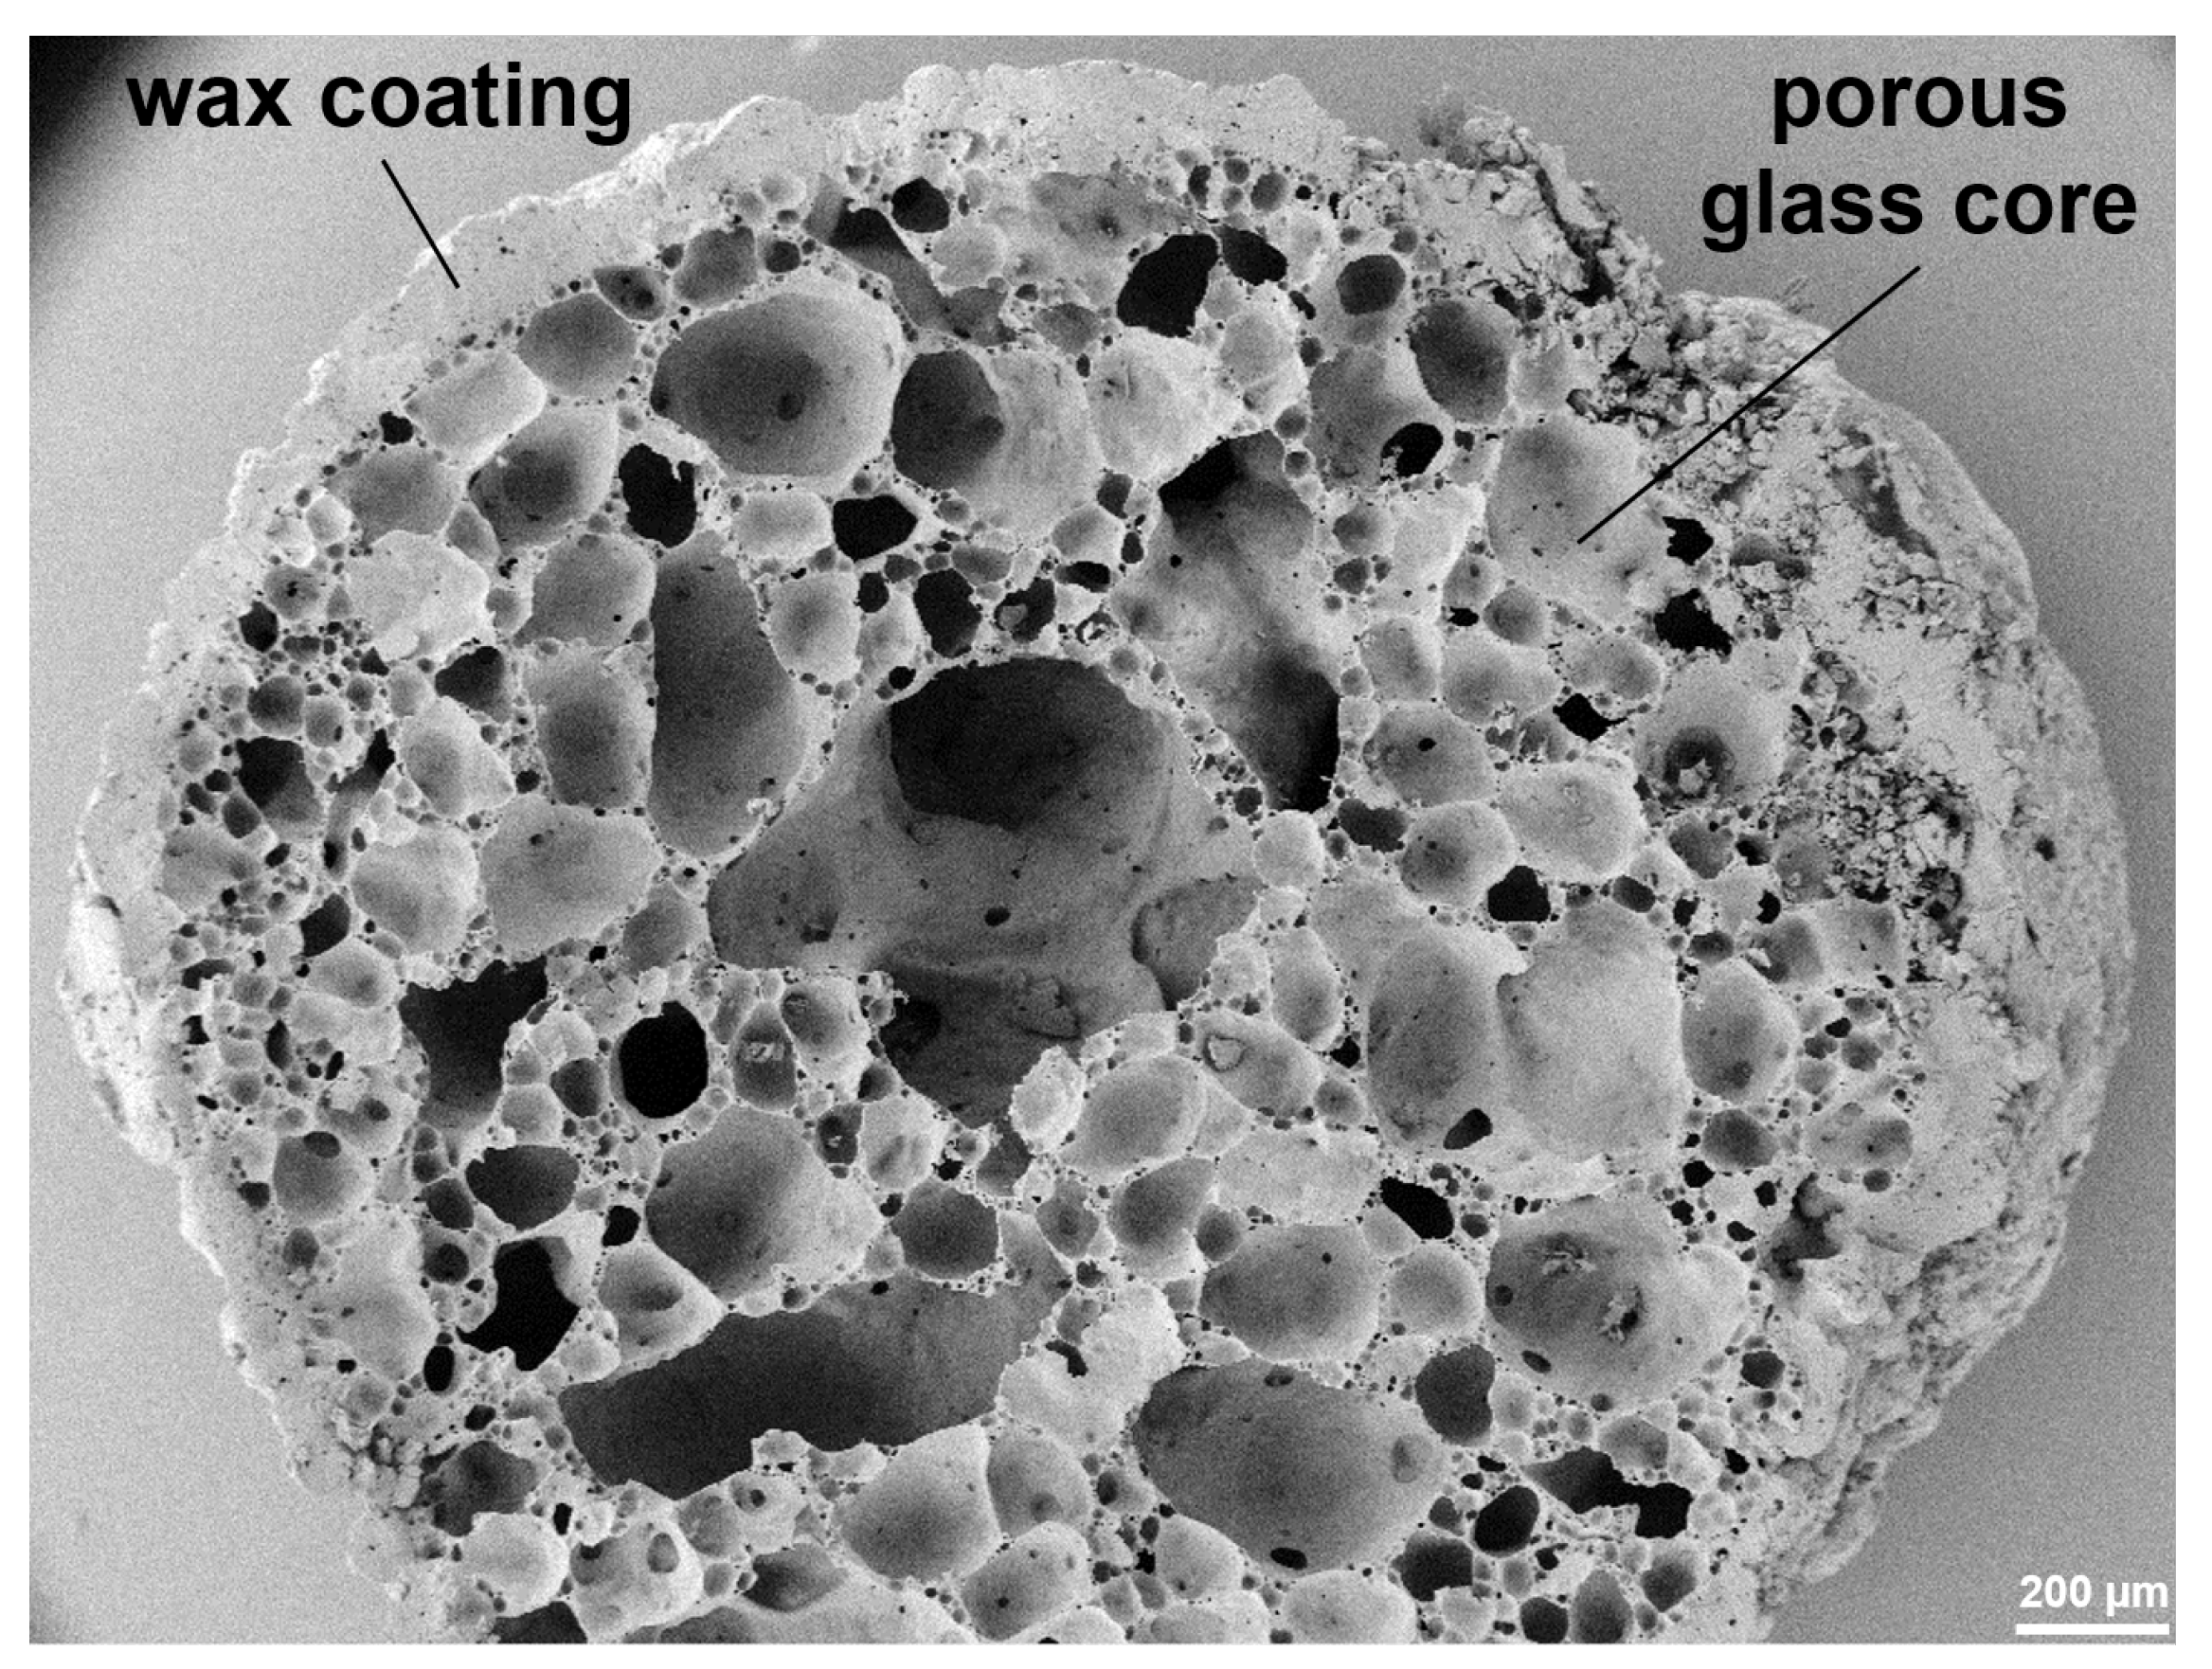
Figure 4, revealed no significant surface defects or inhomogeneities. However, the surface roughness increased from 15.1 ± 4.5 µm for uncoated particles and from 30.7 ± 11.5 µm for wax-coated particles, indicating a less even surface after application of the wax. This increased roughness could be attributed to numerous droplet-shaped peaks on the surface, indicating that some of the wax droplets did not spread ideally on the particle surface before completely solidifying. The high standard deviation underlined the presence of such peaks, which were not completely evenly distributed on the surface. On the one hand, the additional roughness provided additional potential for abrasive material loss, as the more enhanced peaks were significantly more likely to break off from the surface when exposed to dynamic loads. On the other hand, if only minor particle movement occurred, the roughness might lead to interlocking of particles and, thus, to a reduced degradation. However, given the expected conditions during the application in a ship’s double hull and the corresponding particle motion, the first effect wasw assumed to be dominant. Despite the rise in surface roughness, the coating of Poraver
® particles with Candelilla wax was successful, and a uniform protective layer was formed around the glass core.
When using silicone as coating material, the material properties of the liquid posed the greatest challenge for the process. With a viscosity of 4000 ± 1000 mPa
s directly after mixing the base and the catalyst component, injection of the silicone through the 1.2 mm nozzle tip was the most critical step in the coating process. Another risk posed by the high viscosity of the injected silicone droplets was the increased agglomeration tendency of primary particles. Even after adjusting the process parameters throughout several experimental runs, no stable operation point for pure coating was found. As a result, the product from the final silicone coating, with the process parameters shown in
Table 1, consisted of single coated particles, agglomerates, and coated agglomerates.
Again, a higher surface roughness of 33.0 ± 6.9 µm, compared to untreated Poraver
® particles, was measured, indicating a non-complete spreading of the silicone droplets on the particle surface. Similarly to the wax-coated particles, the peaks on the surface could also be seen in the microscope images in
Figure 4. Nevertheless, surface roughness was measured on single coated particles, and, thus, not necessarily accounting for the structure of the agglomerates in the product.
3.2. Particle Density and Porosity
To keep the weight added to a ship by a granular filling material as low as possible, the increase in particle density due to the coating layer should be kept to a minimum. A density of 463.7 ± 0.3 kg/m
3 was measured for untreated Poraver
® particles, which significantly differed from the value of 320 ± 10 kg/m
3 provided by the manufacturer [
27]. This increased density was attributed to the material degradation which presumably occurred during transport of the particles. If surface defects were caused by abrasion or particle breakage, closed pores were transformed into open pores that could be accessed by helium during the measurement. This difference in density further highlighted the problem of material degradation, due to mechanical stress, as will be discussed in more detail in
Section 3.3.
From the measured particle density and the measured skeletal density of 1901.4 ± 3.1 kg/m
3, a closed-pore porosity of 75.6% was calculated. Based on microscope images of the particle cross-section, which revealed a mostly defect-free continuous outer layer around the uncoated particles (see
Figure 3), the closed-pore volume was assumed to equal the total pore volume. In contrast, the coating layers added in the fluidized bed process, as shown in, were assumed to be mainly dense, as qualitatively seen in microscope images (see
Figure 4). Consequently, the pore volume of the Poraver
® particles was assumed not to be influenced by the coating.
For wax- and silicone-coated particles, densities of 536.2 ± 0.3 kg/m3 and 495.1 ± 0.2 kg/m3 were measured, respectively. Compared to untreated particles, this translated to a density increase of 15.6% and 6.8%. While the lower density gain was generally favorable, it also indicated a lower layer thickness and coating efficiency of the silicone coating compared to the wax coating process. This was in agreement with the observations regarding increased agglomerate formation when using silicone as a coating material. Consequently, not all injected material was used for particle coating and, thus, did not contribute to layer growth. Overall, the density increase was within an acceptable range for both materials.
3.3. Material Degradation Due to Abrasion
As previously mentioned, investigating the effect of a coating on the abrasion resistance of particles is of great interest when assessing suitability as a granular filling in the double-hull of a ship. After one hour of particle movement in the Turbula
® mixer, as described in
Section 2.5.1, the untreated particles showed a mass loss of 14.6%, due to abrasion, in the form of a significant amount of dust in the plastic container. Furthermore, the material degradation was clearly visible on the particle surface, where noticeable defects occurred. In contrast, a material loss of only 0.3% was measured for the particles coated with wax. For the silicone-coated particles, no significant amount of abrasion dust could be detected. Apparently, the increased surface roughness, due to coating, did not have any negative influence on the abrasion resistance. Possible degradation-enhancing effects were supposedly overshadowed by the properties of the comparatively soft coating materials that reduced abrasion on the particle surface. To simulate a denser packing, as expected in the application in the double-hull of a ship, the test was repeated with a completely filled plastic container for the uncoated particles. In consequence, the number of particle–particle and particle–wall collisions reduced and abrasion occurred almost exclusively due to the friction between particles or between particles and the container wall. Only a minor degradation of 1.0% was observed in this case, which still exceeded the mass loss for the less-filled containers with coated particles. Due to the low available amount of samples for the coated particles, the test could, unfortunately, not be repeated with a container completely filled with coated particles.
3.4. Single-Particle Compression Test
To see the influence of the coating on particle breakage, several uniaxial compression tests were carried out, as described in
Section 2.5.2. The results of these experiments were compared to uncoated particles, as presented in [
19].
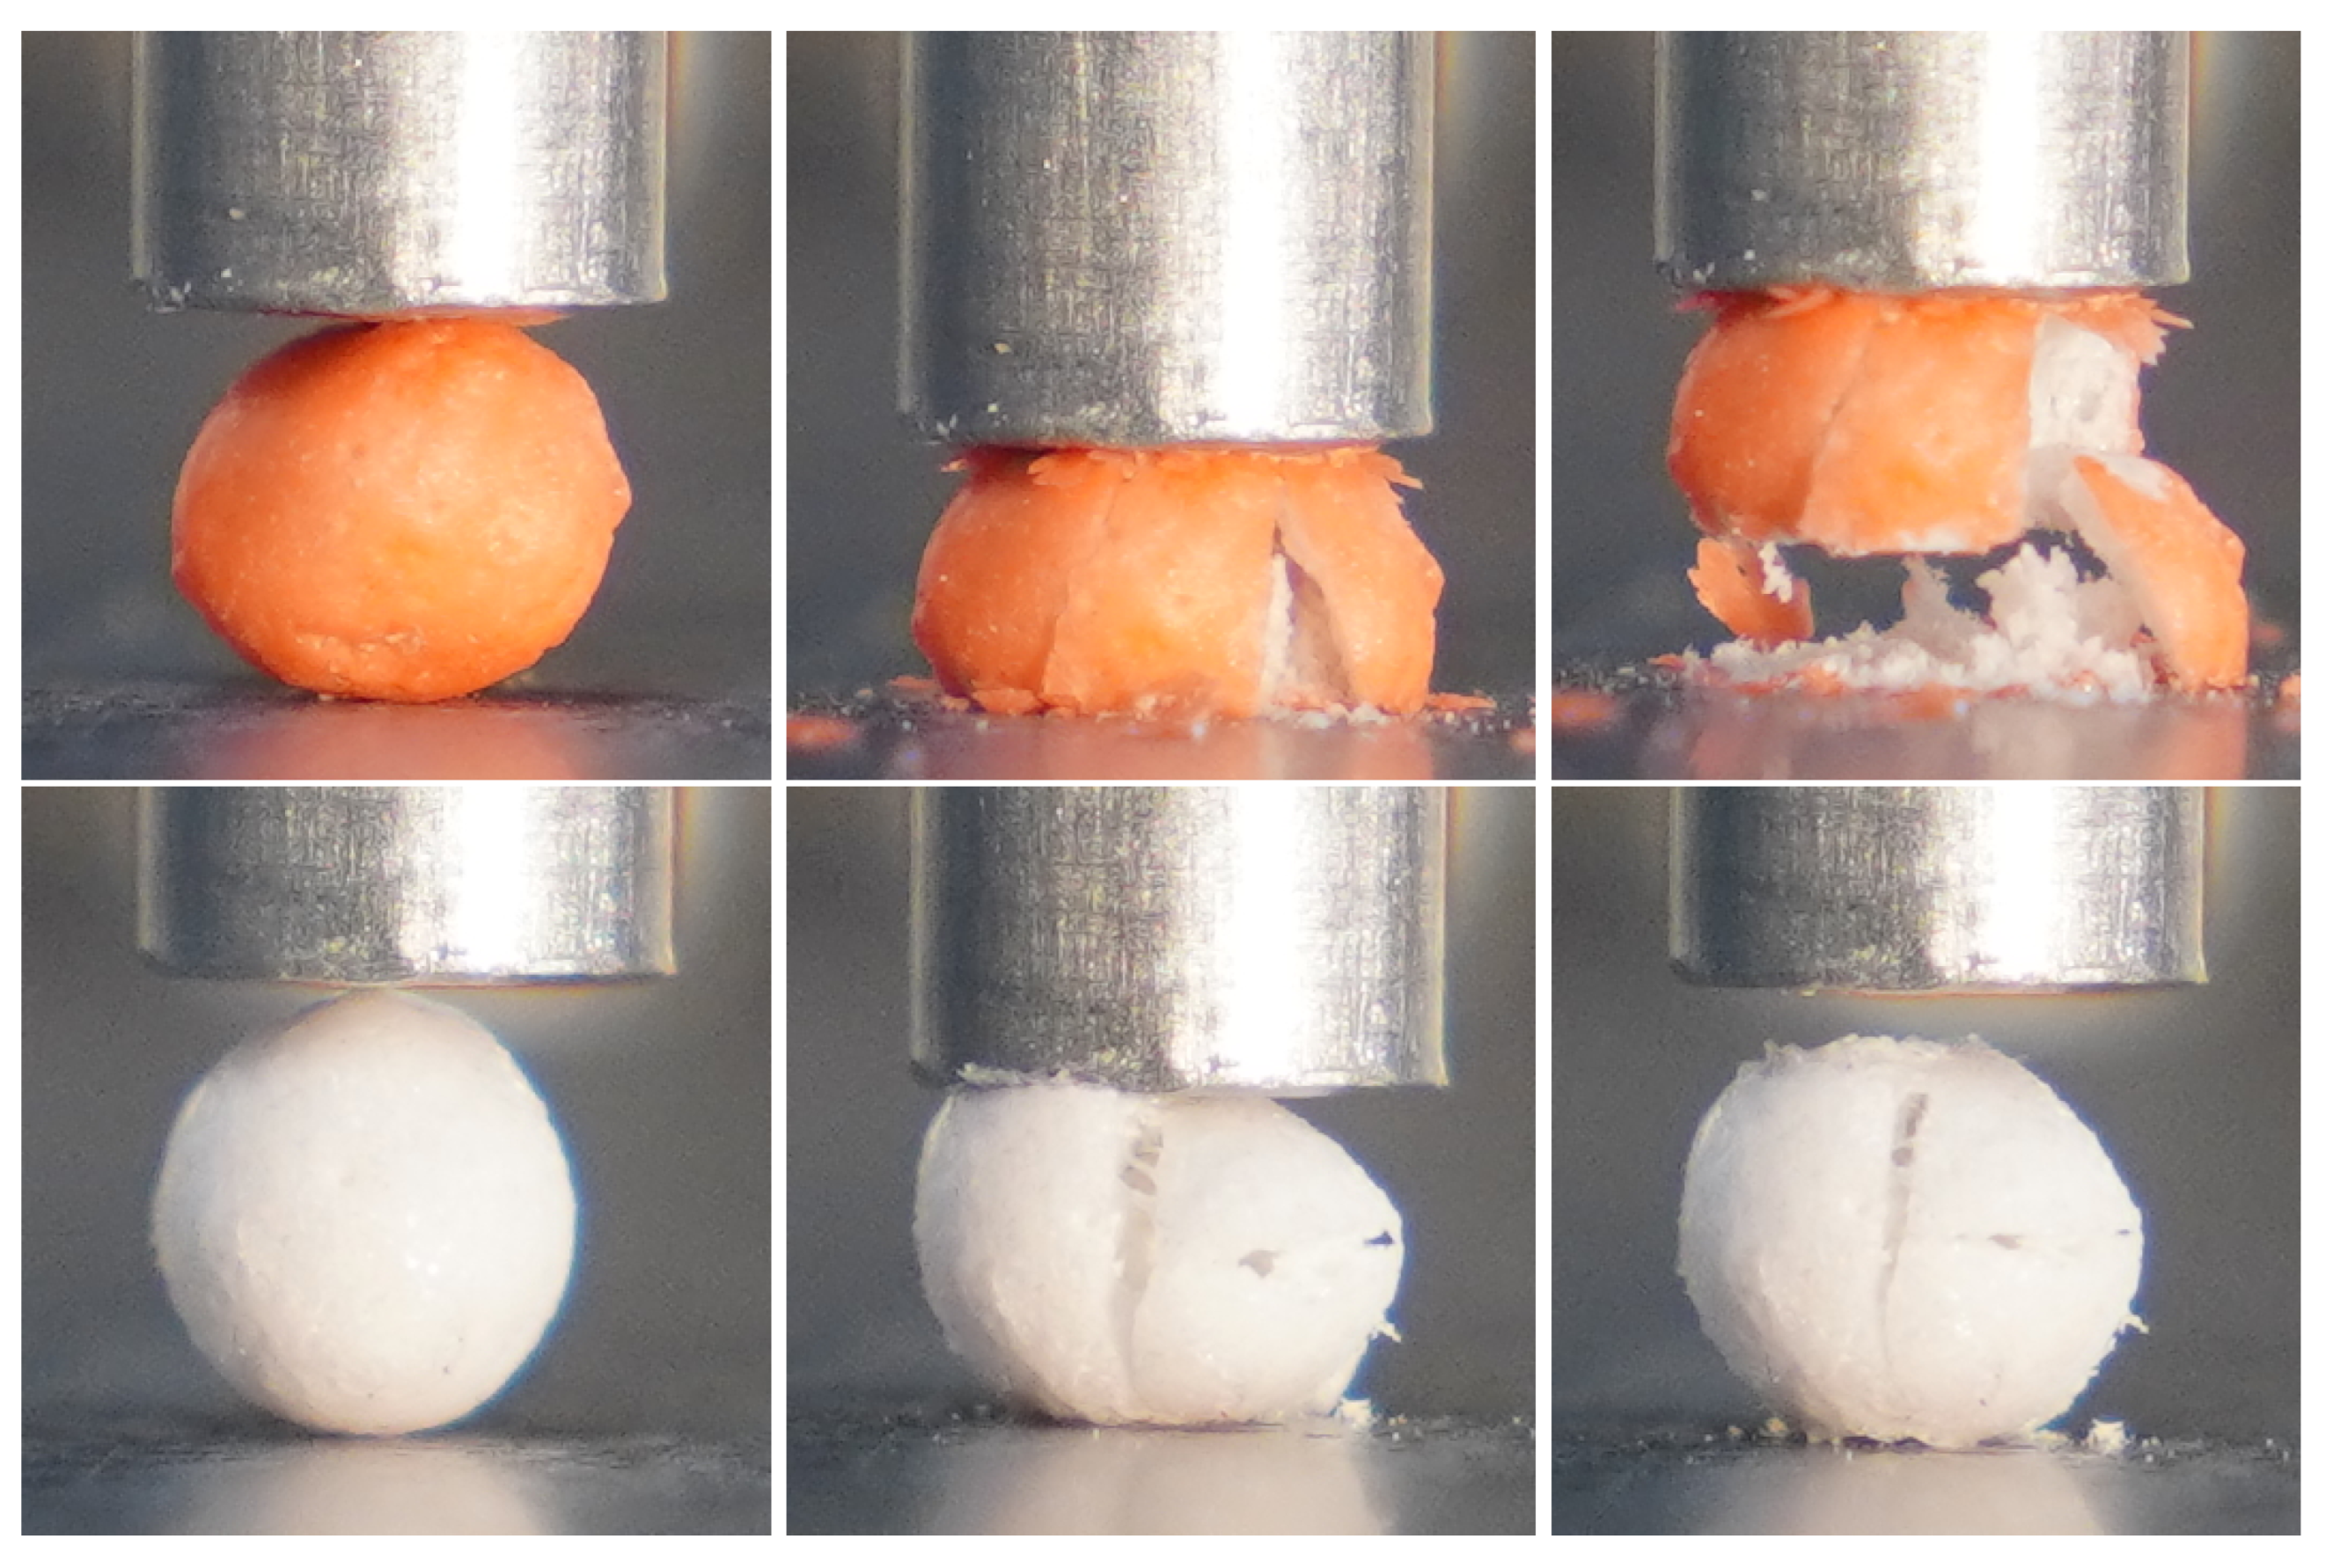
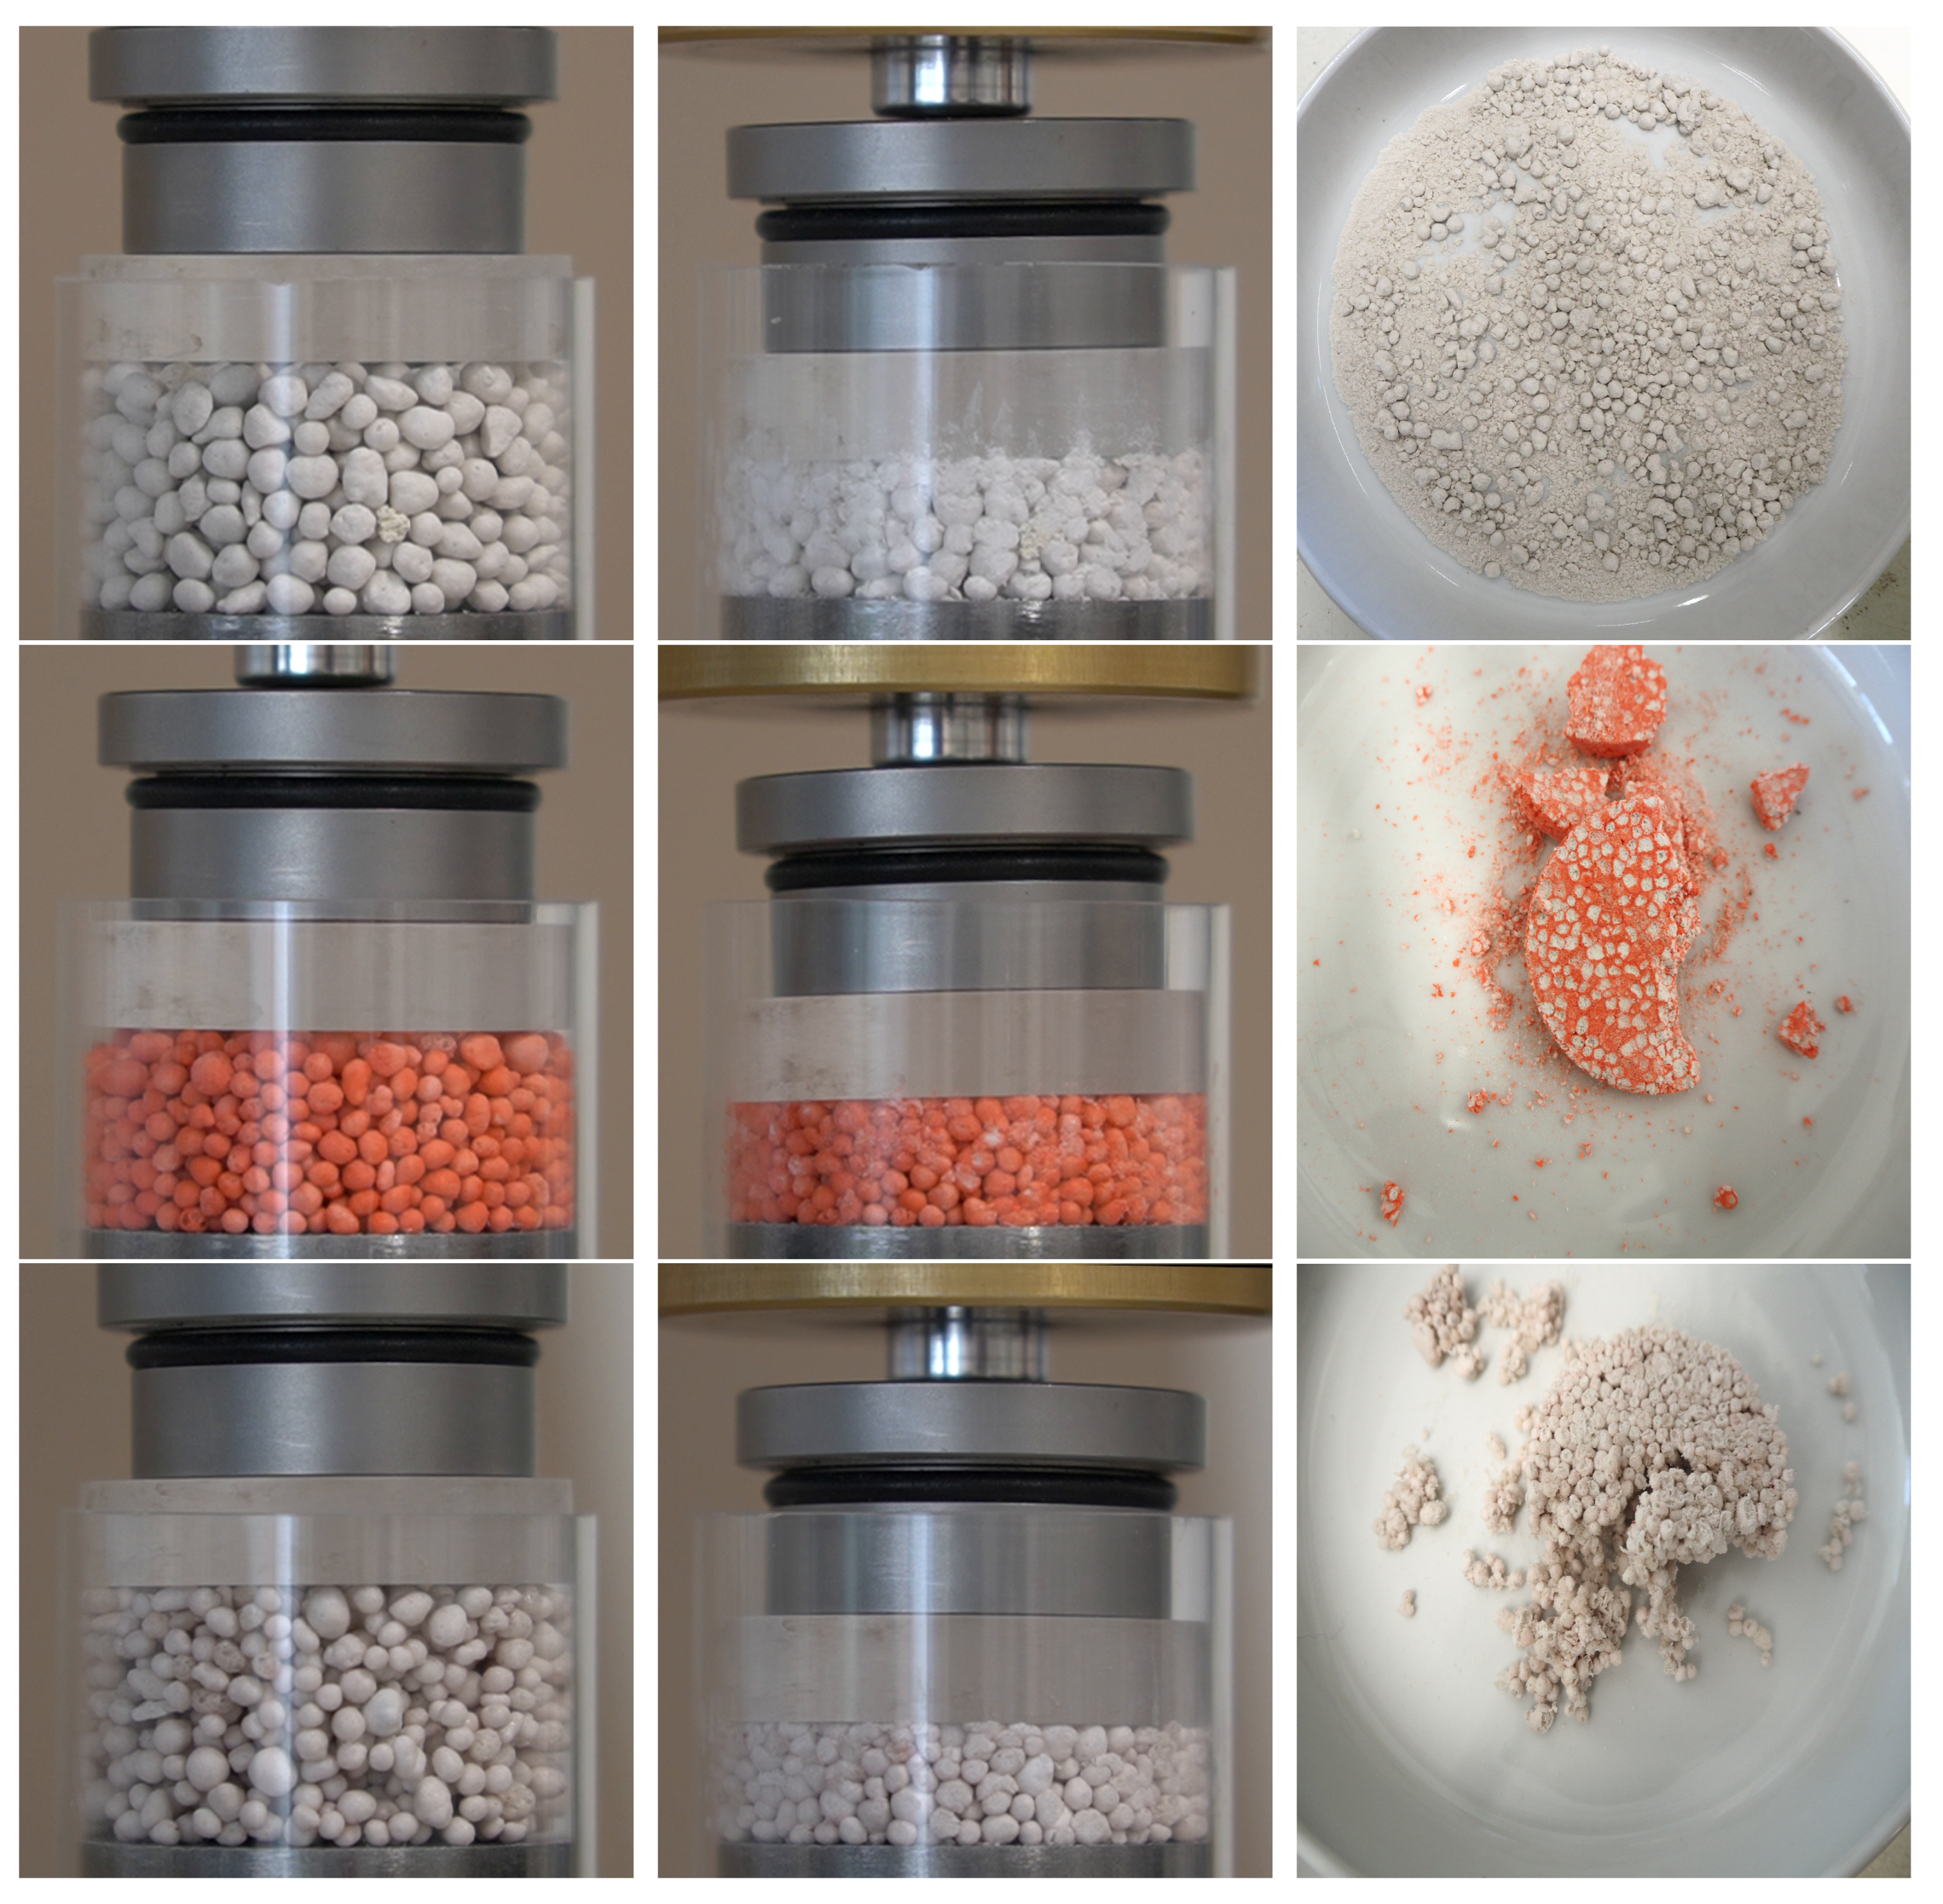
Figure 5 highlights the deformation of coated particles.
As can be observed, the wax coating split off the particle when the first visible cracks appeared. In contrast, the silicone coating showed no real damage and remained seemingly intact even after removing the punch. Thus, while the wax coating chipped off and left the uncoated particles behind, the silicone formed a kind of casing that held the particles together. Additionally, in both cases, micro-cracks could be heard as a quiet cracking before the end of the compression, followed by a louder cracking noise (and a larger visible crack) indicating the breakage point. Overall, the microcracking was less noticeable, both visually and audibly, in the case of silicone-coated particles. In the following section, the influence of the coating on the material parameters introduced in
Section 2, and the energy absorbed during compression, was presented and compared to uncoated particles.
3.4.1. Crushing Strength and Young’s Modulus
The stress–strain curves for the smallest diameter fraction for wax-coated particles are illustrated in
Figure 6. As can be seen, the general behavior was non-linear before the maximum crushing stress was reached, which is highlighted by the black box. The drops in stress depict the microcracking within the particle, leading to the energy release and the associated cracking sounds, as mentioned in the previous section. Significant scattering between the results was noticeable. This was explained by the inhomogeneities between the particles. Each particle had its unique microstructure, as depicted in
Figure 3, which translated into varying microcracking behaviors. Therefore, sieving the particles into diameter fractions did not reduce scattering in the stress–strain behavior. Nevertheless, it did lead to a lower deviation between the mechanical properties. A summary of the average diameter, crushing force, crushing stress, and the corresponding crushing strain for all diameter fractions can be found in
Table 2, including the results for the uncoated particles from [
19]. For wax-coated particles, the crushing force was higher for larger diameter fractions. This was because of a higher initial cross-sectional area. Consequently, the crushing stress decreased. In comparison to uncoated particles, the crushing stress was lower because of the smaller initial stiffness of wax. Therefore, the gradient of the curves between 0–1% of strain in
Figure 6a was dominated by wax. Afterwards, the gradient increased, leading to the assumption that the brittle behavior of uncoated particles started to influence the stress–strain relationship, as the wax coating started to delaminate, as depicted in
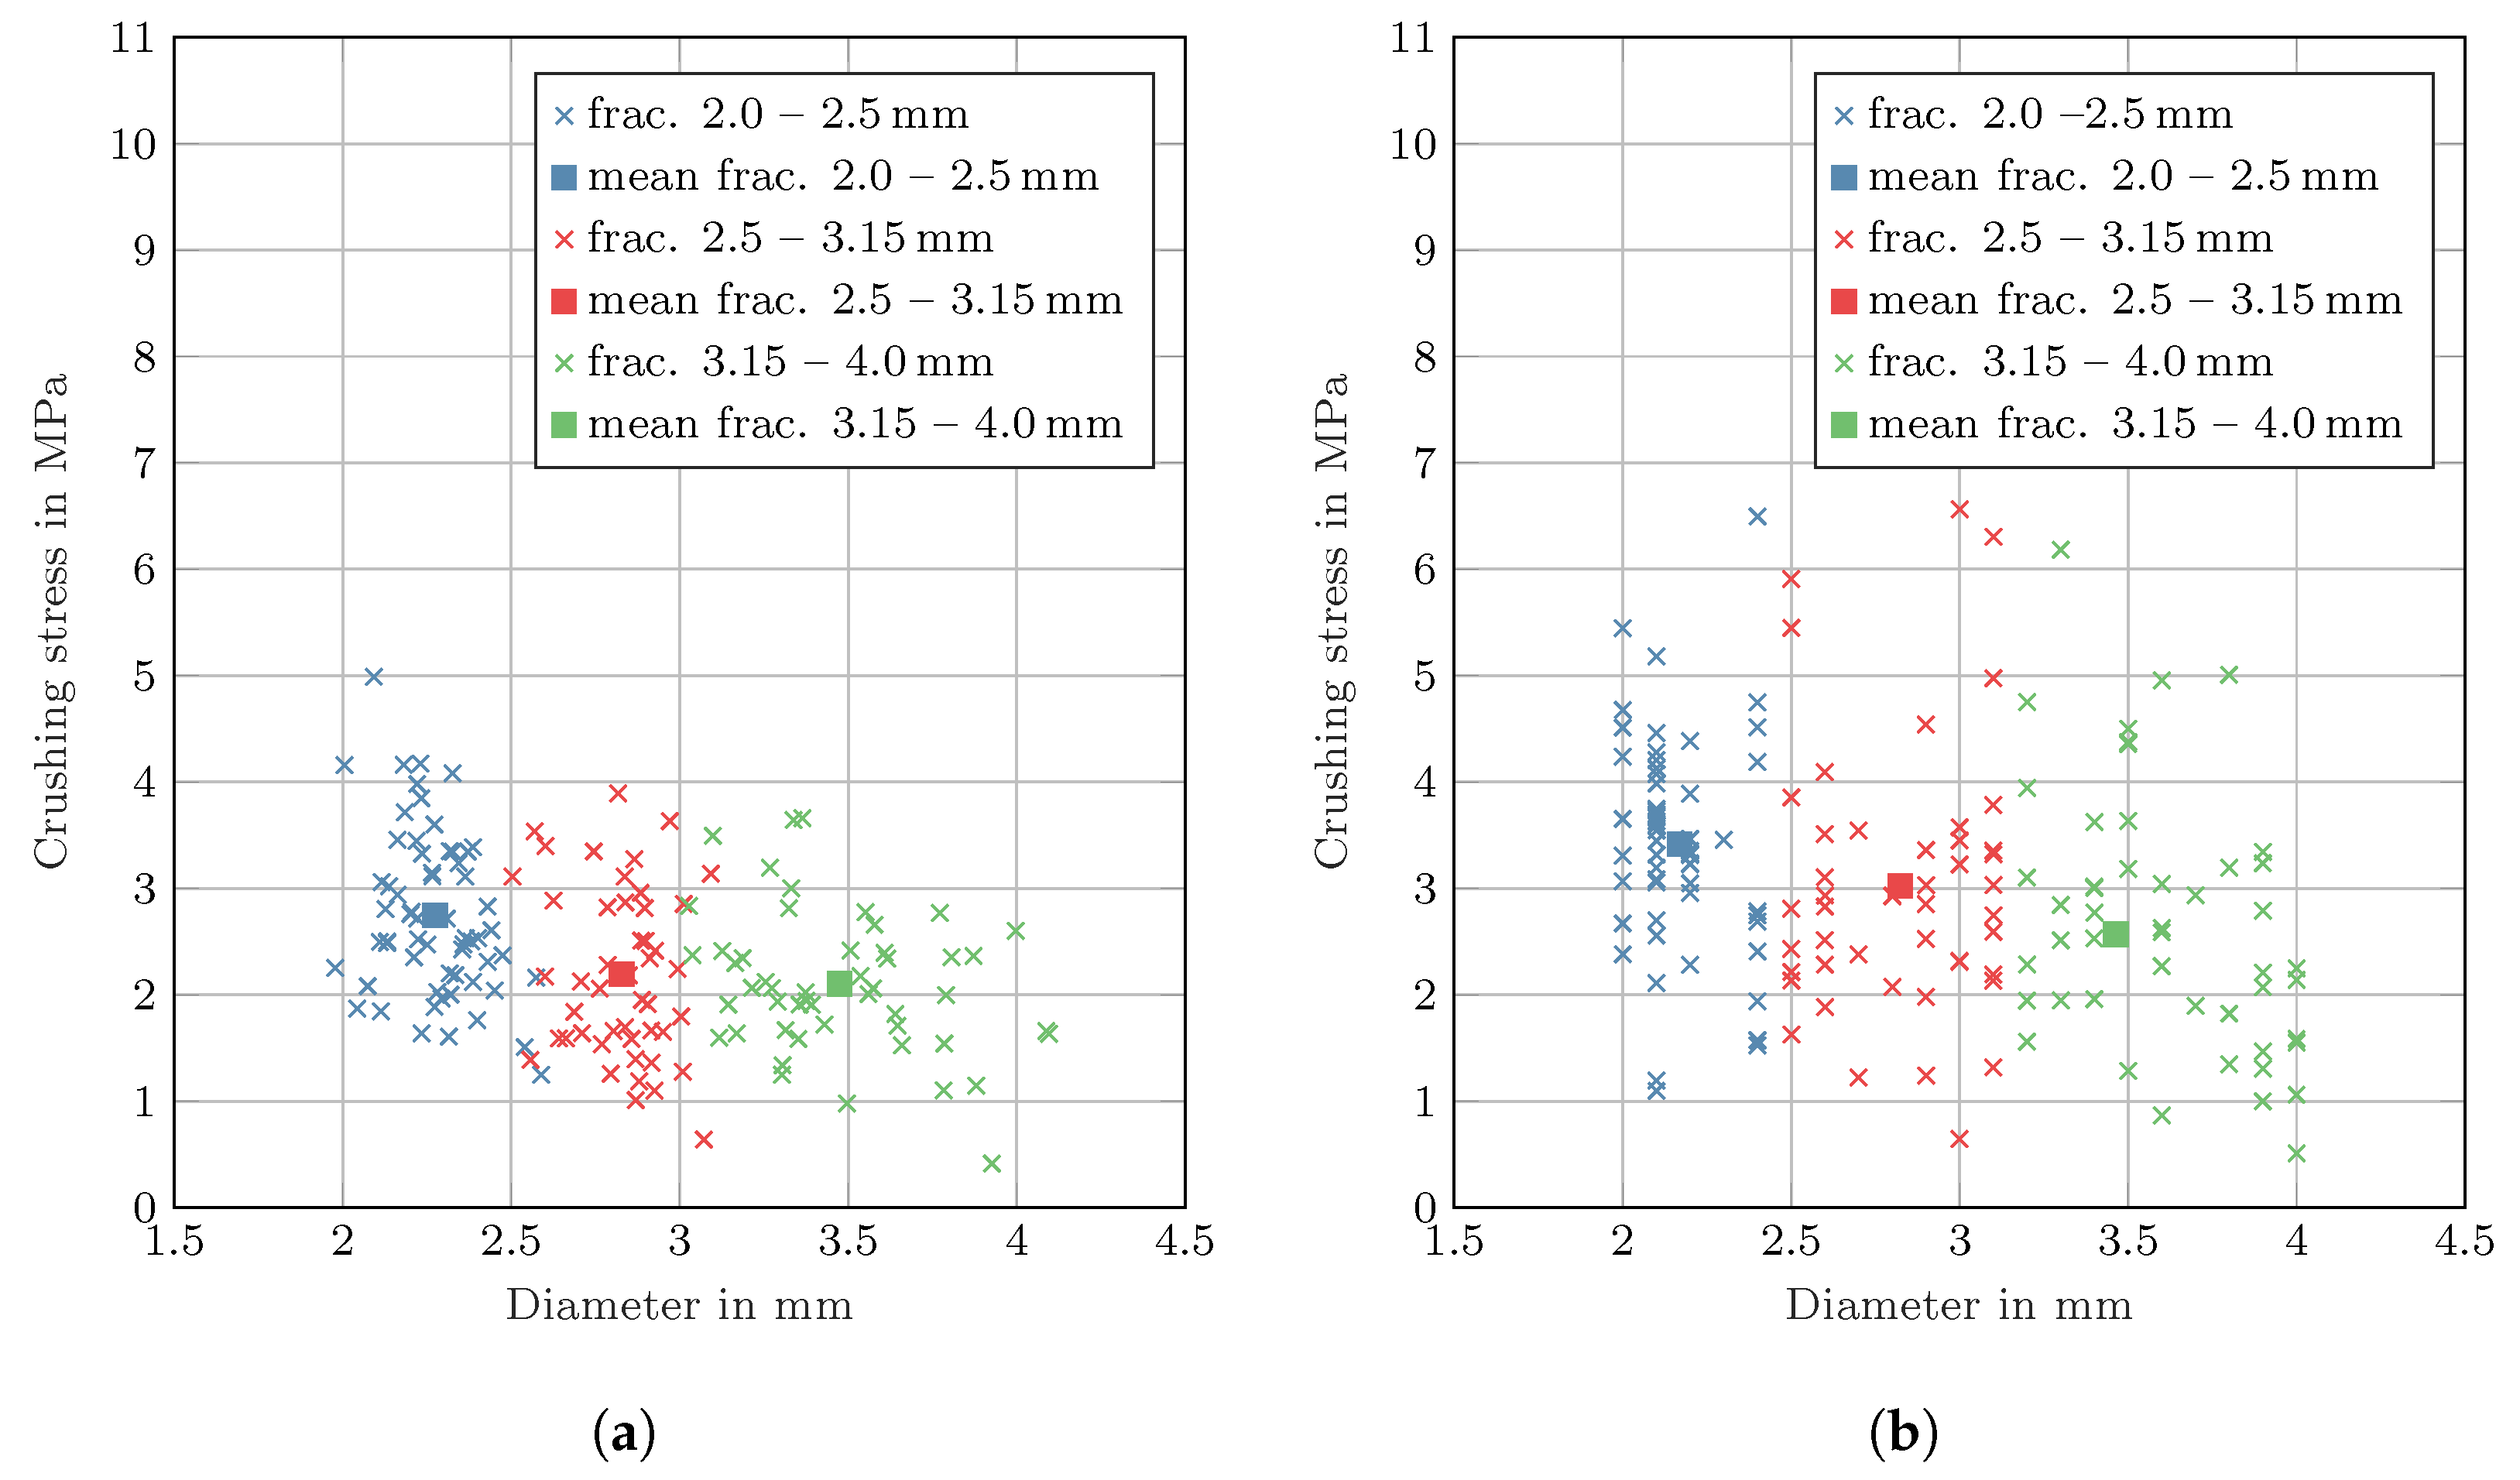
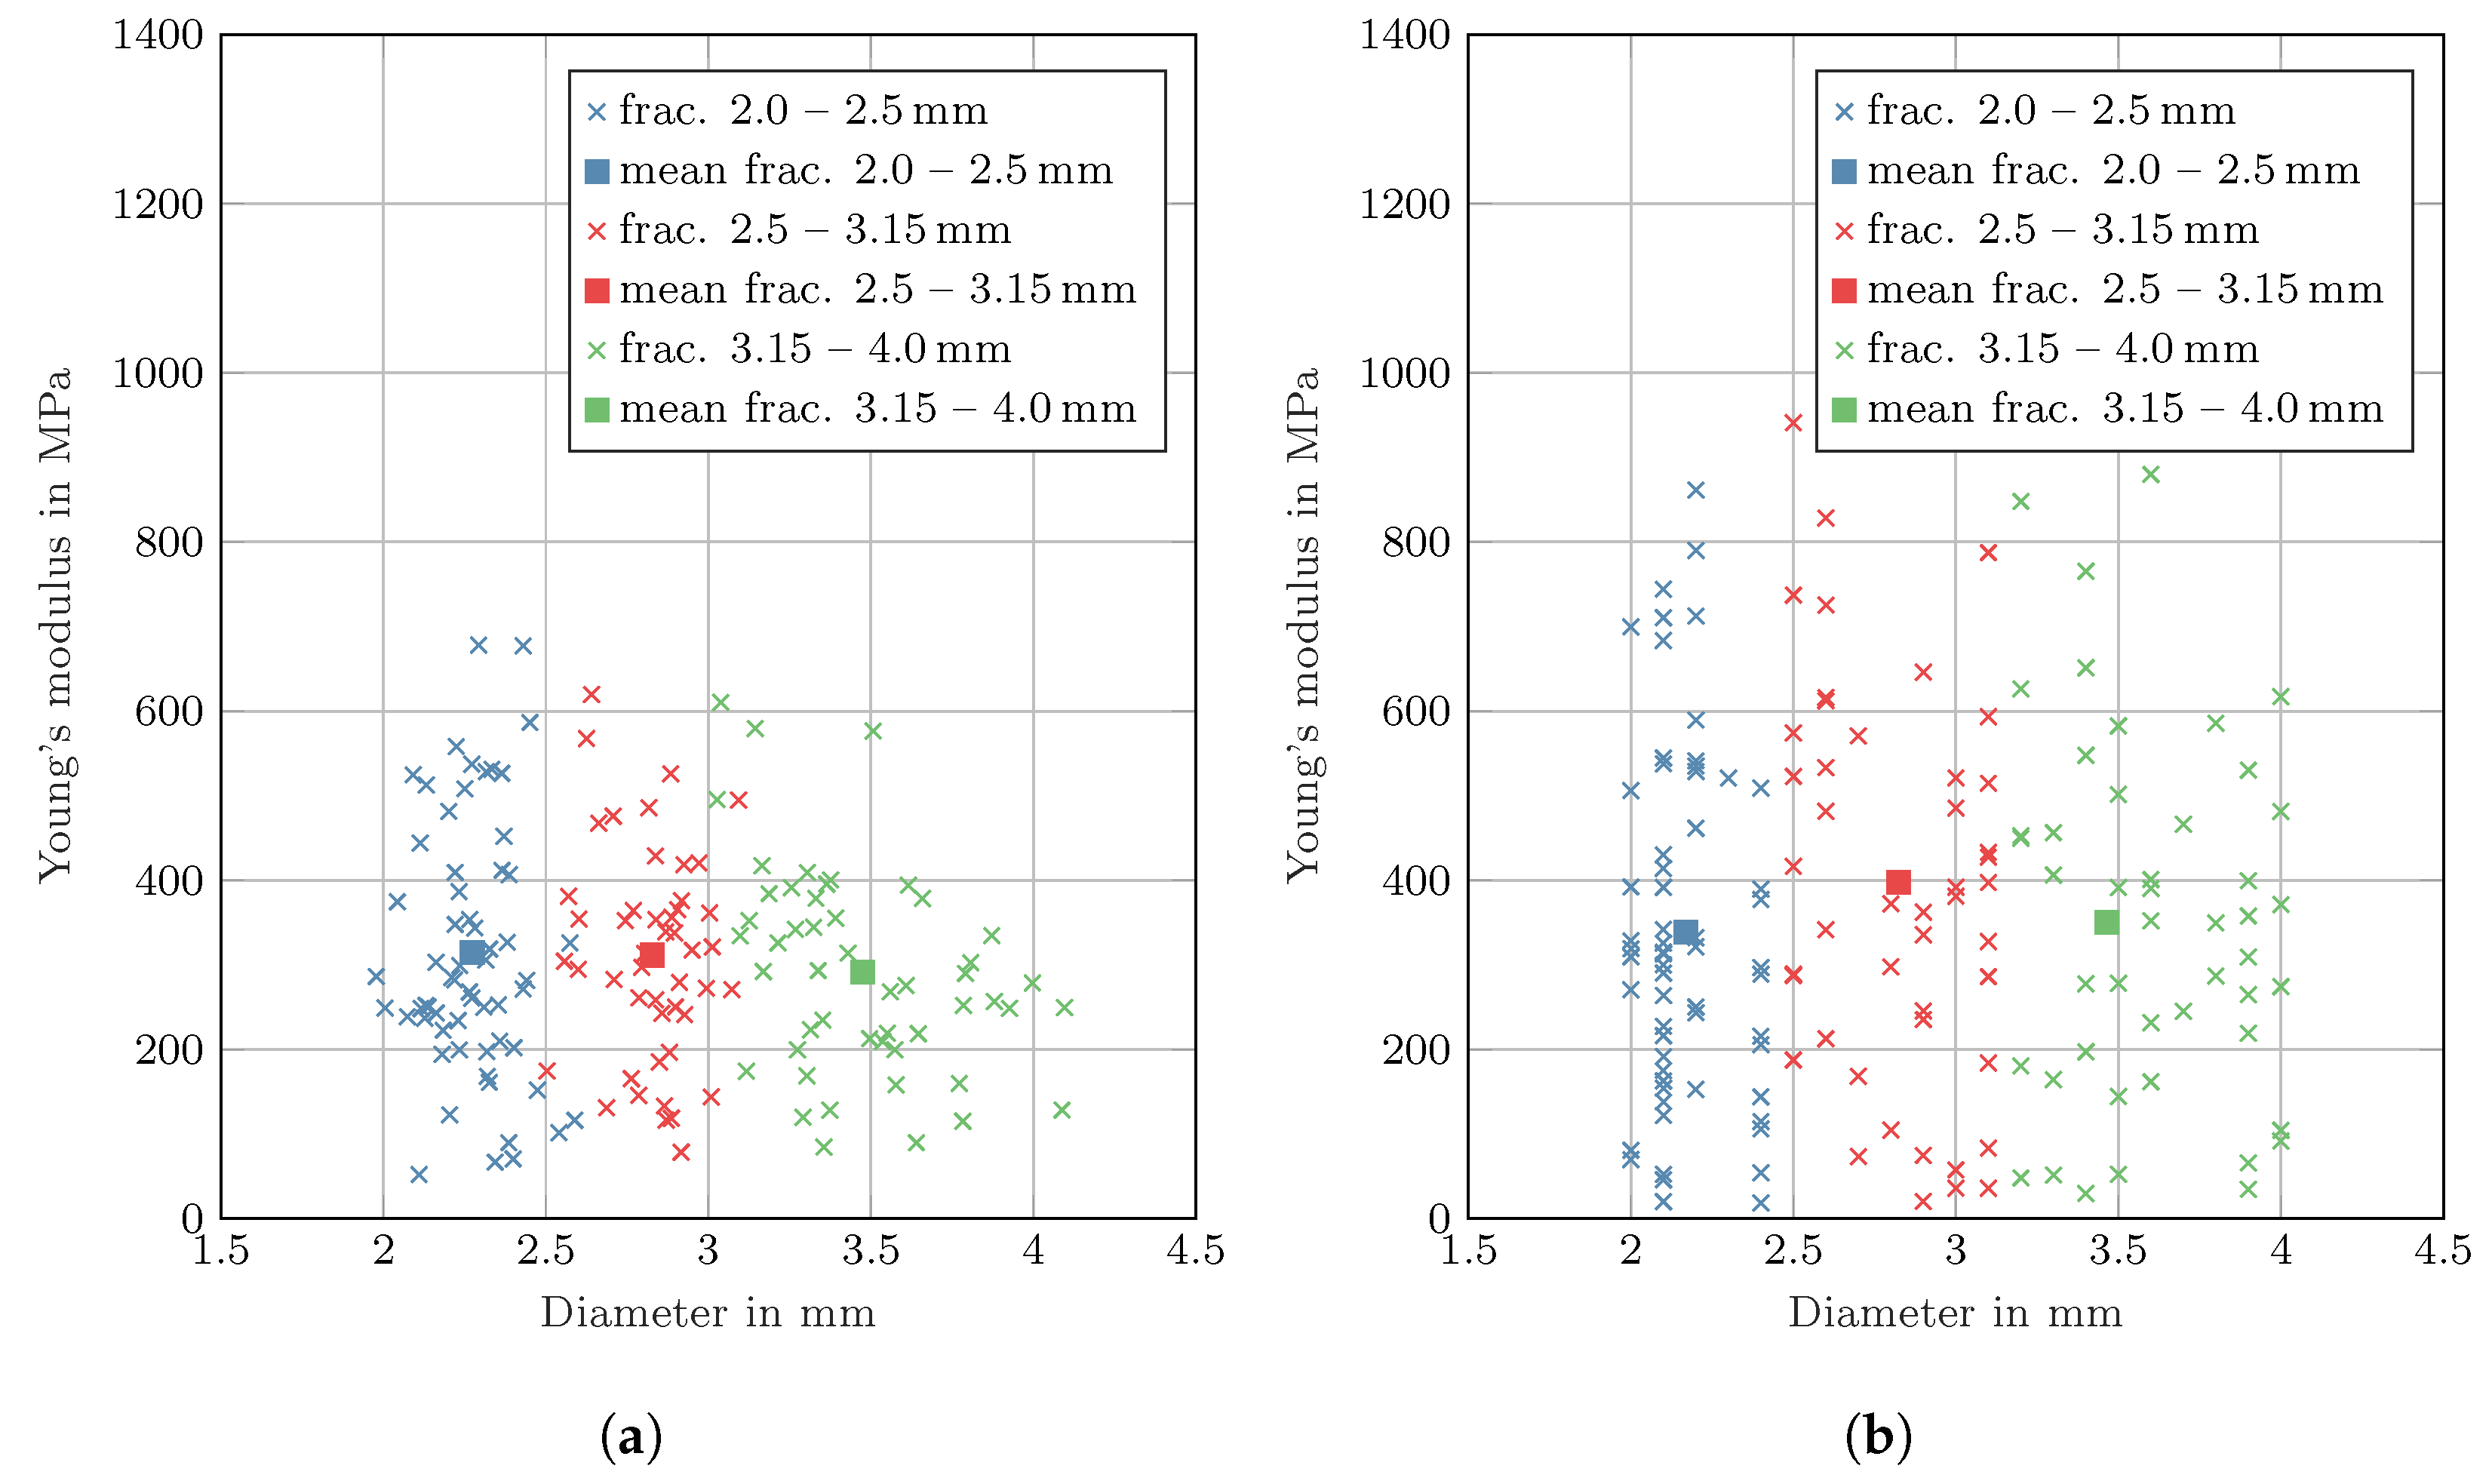
Figure 5. The broad variation in crushing stress and Young’s modulus for each diameter fraction was highlighted by
Figure 7a and
Figure 8a, respectively. A range of 1.25–5 MPa for the crushing stress and 52.35–678 MPa for the Young’s modulus was observed for the smallest diameter fraction. The mean value of each fraction was represented by the corresponding color-coded squares. As mentioned in [
19], these values were significantly dependent on the diameter of the particles.
Silicone-coated particles exhibit a stress–strain behavior that is quite similar to that of the wax-coated particles, see
Figure 6b. However, some differences can be noticed. The drops in the stress values were lower in magnitude, accompanied by a weaker cracking noise, during the experiments. Compared to wax-coated particles, the crushing force for the largest diameter fraction mentioned in
Table 2 was higher, with a mean value of 27.788 N. The slope of the curves following the initial strain values revealed a higher Young’s modulus. Furthermore, there was a more pronounced scattering of the crushing stress and Young’s modulus, as shown in
Figure 7b and
Figure 8b, respectively. Consequently, a higher range of 1.9–6.5 MPa for the crushing stress and 18.62–861.36 MPa for the Youngs’s modulus was observed for the smallest diameter fraction. However, the increased range and stiffness for the Young’s modulus did not contribute to an earlier breakage. Instead, the silicone layer helped to keep the broken pieces of the Poraver
® particles wrapped together, in contrast to the brittle behavior of the wax layer, which broke away. This meant that the silicone-coated particles had a greater energy absorption potential in a ship’s double hull. In reality, however, there were thousands of particles. Therefore, the breakage of the wax coating also played a role in interactions between particles, which is discussed later in the sections on multi-particle tests.
3.4.2. Energy Absorption
For each particle, the energy absorption capability
was determined, as described in
Section 2.5.2. A summary of the results is given in
Table 3. For all diameter fractions, the total energy absorbed by silicone-coated particles was higher compared to wax-coated particles. This was due to the aforementioned shell-like silicone layer which held the damaged particles together, leading to an increased area under the stress–strain curve. Furthermore, less microcracking led to less pronounced drops in the stress values, adding towards an increased energy absorption. However, both coated particles absorbed less energy than uncoated particles for nearly all diameter fractions in the single-particle compression test. A possible explanation was provided by the fact that the mass of Poraver
® within a fraction if the same diameter was higher for uncoated in comparison to coated particles. Therefore, the crushing force was lower for coated particles, as can be observed in
Table 2. The only exceptions were silicone-coated particles in the largest diameter fraction of 3.15–4.0 mm.
A statistical correlation between the total crushing force, crushing displacement, diameter, and Young’s modulus with the energy absorbed was drawn up using the Pearson correlation coefficient, see
Section 2.6. For wax-coated particles, the crushing force and displacement showed a positive correlation of 0.983 and 0.879, respectively. Similarly, a positive correlation was observed for silicone-coated particles with a correlation of 0.995 and 0.959 for the crushing force and displacement, respectively. This was evident from the fact that higher crushing force and its corresponding displacement led to a larger area under the curve. Consequently, there was an increase in the total energy absorbed. However, no correlation was found between the particle diameter and Young’s modulus with the strain energy. Therefore, a larger particle or a higher initial stiffness during compression did not guarantee a higher energy absorbtion during single-particle compression.
3.5. Multi-Particle Compression Test
To consider bulk behavior alongside single-particle investigations, multi-particle compression tests were performed. The shape of the stress–strain curve, as well as the corresponding values of the Young’s modulus and energy absorbed, varied depending on the type of coating material. Additionally, these tests described the interaction between particles and coating layer inside the cylinder.
Figure 9 illustrates the deformation of particles during compression inside the cylinder.
3.5.1. Young’s Modulus
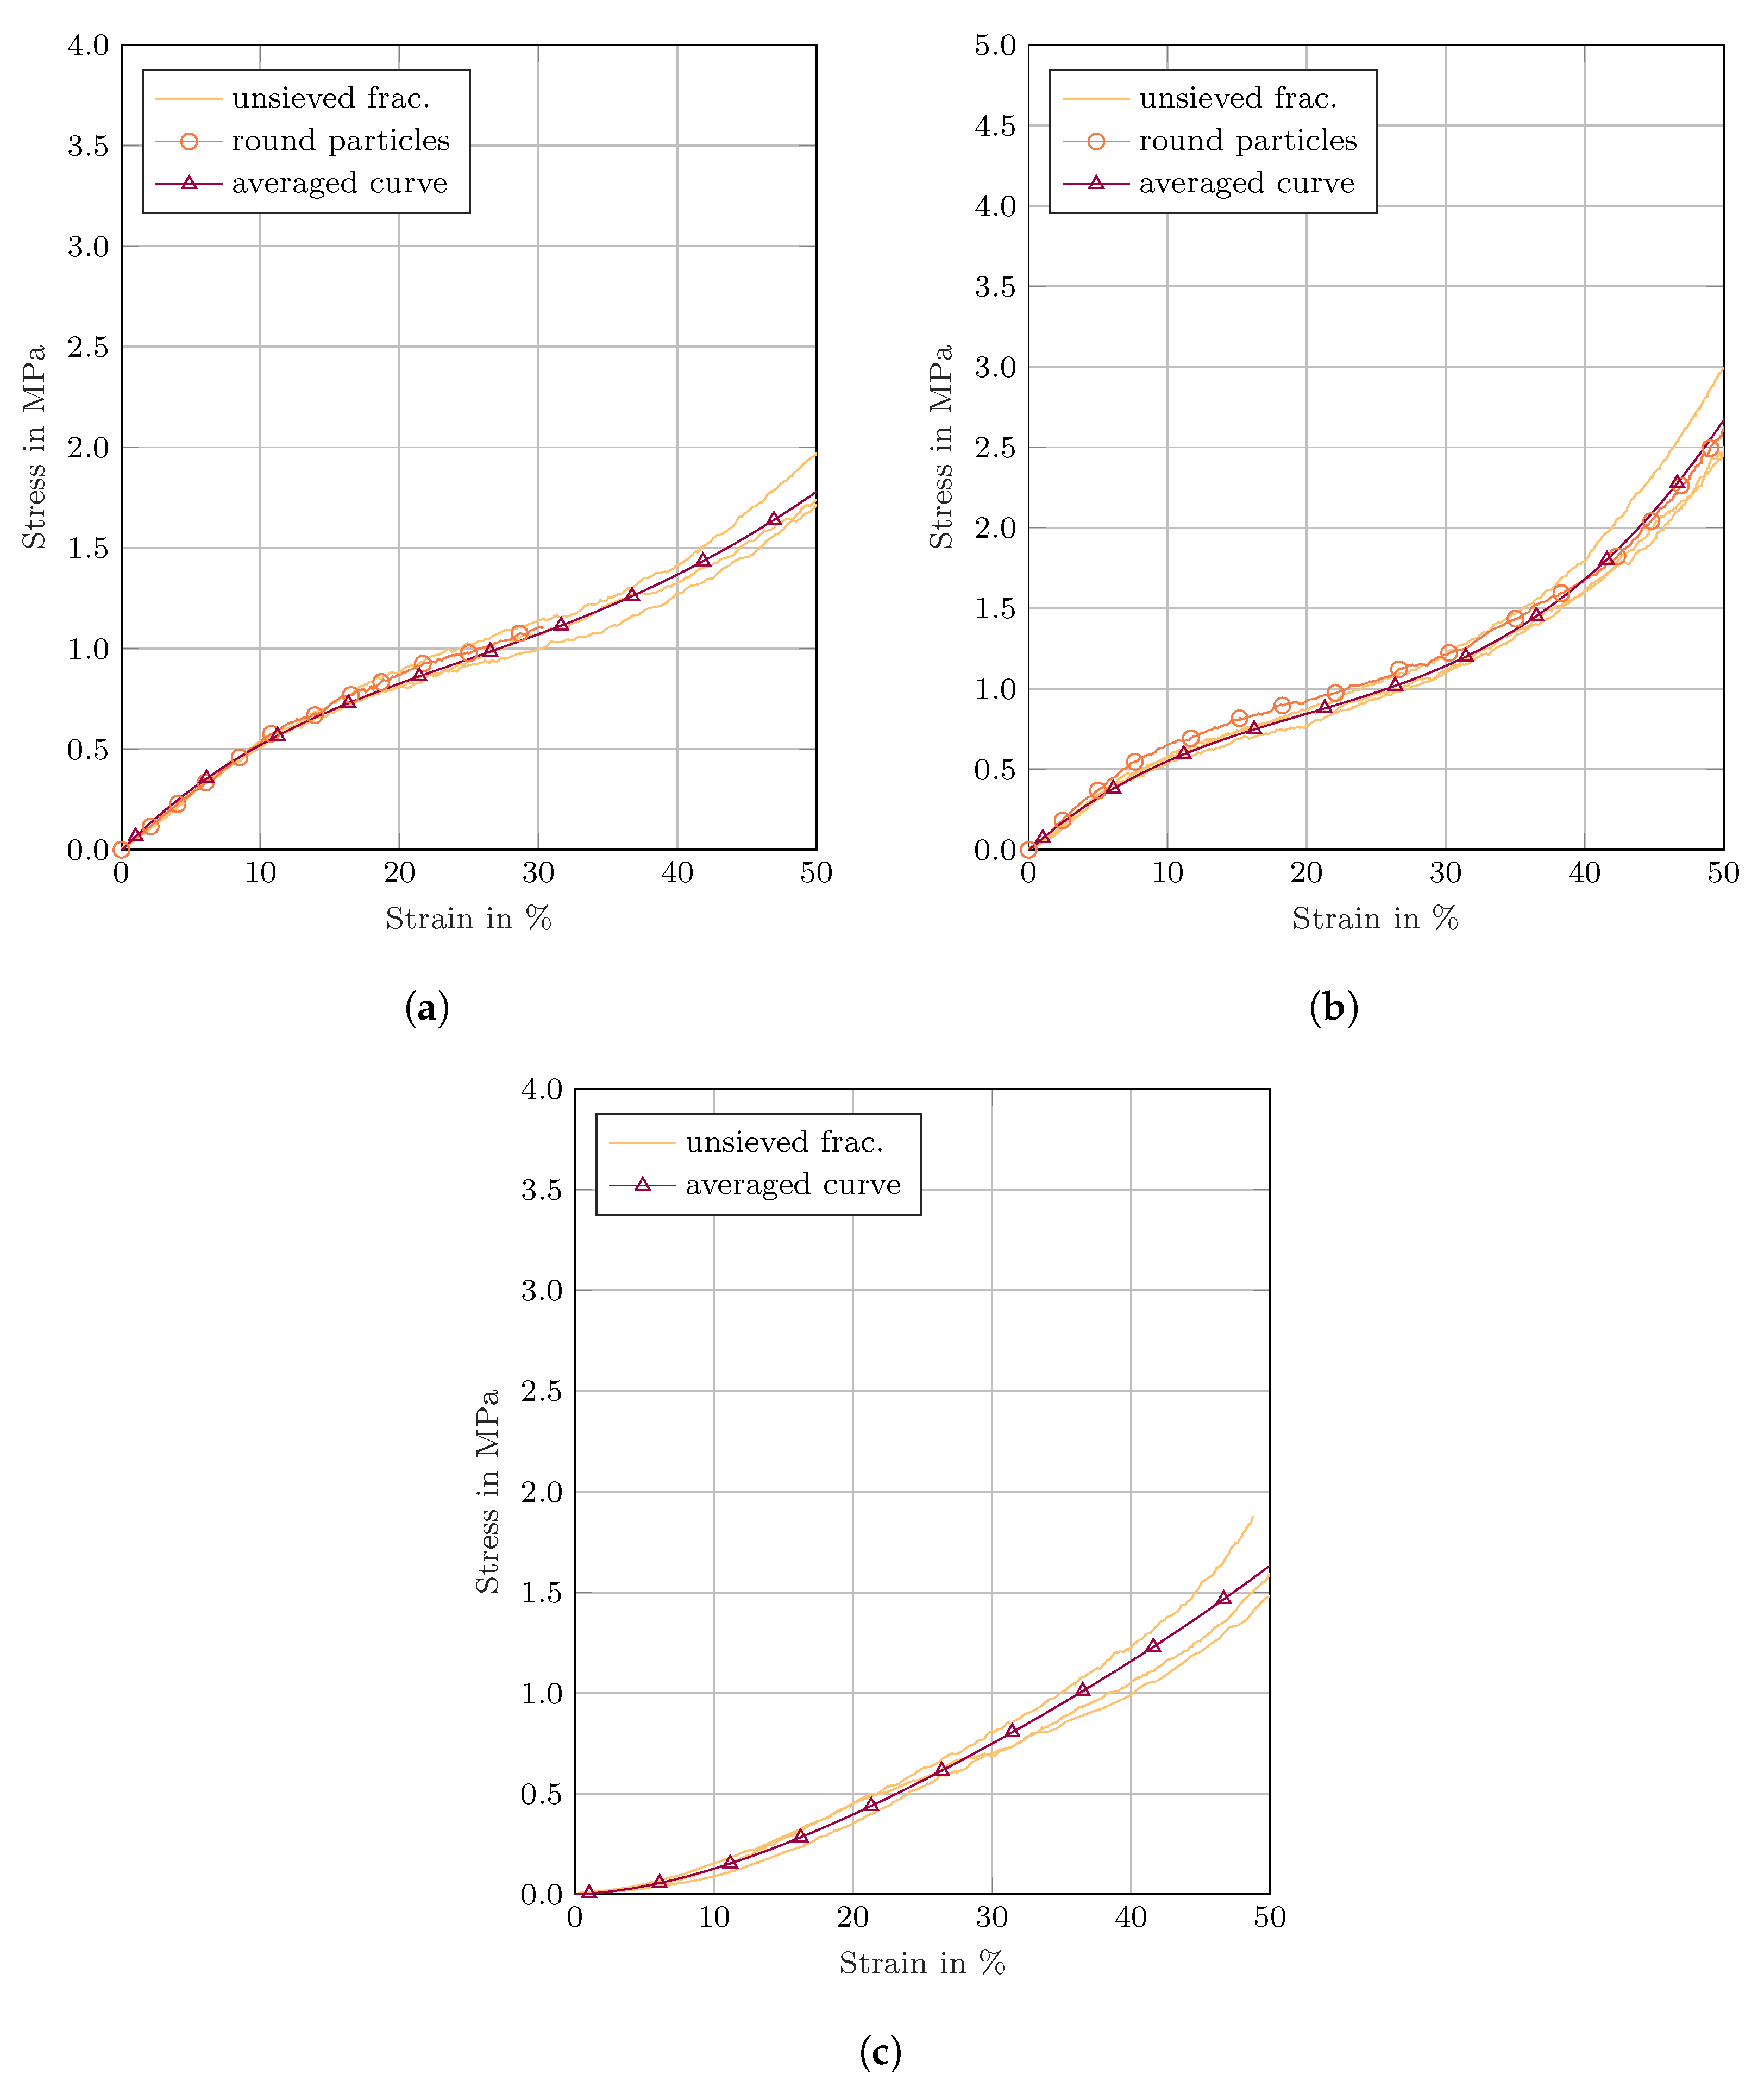
The results for unsieved uncoated particles are illustrated in
Figure 10a. In comparison to the results from the single-particle tests, the scattering of the stress–strain curves was significantly lower. In particular, the initial slope up to 7% strain for all the curves remained similar. Beyond this limit, the curves started to become nonlinear. Furthermore, they could be consolidated into three distinct regions, each characterized by a different Young’s modulus. An averaged curve was generated using the previously described method, see
Section 2.6. After an initial increase in Young’s modulus, between 15% to 40% strain, the slope of the average curve decreased.
This could be explained by the breakage of particles near the top and bottom of the cylinder, leading to a release of energy, as observed in
Figure 9, during compression. The small, broken-up pieces rearranged themselves and filled the voids between the remaining intact and undamaged particles in the center of the cylinder. Once a strain of 40% was reached, the Young’s modulus started increasing again. This occurred due to the compaction between the particles and the stiffness provided by the remaining intact particles. At the end of each experiment, the particles were removed from the cylinder.
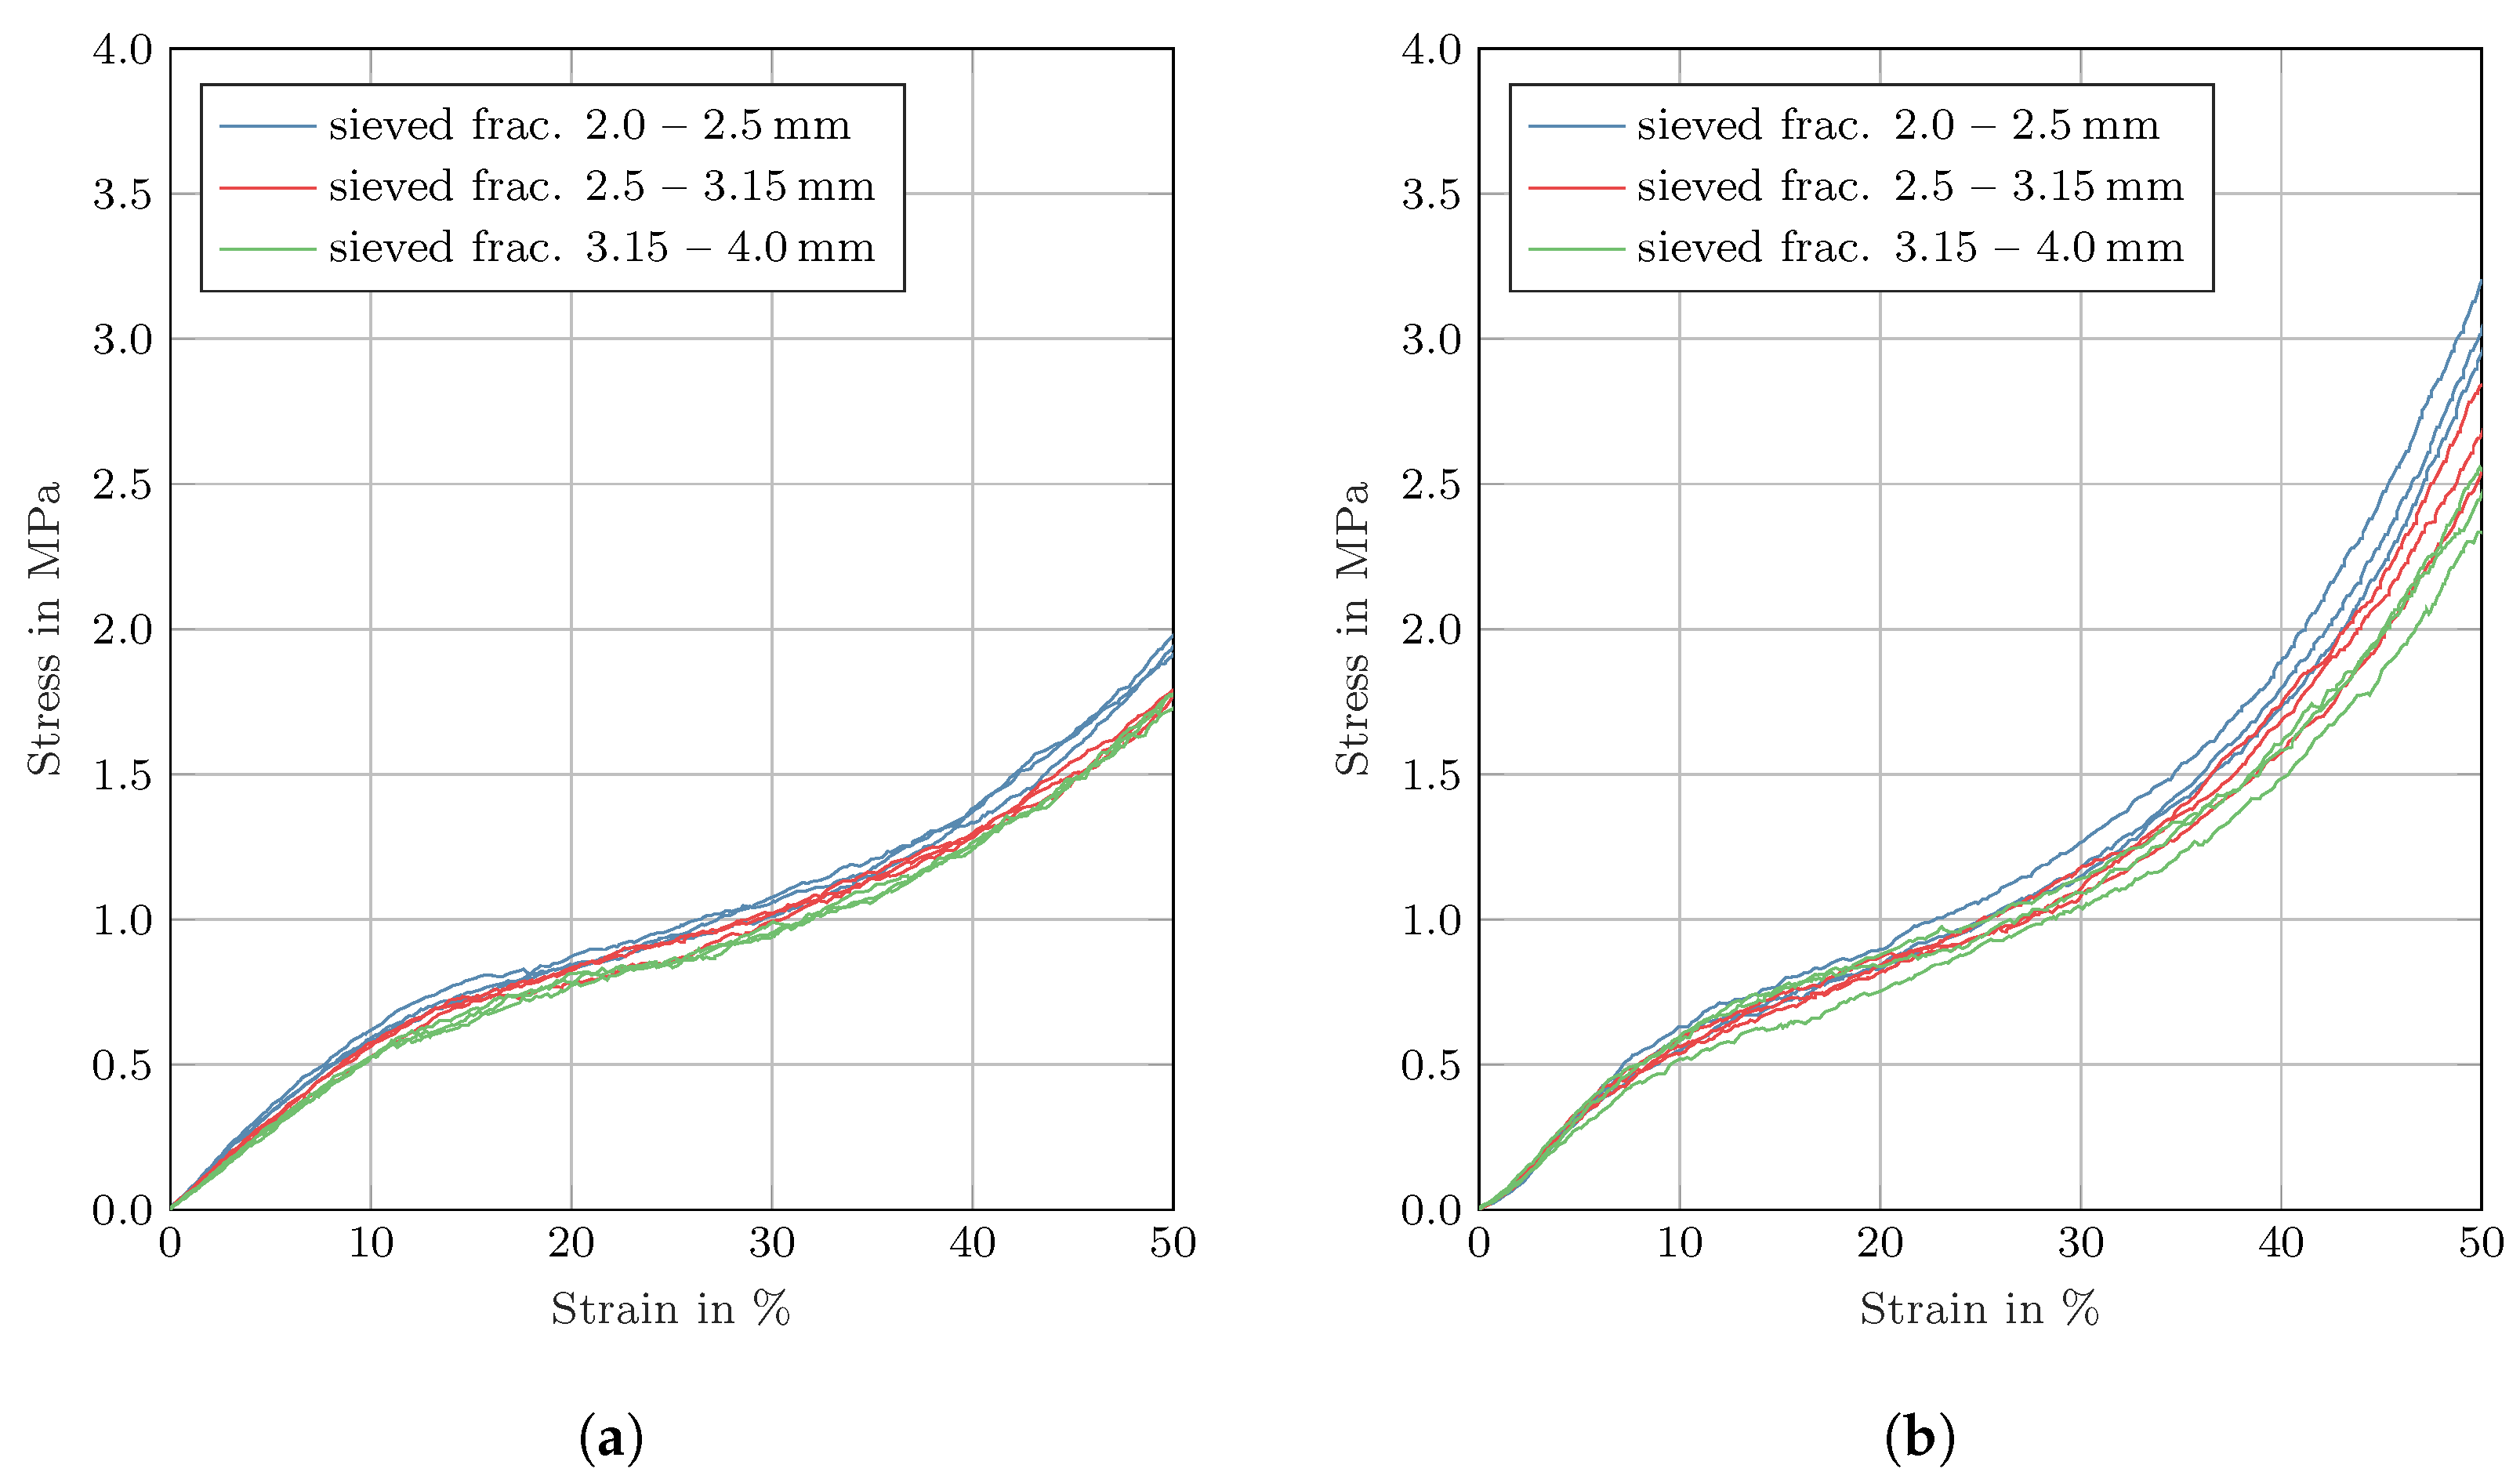
Figure 9 shows the compressed uncoated particles after their removal from the cylinder. Most of the uncoated particles were crushed to powder. In order to further reduce variation in the results, the particles were sieved beforehand, similar to the preparation procedure for the uniaxial single-particle compression test, as mentioned before. The corresponding results are depicted in
Figure 11a. Within each diameter fraction, variation of the stress reduced. At 50% strain, the stress varied by less than 5%. A comparison between plots for all the sieved diameter fractions showed similar mechanical behavior in the region up to a strain of 10%. At higher strains, the stress was different for each fraction. However, the total variation between all three sieved diameter fractions was similar to unsieved particles. An increased stiffness for the smallest diameter fraction 2.0 mm–2.5 mm was observed. This effect was explained by Equation (
3), where an increase in the initial diameter of particles led to a decrease in the stress values. Overall, it was apparently not advantageous to sieve the particles before they were used inside a ship’s double hull.
Figure 10b highlights the results obtained for wax-coated particles. The overall stress–strain behavior was similar to the one observed for uncoated particles. Nevertheless, there were differences in terms of strain limits for the three consolidation regions and their respective values of Young’s modulus. The initial elastic strain limit, derived from the averaged curve, was at 4% with a Youngs’s modulus of 6.54 MPa. Beyond this limit, the value dropped to less than half of the elastic limit at 2.728 MPa. Observing the compression process during the experiment revealed that the wax started to peel away from the particles, similarly to that in the single-particle compression tests. Nonetheless, the sticky and frictional behavior of wax led to a more pronounced compaction as the split wax materials moved in between the spaces of particles. Additionally, it made it easier for the remaining intact particles to slide over and fill the spaces between each other. Therefore, the Young’s modulus only decreased up to 20% strain, which was twice as fast as for uncoated particles. Beyond this limit, an exponential increase in Young’s modulus was observed with a value of 16.186 MPa at 60% strain. In contrast, the uncoated particles reached a value of only 6.080 MPa. The different behavior of wax-coated particles was visible in
Figure 9. The compressed particles were extremely stiff and difficult to remove from the cylinder. Instead of a powder, the smaller pieces were more brick-like lumps.
Figure 11b highlights that sieving the wax-coated particles into diameter fractions reduced the variations between the results, which was similar to that for uncoated particles. At 50% strain, the variation between each sieved diameter fraction was approximately less than 10%. In contrast, the variation between unsieved particles lay at around 15%. Moreover, all the sieved diameter fractions exhibited a similar stress–strain behavior of up to 7% strain. However, the total variation between the three diameter fractions was similar to that for unsieved particles, as observed for uncoated particles.
The outcome of the multi-particle compression tests for silicone-coated particles did not show visible consolidation areas between the individual test runs, as depicted in
Figure 10c. The Young’s modulus continued to increase until the maximum strain limit was reached. Furthermore, the initial value of 1.654 MPa was lower than for wax-coated and uncoated particles. The reason for this behavior could be derived from the fluidization process. As agglomerates were present, in which individual particles were connected by solid silicone bridges, not all particles could easily be separated from each other. Consequently, the filled cylinder was loosely packed, as compared to uncoated and wax-coated particles. Although the weight of the particles was identical, the sample height within the cylinder varied significantly for each experiment, because of the different void spacing between single particles and agglomerates. Moreover, the agglomerated silicone particles were unable to pass through the sieves. In the case of multi-particle tests, forceful separation was not performed, since this might lead to internal structural damage. The end result of one experiment, along with the initial packing and particle deformation compression, is portrayed in
Figure 9. The compacted silicone-coated particles were soft, flexible, and sponge-like and, thus, they could be removed from the cylinder easily. Additionally, there were hardly any particles present as powder. This highlighted the ductile nature of the silicone coating, which kept the damaged inner particles sticking together, similarly to that in the single-particle compression tests.
3.5.2. Energy Absorption
The energy absorption capabilities of coated and uncoated particles were compared using the same method as for the single-particle test. An average curve was derived from all experiments. For this, the displacement limit
s to calculate the energy absorbed
was set to 7 mm. The corresponding force
F at that point is listed in
Table 4 along with the remaining results.
The energy absorbed by wax-coated particles was significantly higher than the rest, due to their highly stiff, brittle, and compact packing nature. Silicone-coated particles absorbed less energy, even compared to uncoated particles. However, for this coating material, the result was misleading as the stress–strain curve was not divisible into distinct regions because of the loose packing nature. In comparison to single-particle compression tests, silicone was expected to perform better than wax because of its ductile nature, keeping damaged Poraver
® particles wrapped together. The frictional effect of wax-coated particles, highlighted by the increased surface roughness, did not have an effect in the single-particle tests. Nevertheless, this was observable in the multi-particle tests translating into increased energy absorption. With regard to the application as a granular filling material, the experiments with the double-hull filled with Poraver
® particles showed an increased energy absorption by 22–146% [
9]. Since the wax-coated particles absorbed 1.3 times more energy than uncoated particles in the multi-particle compression test, they were expected to absorb more energy in the double-hull experiment as well, especially in the region around the bulbous bow, where significant deformation took place. Although the rupture of the inner hull might occur for a lower displacement of the bulbous bow, as shown in
Figure 1, it was also dependent on the crack prorogation of the steel plates [
9]. Therefore, to draw concrete conclusions for the application of wax-coated particles inside the double hull, it was necessary to either repeat such experiments or to perform simulations. In the case of silicone-coated particles, as mentioned before, the energy absorption results from the multi-particle compression test were not reliable. However, the single-particle compression tests did show a higher energy-absorbing potential. Overall, both coated particles were expected to perform better than uncoated particles as a filling material for double hulls of ships.
4. Conclusions
The aim of this work was to investigate the influence of a coating on Poraver® particles in order to increase the energy absorption capability. For this purpose, two different coating materials were tested, namely Candelilla wax and a two-component silicone. While the coating process with Candellila wax led to a thorough coating after properly adjusting the process parameters, silicone presented itself as a more challenging coating material. Due to the high viscosity of the silicone, the injection posed some difficulties, and, once the silicone was successfully sprayed onto the particles, agglomeration occurred. Nevertheless, it was possible to produce a sufficient number of silicone-coated particles to carry out the intended tests. Both coatings led to a rougher surface compared to untreated Poraver® particles, due to the fact that some of the droplets covered the particle surfaces only partially. Moreover, the silicone coating exhibited some defects leading to uncoated spots, and, thus, influencing the mechanical properties.
Following the coating process and surface investigation, additional mechanical tests were executed. In order to recreate the permanent dynamic loads acting on the particles while inside the double-hull of a ship, an abrasion test was carried out. This test showed high abrasion with untreated granules, while both coatings prevented abrasion nearly totally, indicating the necessity of a coating on the Poraver® particles.
Moreover, the coated particles were tested in uniaxial compression tests to reveal the influence of the coating on the mechanical properties and energy absorbing capabilities, in comparison to untreated Poraver® granules. The results of the single particle compression tests showed a slight decrease in all investigated mechanical properties for the wax-coated particles. These properties included the crushing force and strain, as well as the Young’s modulus. In comparison, a silicone coating led to higher average crushing forces for the two bigger diameter fractions. Regarding the absorbed energy, all coated samples led to smaller amounts of absorbed energy during the crushing process, except regarding the biggest fraction of silicone-coated particles with diameters of 3.15 mm to 4 mm. These findings led to the conclusion that silicone-coated particles might have a high potential to improve the mechanical properties of glass particles if the coating process could be improved to reduce agglomeration and increase the coating thickness.
In addition, multi-particle compression tests were conducted to investigate the influence of the coatings on the particles’ interactions. The results showed equal scattering of the stress–strain curves for coated and uncoated particles and a similar influence of sieving for untreated and wax-coated particles. Moreover, the averaged energy absorbed by the different samples revealed huge differences. While the wax coating increased the absorbed energy, compared to untreated Poraver
®, the silicone-coated particles showed a decreased energy absorption. From this, it could be concluded that a wax coating was more suitable for the given purpose, since the energy dissipation capabilities of large numbers of particles played a much bigger role than single granules. Furthermore, wax is a natural and environmentally friendly material that allows for an even particle coating in a fluidized bed without any problems regarding agglomeration. However, further coating materials that fulfil the given requirements for granular fillings in the double-hull of a ship, especially with regard to environmental friendliness, should be tested. The experimental results were used to verify numerical simulations as introduced in [
28]. Numerical simulations enabled the possibility of predicting the behavior of different particle setups, which is of great importance for the evaluation of the performance of different particles in desired applications without the need for cost intensive experiments at a large scale. Due to the differences in shape, size and porosity of the core particles, as well as different layer thicknesses of the applied coating, the theoretical description of the behaviour of the particle bulk in a large scale application is challenging and needs to be investigated using complex numerical simulations.


 ,
, 


