Review

Bioinformatics Methods for Constructing Metabolic Networks

by
Denis V. Petrovsky
1,
Kristina A. Malsagova
1,*,
Vladimir R. Rudnev
1,2,
Liudmila I. Kulikova
1,2,3,
Vasiliy I. Pustovoyt
4,
Evgenii I. Balakin
4,
Ksenia A. Yurku
4 and
Anna L. Kaysheva
1
1
Institute of Biomedical Chemistry, 119121 Moscow, Russia
2
Institute of Theoretical and Experimental Biophysics, Russian Academy of Sciences, 142290 Pushchino, Russia
3
Institute of Mathematical Problems of Biology RAS—The Branch of Keldysh Institute of Applied Mathematics of Russian Academy of Sciences, 142290 Pushchino, Russia
4
State Research Center—Burnasyan Federal Medical Biophysical Center of Federal Medical Biological Agency Center, 123098 Moscow, Russia
*
Author to whom correspondence should be addressed.
Processes 2023, 11(12), 3430; https://doi.org/10.3390/pr11123430
Submission received: 2 November 2023 / Revised: 28 November 2023 / Accepted: 7 December 2023 / Published: 14 December 2023

Abstract

:
Metabolic pathway prediction and reconstruction play crucial roles in solving fundamental and applied biomedical problems. In the case of fundamental research, annotation of metabolic pathways allows one to study human health in normal, stressed, and diseased conditions. In applied research, it allows one to identify novel drugs and drug targets and to design mimetics (biomolecules with tailored properties), as well as contributes to the development of such disciplines as toxicology and nutrigenomics. It is important to understand the role of a metabolite as a substrate (the product or intermediate participant of an enzymatic reaction) in cellular signaling and phenotype implementation according to the pivotal paradigm of biology: “one gene–one protein–one function (one trait)”. Due to the development of omics technologies, a vast body of data on the metabolome composition of living organisms has been accumulated over the past two decades. Systematization of the information on the roles played by metabolites in implementation of cellular signaling, as well as metabolic pathway reconstruction and refinement, have necessitated the development of bioinformatic tools for performing large-scale omics data mining. This paper reviews web-accessible databases relevant to metabolic pathways and considers the applications of the three types of bioinformatics methods for constructing metabolic networks (graphs for substrate–enzyme–product transformation; stoichiometric analysis of substrate–product transformation; and product retrosynthesis). It describes, step by step, a generalized algorithm for constructing biological pathway maps which explains to the researcher the workflow implemented in available bioinformatics tools and can be used to create new tools in projects requiring pathway reconstruction.

1. Introduction

In the “pre-genomic” era, design or reconstruction of metabolic pathways seemed to be a fairly simple task, since key metabolic enzymes, similar in structure and homologous in sequence, that catalyze the same reactions had been discovered in different organisms [1]. However, with the development of “omics” technologies, the availability of genomes and their products has radically changed this idea. Apart from the increasing number of newly identified molecular participants in signaling pathways, it has become apparent that enzymes similar in function but not homologous in sequence are common in nature [1]. So, reconstructing the metabolic pathways of living organisms and correlating a molecule with a biochemical process and a biological pathway have become important tasks in the field of systems biology.
Indeed, in the last two decades, omics research has generated a significant amount of data, becoming an important source of information about the composition and content of biomolecules in living organisms in different states of health and ontogenesis [2,3]. Operating with large amounts of experimental data, such as metabolomic, proteomic, transcriptomic, and other profiles of a bio-sample, researchers inevitably face the problem of performing intellectual analysis of multidimensional data and reaching their interpretation, primarily in order to identify the connection between a biomolecule and the development of pathological processes in an organism. As a response to this challenge, bioinformatic analysis (metabolic pathway databases) and biological pathway prediction tools (pathway maps) have been developed [4]. These tools make it possible to operate with data from genes, proteins, and metabolites, accounting for their involvement in signaling pathways in both healthy and pathological conditions [5].
Today, the most popular metabolic pathway databases include the Kyoto Encyclopedia of Genes and Genomes [6], Reactome [7], MetaCyc [8], and The Human Metabolites Database [9], which are arranged as regularly updated, open web-based resources, and include analytical tools to work with the data. The number of such databases has grown over the past two decades in an attempt to systematize the information on molecular participants of metabolic transformations and ensure the availability of information for studies in the fields of systems biology and biomedicine seeking solutions for scientific and practical problems of healthcare [10].
Bioinformatics approaches to the design and reconstruction of biological pathways and biochemical processes are being actively improved. Currently, more than two dozen such solutions, different in their implementation algorithm and purpose, are available. Despite their diversity, the algorithms for recognizing and correlating biochemical transformations can be classified into certain groups, as demonstrated in the graphs describing substrate–enzyme–product transformation; stoichiometric analysis of substrate–product transformation; and product retrosynthesis following the rules of chemical reactions [11,12,13,14].
This review is intended for a wide range of researchers in the field of biomedicine, and introduces the reader to the main tools for reconstructing metabolic pathways in order to enable researchers to determine the optimal bioinformatics tool for solving a specific scientific problem. However, it does not focus on a detailed and thorough description of specific tools or reconstruction of a specific signaling pathway, since this information is available and covered in numerous articles. This is the case because, within the framework of one study, it is quite difficult to cover all aspects worthy of attention and provide both the broadness and the necessary depth of the analysis. For that reason, the purpose of this review was to discuss the popular and most convenient metabolic pathway databases for routine practice, as well as to describe the key stages of implementing pathway design algorithms such as database selection, visual representation of a metabolic network, reduction of the metabolic network, the search for a biological pathway while ranking the search results, and promising directions for using various tools.
The primary analysis was performed using such resources as the National Library of Medicine (PubMed) and Mendeley for the keywords “metabolic or metabolome databases”, “metabolic pathways”, “pathway maps”, “biochemical network”, “graph or hypergraph-based tool for metabolic pathway”, “metabolic pathway analysis”, and “computational tools for reconstruction of metabolic pathways”. We analyzed the literature from the past ten years and used secondary literature sources.

2. Popular Metabolic Pathway Databases

Metabolic pathway annotations and maps are currently available in several web-accessible databases. The most popular one is the KEGG database [15,16,17]. Such databases as MetaCyc [8], BioCyc [18], and Reactome [19,20] are also known. The databases vary in terms of annotation completeness, their repertoires of analytical tools, and the scope of their application. Table 1 lists the description of web-accessible databases of metabolic pathways.

2.1. Kyoto Encyclopedia of Genes and Genomes

The KEGG (Kyoto Encyclopedia of Genes and Genomes) database was initiated in 1995, having been developed by the Kanehisa Laboratory of the Kyoto University Bioinformatics Center, and the Human Genome Center at the University of Tokyo (Figure 1).
KEGG is a knowledge base for systematic analysis of gene functions, ensuring linkage of genomic information with functional data at different molecular levels: proteins, endogenous metabolites, and xenobiotics [6]. Today, KEGG is a resource integrating sixteen databases, which are categorized into the following clusters: information about living systems (KEGG Pathway, KEGG Module, etc.), genomic information (KEGG Orthology, KEGG Genes, and KEGG Genome), information about chemical compounds (KEGG Compound, KEGG Glycan, KEGG Enzyme, etc.), and information about well-being and diseases (KEGG Disease, KEGG Drug, KEGG Network, etc.) [15,29]. The genomic information is stored in the Genes database, which contains gene catalogs for both completely and partially sequenced genomes of organisms, together with relevant functional gene annotation. Functional information is stored in the Pathway database, which is a collection of graphical representations of cellular processes such as metabolism, membrane transport, signal transduction, and cell cycle. The Compound, Glycan, and Enzyme databases contain information about the participants in the metabolic pathways. The KEGG databases are analytical tools for data analysis, including comparative analyses of genome maps and computations of the metabolic pathways. Biological systems are manually visualized as metabolic pathway maps by collecting the data from the published information sources [15].
KEGG is organized as a graph-object resource for representing and manipulating genomic, chemical, and network data. A graph is a set of nodes (building blocks) and edges (interactions or relations). Another aspect of KEGG is network hierarchy. Thus, the protein network is stored as a set of pathway maps in the Pathway database, which represents patterns of connections between proteins and other gene products responsible for various cellular functions. Pathway maps are hierarchically classified in accordance with the map resolution and functional modules at different levels [29,30].

2.2. Reactome Database

The project for creating the Reactome database was initiated in 2003. This database was founded by Lincoln Stein (Ontario Institute for Cancer Research, Canada), Peter d’Eustachio (New York University Langone Health, USA), Henning Hermjakob (European Bioinformatics Institute, UK), and Guanming Wu (Oregon Health and Science University, USA) (Figure 2).
Like the KEGG knowledge base, the Reactome database of human biological pathways was curated manually by analyzing the literature sources, and is peer-reviewed by experts in biology and biochemistry [7]. The core annotation unit in the Reactome database is a chemical transformation (reaction) verified by the experimental data [31]. Chemical transformations linked by common molecular components are clustered into biological pathways [32]. The web-accessible Reactome database visualizes the known biological pathways as graphical maps and offers tools for their analysis, including annotations of molecular components, and facilitates searching for and systematizing biological information. The Reactome modules (biological pathway and molecular component) contain cross-links to 100 online resources, including the NCBI Gene, Ensembl, and UniProt databases, the ChEBI database of small molecular entities, the Pubmed database of literature sources, etc. The data and software are open access.
The Reactome data model uses a frame-based knowledge representation and consists of classes (frames) that describe reactions or entities. Classes have attributes (slots) that hold properties of the represented class instances, like names or identifiers. The value types contained in the slots can be primitive (string, numbers, or Boolean) or references to other class instances [19]. The “Knowledgebase” of biomolecular pathways is organized as a graph database. A graph database has two main advantages: higher performance and simpler ways to perform complex queries [19].

2.3. MetaCyc Database

The MetaCyc database contains annotations of the metabolic pathways of different living organisms, which were also curated by analyzing sources in the literature [8]. Database development was initiated in the early 2000s by the Bioinformatics Research Group of the American Non-profit Research Institute (USA) (Figure 3).
The database contains information about the biological pathways, biochemical transformations (reactions), and biological participant molecules (enzymes and low-molecular-weight compounds), as well as relevant sources in the literature [8]. The MetaCyc database is part of the “Patho-Logic” component of the Pathway Tools software version 23.0 [33], usable as a source of data for predicting metabolic reactions and determining the biological pathways of a living organism.
The web-accessible service Plant Metabolic Network (PMN) provides access to information collected about the common and unique metabolic pathways of more than 500 plant species. The PMN database was first opened to the public in 2008 and was created by researchers at the Department of Plant Biology of the Carnegie Institution for Science (USA). The core of PMN is the PlantCyc plants database containing the biological pathways and their components. In PlantCyc, the data on biological pathways are collected from the literature sources and verified by experimental data. In addition, the PlantCyc database contains the experimentally verified pathways from 100 databases specializing in certain plant species [34]. The PMN database is updated every six months.
MetaCyc data can be presented in BioPAX [35] and Pathway [36] formats. The BioPAX format is a community-driven standard language used to represent biological pathways at the molecular and cellular level and to facilitate the exchange of pathway data. BioPAX can represent metabolic and signaling pathways, molecular and genetic interactions, and gene regulation networks. The BioPAX format is based on an OWL (Web Ontology Language [37])-based data exchange syntax which helps to interpret the pathways data.
Pathway uses an attribute–value model, and its files contain data in a format that corresponds closely to the Pathway Tools schema [36,38]. A file is provided for each class of data object, such as genes, proteins, and reactions.

2.4. Human Metabolome Database

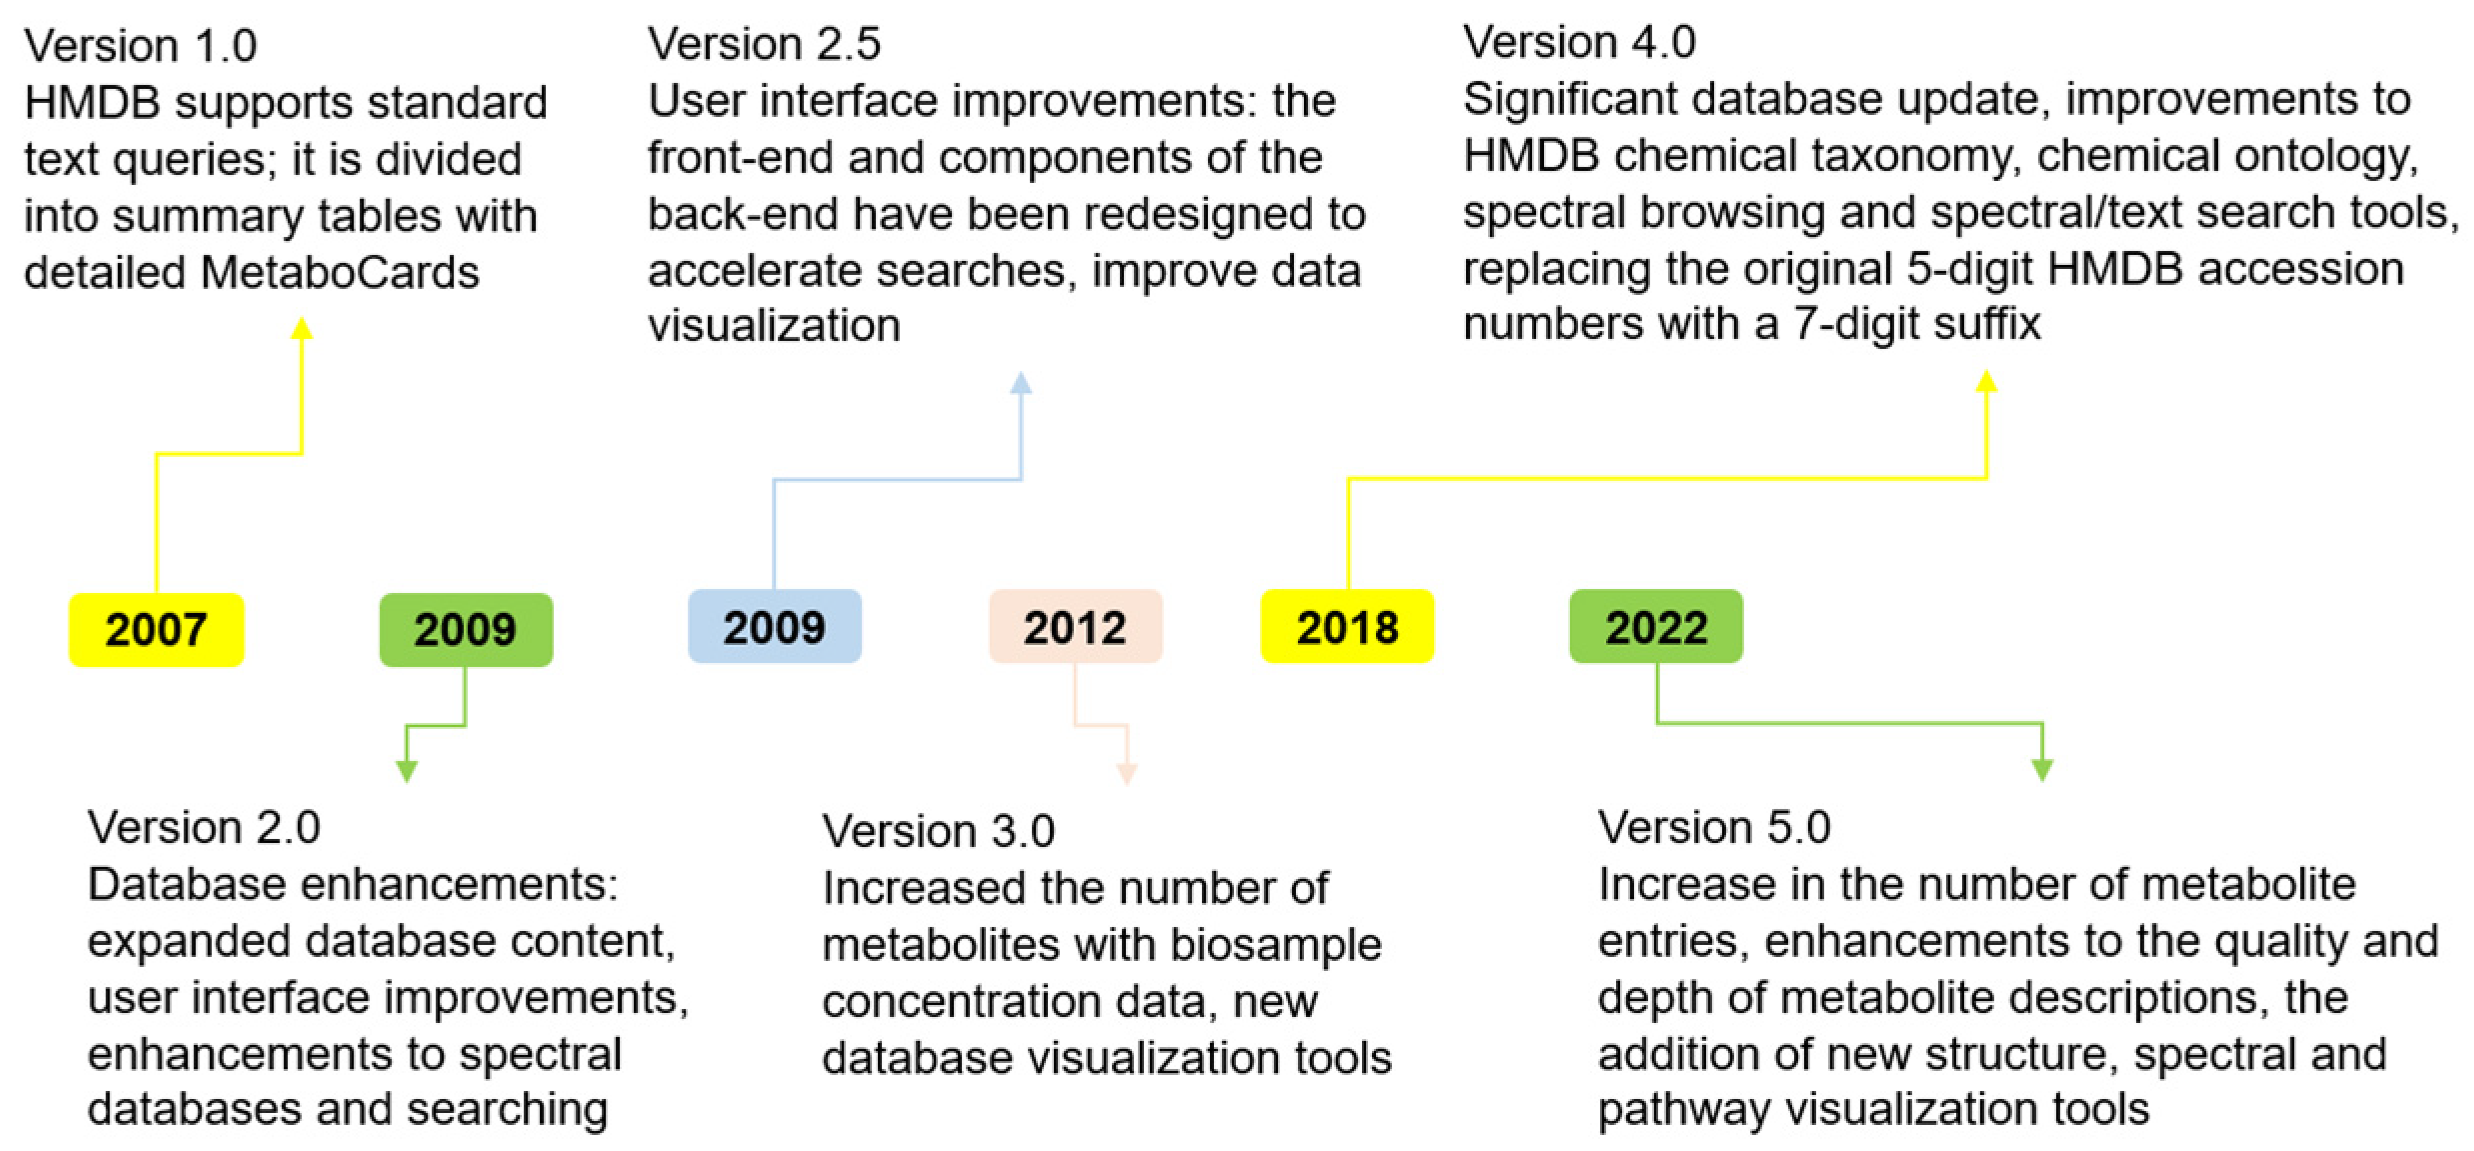
HMDB (the Human Metabolome Database) is the electronic database of small-molecule metabolites detected in the human body. The database has been developed by a research group led by David Wishart at Yale University (USA) since 2007, and aims to solve research problems in such fields as metabolomics, clinical chemistry, and searching for novel biomarkers (Figure 4).
HMDB consists of three modules: the chemical and clinical data, the molecular biology data, and the biochemistry data. A “MetaboCard” (the metabolite’s individual card) contains information about 130 parameters, most of which deal with annotation of the chemical and clinical data; the data on enzymatic or biochemical transformations (KEGG, PubChem, MetaCyc, ChEBI, PDB, UniProt, and GenBank) in which the metabolite is involved are also presented [9]. There are several different algorithms for searching metabolites in the database such as ChemQuery Structure Search, Molecular Weight Search, Text Query, Sequence Search, LC-MS Search, LC-MS/MS Search,1D NMR Search, 2D NMR Search. An important feature making this database stand out among other similar ones is that it collects and annotates the data on the quantitative contents of investigated metabolites in normal and pathological states in different types of human biological samples. Searching by sequence allows users to perform BLAST alignment of the sequences of genes and proteins contained in HMDB. The database contains the libraries of reference mass spectra and nuclear magnetic resonance data. Furthermore, specialized databases of drugs and their metabolites (DrugBank), toxins and environmental contaminants (T3DB), and diagrams of biological pathways of the human organism in both healthy and diseased states (SMPDB), as well as food components and food supplements (FooDB), are important HMDB modules [9].
The WikiPathways project was initiated in 2007 by researchers B. Conklin (Gladstone Institute, San Francisco, CA, USA) and C. Evelo (Maastricht University, Maastricht, The Netherlands) (Figure 5).
WikiPathways is the database of biological pathway models curated and peer-reviewed by the research community [39]. One feature of this database is that it is an open-science platform that allows end users to edit the annotated biological pathways. The database consists of several communities (modules), each aiming to solve a specific biomedical problem, including:
The COVID-19 Community, containing the data on the molecular mechanisms of coronavirus infection in the human body;
The IMD Community, presenting the data on inherited metabolic disorders;
The PancCanNet Community, accumulating information about the biological pathways associated with the development of pancreatic cancer, etc. [39].
Although the number of databases integrating knowledge about the metabolic pathways in living organisms has been increasing over the past two decades, all these initiatives strive to systematize the information on participants of metabolic transformations and make information available to a wide range of researchers in the fields of systemic biology and biomedicine in order to solve research problems and enable the use of the information in practical healthcare [10].
Pathways are encoded in GPML (Graphical Pathway Markup Language) format [40] and created with PathVisio software version 3.3.0 [41]. Genes, proteins, and metabolites are linked to other databases with the BridgeDb web service [42]. All components are freely available, developed in open collaborations, and distributed as an open-source or open-access products. For database searching, a search tool called Pathway Finder is available. Pathway Finder can be used to find pathways based on indirect queries such as targets of specific microRNAs or which metabolites are converted by specific enzymes.

3. Methods for Constructing Biological Pathway Maps

Interpretation of comprehensive data acquired by high-throughput omics technologies (sequencing and mass spectrometry) calls for designing tools to analyze and predict biological pathways [4]. The problem of interpreting the experimentally acquired long lists of genes, proteins, and metabolites in the context of the involvement of biological molecules in the signaling pathways can always be solved by developing novel approaches for biological pathway annotation and mapping in living organisms [5].
More than two dozen bioinformatic approaches for designing biological pathways and biochemical transformations as integral pathway components are available today; they differ as to implementation algorithm. Kotera and Goto (Tokyo Institute of Technology, Japan) proposed the biological pathway reconstruction approach, which is based on structural and functional similarities between enzymes. According to this approach, the enzyme participating in a known biochemical transformation of a substrate into a product acts as a reference for predicting the behavior of homologous enzymes belonging to other taxonomic groups [43]. Nakamura et al. (Keio University, Japan) proposed an approach for representing a biochemical transformation as a data array that is controlled using operator vectors. According to this approach, a set of rules for chemical reactions annotated in the KEGG database is translated into sequences of operator vectors describing changes in the chemical structures of substrates yielding products as a result of enzymatic transformations [44]. A similar approach for biochemical transformation reconstruction and synthesis of low-molecular-weight compounds, based on the rules of chemical transformation of the substrate, was proposed by researchers from the Korea Institute of Science and Technology (Seoul, Republic of Korea) [45].
Despite their versatility, the algorithms for recognition and assignment of biological transformations can be clustered into three groups [36,38]:
Constructing graphs describing the substrate–enzyme–product transformation;
Stoichiometric analysis of substrate–product transformation;
Retrosynthesis of the product in compliance with the rules of chemical reactions.
For all three groups, the process of designing a biological pathway or a biochemical transformation consists of the five steps listed in Table 1:
Choosing the database;
Metabolic network visualization;
Reduction (compression) of the metabolic network;
Searching for a biological pathway/biochemical process;
Ranking the search results.

3.1. Methods for Metabolic Network Visualization

The biological pathways can be visualized as complex networks or graphs in which the vertices and edges most often correspond to biological molecules and chemical transformations, respectively [46].
The most common methods used for simulating and visualizing complex biological pathways include the chemical transformation and metabolite (substrate) graph theory, bipartite and multilayer graphs, hypergraphs, and the scatterplot matrix.
Structurally, the chemical transformation graph (MetaRoute [22]) is a simple graph in which vertices correspond to chemical transformations, and edges, to metabolites (reaction participants) (Figure 6). This graph is used for shortest-path topological analysis [46].
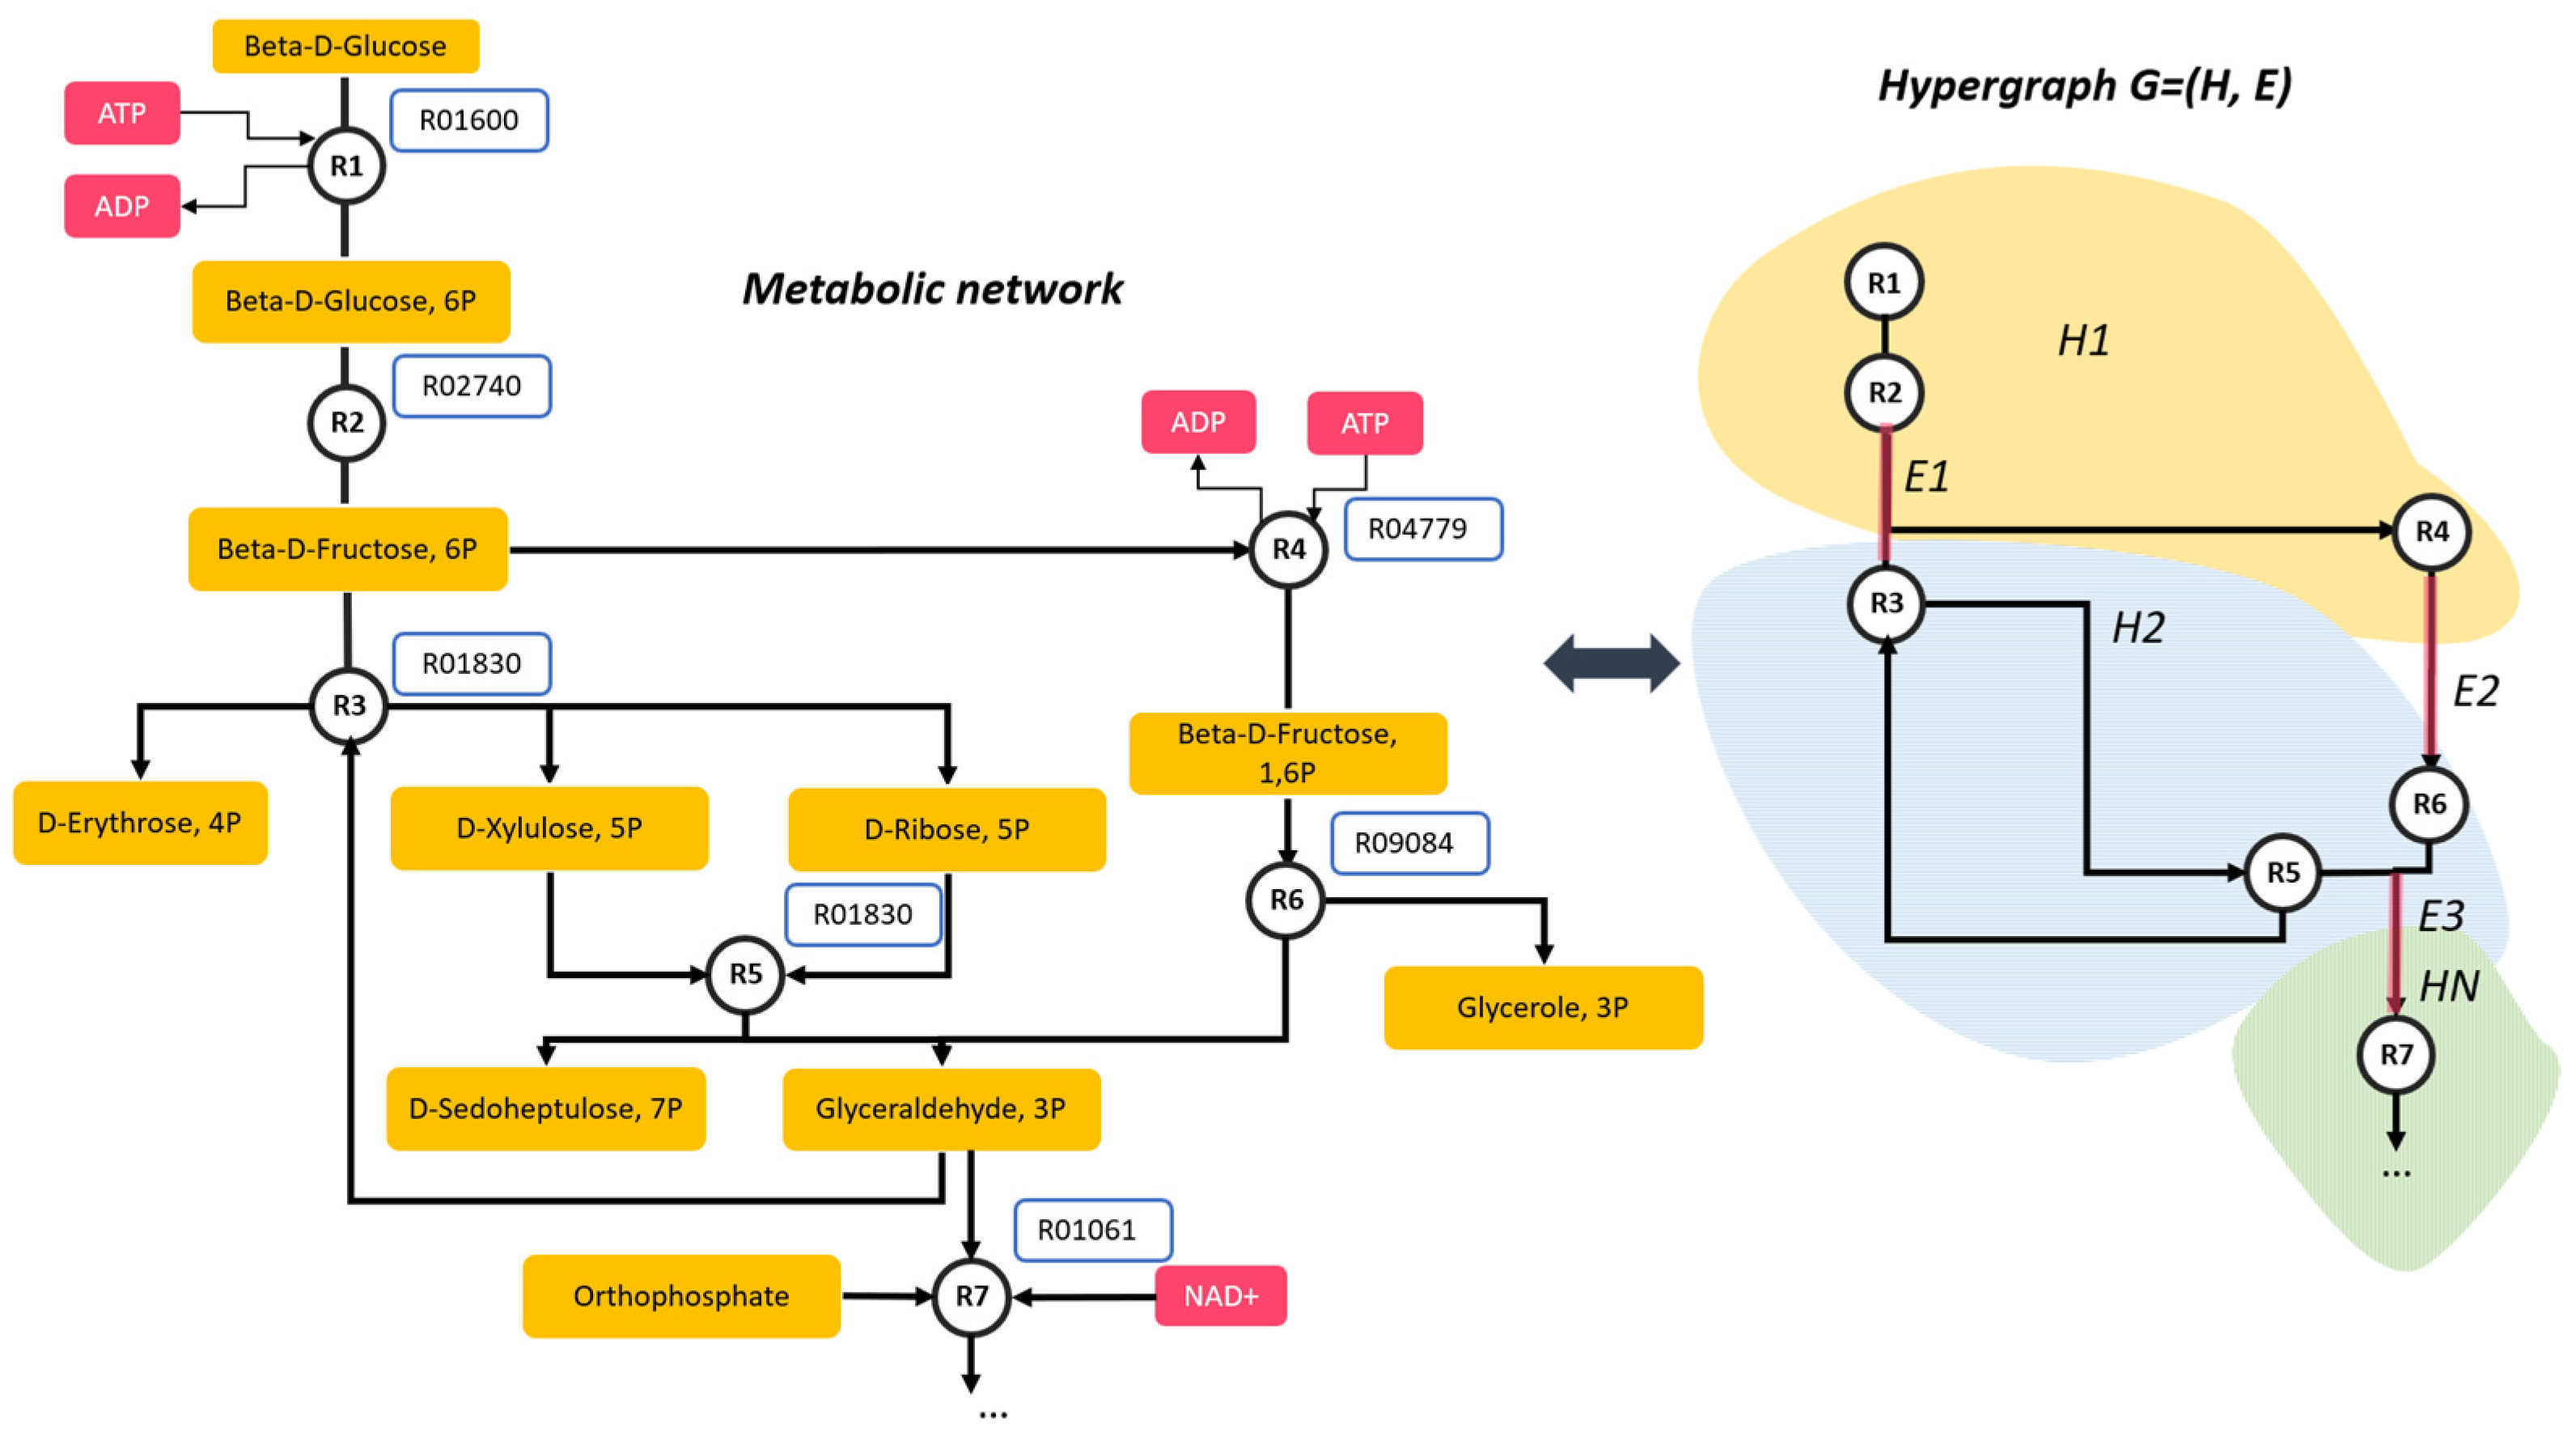
The bioinformatic tools Rahnuma [47], Metabolic Tinker [48], and FogLight [49], which are used for biological pathway analysis and prediction, visualize the metabolic networks as hypergraphs. In these graphs, the edges (referred to as hyperedges) connect two or more vertices and represent chemical transformations [50], while graph vertices correspond to metabolites (Figure 7).
Therefore, the hypergraph views the reaction as an integral whole and indicates transformations between any number of metabolites (chemical transformation participants) [47].
The stoichiometric matrix, or the scatterplot matrix, is also employed in a number of biological pathway prediction tools: optStoic [13], PathTracer [24], CFP [51], etc. In the stoichiometric matrix, each data element (row) corresponds to a metabolite, while each measurement (column) corresponds to a biochemical transformation [46]. The results of the matrix computation can be positive or negative, which is indicative of the stoichiometric consumption of reagents and products, respectively.

3.1.1. Metabolic Network Reduction (Compression) Variants

As the sizes of the metabolic networks of living organisms increase (up to thousands of biochemical transformations), their analysis, including brute-force search across elementary modes, becomes extremely difficult, and cannot be performed because of high computational costs [52,53]. Algorithms for compressing, or simplifying, the metabolic networks to the central core (the major biochemical transformations) are used to reduce the metabolic flux search field [54]. It is preferable to identify the metabolic core models for understanding the molecular foundations of the organism’s central metabolism. These models retain the key reaction participants and the most important functional properties [52]. Several approaches to the reduction of genome-scale metabolic networks have been announced in the available literature [54,55,56]. However, a unified automated approach to network compression that would be applicable to any metabolic network still needs to be elaborated [54]. The criteria for classifying these approaches are as follows: (a) analysis of the network structure using the data on stoichiometry and/or kinetics of biochemical transformations [57,58,59,60,61]; and (b) metabolic network reduction with properties being retained [52,62]. The approaches to metabolic network reduction can also either be fully automated or require data entry by the end user [57,58]. Table 2 compares the approaches to metabolic network reduction.
The approaches to determining the minimal set of biological transformations in the biological pathway [58] aim to retrieve the minimal set of reactions required to preserve the key functional potential of the cell, including the rate of cell growth in a certain environment. These approaches do not preserve biochemical reactions and metabolites in the reduced network (MinReact). In comparison, the Network Reducer approach retains the desired metabolites and biochemical reactions, as well as the required degree of network flexibility by adding such criteria as the minimal degree of freedom. However, the approaches for determining the minimal set of reactions and the Network Reducer approach cannot embrace all the variety of subnetworks. The minNW algorithm overcomes this limitation to a certain extent. Along with the problems that can be solved by Network Reducer, the minNW algorithm assesses the possible variety of minimal subnetworks. Therefore, Network Reducer and MinNW are the top-down algorithms aiming to reduce a large-scale metabolic network to a network of minimum size. Contrariwise, redGEM and DRUM are the bottom-up approaches ensuring a transition from smaller subnetworks to the expansion and property recovery of the genome-scale metabolic networks [58]. Along with the linear and mixed-integer linear programming methods, the redGEM and DRUM algorithms employ graph algorithms and methods for detecting elementary flux modes, respectively. The constraints for the redGEM and DRUM algorithms are the refusal to fully automate the process and the requirement that data should be entered by the end user. The end user needs to have a deep understanding of metabolic pathways and metabolic features in the organism under study, which often hampers the determination of subsystems [58]. Furthermore, algorithms ensure metabolic network reduction by restrictions on the number of relationships between metabolites in a subsystem (redGEM) or denial of steady state for interrelated metabolites, thus leading to their accumulation (DRUM). Such a rough interpretation of associations between metabolites in subsystems alters the metabolic and phenotypic flexibility of the reduced network, compared to the complete metabolic network (at the genomic scale). Therefore, developers and end users of the algorithms for metabolic network reduction need to choose between the relatively strict projecting of a complete metabolic network onto smaller subnetworks with limited functional capabilities (e.g., the minimal sets of biochemical transformations, NetworkReducer, and minNW) and a more flexible visualization of biological pathways which approximately indicate the functional capabilities of a complete metabolic network (e.g., redGEM and DRUM) [58].

3.1.2. The Search for Biological Pathways

The choice of an algorithm for searching for the biological pathway depends on the approach used for recognition and mapping of biochemical transformations (i.e., graph construction, stoichiometric analysis of the substrate–product conversion, and retrosynthesis of the product).
Biological pathway graphs are most commonly constructed using such methods such as shortest-path search, depth-first search (DFS), informed search, breadth-first search (BFS), and the Monte Carlo method.
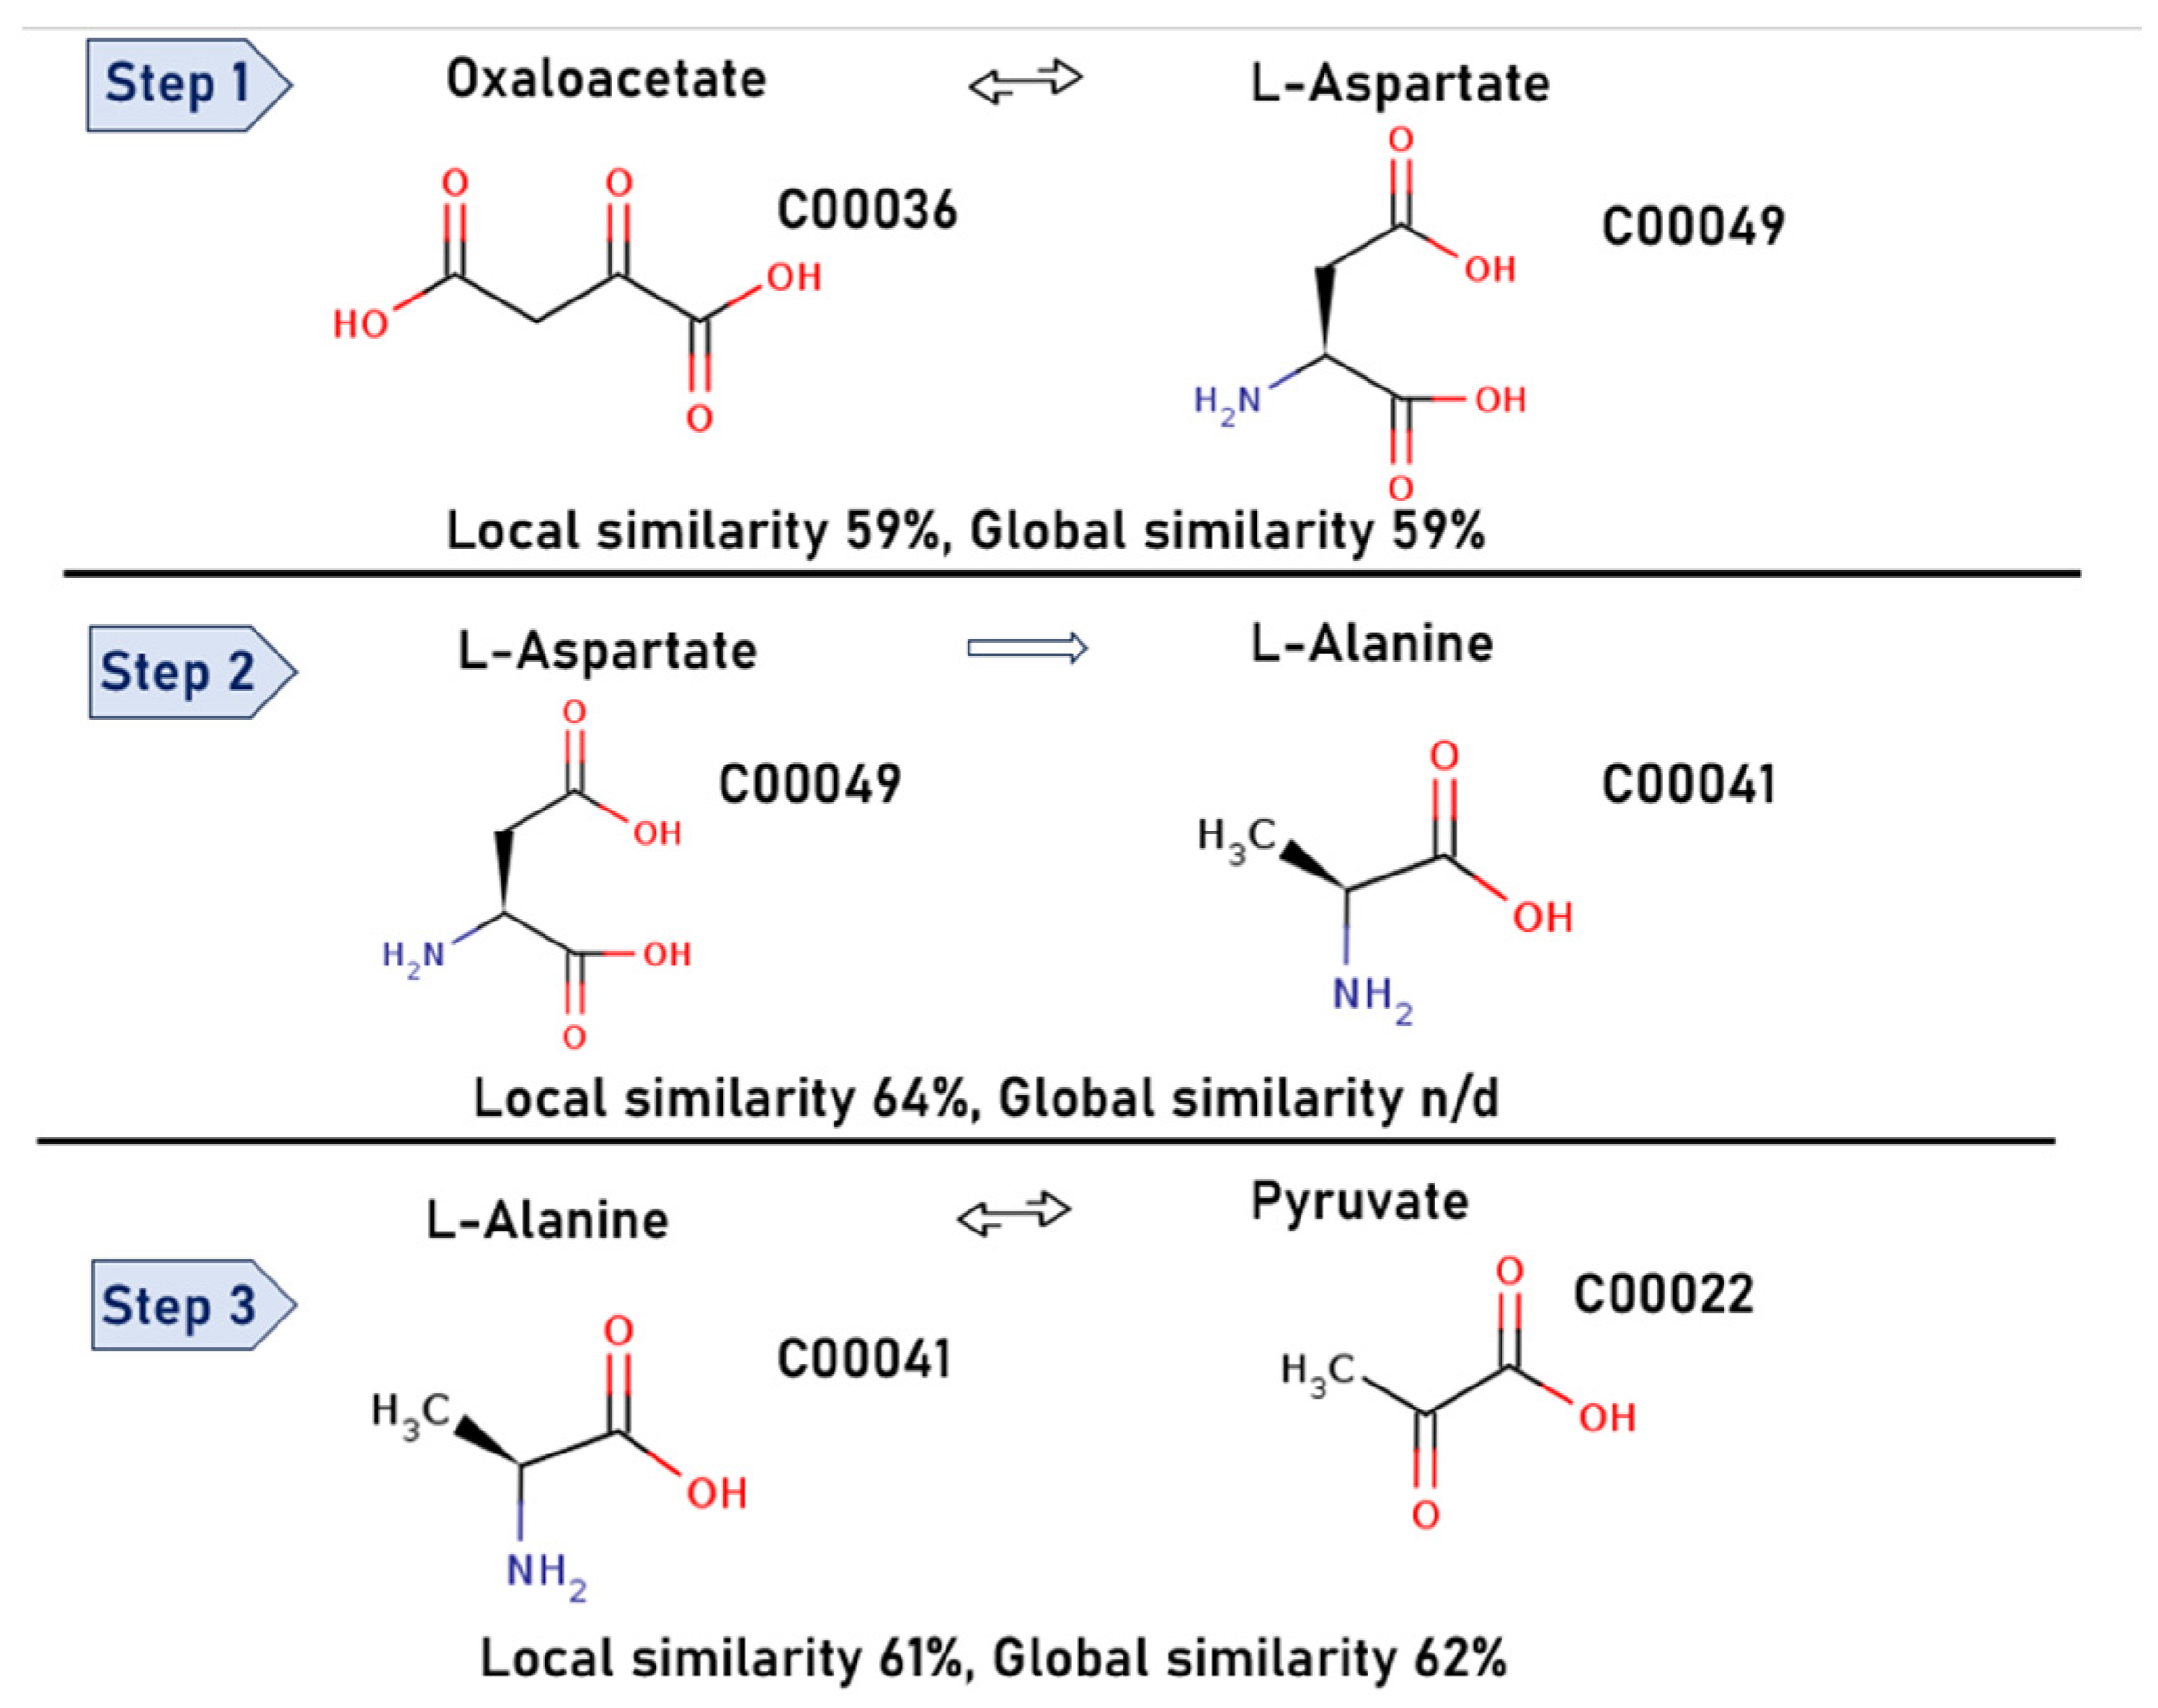
Breadth-first search (BFS) is a commonly used method for finding the shortest path (k) between two metabolites (Pathway Hunter) [11,21]. Finding the pathways k is performed using two biochemical criteria: the “local” and “global” structural similarities between metabolites. The “local similarity” is defined as similarity between two intermediate molecules, while “global similarity” is defined as similarity between the initial metabolite (the substrate) and the product after a series of biochemical transformations (Figure 8).
A drawback of the shortest-path search method is that there are no experimentally allowed structures of macromolecules (i.e., proteins and nucleic acids).
The depth-first search (DFS) method employs the procedure of finding elementary flux modes in metabolic networks (EFM), which are the minimal sets of reactions proceeding in the given direction [53,65]. The depth-first search strategy is implemented by indexing biochemical reactions for each EFM and detecting active and non-active free fluxes [65]. Alternation of the direct and reverse tracking programs allows one to detect and follow the descending active and non-active free fluxes (black arrows in Figure 9) and subsequently exclude the revealed non-active fluxes (MetQuest) [65,66].
In stoichiometric approaches, the biological pathway search is often performed using the mixed-integer linear programming (MILP) method. MILP allows one to extract the minimal and stoichiometrically balanced subnetwork, which describes conversion of a substrate to the target product with a high yield [13,67]. This approach is implemented in the optStoic and novoStoic tools [13,68].
The third group of methods predicting the retrosynthesis of the target product (e.g., Simpheny, GEM-Path, and XTMS) is no less important. Retrosynthesis methods have been developed in response to the demands from actual economic actors seeking to increase the amount of value-added chemical compounds that can be synthesized in industrial organisms. Studying the potential of integrating the metabolic pathways into the producer organism (E. coli) is a challenging task that necessitates the development of specialized metamathematical tools. Thus, the XTMS approach allows one to identify the set of the most probable biochemical transformations that can be implemented in vivo, and determine the rules of transformations (reactions), with allowances for the potential substrates and products (including non-natural ones), as well as the acceptable reaction yield, toxicity, and efficiency of enzymes participating in the reactions [28].

3.1.3. Ranking the Search Results

The approaches to metabolic pathway reconstruction determine several potential pathways for the conversion of the substrate under study to the product. The most common method for ranking the detected metabolic pathways is based on determining the number of reactions involved in the pathway. This parameter can be transformed into a rank function via the shortest path or the pathway with the minimal shared flux (optStoic, PathTracer, CFP, etc.) [11]. The shortest path contains the minimal number of biochemical transformations and is therefore characterized by having the minimal enzymatic and genetic burden for the cell. Thus, an approach of ranking by the minimal number of genes is implemented in the SimOptStrain tool [69]. In a similar way, when the host organism is known (e.g., in the OptStrain tool), the number of heterologous reactions (biochemical transformations uncharacteristic of the host organism) can be minimized. Contrariwise, the optimal enzyme activity and solubility need to be attained when working with heterologous enzymes or enzymes uncharacteristic of the host organism, using the retrosynthesis-based approaches [11].
Another method commonly used for pathway ranking is based on determining the thermodynamics and performing biochemical conversions. In this method, the detected biological pathways are ranked by negative changes in the total Gibbs free energy in the reaction (ΔG of the pathway), represented by a sum of ΔG values for each biochemical conversion within the pathway.
Other methods using a point system for metabolic pathway ranking are based on assessing the toxicity of the intermediate metabolites of the pathway in the host cell [11]. These methods are used to identify potentially toxic chemical compounds and negative effects relative to the host cell. Therefore, the choice of a pathway ranking method (methods) depends on the study’s objective.

4. Conclusions

Over the past two decades, the amount of omics data has been exponentially increasing. The omics data allow one to create a “digital portrait” of human health status, study the molecular foundations of the development of multifactorial diseases, and identify novel biological targets for drugs. Assignment of the detected biomolecules to the signaling pathways is an integral procedure of data interpretation. Such assignment is a non-trivial task. Today, researchers have a broad range of bioinformatic tools that have been adapted to solve this particular problem.
This review describes web-accessible metabolic pathway databases and considers the bioinformatics methods used in the reconstruction of metabolic pathways and the problems in which such databases can be applied. The general algorithm presented for constructing biological pathway maps explains the workflow implemented in available bioinformatics tools based on graphs for describing substrate–enzyme–product transformation, stoichiometric analysis of substrate–product transformation, and product retrosynthesis following the rules of chemical reactions. The tools have been considered from the point of view of the metabolic pathway databases used: options for metabolic network representation (e.g., chemical transformation graph, hypergraph, multilayer graph, and scattering matrix); options for metabolic network compressing (e.g., atomic mapping, weighted graph, stoichiometry analysis, and structural similarity); and search for a biological pathway/biochemical process (e.g., search for the shortest pathway, Monte Carlo method, DFS, and retrosynthetic analysis), as well as methods for ranking search results (e.g., atomic conservation, structural similarity, pathway length, and weight function). Depending on the task and objects, this algorithm can be successfully used by researchers, not only in routine practice to solve problems with available tools, but also to improve and create new tools for pathway construction.
Metabolic engineering aims to create biocatalysts that can efficiently generate a variety of secondary metabolites. These metabolites serve as key components in the production of industrial chemicals, pharmaceuticals, and biofuels. Metabolic engineering of microorganisms and plants paves the way for the development of novel pharmaceutical compounds. Efficient application of advanced metabolic engineering methodologies requires an in-depth understanding of cellular physiology and metabolism. Such knowledge can be attained through the use of mathematical models that encompass integrated metabolism, signal transduction, and gene regulation. In these models, the integration of omics data significantly expands their applicability and completeness of description. In our review, we examined the key algorithms, methods, and approaches used in the description and organization of metabolic networks. This study provides a significant step forward for future research and development regarding new metabolic network mathematical models.

Author Contributions

Conceptualization, D.V.P. and A.L.K.; formal analysis, K.A.M. and E.I.B.; data curation, A.L.K. and V.I.P.; writing—original draft preparation, V.R.R. and L.I.K.; writing—review and editing, K.A.M. and K.A.Y. All authors have read and agreed to the published version of the manuscript.

Funding

This research was funded by the Russian Science Foundation, grant number 21-14-00381.

Data Availability Statement

This is a review paper which utilized public data collected from sources listed in the References Section.

Conflicts of Interest

The authors declare no conflict of interest.

References

  1. Koonin, E.V.; Galperin, M.Y. Evolution of Central Metabolic Pathways: The Playground of Non-Orthologous Gene Displacement. In Sequence—Evolution—Function: Computational Approaches in Comparative Genomics; Kluwer Academic: Dordrecht, The Netherlands, 2003. [Google Scholar]
  2. Xiao, Y.; Bi, M.; Guo, H.; Li, M. Multi-Omics Approaches for Biomarker Discovery in Early Ovarian Cancer Diagnosis. eBioMedicine 2022, 79, 104001. [Google Scholar] [CrossRef] [PubMed]
  3. Graw, S.; Chappell, K.; Washam, C.L.; Gies, A.; Bird, J.; Robeson, M.S.; Byrum, S.D. Multi-Omics Data Integration Considerations and Study Design for Biological Systems and Disease. Mol. Omics 2021, 17, 170–185. [Google Scholar] [CrossRef] [PubMed]
  4. García-Campos, M.A.; Espinal-Enríquez, J.; Hernández-Lemus, E. Pathway Analysis: State of the Art. Front. Physiol. 2015, 6, 383. [Google Scholar] [CrossRef] [PubMed]
  5. Stoney, R.; Robertson, D.L.; Nenadic, G.; Schwartz, J.-M. Mapping Biological Process Relationships and Disease Perturbations within a Pathway Network. npj Syst. Biol. Appl. 2018, 4, 22. [Google Scholar] [CrossRef] [PubMed]
  6. Kanehisa, M.; Goto, S. KEGG: Kyoto Encyclopedia of Genes and Genomes. Nucleic Acids Res. 2000, 28, 27–30. [Google Scholar] [CrossRef]
  7. Wright, A.J.; Orlic-Milacic, M.; Rothfels, K.; Weiser, J.; Trinh, Q.M.; Jassal, B.; Haw, R.A.; Stein, L.D. Evaluating the Predictive Accuracy of Curated Biological Pathways in a Public Knowledgebase. Database 2022, 2022, baac009. [Google Scholar] [CrossRef] [PubMed]
  8. Caspi, R.; Billington, R.; Keseler, I.M.; Kothari, A.; Krummenacker, M.; Midford, P.E.; Ong, W.K.; Paley, S.; Subhraveti, P.; Karp, P.D. The MetaCyc Database of Metabolic Pathways and Enzymes—A 2019 Update. Nucleic Acids Res. 2020, 48, D445–D453. [Google Scholar] [CrossRef]
  9. Wishart, D.S.; Guo, A.; Oler, E.; Wang, F.; Anjum, A.; Peters, H.; Dizon, R.; Sayeeda, Z.; Tian, S.; Lee, B.L.; et al. HMDB 5.0: The Human Metabolome Database for 2022. Nucleic Acids Res. 2022, 50, D622–D631. [Google Scholar] [CrossRef]
  10. Likić, V.A. Databases of Metabolic Pathways. Biochem. Mol. Biol. Educ. 2006, 34, 408–412. [Google Scholar] [CrossRef]
  11. Wang, L.; Dash, S.; Ng, C.Y.; Maranas, C.D. A Review of Computational Tools for Design and Reconstruction of Metabolic Pathways. Synth. Syst. Biotechnol. 2017, 2, 243–252. [Google Scholar] [CrossRef] [PubMed]
  12. Inferring Branching Pathways in Genome-Scale Metabolic Networks|SpringerLink. Available online: https://link.springer.com/article/10.1186/1752-0509-3-103 (accessed on 10 May 2023).
  13. Chowdhury, A.; Maranas, C.D. Designing Overall Stoichiometric Conversions and Intervening Metabolic Reactions. Sci. Rep. 2015, 5, 16009. [Google Scholar] [CrossRef]
  14. BiGG Models: A Platform for Integrating, Standardizing and Sharing Genome-Scale Models|Nucleic Acids Research|Oxford Academic. Available online: https://academic.oup.com/nar/article/44/D1/D515/2502593 (accessed on 10 May 2023).
  15. Kanehisa, M.; Furumichi, M.; Sato, Y.; Kawashima, M.; Ishiguro-Watanabe, M. KEGG for Taxonomy-Based Analysis of Pathways and Genomes. Nucleic Acids Res. 2023, 51, D587–D592. [Google Scholar] [CrossRef]
  16. Kanehisa, M.; Sato, Y.; Kawashima, M. KEGG Mapping Tools for Uncovering Hidden Features in Biological Data. Protein Sci. 2022, 31, 47–53. [Google Scholar] [CrossRef] [PubMed]
  17. Okuda, S.; Yamada, T.; Hamajima, M.; Itoh, M.; Katayama, T.; Bork, P.; Goto, S.; Kanehisa, M. KEGG Atlas Mapping for Global Analysis of Metabolic Pathways. Nucleic Acids Res. 2008, 36, W423–W426. [Google Scholar] [CrossRef] [PubMed]
  18. Karp, P.D.; Billington, R.; Caspi, R.; Fulcher, C.A.; Latendresse, M.; Kothari, A.; Keseler, I.M.; Krummenacker, M.; Midford, P.E.; Ong, Q.; et al. The BioCyc Collection of Microbial Genomes and Metabolic Pathways. Brief. Bioinform. 2019, 20, 1085–1093. [Google Scholar] [CrossRef] [PubMed]
  19. Fabregat, A.; Korninger, F.; Viteri, G.; Sidiropoulos, K.; Marin-Garcia, P.; Ping, P.; Wu, G.; Stein, L.; D’Eustachio, P.; Hermjakob, H. Reactome Graph Database: Efficient Access to Complex Pathway Data. PLoS Comput. Biol. 2018, 14, e1005968. [Google Scholar] [CrossRef] [PubMed]
  20. Jassal, B.; Matthews, L.; Viteri, G.; Gong, C.; Lorente, P.; Fabregat, A.; Sidiropoulos, K.; Cook, J.; Gillespie, M.; Haw, R.; et al. The Reactome Pathway Knowledgebase. Nucleic Acids Res. 2020, 48, D498–D503. [Google Scholar] [CrossRef] [PubMed]
  21. Rahman, S.A.; Advani, P.; Schunk, R.; Schrader, R.; Schomburg, D. Metabolic Pathway Analysis Web Service (Pathway Hunter Tool at CUBIC). Bioinformatics 2005, 21, 1189–1193. [Google Scholar] [CrossRef] [PubMed]
  22. MetaRoute: Fast Search for Relevant Metabolic Routes for Interactive Network Navigation and Visualization|Bioinformatics|Oxford Academic. Available online: https://academic.oup.com/bioinformatics/article/24/18/2108/190986 (accessed on 11 May 2023).
  23. Optimal Metabolic Route Search Based on Atom Mappings|Bioinformatics|Oxford. Academic. Available online: https://academic.oup.com/bioinformatics/article/30/14/2043/2390321 (accessed on 11 May 2023).
  24. Tervo, C.J.; Reed, J.L. MapMaker and PathTracer for Tracking Carbon in Genome-scale Metabolic Models. Biotechnol. J. 2016, 11, 648–661. [Google Scholar] [CrossRef]
  25. Computing the Shortest Elementary Flux Modes in Genome-Scale Metabolic Networks|Bioinformatics|Oxford Academic. Available online: https://academic.oup.com/bioinformatics/article/25/23/3158/216440 (accessed on 11 May 2023).
  26. Metabolic Engineering of Escherichia Coli for Direct Production of 1,4-Butanediol|Nature Chemical Biology. Available online: https://www.nature.com/articles/nchembio.580 (accessed on 11 May 2023).
  27. Campodonico, M.A.; Andrews, B.A.; Asenjo, J.A.; Palsson, B.O.; Feist, A.M. Generation of an Atlas for Commodity Chemical Production in Escherichia Coli and a Novel Pathway Prediction Algorithm, GEM-Path. Metab. Eng. 2014, 25, 140–158. [Google Scholar] [CrossRef]
  28. Carbonell, P.; Parutto, P.; Herisson, J.; Pandit, S.B.; Faulon, J.-L. XTMS: Pathway Design in an eXTended Metabolic Space. Nucleic Acids Res. 2014, 42, W389–W394. [Google Scholar] [CrossRef] [PubMed]
  29. Kanehisa, M.; Goto, S.; Kawashima, S.; Okuno, Y.; Hattori, M. The KEGG Resource for Deciphering the Genome. Nucleic Acids Res. 2004, 32, D277–D280. [Google Scholar] [CrossRef] [PubMed]
  30. Kanehisa, M.; Sato, Y.; Kawashima, M.; Furumichi, M.; Tanabe, M. KEGG as a Reference Resource for Gene and Protein Annotation. Nucleic Acids Res. 2016, 44, D457–D462. [Google Scholar] [CrossRef] [PubMed]
  31. Vastrik, I.; D’Eustachio, P.; Schmidt, E.; Joshi-Tope, G.; Gopinath, G.; Croft, D.; de Bono, B.; Gillespie, M.; Jassal, B.; Lewis, S.; et al. Reactome: A Knowledge Base of Biologic Pathways and Processes. Genome Biol. 2007, 8, R39. [Google Scholar] [CrossRef]
  32. Joshi-Tope, G.; Gillespie, M.; Vastrik, I.; D’Eustachio, P.; Schmidt, E.; de Bono, B.; Jassal, B.; Gopinath, G.R.; Wu, G.R.; Matthews, L.; et al. Reactome: A Knowledgebase of Biological Pathways. Nucleic Acids Res. 2005, 33, D428–D432. [Google Scholar] [CrossRef]
  33. Karp, P.D.; Paley, S.M.; Krummenacker, M.; Latendresse, M.; Dale, J.M.; Lee, T.J.; Kaipa, P.; Gilham, F.; Spaulding, A.; Popescu, L.; et al. Pathway Tools Version 13.0: Integrated Software for Pathway/Genome Informatics and Systems Biology. Brief. Bioinform. 2010, 11, 40–79. [Google Scholar] [CrossRef] [PubMed]
  34. Hawkins, C.; Ginzburg, D.; Zhao, K.; Dwyer, W.; Xue, B.; Xu, A.; Rice, S.; Cole, B.; Paley, S.; Karp, P.; et al. Plant Metabolic Network 15: A Resource of Genome-wide Metabolism Databases for 126 Plants and Algae. J. Integr. Plant Biol. 2021, 63, 1888–1905. [Google Scholar] [CrossRef]
  35. Demir, E.; Cary, M.P.; Paley, S.; Fukuda, K.; Lemer, C.; Vastrik, I.; Wu, G.; D’Eustachio, P.; Schaefer, C.; Luciano, J.; et al. The BioPAX Community Standard for Pathway Data Sharing. Nat. Biotechnol. 2010, 28, 935–942. [Google Scholar] [CrossRef]
  36. Pathway Commons: A Resource for Biological Pathway Analysis. Available online: https://www.pathwaycommons.org/ (accessed on 27 November 2023).
  37. OWL 2 Web Ontology Language Document Overview (Second Edition). Available online: https://www.w3.org/TR/owl2-overview/ (accessed on 27 November 2023).
  38. Pathway Tools Data-File Formats. Available online: https://bioinformatics.ai.sri.com/ptools/flatfile-format.html (accessed on 27 November 2023).
  39. Martens, M.; Ammar, A.; Riutta, A.; Waagmeester, A.; Slenter, D.N.; Hanspers, K.; Miller, R.A.; Digles, D.; Lopes, E.N.; Ehrhart, F.; et al. WikiPathways: Connecting Communities. Nucleic Acids Res. 2021, 49, D613–D621. [Google Scholar] [CrossRef]
  40. Pathvisio.Github.Io. Available online: https://pathvisio.github.io//pathvisio.github.io/documentation/GPML2013a-doc.html (accessed on 27 November 2023).
  41. PathVisio Biological Pathway Editor. Available online: https://pathvisio.github.io//pathvisio.github.io/ (accessed on 27 November 2023).
  42. The BridgeDb Framework: Standardized Access to Gene, Protein and Metabolite Identifier Mapping Services|BMC Bioinformatics|Full Text. Available online: https://bmcbioinformatics.biomedcentral.com/articles/10.1186/1471-2105-11-5 (accessed on 27 November 2023).
  43. Kotera, M.; Goto, S. Metabolic Pathway Reconstruction Strategies for Central Metabolism and Natural Product Biosynthesis. Biophysics 2016, 13, 195–205. [Google Scholar] [CrossRef]
  44. Nakamura, M.; Hachiya, T.; Saito, Y.; Sato, K.; Sakakibara, Y. An Efficient Algorithm for de Novo Predictions of Biochemical Pathways between Chemical Compounds. BMC Bioinform. 2012, 13, S8. [Google Scholar] [CrossRef] [PubMed]
  45. Cho, A.; Yun, H.; Park, J.H.; Lee, S.Y.; Park, S. Prediction of Novel Synthetic Pathways for the Production of Desired Chemicals. BMC Syst. Biol. 2010, 4, 35. [Google Scholar] [CrossRef] [PubMed]
  46. Wu, H.-Y.; Nöllenburg, M.; Viola, I. Graph Models for Biological Pathway Visualization: State of the Art and Future Challenges. arXiv 2021, arXiv:2110.04808. [Google Scholar]
  47. Mithani, A.; Preston, G.M.; Hein, J. Rahnuma: Hypergraph-Based Tool for Metabolic Pathway Prediction and Network Comparison. Bioinformatics 2009, 25, 1831–1832. [Google Scholar] [CrossRef]
  48. McClymont, K.; Soyer, O.S. Metabolic Tinker: An Online Tool for Guiding the Design of Synthetic Metabolic Pathways. Nucleic Acids Res. 2013, 41, e113. [Google Scholar] [CrossRef] [PubMed]
  49. Khosraviani, M.; Saheb Zamani, M.; Bidkhori, G. FogLight: An Efficient Matrix-Based Approach to Construct Metabolic Pathways by Search Space Reduction. Bioinformatics 2016, 32, 398–408. [Google Scholar] [CrossRef]
  50. Yeung, M.; Thiele, I.; Palsson, B.O. Estimation of the Number of Extreme Pathways for Metabolic Networks. BMC Bioinform. 2007, 8, 363. [Google Scholar] [CrossRef]
  51. Path Finding Methods Accounting for Stoichiometry in Metabolic Networks|SpringerLink. Available online: https://link.springer.com/article/10.1186/gb-2011-12-5-r49 (accessed on 11 May 2023).
  52. Erdrich, P.; Steuer, R.; Klamt, S. An Algorithm for the Reduction of Genome-Scale Metabolic Network Models to Meaningful Core Models. BMC Syst. Biol. 2015, 9, 48. [Google Scholar] [CrossRef]
  53. Trinh, C.T.; Wlaschin, A.; Srienc, F. Elementary Mode Analysis: A Useful Metabolic Pathway Analysis Tool for Characterizing Cellular Metabolism. Appl. Microbiol. Biotechnol. 2009, 81, 813–826. [Google Scholar] [CrossRef]
  54. Quek, L.-E.; Dietmair, S.; Hanscho, M.; Martínez, V.S.; Borth, N.; Nielsen, L.K. Reducing Recon 2 for Steady-State Flux Analysis of HEK Cell Culture. J. Biotechnol. 2014, 184, 172–178. [Google Scholar] [CrossRef]
  55. Erdrich, P.; Knoop, H.; Steuer, R.; Klamt, S. Cyanobacterial Biofuels: New Insights and Strain Design Strategies Revealed by Computational Modeling. Microb. Cell Fact. 2014, 13, 128. [Google Scholar] [CrossRef]
  56. Reconstruction and Use of Microbial Metabolic Networks: The Core Escherichia Coli Metabolic Model as an Educational Guide|EcoSal Plus. Available online: https://journals.asm.org/doi/full/10.1128/ecosalplus.10.2.1 (accessed on 11 May 2023).
  57. Küken, A.; Wendering, P.; Langary, D.; Nikoloski, Z. A Structural Property for Reduction of Biochemical Networks. Sci. Rep. 2021, 11, 17415. [Google Scholar] [CrossRef] [PubMed]
  58. Singh, D.; Lercher, M.J. Network Reduction Methods for Genome-Scale Metabolic Models. Cell Mol. Life Sci. 2020, 77, 481–488. [Google Scholar] [CrossRef] [PubMed]
  59. Sambamoorthy, G.; Raman, K. MinReact: A Systematic Approach for Identifying Minimal Metabolic Networks. Bioinformatics 2020, 36, 4309–4315. [Google Scholar] [CrossRef]
  60. Sinha, N.; Sharma, S.; Tripathi, P.; Negi, S.K.; Tikoo, K.; Kumar, D.; Rao, K.V.S.; Chatterjee, S. Molecular Signatures for Obesity and Associated Disorders Identified through Partial Least Square Regression Models. BMC Syst. Biol. 2014, 8, 104. [Google Scholar] [CrossRef]
  61. Wirawan, A.; Kwoh, C.K.; Hieu, N.T.; Schmidt, B. CBESW: Sequence Alignment on the Playstation 3. BMC Bioinform. 2008, 9, 377. [Google Scholar] [CrossRef] [PubMed]
  62. Röhl, A.; Bockmayr, A. A Mixed-Integer Linear Programming Approach to the Reduction of Genome-Scale Metabolic Networks. BMC Bioinform. 2017, 18, 2. [Google Scholar] [CrossRef]
  63. Ataman, M.; Hernandez Gardiol, D.F.; Fengos, G.; Hatzimanikatis, V. redGEM: Systematic Reduction and Analysis of Genome-Scale Metabolic Reconstructions for Development of Consistent Core Metabolic Models. PLoS Comput. Biol. 2017, 13, e1005444. [Google Scholar] [CrossRef]
  64. Baroukh, C.; Muñoz-Tamayo, R.; Steyer, J.-P.; Bernard, O. DRUM: A New Framework for Metabolic Modeling under Non-Balanced Growth. Application to the Carbon Metabolism of Unicellular Microalgae. PLoS ONE 2014, 9, e104499. [Google Scholar] [CrossRef]
  65. Quek, L.-E.; Nielsen, L.K. A Depth-First Search Algorithm to Compute Elementary Flux Modes by Linear Programming. BMC Syst. Biol. 2014, 8, 94. [Google Scholar] [CrossRef]
  66. Ravikrishnan, A.; Nasre, M.; Raman, K. Enumerating All Possible Biosynthetic Pathways in Metabolic Networks. Sci. Rep. 2018, 8, 9932. [Google Scholar] [CrossRef] [PubMed]
  67. Zanghellini, J.; Ruckerbauer, D.E.; Hanscho, M.; Jungreuthmayer, C. Elementary Flux Modes in a Nutshell: Properties, Calculation and Applications. Biotechnol. J. 2013, 8, 1009–1016. [Google Scholar] [CrossRef] [PubMed]
  68. Wang, L.; Ng, C.Y.; Dash, S.; Maranas, C.D. Exploring the Combinatorial Space of Complete Pathways to Chemicals. Biochem. Soc. Trans. 2018, 46, 513–522. [Google Scholar] [CrossRef] [PubMed]
  69. Kim, J.; Reed, J.L.; Maravelias, C.T. Large-Scale Bi-Level Strain Design Approaches and Mixed-Integer Programming Solution Techniques. PLoS ONE 2011, 6, e24162. [Google Scholar] [CrossRef]
Figure 1. KEGG database retrospective development from 1995 to the present.
Processes 11 03430 g001
Figure 2. Reactome database retrospective development from 2004 to the present.
Processes 11 03430 g002
Figure 3. MetaCyc database retrospective development from 1999 to the present.
Processes 11 03430 g003
Figure 4. HMDB retrospective development from 2007 to the present.
Processes 11 03430 g004
Figure 5. WikiPathways project’s retrospective development, from 2008 to the present.
Processes 11 03430 g005
Figure 6. An example of visualization: a chemical transformation graph for oxaloacetate in the biosynthesis of amino acids (KEGG PATHWAY: hsa01230).
Processes 11 03430 g006
Figure 7. An example of a pentose phosphate pathway visualization (KEGG PATHWAY: hsa00030). On the right, the biochemical transformation is represented as a hypergraph.
Processes 11 03430 g007
Figure 8. The step of finding the shortest path between the metabolites oxaloacetate and pyruvate in the biosynthesis of amino acids (KEGG PATHWAY: hsa01230). The substrate and the product were found to share 62% of structural elements at the global scale.
Processes 11 03430 g008
Figure 9. The scheme of depth-first search: alternation of the direct and reverse tracking programs to search for active fluxes and exclude non-active ones. The transformation of glucose (green circles) in the glucagon signaling pathway (KEGG PATHWAY: map04922). Glc—glucose; G6P—alpha-D-Glucose 6-phosphate; F6P—D-Fructose 6-phosphate; F1,6P—D-fructose 1,6-bisphosphate; 3PGA—3-phospho-D-glycerate; PEP—phosphoenolpyruvate; PYR—pyruvate.
Processes 11 03430 g009
Table 1. Steps of reconstructing the biological pathway or biochemical transformation. (Adapted from ref. [11]).
StepDatabase SelectionVisual Representation of a Metabolic NetworkReduction (Compression) of the Metabolic NetworkSearching for a Biological Pathway/Biochemical ProcessRanking the Search ResultsTool
Graph constructionKEGG, MetaCyc, HMDB, CHEBI, BIGG, etc.Graph of a chemical transformation;
Graph of
metabolites;
Bipartite graph;
Hypergraph;
Multilayer graph
Exclusion of cofactors and ligands;
Weighted graph;
Atom mapping;
Phylogenetic analysis
Shortest-path search;
DFS;
Informed search;
BFS;
The Monte Carlo method
Principle of atom conservation;
Metabolite–metabolite association;
Structural
similarity;
Interspecies comparative analysis of biological pathways
Pathway Hunter [21];
MetaRoute [22];
RouteSearch [23];
ReTrace [12]
Stoichiometric analysisKEGG, MetaCyc, HMDB, CHEBI, BIGG, etc.Scatterplot
matrix;
Substrate graph
Stoichiometry
analysis;
Atom mapping
Mixed integer linear programmingPathway length analysis (common metabolic flux);
Pathway length
(the most active pathway);
Number of heterologous reactions
optStoic [13];
PathTracer [24];
METATOOL 5.0 [25]
Retrosynthesis of the productKEGG, MetaCyc, HMDB, CHEBI, BIGG, etc.Scatterplot matrix;
Substrate graph
Similarity with the substrate (with allowance for the EC number);
Structural similarity
Retrosynthetic
analysis
Similarity of compounds and pathway assessment;Weight function;
Pathway length
Simpheny [26];
GEM-Path [27];
XTMS [28]
BFS—breadth-first search; DFS—depth-first search; EC—enzyme commission.
Table 2. Comparison of the approaches to metabolic network reduction and the features of these approaches. (Adapted from ref. [58]).
AlgorithmApproachSet of Biochemical TransformationsSet of MetabolitesProtection of Minimal Degrees of Freedom *
(dof ≥ dofmin)
Computation of Minimal SubnetworksSet of PhenotypesRef.
Network ReducerLP/FVA **++++[62]
MinReactpFBA ***+[59]
MinNWMILP ****++++[62]
redGEMGraph algorithms, MILP+++++[63]
DRUMEFM *****+++[64]
Protection of minimal degrees of freedom * (dof ≥ dofmin)—degrees of freedom (dof) corresponding to the dimension of the null space of the stoichiometric matrix S; LP/FVA **—the linear programming method, in combination with flux variability analysis; pFBA ***—parsimonious flux balance analysis (flux balance analysis with allowance for the biological context to determine the most efficient network topology); MILP ****—the mixed-integer linear programming method; EFM *****—the method for detecting elementary flux modes in metabolic networks.
Disclaimer/Publisher’s Note: The statements, opinions and data contained in all publications are solely those of the individual author(s) and contributor(s) and not of MDPI and/or the editor(s). MDPI and/or the editor(s) disclaim responsibility for any injury to people or property resulting from any ideas, methods, instructions or products referred to in the content.