Article

Panoramic Semiquantitave Analysis for Multielement Characterization of Liquid and Solid Waste Samples

by
Valentina Lyubomirova
1,2,*,
Iva Belovezhdova
1,2,
Rumyana Djingova
1,2,
Petar Petrov
2,3 and
Ekaterina Todorova
2,3
1
Trace Analysis Laboratory, Department of Analytical Chemistry, Faculty of Chemistry and Pharmacy, Sofia University “St. Kliment Ohridski”, 1 James Bourcher Blvd., 1164 Sofia, Bulgaria
2
Center of Competence “Clean Technologies for Sustainable Environment—Water, Waste, Energy for Circular Economy”, 1000 Sofia, Bulgaria
3
Faculty of Ecology and Landscape Architecture, University of Forestry, 10 “Kliment Ohridski” Blvd., 1797 Sofia, Bulgaria
*
Author to whom correspondence should be addressed.
Processes 2023, 11(12), 3379; https://doi.org/10.3390/pr11123379
Submission received: 7 November 2023 / Revised: 4 December 2023 / Accepted: 4 December 2023 / Published: 6 December 2023

Abstract

:
Wastewater treatment results in large amounts of sewage sludge in the wastewater treatment plant (WWTP) which imposes on its reuse. The most promising application is as a fertilizer in agriculture which is regulated by national and European legislation. Along with the mandatory determination of potentially toxic elements (PTEs), in order to assess not only the risks, but also the beneficial properties, the determination of the total chemical composition is desirable. Inductively coupled plasma mass spectrometry (ICP-MS) is the most promising technique for multielement characterization which can be applied both for quantitative and semiquantitative analysis. A significant difference between the approaches is that the semiquantitative analysis is performed after a calibration with one standard solution containing at least three elements, but, at the same time, the accuracy is worse. In the present work, the accuracy of semiquantitative analysis with a different number of calibration elements using both water standard solutions and certified reference material (CRM) for calibration was investigated for the determination of 69 elements in sewage sludge CRMs and samples. It has been found that the accuracy can vary within a wide range, depending on the concentration of the elements, the number of calibration elements, and/or the presence of neighboring masses. In order to obtain an accuracy of up to 30%, it is recommended to shorten the mass intervals and perform the calibration with at least 18 elements, mainly microelements. The method was applied for fast panoramic analysis of sewage sludge samples from WWTPs and the concentrations were close to the data from quantitative analysis.

1. Introduction

The increasing production of wastewater as a result of intensive anthropogenic activity leads to a reciprocal increase in sewage sludge production in the wastewater treatment plants (WWTP). Sludges can contain various pollutants, in particular, potentially toxic elements (PTEs) [1,2,3], polyaromatic hydrocarbons [1,2], dioxins [1], polychlorinated biphenyls [1], and pathogenic organisms [1]. However, they are also a rich source of nitrogen, phosphorus, and organic matter, as well as essential trace elements [3,4]. Although various sludge treatment methods exist and are implemented, e.g., incineration, landfill [2,5], and recycling into building materials [1], an increasingly necessary application is its utilization in agriculture because of its high fertilization value [2,5,6,7,8]. The chemical characterization of the sludge before its reuse is a key requirement in the principles of circular economy for development of appropriate technologies for processing and recycling of the waste material. Their application in agriculture is regulated by Bulgarian and/or European legislations [9,10], specifying maximum permissible concentrations for PTEs. However, along with the evaluation of the content of PTEs, it is desirable to determine the content of useful substances, e.g., elements essential for plants—Na, K, Mg, Fe, P, Mn, Ti, Zn, Se [11], etc. Thus, analysis of as many elements as possible (at major, minor, and trace levels) is preferred, which may, however, be present in a very wide concentration interval. The characterization of sewage sludge samples is performed using quantitative methods of analysis to determine a limited number of elements, in most cases, only the concentrations of the PTEs that are monitored according to national or European regulations. Their concentrations have been determined using ICP-MS [3], ICP-OES [4,5,12,13], AAS [1,2,14], and WD-XRF [15]. In rarer cases, the content of nutrient elements (P, Ca, Na, K, Mg, and Zn) needed for plant growth are also determined [1,4,5]. An advantage of the determination of a larger number of elements is the possibility to search for another suitable application of the sewage sludge in case of incompatibility of the PTEs’ concentrations with the requirements for an agriculture use [5,13].
Inductively coupled plasma mass spectrometry (ICP-MS) is nowadays the most often used technique for multielement analysis for environmental [16], geological [17], and biological [18] samples, etc. It provides multielement capabilities, low limits of detection (LOD) for almost all elements, and high sample throughput, combined with high selectivity, sensitivity and accuracy. The routinely used approach in the analysis of chemical elements is quantitative analysis after calibration with series of standard solutions containing all the analyzed elements. Many factors affect the accuracy of the analytical results obtained, e.g., good imitation of the matrix, suitable concentration interval of the standard solutions, correction of matrix and spectral interferences, macroelements’ signal reduction [19,20,21,22], if needed, etc. In the waste samples analysis, a good matrix matching cannot be easily achieved due to large variations in the composition of both chemical elements and organic matter, affecting the accuracy.
Using ICP-MS, a semiquantitative analysis (TotalQuant method of the PerkinElmer SCIEX ELAN DRC-e) can be performed [23]. Because in using the TotalQuant analysis the full mass spectra are measured and concentrations for all elements present are obtained, it is generally applied as a preliminary fast screening analysis, giving information about possible matrix effects, spectral interferences and the need for corrections, calibration at an appropriate interval, etc. [23,24,25]. The calibration of the TotalQuant method is performed using a blank and a single standard solution containing a minimum of three elements, and the resulting concentrations for the entire mass range (from 6 amu to 240 amu, 69 elements) are calculated based on internal response factors (RF, ion’ counts per unit concentration) provided by the manufacturer [23,26]. The elements present in the standard calibration solution are used to update the RFs over the entire mass spectrum.
The TotalQuant method finds application due to the serious advantages it provides as an opportunity to obtain quantitative data for a large number of elements at a very high speed, low consumption of reagents and energy, and less analytical waste, which makes it cheaper and greener [27,28]. The method has been applied for analysis of water samples [23,26,29], plants [30,31], soils [32,33], air particles [34], biological samples [24], geological samples [35], et al. The published data for the accuracy vary widely and may depend on the concentration range of the elements, the matrix, the measured mass, etc. Usually, the quantitative analysis is characterized with very good accuracy, better than 10% [26], whereas the accuracy of the TotalQuant method is worse, and varies within quite wide limits, from below 10% [24,26,30] to 30–50% [28,29].
Semiquantitative analysis can be very useful in the analysis of complex samples, e.g., domestic, municipal, industrial, etc., wastes providing valuable information on sample composition, enabling rapid screening with satisfactory accuracy. The analysis of waste samples is a challenging task because of the following problems: often the matrix and the sample composition are unknown, wide variation between different types of samples and between the individual elements (wt.%-ng/kg), and certified reference materials (CRMs) with a suitable matrix are not always available for accuracy evaluation.
Despite the stated advantages and the need to determine the maximum number of elements, to the authors’ knowledge, the TotalQuant method has not yet found routine application for analysis of waste samples. A semiquantitave analysis of wastewaters has been recently performed with ICP-AES for the determination of 34 elements [36]. A likely reason can be the poorer accuracy compared to quantitative analysis.
The present work aims to assess the influence of the number of calibration elements and the matrix of the calibration solution on the accuracy of the semiquantitative method for analysis of sewage sludge samples. A study aiming to determine the accuracy of semiquantitative analysis of water samples depending on the number of elements was conducted by Jitaru et al., 2003 [23]. The calibration was performed with a standard solution containing 60 analytes at a concentration of 50 μg L−1. Since such a matrix is not suitable for sewage sludge analysis, waste matrix matched standard solutions were prepared in this study.

2. Materials and Methods

2.1. Instrumentation

The microwave reaction system (Anton Paar, Multiwave 3000, Graz, Austria) was used for acid digestion of the sewage sludge CRMs and samples. Elements determination was carried out using a PerkinElmer SCIEX Elan DRC-e ICP-MS (MDS Inc., Concord, ON, Canada) system with a cross-flow nebulizer. The spectrometer was optimized to provide minimal values of the ratios CeO+/Ce+ and Ba2+/Ba+ and optimal intensity of the analytes. The optimized instrumental parameters were: RF power—1100 W, argon plasma gas flow—15 L min−1, auxiliary gas flow—1.20 L min−1, nebulizer gas flow—0.90 L min−1, lens voltage—7.00 V, and pulse stage voltage—950 V. The elements were determined in standard conditions except for the macroelements which were determined in cell-based mode by optimization and introduction of a dynamic bandpass tuning parameter (RPa) for the signal reduction.

2.2. TotalQuant Method Calibration

External calibration, both by multielement standard solutions, containing 69 elements, presented in Table 1 and certified reference material (CRM 029, Trace Metals—Sewage sludge 2) was performed. Calibration standard solutions were prepared from ICP-MS multielement calibration standard solution-2 (ultra scientific), containing 29 elements (Al, As, Ba, Be, Bi, Cd, Ca, Cs, Cr, Co, Cu, Ga, In, Fe, Pb, Li, Mg, Mn, Ni, K, Rb, Se, Ag, Na, Sr, Tl, U, V, and Zn) and ICP-MS multielement standard B (high-purity standards), containing 13 rare earth elements: Ce, Dy, Er, Eu, Gd, Ho, La, Lu, Nd, Pr, Sm, Tb, and Yb) with initial concentrations of 10 mg L−1, to which single-element standard solutions of Na, K, Ca, Mg, Fe, Al, Si, P, Ti, Zr, Mo, Pd, Sn, Sb, Au, Hg, Hf, Y, Nb, Ru, Rh, Te, Ta, W, Re, Ir, Pt, Th, Be, Ge, Si, Sc, Tm, and Os (Fluka) with initial concentrations of 1000 mg L−1 were added after appropriate dilution to obtain the final concentrations presented in Table 1. The number of the elements used for calibration ranged from 3 to 69. The calibration with aqueous standard solution and measurement of wastewater and solid sewage sludge CRMs and samples was carried out seven times, using 69 elements for calibration in the first step, and gradually reducing intermediate (through two, resp. one) elements in the method of analysis at each subsequent step until reaching three elements in the seventh step. The elements’ reduction steps are presented in Figure 1. The macroelements are presented in red color and the microelements in blue color. Similarly, the calibration with CRM 029 and measurement of wastewater and solid CRMs and sewage sludge samples was carried out four times, using 29 elements with certified values in CRM 029 in the first step, and, at each subsequent stage, one intermediate element was eliminated until reaching three elements in the fourth step (see Figure 2, macroelements—in red color, microelements—in blue color). The accuracy of each step was assessed by analysis of three certified reference materials—wastewater RM (LGC 6177, Landfill Leachate—metals, UKAS Reference Materials, UK), CRM 029 (Trace Metals—Sewage Sludge 2—Sigma-Aldrich, Laramie, WY 82070, USA) and ERM-CC144 (Sewage Sludge—elements, European Commission—Joint Research Centre Directorate F—Health, Consumers and Reference Materials, Geel, Belgium).

2.3. Sample Preparation

Sewage sludge CRMs—CRM 029 and ERM-CC144 and sewage sludge samples from WWTPs were digested in a microwave digestion system. The quantity of the sewage sludge CRMs and samples was 0.25 g, accurately weighted on an analytical balance and transferred in Teflon pressure vessels. The acid mixture used for the digestion consisted of 1 mL HF (47–51%, Fisher Chemicals, Ultra Trace Metal Grade, Loughborough, UK), 8 mL HNO3 (67–69%, Fisher Chemicals, Ultra TraceMetal Grade, Loughborough, UK) and 3 mL H2O2 (30%, Fisher Chemicals, Ultra Trace Analysis Grade, Loughborough, UK). The closed vessels were introduced in a microwave oven and subjected to digestion using five steps of 5 min with the following power: 250, 400, 900, 300, and 0 W (vent, Tmax = 180 °C). After the microwave digestion, the solutions were transferred into Teflon vessels, evaporated to about 1 mL on a heating plate, then 5 mL HNO3 was added and evaporated again to about 1 mL. The digested samples were diluted to 50 mL with double deionized water. Before analysis, 1 mL of the solutions was additionally diluted to 10 mL with double deionized water.

2.4. Data Analysis

The experimental data were processed with single factor ANOVA and one sample t-test to assess their statistical significance (p ≤ 0.05). The Data Analysis Toolpak MS Excel 2023 add-in program was used for all calculations.

3. Results and Discussions

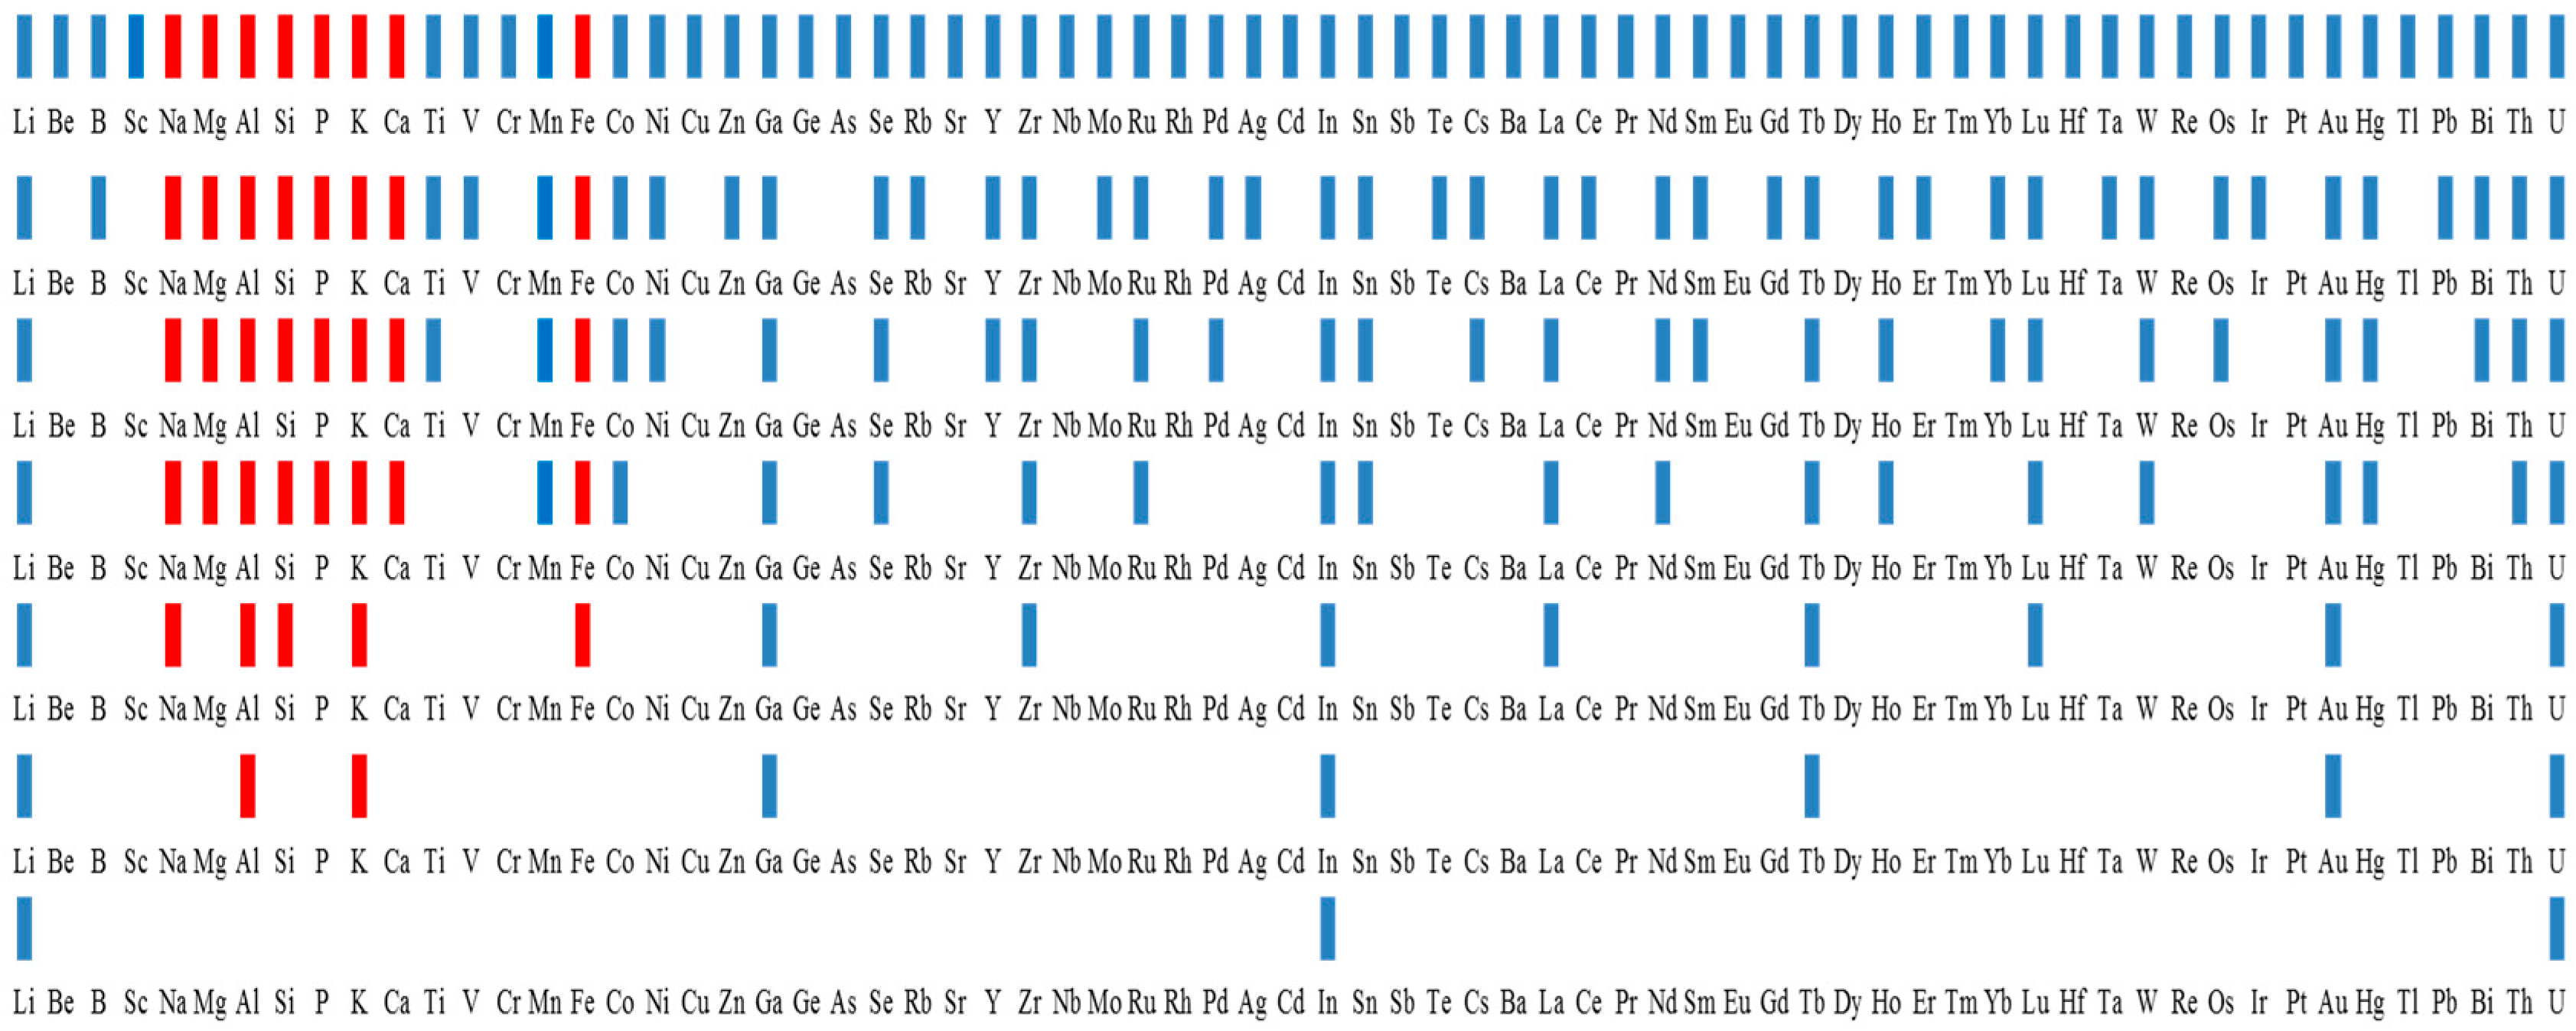
3.1. Optimization of TotalQuant Method—Optimization of a Dynamic Bandpass Tuning Parameter (RPa) for Macroelements Signal Reduction

The determination of macroelements (alkaline and alkaline earth elements) at mg kg−1 levels in environmental materials using ICP-MS at standard conditions is a difficult task and is often not possible. The high concentrations and, moreover, the low ionization potential (IP) lead to high ion intensity. As a result, the detector is overloaded (often around 2 mill cps). This effect results in a saturated signal which is not proportional to the concentration. The linear range depends on the IP and also on the isotopic abundance of the elements’ isotopes [18]. These elements are often determined using ICP-OES or ICP-MS after additional dilution. ICP-MS in cold plasma conditions is also applied which is, however, incompatible with the full mass-spectra scan method as the sensitivity for all elements will be lowered. In all cases, two measurements are required. Using the default TotalQuant method, saturated signals for the macroelements are obtained and no analytical information is obtained. For this purpose, in the present study, the default TotalQuant method (Table 2A) was modified by dividing the masses of the macroelements Na, Mg, Al, Si, P, K, Ca, and Fe into separate mass intervals. The signal of their isotopes (23Na, 24–26Mg, 27Al, 28–30Si, 31P, 39K, 42–44Ca, and 54,56–58Fe) was reduced after optimization and application of a dynamic bandpass tuning parameter RPa [19]. By introducing a dynamic bandpass tuning parameter RPa, a DC potential between the pole pairs of the dynamic reaction cell of the instrument is applied which reduces the signal sensitivity of the ions. An advantage of this approach is the possibility for selective suppression of the signal. It can be applied for certain elements, e.g., for the macroelements in a particular sample and, more importantly, only for particular isotopes, depending on the isotopic abundance [19]. The value of the RPa is optimized using a blank and a standard solution of the elements and can vary between 0.01 and 0.02 V. The value is chosen depending on the assumed concentration interval of the elements and the isotopic abundance of the respective isotope. By varying the value of RPa, concentration up to 200 mgL−1 can be determined, which is a serious advantage over the default method [19]. The optimized mass intervals and the input RPa values for each mass interval are shown in Table 2B.
In both cases, the isotopes for oxygen (16,17,18) and argon (40,41) ions are skipped in order to avoid overload of the detector [23].

3.2. Calibration with Multielement Standard Solution

In order to check the influence of the number of calibration elements on the accuracy of the measurements of 69 elements, a successive calibration with 69, 50, 36, 27, 14, 8, and 3 elements was performed. For calibration, each one of the three standard solutions (Table 1) were used for calibration to analyze the other two standard solutions and the CRMs. The accuracy for each element is examined in terms of per cent bias (relative error, the ratio of the difference between the measured, and the certified to the certified values). The experimental value and the theoretical concentration were used to calculate the per cent bias in the standard solutions and are presented in Table 3. Mean error values from at least 3 measurements of each of the standard solutions are presented. The elements not included in the calibration are expressed in red lettering. The statistical significance of the data was assessed by application of ANOVA and the results are presented in Table S1. No statistically significant difference was found in the obtained relative error depending on the calibration standard used. The data for the water standard solutions show that when using 69 calibration elements, the accuracy ranges from 0.1 to 11.3% (except Se), comparable with quantitative analysis. In this case no interpolation is performed as RF of each analyte is updated on the basis of a direct calibration and the deviation is only due to the measurement uncertainty and not from the interpolation capability of the method. For the matrix elements present in mg kg−1 concentrations (Na, K, Ca, Mg, Fe, Al, Si, and P), the accuracy was found to be unaffected by their presence as calibration elements and varied between 0.5 to 9.8%; in some cases it may be lower in the absence of the element in the calibration process, e.g., Na and P. The results for the microelements show that the accuracy ranged from 0.1 to 11% when the elements are used for calibration, except for Se, reaching 21%. The data in Table 3 show that for many of the microelements the accuracy did not change significantly when reducing the number of elements and eliminating them from the calibration elements. Accuracy ranging from 0.1% to 15% was achieved for 28 microelements (Sc, Ti, Mn, Co, Ni, Cu, Zn, Ga, Ge, Rb, Sr, Y, Zr, Nb, Mo, Ru, Sn, Pr, Eu, Gd, Tb, Dy, Ho, Er, Hf, Ta, W, and Th). The error for the rest of the microelements increased after their exclusion: for 14 elements (Be, B, Cr, Yb, Lu, Re, Os, Ir, Pt, Au, Hg, Tl, Pb, and Bi) the bias ranged between 15 and 30%, 30 and 50% for 9 elements (As, Sb, Cs, Ba, La, Ce, Nd, Sm, and Tm) and higher than 50% for 7 elements (V, Se, Rh, Pd, Ag, Cd, and Te). It is also very important to establish the relationship of the bias not only depending on the presence of a given element, but also on the presence of neighboring masses, resp. shortened interpolation intervals. For 13 elements (Be, B, As, Se, Cs, La, Ce, Nd, Sm, Lu, Os, Ir, and Pt) a sharp increase in error was observed immediately after their exclusion and varied within the limit 13–54%, regardless the presence of neighboring masses. A strong dependence on the presence of neighboring masses, after the elements’ exclusion was established for V, Cr, Rh, Pd, Ag, Cd, Sb, Te, Ba, Tm, Eu, Yb, Hf, Pr, Re, Pb, Bi, Tl, and Hg. The error varied in a very wide interval starting from below 1% and reached up to 80–90%, e.g., Pd, Ag, and Cd. The increased error in their determination can be attributed to the presence of spectral interferences and the impossibility of correct interpolation at standard mode measurement at a wide interpolation interval. For the rest of the microelements (Sc, Ti, Mn, Co, Ni, Cu, Zn, Ga, Ge, Rb, Sr, Y, Zr, Nb, Mo, Ru, Sb, Eu, Gd, Tb, Dy, Ho, Ta, W, Au, Th, and U) the reduction of the number of the calibration elements did not affect the accuracy. The assessment of the data in Table 3 shows that although the method can also be applied by calibration with at least 3 elements, as suggested by the manufacturers, the obtained data for some of the micro- and trace elements are semiquantitave, characterized by an error higher than 50%. The calculated values for the per cent bias demonstrate that the maximum error varies between 20 and 34% from the first to the fourth step. Based on these data, it can be assumed that in order to achieve an accuracy of approx. up to 30%, calibration with a reduced number of elements can be performed, but for trace elements it is necessary to ensure narrower intervals and the presence of an element through at least 3–4 masses, as, for example, till step 3 or step 4. The reduction of the number of macroelements did not affect the accuracy in a wide interval and any of them can be used for calibration.
Table 4 presents the concentrations (in mg L−1) obtained in each step for the wastewater RM LGC6177. The results are compared to the certified values or to the concentrations obtained from quantitative analysis, as information values, given in brackets (the mean of three independent measurements). The accuracy of the non-certified values obtained by quantitative analysis was checked using a standard addition method. The standard deviation is not included in Table 4 due to the large amount of data. The number of the decimal places is related to the precision of the measurements and is between 1 and 10%. In order to check whether the difference between the experimental and the certified value is statistically significant, a t-test was conducted for the certified elements in RM LGC6177. The obtained values show that statistically significant differences are obtained both in the absence and in the presence of an element in the calibration (see Table S2).
Despite the complex matrix in the wastewater, as a results of which matrix and spectral interferences could be expected, relatively small variations of the measured concentrations were observed for the macroelements (in this case Na, K, Ca, Mg, Fe, Si, P, and B). The values of the per cent bias vary in similar interval compared to the water standard solutions and range between 0.3 and 18% in the presence and between 0.8 and 20% in the absence of the macroelements in the calibration process. Only for B, being also a macroelement in RM LGC6177, a bias till 36% was obtained when it is absent, but, at the same time, lower values for Mg and P were obtained.
The concentrations of Be, Ru, Rh, Ag, Sm, Dy, Er, Yb, Lu, Re, Os, Ir, Pt, Au, and Tl were below the LODs (usually below 0.01 µg L−1) in all or most of the steps of the TotalQuant analysis and are not presented in the table.
The degree of variation for micro- and trace elements is much wider compared to the macroelements. The obtained values for per cent bias of the microelements vary within wider limit, which shows that the accuracy is further dependent on the element. Some of the microelements present in ultratrace concentrations. Additionally, spectral interferences from the matrix are expected in their determination. In the presence of the elements, per cent bias higher than 30% is obtained for As, Se, Te, Nd, Tb, Ho, Tm, and Ta, present in concentrations from 0.09 to 0.6 µgL−1 (Se is 36.6 µgL−1), with the highest error being 44% for As. In the absence of the elements, per cent bias higher than 30% is obtained for the same elements, some of them with increased bias (As, Se, Te, Ho, and Ta), and in addition for Sc, V, Ge, Pd, Sb, Te, Cs, Ba, Eu, Hg, and Th. Obviously, besides the low concentrations, another factor is the impossibility of correct interpolation in the presence of spectral interferences, e.g., for V, Se, As, and Pd. Some rare earth elements (REEs—Y, La, Ce, Pr, Nd, Eu, Tb, Ho, and Tm) and In, Ta, Th, and U present in concentrations below 1 µg L−1. Despite the low concentrations, their determination is characterized by an error of up to 50% except for Eu and Ho. Some of the trace elements as Be, Re, Os, and Pt are below the LODs in both quantitative and TotalQuant analysis. Other trace elements have measurable concentrations (below 1 µg L−1) when using quantitative analysis but are not detected in all the steps (Rh, Ag, Cd, Sm, Dy, Er, Yb, Lu, Ir, Au, and Tl) or most of the steps (Ru and Gd) of the TotalQuant analysis due to its lower sensitivity (not presented in Table 4). A comparison with literature data regarding accuracy is difficult to make at this stage because the semiquantitave method has not yet found application for wastewater analysis. However, the obtained values for wastewater seem acceptable considering that accuracy in the range from ±10% [26] to ±50% [23] has been reported for analysis of natural waters.
In summary, for most of the microelements, the bias is relatively constant while they present as calibration solutions. For many of the microelements, it was established that there is a sharp increase of the bias after their exclusion, and, for others, a strong dependence not only on their presence but also on the presence of neighboring masses was observed. Factors that affect the accuracy of the TotalQuant analysis are complex and along with the number of calibration elements, a great impact has the elements concentrations, presence of spectral interferences and the presence of adjacent masses. In confirmation of the latter is the significant increase of the bias for V, Pd, Sb, Te, Cs, Ba, Eu, and Hg after exclusion of adjacent masses, as already established for the water standard solution. Thus, the presented results indicate the need for a careful selection of elements and number of elements for calibration in order to ensure narrow interpolation intervals (e.g., through 3–4 elements) especially when the purpose of the analysis is to obtain satisfactory accuracy for micro- and trace elements present in concentrations close to the detection limits. Otherwise, the results are indicative, only semiquantitative, and the error of the analysis for the trace elements may be over 100%.
The results for the solid CRMs are presented in Table 5 (CRM 029) and Table 6 (ERM-CC144).
The concentrations of Ru, Rh, Pd, Re, Os, Tm, Ir, and Pt were below the LODs in both CRM samples and are not presented in the Table 5 and Table 6. The concentration of Si is not included, due to losses during the digestion with HF.
The obtained concentrations of the macroelements Na, K, Ca, Mg, Fe, Al, and P in the solid sewage sludge CRMs were characterized with a constant error that did not show a significant dependence on the presence of the elements in the calibration process as already established for the liquid RM LGC6177. The accuracy, calculated as a per cent bias, reaches a maximum value of 30%, up to 15% for K, Ca, and Al.
The accuracy of the determination of the micro- and trace elements varies and depends on several factors. The results show when the microelements present as calibration elements, for the main part of them, the per cent bias is up to 30% in both CRMs (exception Lu), as for some elements being up to 15% in one CRM and up to 30% in the other CRM, e.g., Ti, V, As, Ga, Rb, Sn, and U.
The absence of the elements in the calibration leads to an increase in the bias for the main part of the elements. Values up to 15% are established for a very limited number of elements (Cr, Ga, Ge, Cd, La, Ce, and Nd in both CRMs; Ti, Cr, Sr, Cs, Eu, and Pb in CRM 029; and Be, Zr, Ag, Sn, and Dy in ERM-CC144). For 11 elements, the bias ranges between 15% and 30% (B, Sc, Mn, Co, Cu, Zn, Rb, Y, Ba, Bi, and Th) in both CRMs; Be, Se, Zr, Ag, Sn, Sb, and Gd and Tb in CRM 029; and Cr, Ti, V, Sr, Te, and Pb in ERM-CC144. This result indicates that the TotalQuant method is suitable for accurate determination of approx. the half of the elements. For some elements, the bias is in the interval 30–50% in both CRMs (Ni, As, Nb, Mo, Pr, Sm, Hf, W, Ta, Hg, and Au) and V, Te, Dy, Ta, and Te in CRM 029 and Sb, Gd, and Cs in ERM-CC 144. The difference in the accuracy for some elements (e.g., Sb, Ag, Cr, REEs, etc.) in CRM 029 and ERM-CC144 having similar matrices and, respectively, expected spectral interferences, could be explained by the different concentrations of the elements present. Bias higher than 50% was found for Ho, Er, Yb, and Lu (in CRM 029) and Eu and Tb (in ERM-CC 144). These elements present in concentrations below 0.5 mg kg−1. Obviously, the exclusion of elements present in trace concentrations leads to their determination with a poor accuracy. Indicative of the lower sensitivity of the semiquantitative than the quantitative method is the inability to determine the trace elements Sc, Se, Ho, Er, Yb, Tl, etc. in ERM-CC144. Thus, despite the expectations of a strong influence of the matrix and, correspondingly, the presence of strong spectral interferences in the absence of spectral interference corrections, a greater influence on the accuracy is exerted by the concentration of the elements.
Thus, splitting the macro- and microelements into mass intervals and the introduction of dynamic bandpass tuning parameter RPa for the macroelements allows the determination of around 40 elements with an accuracy of up to 30%. The results from the analyses of the solid CRMs showed that for many elements present in concentrations higher than 1 mgkg−1, the bias varied in a certain interval which did not depend on the number of calibration elements, e.g., Ti 0.5–16%, Cr 1–15%, Cd 1–14%, etc. in CRM 029 and Ti 10–32%, Co 1.5–23%, Cd 2–13%, etc. in ERM-CC144 and could be even better using less calibration elements. The reduction of the number of calibration elements most significantly lowers the accuracy of determination of elements in trace concentrations, e.g., Se, As, Pr, Eu, Tb, Ho, Er, Yb, Lu, Hf, and Au and in the presence of uncorrected spectral interferences, e.g., Se, and V. Their determination can be associated with a large bias, as well as signal loss due to poorer sensitivity of the TotalQuant method.

3.3. Comparison of the Accuracy after Calibration with Multielement Standard Solution and CRM

The analysis of the certified reference material ERM-CC144 was performed after calibration with CRM 029. Five-stage calibration was conducted as in the first stage for calibration; 29 elements that have certified values in CRM 029 were used for calibration, and at each subsequent stage their number was reduced to 3 elements, as shown in Figure 2.
The participation of all elements in the calibration leads to their determination with a bias up to 16% with a precision within 10%. Their exclusion from the calibration degrades the accuracy in the determination of As, Co, Hg, Mn, and Ni which is in the interval 30–45% for As and Hg and 20–30% for Co, Mn, and Ni.
To demonstrate the influence only of the matrix, not the number of elements, Figure 3 presents the values of the accuracy as the mean value with the respective standard deviation from the steps in which the elements were used for calibration in both calibration approaches. The accuracy only for the elements that have certified values in ERM-CC144 are presented, all of which also have certified values in the CRM 029 and are used for calibration.
The comparison of the obtained values for per cent bias showed that the determination of the certified elements is characterized by a bias up to 25% after calibration with water standard solution and up to 15% after calibration with CRM 029.
The significance of the results obtained by calibration with water standard solution and CRM 029 was assessed by application of t-test (Table S3). The data show that regardless of the applied calibration approach, a good match between the experimental and certified values was obtained for Cd, Co, Hg, Zn, Ca, Pb, and Na. A statistically significant difference is obtained using both calibration approaches for Mn and Ni. For Cr, K, P, Ti, As, and Al, better agreement of the experimental and the certified values is obtained when calibrating with CRM 029 and Fe, Mg, and Cu after calibration with water standard solution.
Since, in waste analysis, the concentration of the elements is often unpredictable, preparation of standard solutions with appropriate concentration intervals and good matrix matching is not always possible. Thus, calibration with CRM with similar matrix, if available, containing certified values for a reasonable number of both macro- and microelements, can be recommended in the analysis of waste samples ensuring better accuracy and precision of the determination.

3.4. Applicability of the Method for Analysis of Sewage Sludge Samples

The capabilities of analysis of sewage sludge samples were investigated when applying both calibration approaches and the described calibration steps. The results from the analysis of the sewage sludge samples taken from two WWTPs in Bulgaria using maximum number of calibration elements are presented in Table 7. The reduction of the number of calibration elements lead to an increase in the differences in the results from semiquantitave and quantitative analysis for the elements present in concentrations near the detection limits, e.g., Mo, Rh, W, Tl, and REEs. The degree of closeness between the results from quantitative and semiquantitative analysis varied for individual elements. It can be seen that, for the main part of the elements, they are relatively close and, at the same time, quite serious differences are observed for other elements, e.g., Mn, Mo, Zn, Th, and Sn regardless of the calibration approach. These results demonstrate the suitability of semiquantitative analysis as a rapid and simple method for characterization of waste samples and detection of differences in elemental content between different sample types. This is an evidence of the utility of semiquantitative analysis in obtaining representative information with satisfactory accuracy when calibrating with only one standard solution. It can be also used as a good starting base for subsequent quantitative analysis. In cases where high accuracy is required, a quantitative method can be applied as a second step. The advantage of a preliminary semi-quantitative analysis is the obtained analytical data for the sample matrix, concentration ranges, which will facilitate the preparation of suitable standard solutions, the presence of interfering elements, and the need for correction, the most appropriate dilution of the sample, the possibility of receiving saturated signals, etc.
The most suitable technique for the management of sewage sludge is its utilization in agriculture as fertilizer [37]. The content of hazardous pollutants, including PTEs, may cause serious damage to the environment [15], causing soil pollution and plant toxicity [10,38].
The TotalQuant method could be useful in quick characterization of sludge samples for their application in agriculture. The elements that must be obligatorily examined due to soil and plant toxicity according to the National Ordinance 339/2004 [9] and the European Council Directive, 1986 [10] for the use of sludge are As, Cd, Hg, Cr, Ni, Pb, Zn, and Cu. The data show that despite certain differences in the experimental values obtained from semiquantitative and quantitative analysis, the data from both analyses strongly indicate that the concentrations of the PTEs are below the maximum permitted levels. The national and the European regulations do not specify a requirement for the accuracy of the methods used, but only reference methods (AAS, ICP-AES, and ICP-MS) and the required detection limits. This implies the possibility for application of the TotalQuant ICP-MS method for sludge analysis before agricultural use. In cases where the obtained concentrations of the PTEs are close to the maximum permitted values, their determination with a quantitative method for higher accuracy could be applied. Similar recommendations have already been made for analysis of plant [31] and soil samples [39].
Thus, it proves that the TotalQuant method is a suitable approach for a quick assessment of the possibility of sludge application to agriculture with satisfactory accuracy. Another serious advantage of the optimized TotalQuant method is that, along with the data for the PTEs, valuable information for the content of essential elements such as phosphorus, potassium, calcium, sodium, etc. is also obtained. This possibility shortens a lot of analytical work such as repeatedly dilution the samples, applying cold plasma ICP-MS, using another analytical method, e.g., ICP-AES, which in all cases requires at least one more measurement of the samples with a set of standard solutions.
The concentrations of Ru, Rh, Re, Os, Ir, and Pt are below the limit of detection from quantitative and TotalQuant analysis and are not presented in the table.

4. Conclusions

The TotalQuant method is suitable for quick panoramic analysis of sewage sludge samples with complex matrices. Concentrations of 69 elements with satisfactory accuracy can be achieved in a single run after external calibration using one multielement standard solution. Accuracy improvement can be achieved using CRM for calibration with appropriate matrix composition and certified values both for macro- and microelements. The best accuracy was obtained for the macroelements using both calibration approaches and is up to 30%. For the microelements, the accuracy varied in a wide range depending on the concentration, their use in the calibration, and/or the presence of neighboring masses. The worse accuracy was obtained for the elements present in concentrations near the limit of detection due to the lower sensitivity of the semiquantitative compared to the quantitative analysis. A significant factor affecting the accuracy is also the presence of uncompensated spectral interferences. Although the TotalQuant method can be applied after calibration with 3 elements, for the analysis of waste samples with a complex matrix, the use of more calibration elements and shortening of the mass intervals is recommended, especially for the determination of the trace elements. In order to reduce the analytical work of preparing standard solutions with a full number of elements and at the same time obtaining satisfactory accuracy of up to 30%, it is preferable that the calibration is conducted with 28 or at least 19 elements (steps 4 or 3 in Figure 1).

Supplementary Materials

The supporting information can be downloaded at: https://www.mdpi.com/article/10.3390/pr11123379/s1.

Author Contributions

Conceptualization, V.L. and R.D.; methodology, V.L., I.B. and R.D.; software, V.L. and R.D.; validation, V.L.; formal analysis, V.L. and I.B.; investigation, formal analysis; resources, V.L., I.B., R.D., P.P. and E.T.; data curation, V.L. and I.B.; writing—original draft preparation, V.L. and I.B.; writing—review and editing, V.L. and R.D.; visualization, V.L. and I.B.; supervision, V.L.; project administration, V.L. and E.T.; funding acquisition, V.L. and E.T. All authors have read and agreed to the published version of the manuscript.

Funding

This research was funded by the Clean & Circle Project BG05M2OP001-1.002-0019: “Clean technologies for sustainable environment—waters, waste, energy for circular economy”, funded by the operational programme “Science and education for smart growth” 2014–2020, co-financed by the European Union through the European structural and investment funds. Research equipment from Distributed Research Infrastructure INFRAMAT, part of the Bulgarian National Roadmap for Research Infrastructures, supported by the Bulgarian Ministry of Education and Science, was used in this investigation.

Data Availability Statement

The data presented in this study are available on request from the corresponding author.

Acknowledgments

The authors are grateful to Stefan Tsakovski for the help in the statistical processing of the results.

Conflicts of Interest

The authors declare no conflict of interest.

References

  1. Siddo, I.S.; Adamou, M.M.; Abou, F.M. Physico-Chemical Characterization of Sludge from the Goudel Drinking Water Production Plant in Niamey (Niger). Nat. Resour. 2022, 13, 206–216. [Google Scholar] [CrossRef]
  2. El Hammoudani, Y.; Dimane, F.; El Ouarghi, H. Characterization of sewage sludge generated from wastewater treatment plant in relation to agricultural use. Environ. Water Sci. Public Health Territ. Intell. J. 2019, 3, 47–52. [Google Scholar]
  3. Litvinov, V.; Daumova, G.; Shaikhov, M.; Sergeyeva, N. Analysis of the Composition of Municipal Wastewater Sludge from Small Settlements in East Kazakhstan. J. Ecol. Eng. 2022, 23, 105–112. [Google Scholar] [CrossRef]
  4. Mtshali, J.S.; Tiruneh, A.T.; Fadiran, A.O. Characterization of Sewage Sludge Generated from Wastewater Treatment Plants in Swaziland in Relation to Agricultural Uses. Resour. Environ. 2014, 4, 190–199. [Google Scholar]
  5. Pöykiö, R.; Watkins, G.; Dahl, O. Characterisation of Municipal Sewage Sludge as a Soil Improver and a Fertilizer Product. Ecol. Chem. Eng. S 2019, 26, 547–557. [Google Scholar] [CrossRef]
  6. Bachev, H.; Ivanov, B. Transforming Sludge from a Waste into Product in Circular Economy of Bulgarian Agriculture. Econ. Coyunt. 2022, 7, 117–148. [Google Scholar]
  7. Bachev, H. Institutional Structure of the Agricultural Utilization of Sludge from Wastewater Treatment Plants in Bulgaria. SSRN Electron. J. 2023. [Google Scholar] [CrossRef]
  8. Bachev, H.; Ivanov, B. A study on wastewater treatment sludge utilization in Bulgarian agriculture. Technol. Audit Prod. Reserves 2022, 5, 35–44. [Google Scholar] [CrossRef]
  9. Bulgarian National Ordinance 339/2004 for Regulation on Procedure and Manner for Use of Sludge from the Treatment of Waste Waters through Their Application in Agriculture Adopted by CMD No 339 of 14.12.2004. Available online: https://www.mzh.government.bg/MZH/Libraries/%D0%9D%D0%BE%D1%80%D0%BC_%D0%90%D0%BA%D1%82%D0%BE%D0%B2%D0%B5-%D0%9D%D0%B0%D1%80%D0%B5%D0%B4%D0%B1%D0%B8/Naredba_Utaiki.sflb.ashx (accessed on 4 March 2023).
  10. Council of the European Communities. Council Directive of 12 June 1986 on the protection of the environment, and in particular of the soil, when sewage sludge is used in agriculture. Off. J. Eur. Communities 1986, L181, 6–12. Available online: https://eur-lex.europa.eu/legal-content/EN/TXT/?uri=celex%3A31986L0278 (accessed on 4 March 2023).
  11. Djingova, R.; Mihaylova, V.; Lyubomirova, V.; Tsalev, D.L. Multielement Analytical Spectroscopy in Plant Ionomics Research. Appl. Spectrosc. Rev. 2013, 48, 384–424. [Google Scholar] [CrossRef]
  12. Tytła, M. Identification of the Chemical Forms of Heavy Metals in Municipal Sewage Sludge as a Critical Element of Ecological Risk Assessment in Terms of Its Agricultural or Natural Use. Int. J. Environ. Res. Public Health 2020, 17, 4640. [Google Scholar] [CrossRef] [PubMed]
  13. Dai, J.Y.; Chen, L.; Zhao, J.F.; Ma, N. Characteristics of sewage sludge and distribution of heavy metal in plants with amendment of sewage sludge. J. Environ. Sci. 2006, 18, 1094–1100. [Google Scholar] [CrossRef] [PubMed]
  14. Mazurek, K.; Drużyński, S.; Kiełkowska, U.; Wegrzynowicz, A.; Nowak, A.K.; Wzorek, Z.; Wróbel, A. Municipal Sewage Sludge as a Source for Obtaining Efficient Biosorbents: Analysis of Pyrolysis Products and Adsorption Tests. Materials 2023, 16, 2648. [Google Scholar] [CrossRef] [PubMed]
  15. Ahmad, T.; Ahmad, K.; Alam, M. Characterization of Water Treatment Plant’s Sludge and its Safe Disposal Options. Procedia Environ. Sci. 2016, 35, 950–955. [Google Scholar] [CrossRef]
  16. Samanta, S.; Cloete, R.; Loock, J.; Rossouw, R.; Roychoudhury, A.N. Determination of Trace Metal (Mn, Fe, Ni, Cu, Zn, Co, Cd and Pb) Concentrations in Seawater Using Single Quadrupole ICP-MS: A Comparison between Offline and Online Preconcentration Setups. Minerals 2021, 11, 1289. [Google Scholar] [CrossRef]
  17. Wang, X.; Shi, M.; Zhang, J.; Pang, Y.; Zhao, Y. Significance of Trace Elements in Marine Shale Pyrite for Reconstructing the Sedimentary Environment: A Case Study of Niutitang and Hongshuizhuang Formations. ACS Earth Space Chem. 2021, 5, 3210–3225. [Google Scholar] [CrossRef]
  18. Wilschefski, S.C.; Baxter, M.R. Inductively Coupled Plasma Mass Spectrometry: Introduction to Analytical Aspects. Clin. Biochem. Rev. 2019, 40, 115. [Google Scholar] [CrossRef] [PubMed]
  19. Lyubomirova, V.; Mihaylova, V.; Djingova, R. Determination of macroelements in potable waters with cell-based inductively-coupled plasma mass spectrometry. Spectrosc. Eur. 2020, 32, 18–21. [Google Scholar]
  20. Sajnog, A.; Tkaczyk, M.; Stanczyk, M.; Szaflik, K.; Suliburska, J.; Kocyłowski, R.; Barałkiewicz, D. A new procedure for the determination of 21 macro- and trace elements in human fetal urine using an inductively coupled plasma mass spectrometry with dynamic reaction cell (ICP-DRC-MS) equipped with a micro-flow nebulizer. Talanta 2021, 222, 121672. [Google Scholar] [CrossRef]
  21. Sucharova, J. Optimisation of DRC ICP-MS for determining selenium in plants. J. Anal. At. Spectrom. 2011, 26, 1756–1762. [Google Scholar] [CrossRef]
  22. Tanner, S.D.; Baranov, V.I.; Bandura, D.R. Reaction cells and collision cells for ICP-MS: A tutorial review. Spectrochim. Acta Part B At. Spectrosc. 2002, 57, 1361–1452. [Google Scholar] [CrossRef]
  23. Jitaru, P.; Tirez, K.; De Brucker, N. Panoramic Analysis for Monitoring Trace Metals in Natural Waters by ICP-MS. Atom. Spectrosc. 2003, 24, 1–11. [Google Scholar]
  24. Amarasiriwardena, D.; Durrant, S.F.; Lásztity, A.; Krushevska, A.; Argentine, M.D.; Barnes, R.M. Semiquantitative analysis of biological materials by inductively coupled plasma–mass spectrometry. Microchem. J. 1997, 56, 352–372. [Google Scholar] [CrossRef]
  25. Wagner, B.; Bulska, E. Quantitative aspects of inductively coupled plasma mass spectrometry. Philos. Trans. R. Soc. A 2016, 374, 20150369. [Google Scholar]
  26. Chen, H.; Dabek-Zlotorzynska, E.; Rasmussen, P.E.; Hassan, N.; Lanouette, M. Evaluation of semiquantitative analysis mode in ICP-MS. Talanata 2008, 74, 1547–1555. [Google Scholar] [CrossRef] [PubMed]
  27. Gałuszka, A.; Migaszewski, Z.; Namieśnik, J. The 12 principles of green analytical chemistry and the SIGNIFICANCE mnemonic of green analytical practices. Trends Anal. Chem. 2013, 50, 78–84. [Google Scholar] [CrossRef]
  28. Krzciuk, K. Intelligent Analysis of Samples by Semiquantitative Inductively Coupled Plasma Mass Spectrometry (ICP–MS) Technique: A Review. Crit. Rev. Anal. Chem. 2015, 46, 284–290. [Google Scholar] [CrossRef]
  29. Petri, M.; Jiang, J.Q.; Maier, M. Suitability of semi-quantitative inductive coupled plasma-mass spectrometry for multi-elemental screening in water contamination warning system. J. Appl. Spectrosc. 2013, 80, 437–448. [Google Scholar] [CrossRef]
  30. Zuluaga, J.; Rodríguez, N.; Rivas-Ramirez, I.; De la Fuente, V.; Rufo, L.; Amils, R. An Improved Semiquantitative Method for Elemental Analysis of Plants Using Inductive Coupled Plasma Mass Spectrometry. Biol. Trace Elem. Res. 2011, 144, 1302–1317. [Google Scholar] [CrossRef]
  31. Gałuszka, A.; Krzciuk, K.; Migaszewski, Z.M. A new two-step screening method for prospecting of trace element accumulating plants. Int. J. Environ. Sci. Technol. 2015, 12, 3071–3078. [Google Scholar] [CrossRef]
  32. Denoyer, E.R. Semiquantitative Analysis of Environmental Materials by Laser Sampling Inductively Coupled Plasma Mass Spectrometry. J. Anal. At. Spectrom. 1992, 7, 1187–1193. [Google Scholar] [CrossRef]
  33. Carrero, J.A.; Arrizabalaga, I.; Bustamante, J.; Goienaga, N.; Arana, G.; Madariaga, J.M. Diagnosing the traffic impact on roadside soils through a multianalytical data analysis of the concentration profiles of traffic–related elements. Sci. Total Environ. 2013, 458–460, 427–434. [Google Scholar] [CrossRef] [PubMed]
  34. Joly, A.; Smargiassi, A.; Kosatsky, T.; Fournier, M.; Dabek–Zlotorzynska, E.; Celo, V.; Mathieu, D.; Servranckx, R.; D’amours, R.; Malo, A.; et al. Characterisation of particulate exposure during fireworks displays. Atmos. Environ. 2010, 44, 4325–4329. [Google Scholar] [CrossRef]
  35. Balaram, V.; Rao, T.G. Rapid determination of REEs and other trace elements in geological samples by microwave acid digestion and ICP–MS. Atom. Spectrosc. 2003, 24, 206–212. [Google Scholar]
  36. HORIBA Scientific. Analysis of Five Different Soil and Wastewater Samples. Available online: https://www.azom.com/article.aspx?ArticleID=16094 (accessed on 1 March 2023).
  37. Khnaijer, B.; Cherkaoui, E.; Khamar, M.; Nounah, A. Characterization of the residual sludge from the wastewater treatment plant of JERADA. E3S Web Conf. 2020, 150, 02004. [Google Scholar] [CrossRef]
  38. Valchev, D.; Ribarova, I.; Uzunov, B.; Stoyneva-Gärtner, M.; Lyubomirova, V. Reclamation Potential of Onsite Wastewater Post-Treatment with Microalgae: Chemical Elements Perspective. Processes 2023, 11, 1819. [Google Scholar] [CrossRef]
  39. Laborda, F.; Medrano, J.; Castillo, J.R. Quality of quantitative and semiquantitative results in inductively coupled plasma mass spectrometry. J. Anal. At. Spectrom. 2001, 16, 732–738. [Google Scholar] [CrossRef]
Figure 1. Elements reduction steps using water standard solution (macroelements—red color, microelements—blue color).
Processes 11 03379 g001
Figure 2. Elements reduction steps using solid waste CRM 029 (macroelements—red color, microelements—blue color).
Processes 11 03379 g002
Figure 3. Comparison of the mean per cent bias and the respective standard deviation from the measurement of ERM-CC144 from the steps in which the elements were used for calibration.
Processes 11 03379 g003
Table 1. Standard solutions used for calibration.
Standard
Solutions
Standard
Number
Element ConcentrationsElements Present in Calibration Standard Solutions
1macroelements—1 mg L−1
microelements—10 µg L−1
macroelements—Na, K, Ca, Mg, Fe, Al, Si, P
microelements—Li, Be, B, Sc, Ti, V, Cr, Mn,
Co, Ni, Cu, Zn, Ga, Ge, As, Se, Rb, Sr, Y,
Zr, Nb, Mo, Ru, Rh, Pd, Ag, Cd, In, Sn, Sb,
Te, Cs, Ba, La, Ce, Pr, Nd, Sm, Eu, Gd, Tb,
Dy, Ho, Er, Tm, Yb, Lu, Hf, Ta, W, Re, Os,
Ir, Pt, Au, Hg, Tl, Pb, Bi, Th, U
2macroelements—5 mg L−1
microelements—50 µg L−1
3macroelements—10 mg L−1
microelements—100 µg L−1
Table 2. (A) Default mass intervals of the TotalQuant method. (B) Divided mass intervals and optimized rejection parameters RPa (V).
(A)
Begin Mass
(amu)
End Mass
(amu)
Dwell Time
(ms)
Integration Time (ms)RPa
(V)
615505000
19395010500
422105084500
230240505500
(B)
Begin Mass
(amu)
End Mass
(amu)
Dwell Time
(ms)
Integration TIME (ms)RPa
(V)
615505000
1922502000
232350500.017
2426501500.016
2728501000.016
2930501000.013
313150500.014
3238503500
393950500.017
4244501500.015
4553504500
545450500.014
555550500
565650500.017
575850500.014
592105076000
230240505500
Table 3. Accuracy (per cent bias, %) in the determination of 69 elements in aqueous standard solutions by subsequent reduction of the number of calibration elements. The elements not used for calibration are expressed in red lettering.
Elem.Step 1Step 2Step 3Step 4Step 5Step 6Step 7
Li1.91.30.81.52.83.23
Be9.718.319.128.625.818.828.7
B9.39.822.822.420.51323.8
Sc12.412.112.312.813.112.514.8
Na8.99.43.78.77.53.10.5
Mg0.53.64.72.97.58.37.6
Al3.91.80.56.00.72.28.4
Si6.84.32.89.81.62.28.5
P4.65.28.77.31.64.36
K3.87.90.65.80.21.94.8
Ca2.15.42.36.16.43.65.3
Ti5.28.47.210.011.77.26.6
V3.93.34.928.65664.168.1
Cr0.80.210.225.318.123.325.8
Mn0.75.42.19.84.95.611.8
Fe2.63.96.33.83.34.23.1
Co9.811.11.77.87.214.210.8
Ni0.534.20.80.31.70.5
Cu4.11.34.00.91.90.80.3
Zn0.13.34.511.18.511.08.0
Ga3.74.41.74.15.42.20.7
Ge13.513.814.114.514.814.314.9
As11.3343234454446
Se20.12118.319.1544852
Rb6.01.32.60.58.94.37.7
Sr2.25.60.74.62.12.42.7
Y2.02.52.33.14.22.40.3
Zr0.92.52.81.06.63.11.2
Nb0.70.95.15.86.11311.2
Mo3.53.42.64.63.03.33.6
Ru2.05.41.21.70.23.72.8
Rh0.42.11.73.362.361.563.2
Pd7.26.85.57.777.777.879.2
Ag0.42.80.86.379.48180.4
Cd5.12.50.25.486.786.685.8
In0.10.11.11.31.31.11.0
Sn4.23.62.33.23.71.51.7
Sb7.24.32.44.936.239.442.2
Te4.65.54.16.953.657.858.3
Cs5.36.16.332.53336.233.4
Ba4.60.99.18.66.748.449.8
La1.23.11.81.52.03436.2
Ce1.12.22019.33836.133.4
Pr0.91.34.213.514.514.914.6
Nd0.53.42.40.2313931.9
Sm2.52.70.21.439.944.729.8
Eu3.60.71.63.313.614.611.6
Gd4.14.35.45.35.25.35.4
Tb1.11.80.80.91.31.10.9
Dy4.81.53.01.94.48.46.3
Ho2.33.04.15.35.86.25.5
Er2.90.62.20.60.81114.6
Tm6.05.42928.33038.436
Yb2.44.26.22.73.21921.7
Lu3.14.08.06.17.016.521
Hf2.65.35.72.11.814.013.4
Ta4.25.07.611.210.412.613
W3.07.70.24.83.912.011.0
Re5.87.86.36.03.329.829.6
Os0.97.36.329.328.229.120.2
Ir2.32.426.929.73029.126.3
Pt6.021.228.329.130.129.330.2
Au3.06.39.78.89.95.327.6
Hg1.92.32.10.51.86.129.4
Tl3.53.30.10.33.430.227.9
Pb2.12.41.77.513.918.617.1
Bi4.22.91.33.71.921.722.2
Th0.92.32.92.65.57.17.1
U3.25.13.64.83.82.94.9
Table 4. Concentrations obtained in each step for the wastewater RM LGC6177. The elements not used for calibration are expressed in red lettering.
Elem.Step 1Step 2Step 3Step 4Step 5Step 6Step 7Cert. Value
Li (mg L−1)0.280.260.280.340.260.290.33(0.30)
B (mg L−1)8.99.71313.112.311.413.39.8 ± 0.5
Sc (µg L−1)10.512.513.113.313.113.713.9(9.0)
Na (mg L−1)17201973162017082058192320921750 ± 29
Mg (mg L−1)78.179.280.679.576.374.177.173.5 ± 2.7
Al (mg L−1)0.130.170.160.170.160.140.18(0.15)
Si (mg L−1)34.836.531.634.735.636.037.1(33.2)
P (mg L−1)12.913.113.213.612.111.912.811.5 ± 1.5
K (mg L−1)867791784757836710829780 ± 14
Ca (mg L−1)84.285.570.981.690.082.688.674.8 ± 1.7
Ti (mg L−1)0.090.100.080.130.120.130.13(0.10)
V (mg L−1)0.10.090.110.160.150.150.15(0.09)
Cr (mg L−1)0.160.150.160.190.170.180.190.18 ± 0.02
Mn (mg L−1)0.140.140.140.150.150.150.180.14 ± 0.02
Fe (mg L−1)3.93.83.63.93.73.53.73.8 ± 0.2
Co (mg L−1)0.0460.0430.0420.0480.0490.0460.054(0.050)
Ni (mg L−1)0.240.260.250.260.250.260.240.21 ± 0.02
Cu (mg L−1)0.0450.0390.0400.0390.0420.0380.049(0.046)
Zn (mg L−1)0.270.260.260.280.270.280.29(0.23)
Ga (µg L−1)9.18.69.810.99.69.88.2(10.6)
Ge (µg L−1)4.84.96.16.26.16.26.2(4.0)
As (mg L−1)0.130.160.170.160.150.160.17(0.09)
Se (µg L−1)51.248.046.249.55659.662.4(36.3)
Rb (mg L−1)0.480.450.450.450.410.440.44(0.47)
Sr (mg L−1)0.960.890.890.910.840.830.91(0.89)
Y (µg L−1)0.60.60.40.60.40.60.6(0.50)
Zr (mg L−1)0.0730.0720.070.0770.0650.0670.059(0.061)
Nb (µg L−1)1.261.261.091.231.281.191.27(1.25)
Mo (µg L−1)15.817.414.511.412.8 18.6(14.9)
Pd (µg L−1)10.17.86.87.51.52.73.2(8.9)
In (µg L−1)0.70.70.80.60.60.80.6(0.8)
Sn (mg L−1)0.0390.0450.0430.0450.050.0440.050(0.042)
Sb (µg L−1)3.63.33.92.62.32.32.2(3.6)
Te (µg L−1)1.92.21.31.11.20.60.7(1.6)
Cs (µg L−1)5.96.15.28.22.22.42.1(5.9)
Ba (mg L−1)0.830.720.720.790.40.370.36(0.73)
La (µg L−1)0.90.950.920.980.890.91.1(0.8)
Ce (µg L−1)0.80.60.70.60.70.50.9(0.7)
Pr (µg L−1)0.50.60.50.40.40.50.6(0.5)
Nd (µg L−1)0.30.20.20.20.40.20.2(0.3)
Eu (µg L−1)0.20.10.20.20.30.20.4(0.2)
Tb (µg L−1)0.20.20.30.30.30.20.2(0.2)
Ho (µg L−1)0.30.40.40.40.60.60.5(0.3)
Tm (µg L−1)0.130.130.120.110.100.110.10(0.20)
Hf (µg L−1)0.90.80.90.81.11.20.9(1.1)
Ta (µg L−1)0.70.80.90.80.91.01.1(0.6)
W (mg L−1)0.0630.0560.0650.0630.0620.0580.041(0.050)
Hg (mg L−1)0.0390.0350.0270.0270.0190.0220.021(0.030)
Pb (µg L−1)15.016.118.217.017.116.217.3(14.0)
Bi (µg L−1)16.115.216.016.116.316.217.0(13.1)
Th (µg L−1)0.40.40.50.50.50.60.6(0.4)
U (µg L−1)0.70.60.480.50.50.50.5(0.66)
() Data from quantitative analysis.
Table 5. Concentrations (in mg kg−1) obtained in each step for the solid sewage sludge CRM 029. The elements not used for calibration are expressed in red lettering.
Elem.Step 1Step 2Step 3Step 4Step 5Step 6Step 7Cert. Value
Li101106999011210092(103)
Be238230273255296201273242
B457434452470473451442606
Sc<LOD<LOD<LOD<LOD<LOD<LOD<LOD1.1
Na38683855331934793369381244243773
Mg99849279967910,606918610,965970911,858
Al20,07816,32016,75917,95518,49520,06118,14617,211
P25,12524,82324,65021,55115,43017,31327,25121,100
K47224577487749244322466243254918
Ca37,88938,14237,52336,87936,01036,58637,52138,016
Ti197209214195175191182208
V167166203215237218227165
Cr320348339340300338339353
Mn204193209210192198186264
Fe24,68722,95923,79222,50022,18623,37524,59320,199
Co82.086.087.181.987.285.783.870.4
Ni147160146168174167171127
Cu696689629694629609661736
Zn11831166124113851348128413271080
Ga6.26.36.16.36.26.26.1(6.14)
Ge5.85.15.05.35.25.45.45.6
As320333350342358360356256
Se385392385390310292276411
Rb10.810.311.912.111.911.811.1(9.7)
Sr432471408429452399403454
Y2.522.312.442.742.741.892.48(2.33)
Zr111120111120115137103(155)
Nb2.102.442.332.552.111.711.71(1.8)
Mo1161131121321279298155
Ag929610310911410810388.1
Cd121139131119128124127122
In0.740.630.590.620.640.750.58(0.74)
Sn11311497116117122111139
Sb182175167180180182178149
Te8.95.85.55.64.64.64.7(0.35)
Cs0.480.420.440.40.380.390.38(0.45)
Ba13651162125816131434163812421270
La10.910.710.110.710.010.710.6(9.6)
Ce13.113.812.913.512.512.612.6(11.8)
Pr1.61.01.81.81.71.60.9(1.3)
Nd3.974.113.763.123.163.593.12(3.7)
Sm0.970.880.970.860.740.730.66(1.20)
Eu1.61.41.31.41.41.11.4(1.3)
Gd0.840.830.660.600.790.610.60(0.64)
Tb0.540.580.530.520.580.590.54(0.45)
Dy0.720.680.700.600.580.520.42(0.83)
Ho0.120.160.150.140.100.300.60(0.15)
Er0.30.40.40.3<LOD<LOD0.18(0.3)
Yb0.320.340.370.140.120.180.2(0.35)
Lu0.18<LOD0.15<LOD0.12<LOD0.6(0.07)
Hf4.202.362.262.362.302.462.60(4.53)
Ta0.980.960.820.840.760.680.70(1.34)
W30.523.733.937.245.240.243.5(31.3)
Au3.13.33.23.23.32.43.9(2.8)
Hg16.315.916.417.911.712.511.918.7
Tl142157131162143144146170
Pb104117102120102112109119
Bi78.562.056.990677673.1(76.4)
Th7.96.27.77.05.45.85.9(7.5)
U17.617.017.215.517.115.315.8(16.0)
() Data from quantitative analysis.
Table 6. Concentrations (in mg kg−1) obtained in each step for the solid sewage sludge ERM-CC144. The elements not used for calibration are expressed in red lettering.
Elem.Step 1Step 2Step 3Step 4Step 5Step 6Step 7Cert. Value
Li5.915.124.845.265.65.135.14(5.68)
Be1.21.41.31.41.51.11.5(1.71)
B41404.044424042(54.1)
Sc<LOD<LOD<LOD<LOD<LOD<LOD<LOD1.4
Na17481872211616521572144713061800
Mg29363144349439213285351028993800
Al22,46320,70715,46915,96016,19317,87018,57519,000
P21,06719,97621,14220,34218,77418,30021,85016,600
K25522678259024352735266626202900
Ca32,50031,78933,52631,29230,40029,07428,50831,000
Ti19791791172916501704177517111500
V32313337384038(30.3)
Cr132130138141121115139168
Mn270278281279251260248352
Fe33,86238,37330,79240,68038,30026,50738,45332,900
Co6.36.46.65.55.15.05.56.5
Ni10410910812412712512891
Cu311295270274261279301348
Zn113810571047101110447721067980
Ga3.93.22.93.23.13.14.14.0
Ge8.88.28.38.48.28.28.38.2
As9.410.210.510.311.210.910.77.7
Se<LOD<LOD<LOD<LOD<LOD<LOD<LOD21.4
Rb12.010.57.710.59.09.78.7(10.0)
Sr204203172209204211176(234)
Y1.91.92.12.42.22.11.9(1.80)
Zr21.223.323.425.225.923.222.8(26.3)
Nb3.94.04.04.43.92.43.7(3.72)
Mo16.316.617.215.616.711.716.0(12.7)
Ag41474242424950(43.1)
Cd13.114.213.812.614.415.214.714.5
In0.100.110.110.080.090.090.09(0.09)
Sn42443741414440(40.2)
Sb3.82.92.52.933.12.9(5.0)
Te2.51.91.81.61.71.61.7(2.3)
Cs0.580.590.460.520.40.50.34(0.55)
Ba849745656612732568641(857)
La7.27.76.67.97.77.37.5(6.96)
Ce13.613.912.713.913.412.113.5(14.0)
Pr1.41.51.21.31.51.51.1(1.0)
Nd3.73.83.63.63.43.53.4(3.4)
Sm0.60.40.60.70.70.80.8(0.54)
Eu0.40.20.30.10.20.30.3(0.5)
Gd1.00.80.70.80.70.70.6(1.0)
Tb0.160.140.14<LOD0.140.140.48(0.17)
Dy0.40.40.40.40.40.40.4(0.45)
Ho0.16<LOD<LOD<LOD<LOD<LOD0.08(0.14)
Er0.360.420.020.02<LOD<LOD0.12(0.33)
Yb0.340.290.28<LOD<LOD<LOD0.1(0.30)
Lu0.020.070.080.070.080.07<LOD(0.04)
Hf0.480.360.30.340.320.400.42(0.60)
Ta0.90.90.90.50.60.70.6(0.8)
W3.03.13.43.32.22.52.2(3.3)
Au1.11.41.21.11.61.71.9(1.3)
Hg5.25.45.45.13.93.63.265.9
Tl0.78<LOD0.060.02<LOD<LOD<LOD(1.0)
Pb140142112163136130127157
Bi20.325.214.523.216.916.016.5(21.1)
Th1.41.71.51.61.31.41.2(1.7)
U1.81.81.71.81.81.61.6(1.95)
() Data from quantitative analysis.
Table 7. Concentration of macro-, micro-, and trace elements in sewage sludge samples determined with TotalQuant analysis after calibration with multielement standard solution (MSS) and CRM 029 and quantitative analysis (QA).
Sewage Sludge 1Sewage Sludge 2
Elem.
(mg kg−1)
Calibration
with MSS
Calibration
with CRM 029
QACalibration
with MSS
Calibration with CRM 029QA
Li10.1 ± 0.88.2 ± 0.79.0 ± 0.50.20 ± 0.090.23 ± 0.070.24 ± 0.4
Be1.3 ± 0.11.0 ± 0.11.13 ± 0.060.41 ± 0.020.16 ± 0.020.08 ± 0.01
B˂LOD0.64 ± 0.050.82 ± 0.03˂LOD˂LOD˂LOD
Na4386 ± 1753146 ± 1405124 ± 1053567 ± 1633004 ± 1084068 ± 102
Mg5616 ± 2247454 ± 2514845 ± 2082591 ± 1033191 ± 1123587 ± 108
Al33,252 ± 199532,690 ± 184733,449 ± 12403479 ± 2083460 ± 2003643 ± 190
P15,110 ± 76019,511 ± 81021,564 ± 65031,477 ± 157331,085 ± 168032,806 ± 1300
K5745 ± 2709215 ± 29410,251 ± 2303594 ± 1803836 ± 1923418 ± 165
Ca15,854 ± 63416,854 ± 68016,029 ± 61035,212 ± 130039,128 ± 141041,649 ± 1180
Ti2052 ± 1022213 ± 1102573 ± 91113 ± 6162 ± 8166 ± 7
V86 ± 758 ± 682 ± 574 ± 683 ± 680 ± 4
Cr (500/-) *91 ± 596 ± 488 ± 4252 ± 12265 ± 15185 ± 11
Mn112 ± 9162 ± 8194 ± 63070 ± 2453149 ± 2503316 ± 329
Fe28,112 ± 140523,622 ± 136026,804 ± 1210196,024 ± 9800164,158 ± 8200238,603 ± 10,900
Co6.9 ± 0.65.8 ± 0.56.5 ± 0.334 ± 231 ± 234 ± 1
Ni (350/300–400) *37 ± 226 ± 129 ± 1150 ± 697 ± 4108 ± 3
Cu (1600/1000–1750) *208 ± 9221 ± 8229 ± 7437 ± 19471 ± 21504 ± 12
Zn (3000/2500–4000) *1285 ± 102896 ± 891108 ± 60459 ± 35500 ± 38670 ± 30
Ga7.9 ± 0.710.0 ± 0.710.8 ± 0.52.3 ± 0.23.4 ± 0.33.8 ± 0.2
As (25/-) *11 ± 114 ± 115 ± 118 ± 218 ± 212 ± 1
Se˂LOD˂LOD85 ± 5<LOD<LOD<LOD
Rb35 ± 236 ± 226.2 ± 0.94.7 ± 0.34.4 ± 0.27.6 ± 20.3
Sr154 ± 8161 ± 9126 ± 5177 ± 8190 ± 7152 ± 6
Y7.0 ± 0.48.2 ± 0.57.1 ± 0.40.98 ± 0.51.2 ± 0.41.1 ± 0.2
Zr33 ± 239 ± 330 ± 15.1 ± 0.36.3 ± 0.45.2 ± 0.1
Nb3.3 ± 0.24.0 ± 0.22.1 ± 0.10.67 ± 0.040.88 ± 0.040.71 ± 0.02
Mo4.3 ± 0.26.6 ± 0.33.5 ± 0.29.7 ± 0.516.3 ± 0.713.2 ± 0.2
Pd0.98 ± 0.090.98 ± 0.091.41 ± 0.060.39 ± 0.030.25 ± 0.020.45 ± 0.03
Ag1.28 ± 0.063.1 ± 0.43.5 ± 0.21.2 ± 0.10.91 ± 0.090.93 ± 0.04
Cd (30/20–40) *1.9 ± 0.21.9 ± 0.22.0 ± 0.10.41 ± 0.030.51 ± 0.030.57 ± 0.02
In0.060 ± 0.0050.10 ± 0.010.11 ± 0.01<LOD<LOD<LOD
Sn19.2 ± 0.814.8 ± 0.613.6 ± 0.317.7 ± 0.614.5 ± 0.415.3 ± 0.2
Sb1.8 ± 0.22.0 ± 0.12.5 ± 0.11.3 ± 0.12.3 ± 0.12.9 ± 0.1
Te0.36 ± 0.030.83 ± 0.060.65 ± 0.030.64 ± 0.050.49 ± 0.040.78 ± 0.03
Cs7.2 ± 0.64.6 ± 0.46.8 ± 0.3<LOD0.14 ± 0.010.13 ± 0.01
Ba419 ± 33482 ± 38480 ± 15266 ± 21229 ± 16226 ± 11
La12.2 ± 0.66.7 ± 0.410.7 ± 0.31.8 ± 0.10.86 ± 0.051.6 ± 0.1
Ce23 ± 112.7 ± 0.619.3 ± 0.82.6 ± 0.11.4 ± 0.12.5 ± 0.1
Pr2.6 ± 0.21.3 ± 0.12.2 ± 0.10.19 ± 0.020.61 ± 0.040.35 ± 0.02
Nd9.7 ± 0.65.2 ± 0.37.8 ± 0.21.0 ± 0.10.65 ± 0.021.1 ± 0.1
Sm2.4 ± 0.21.4 ± 0.12.0 ± 0.10.24 ± 0.020.24 ± 0.020.51 ± 0.03
Eu0.50 ± 0.040.30 ± 0.030.54 ± 0.040.10 ± 0.020.06 ± 0.020.03 ± 0.01
Gd1.9 ± 0.11.4 ± 0.12.1 ± 0.20.20 ± 0.020.14 ± 0.010.35 ± 0.03
Tb2.6 ± 0.21.9 ± 0.22.27 ± 0.02<LOD0.14 ± 0.01<LOD
Dy1.4 ± 0.11.1 ± 0.11.2 ± 0.10.16 ± 0.010.12 ± 0.010.20 ± 0.02
Ho3.2 ± 0.22.4 ± 0.12.26 ± 0.020.10 ± 0.020.22 ± 0.020.05 ± 0.01
Er0.72 ± 0.060.73 ± 0.060.68 ± 0.040.12 ± 0.020.06 ± 0.010.10 ± 0.01
Tm4.7 ± 0.23.1 ± 0.20.16 ± 0.032.5 ± 0.22.7 ± 0.20.69 ± 0.04
Yb0.46 ± 0.030.54 ± 0.030.65 ± 0.040.06 ± 0.020.04 ± 0.010.15 ± 0.01
Lu˂LOD˂LOD0.10 ± 0.01<LOD0.06 ± 0.010.02 ± 0.01
Hf0.82 ± 0.071.1 ± 0.10.60 ± 0.030.16 ± 0.020.14 ± 0.020.09 ± 0.02
Ta0.26 ± 0.020.42 ± 0.030.14 ± 0.01<LOD0.06 ± 0.010.015 ± 0.001
W<LOD13.6 ± 0.55.0 ± 0.2<LOD10.0 ± 0.55.5 ± 0.2
Au<LOD0.14 ± 0.020.11 ± 0.01<LOD<LOD<LOD
Hg (16/16–25) *<LOD<LOD<LOD<LOD<LOD<LOD
Tl<LOD0.16 ± 0.020.24 ± 0.02<LOD<LOD0.08 ± 0.01
Pb (800/750–1200) *42 ± 343 ± 232 ± 110.5 ± 0.911 ± 19.6 ± 0.4
Bi1.2 ± 0.11.5 ± 0.11.8 ± 0.13.5 ± 0.32.7 ± 0.22.2 ± 0.1
Th5.6 ± 0.56.4 ± 0.53.1 ± 0.20.84 ± 0.070.94 ± 0.080.47 ± 0.02
U7.6 ± 0.78.0 ± 0.69.5 ± 0.41.8 ± 0.21.5 ± 0.11.4 ± 0.1
* Maximum permitted concentrations according to [9], resp. [10].
Disclaimer/Publisher’s Note: The statements, opinions and data contained in all publications are solely those of the individual author(s) and contributor(s) and not of MDPI and/or the editor(s). MDPI and/or the editor(s) disclaim responsibility for any injury to people or property resulting from any ideas, methods, instructions or products referred to in the content.

