Article

Analysis via 3D FEM of the Passing Capacity of Pipeline Inspection Gauges in Bends with Different Curvatures

1
School of Mechanical Engineering and Rail Transit, Changzhou University, Changzhou 213164, China
2
Jiangsu Key Laboratory of Green Process Equipment, Changzhou 213164, China
3
School of Safety Science and Engineering, Changzhou University, Changzhou 213164, China
4
Jiangsu Special Equipment Safety Supervision and Inspection Institute Yancheng Branch, Yancheng 224002, China
*
Author to whom correspondence should be addressed.
Processes 2023, 11(12), 3288; https://doi.org/10.3390/pr11123288
Submission received: 20 October 2023 / Revised: 31 October 2023 / Accepted: 8 November 2023 / Published: 24 November 2023
(This article belongs to the Special Issue New Research on Oil and Gas Equipment and Technology)

Abstract

:
Pipeline inspection gauges easily become wedged in offshore and onshore small-diameter pipelines (where the outer diameter, D, of the pipe is less than 150 mm), particularly at the bends. To reveal the relationship between PIG capacity and bend curvature radius, a quantitative study on the passing capacity of PIG was conducted in this paper from three key perspectives of performance: safe application, sealing, and driving. The results demonstrate that the pipeline inspection gauge exhibits better passing capacity as the curvature radius of the bend increases. To improve the poorest passing capacity, in the case of R = 3D, different numbers of grooves are opened in the cup. The results demonstrate that the cup with 24 square grooves has a substantial impact on optimizing the passing capacity of the pipeline inspection gauge. This enhancement results in improvements in safe application performance (40.8%), sealing performance (12.22%), and driving performance (17%). This research aims to expand our understanding of blockages in small-diameter pipelines and provide a basis for optimizing the structure of the pipeline inspection gauge for small-diameter pipelines.

Graphical Abstract

1. Introduction

Small-diameter pipelines (where the diameter of the pipe is less than 150 mm) are widely used in oil field stations and refineries, typically using bends with a curvature radius of 3D to 5D [1,2,3,4,5]. Due to the complex pipeline-laying conditions in the ocean and the presence of corrosive media, many pipelines face corrosion failure and the risk of major safety accidents [6,7,8]. A magnetic flux leakage (MFL) inspection is the most widely used nondestructive testing method for pipeline health detection [9,10,11]. The MFL inner detector, used in an MFL inspection, is also called the pipeline inspection gauge (PIG). The operation of the PIG is driven by the pressure difference between the head and tail of the PIG [12], which is created by interference between the polyurethane cup and the pipe wall, forming a seal [13,14,15]. However, due to the small radius of curvature in the bends of small-diameter pipelines and the complex working conditions, the PIG may have poor passing capacity for moving through these pipelines. This can lead to fluctuations during operation, which, in turn, cause incomplete data collection and reduced detection accuracy [16]. In addition, the poor passing capacity may cause PIG blockages in the pipeline [17,18,19,20,21], leading to a pipeline outage and severe economic losses.
Recently, there have been many studies examining the passing capacity of the PIG, aiming to solve the problem of PIG blockage. Some studies have focused on predicting the PIG’s driving force and pressure difference. Soorgee [22] studied the relationship between the essential differential pressure of the ball PIG and the four factors of the pipe’s internal diameter, the ball PIG oversize ratio to the pipe’s internal diameter, the ball PIG thickness ratio, and ball PIG material hardness. The results can be used to predict the essential differential pressure required by the ball PIG for pigging. A similar finding was reported by Naeini and Soorgee [23], who established an experimental device to study the driving pressure of spherical PIG movement under different material hardness values and levels of interference. The results indicate that the model can predict the differential pressure of the pigging operation well when considering the correlation between the friction coefficient and the pressure. However, their research focused on a spherical PIG, which cannot predict the driving differential pressure of the cup-shaped PIG. To correctly predict the driving force of the cup PIG, Cao et al. [24,25] proposed a driving force prediction method for the cup PIG and bi-directional PIG, based on a multi-parameter angle, and established the corresponding driving force prediction model. Still, the driving force prediction model that they present is based on straight pipes, and the motion of the cup PIG in bends is not mentioned.
The passing capacity of the PIG is related not only to the driving force of the PIG but also to the friction force of the PIG. Hence, some scholars have also conducted relevant research on the friction of the PIG. Zhu et al. [26,27] used a two-dimensional nonlinear model, studying the frictional resistance and contact force between a straight pipe and a bi-directional PIG. Their research accurately describes the friction force between a straight pipe and the PIG, but it still has some limitations because the blockage of PIGs more often occurs in the bend in practical engineering situations. Their research does not consider the contact forces and friction forces during the PIG’s movement through the bend in their 2D model. Hendrix et al. [28,29] created static and dynamic experimental devices to explore the friction behavior of the PIG sealing disc, to investigate the friction force acting on the PIG. Zhang et al. [30] analyzed the blocking problems that can occur as the PIG moves through a circumferential weld and investigated the friction and dynamic characteristics of the PIG during this process. Nevertheless, their research could not provide a satisfactory explanation for the problem of PIG blockage in the bend sections of pipelines either.
Scholars have found that although the contact between a PIG and a pipe is highly nonlinear, it also exhibits some regularity. Therefore, to further reveal the relationship between blocking problems and the contact performance of PIGs, many scholars have investigated the contact behavior of PIGs. Wang et al. [31] utilized an ultrasonic method to predict and evaluate the contact stress at the rubber contact interface and verified the effectiveness of this method in predicting contact stress in practical engineering applications. However, this method of predicting and evaluating contact stress is not suitable for use with cups in the PIG. Chen Z et al. [32] used a 3D laser scanner to measure the deformation of the cup and developed a new finite element model to study the relationship between interference and the deformation of the cup. However, the scenarios they studied assumed that the edge of the cup was not close to the pipe, which would lead to limited practical implications for guiding engineering practice. Chen et al. [33] summarized the changing law in the equivalent force and the contact force of the PIG during changes of the cups. A theoretical basis for the design of the cup PIG can be established from their research. Zhang et al. [34] noted that a PIG is most likely to block while running in a recessed pipe. By changing the structural parameters of the cup, they compared the stress and strain of the cup in the straight pipe with those in the recessed section. However, the research results they obtained could not help to solve the blockage problem of the inner detector in the bend. Jiang et al. [35] analyzed the influence of cup interference, cup thickness, friction coefficient, driving pressure, and bend curvature radius on the sealing performance of the PIG and evaluated the sealing performance based on the contact stress of the cup. However, they did not further explore how to optimize the sealing performance of the PIG.
Previous studies have already provided a significant understanding and summary of the changing law of the passing capacity of the PIG. However, most of these previous studies have focused on PIG operation in high-diameter pipelines or the blockage of PIGs in pipeline defects such as girth welds and sunken deformations. As a result, there is still limited understanding of and research on PIG operation in small-diameter pipes, especially regarding bends. Small-diameter pipes have lower pressure and less power than long-distance pipelines (large-diameter pipes), which leads to blocking problems caused by the PIG passing through a small-diameter bend. The blocking problem remains a challenge and a pain point in the industry. To reveal the relationship between the curvature radius of the bend and the passing capacity of the PIG, a three-dimensional nonlinear finite element model was created to study the passing capacity of PIGs in bends with different radii of curvature. Moreover, we tested how grooves cut into the cup could optimize the passing capacity of the PIG. The research results will provide a theoretical basis for the optimization of the structure and operating conditions of PIGs, as will be discussed in subsequent sections.

2. Simulation Strategy

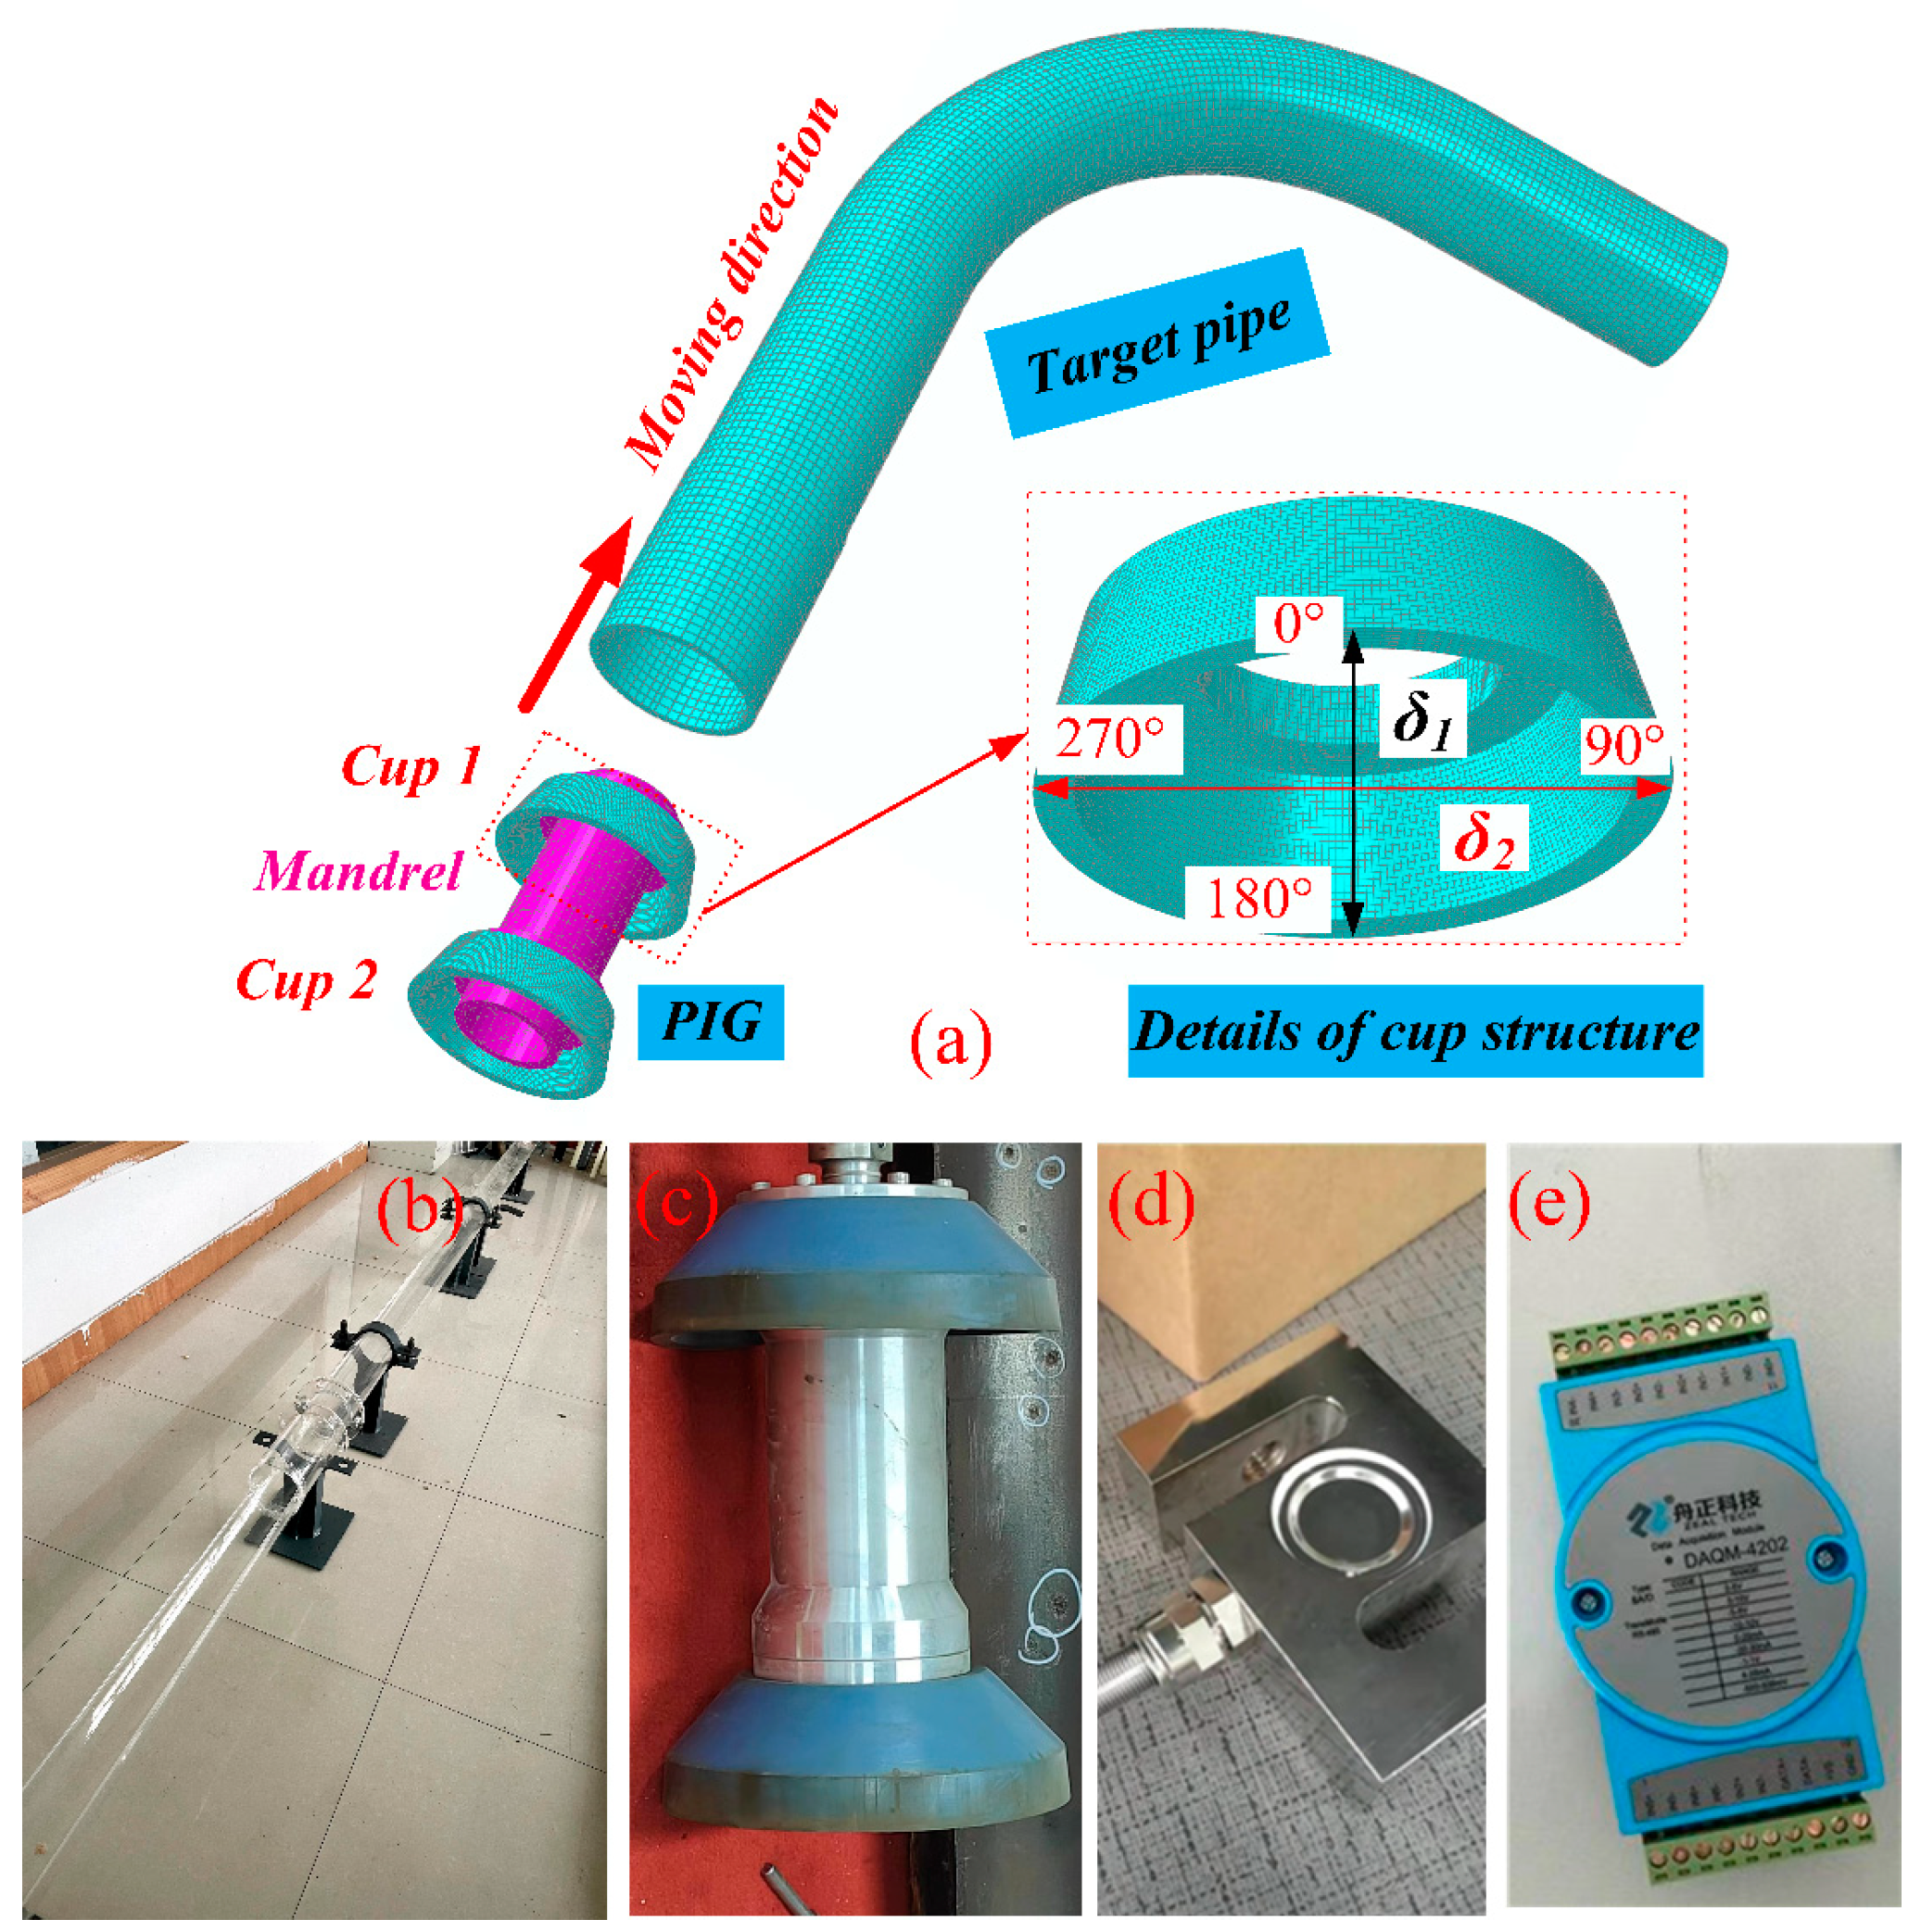
2.1. FEM of the PIG in the Bend

The FE model of the PIG and pipeline applied in this paper is shown in Figure 1. The pipe size is φ105 × 5 mm, and the inlet section distance is 332 mm. The curvature radius of the bends includes 3D, 4D, and 5D (D represents the outer diameter of the pipe). The distance of the outlet section is 200 mm.
As shown in Figure 1a, the FE model of the PIG mainly includes one mandrel, two cups, and four flanges. The main parameters of the PIG can be seen in Table 1. The material of the mandrel is basically the same as that of the pipe, that is, 20# steel. The standard material of the flange is 304 stainless steel. The cup is usually made of polyurethane rubber, which can withstand large deformations. However, the characteristics of non-linearity, geometric non-linearity, and contact non-linearity material could be represented by the cup, due to the complex composition of rubber.
Zheng et al. [36] created a 3D finite element model using a two-parameter Mooney–Rivlin model to simulate the sealing performance of rubber vibration isolators. The numerical results are consistent with the experimental results. This model can better describe the mechanical behavior of polyurethane rubber (Equation (1)). The hardness of the cup used in this study and the parameters C10 and C01 in the Mooney–Rivlin model are shown in Table 1, respectively.
W = C 10 ( I 1 3 ) + C 01 ( I 2 3 )
here, W represents the strain energy density function, C10 and C01 are the Rivlin coefficients, and I1 and I2 are the Green invariants.

2.2. Grid Independence and Boundary Conditions

The FE models of the cup and pipe are divided using the sweeping technique, while the models of the mandrel and flange are divided using the free mesh method. The grid types are shown in Table 1. The contact between the cup and the pipe wall keeps the PIG operating in the pipe. Therefore, the influence of the mesh precision of the cup cannot be ignored. The mesh accuracy of the cups was verified as follows. As shown in Table 2, for better efficiency of the calculation and precision of the calculation, the 1 mm grid for the cup was chosen for the calculation. The grid size of the pipeline and mandrel were 6mm and 8mm, respectively, indicating that both exerted little influence on the calculation results.
Pressure was applied at 0.1 MPa at the tail end of the PIG to simulate the fluid driving effect during the actual working process. The inner wall of the pipe, with high levels of stiffness and roughness, was designated the master surface, and the outer wall of the cups, with low stiffness and smoothness, was designated the slave surface. To accurately describe the contact behavior, the contact between the pipe and the cup was determined using the contact pair algorithm. The contact discretization method was used as surface-to-surface. The normal behavior of the contact was described as “hard contact,” and the tangential behavior was defined as the penalty function. The friction coefficient was 0.3. The passing capacity of the PIG in bends with different curvatures and radii was simulated by using the Abaqus/Standard module, which applied the Newmark-β method used in the dynamic simulation. The acceleration and velocity of the structure were treated as constants within each time step and integrated within that time step, and the velocity and displacement were calculated for the next time step. First, the acceleration of the system was expressed as a function of velocity and displacement. As Equation (2) shows, according to Newton’s second law, it can be established that:
m u ¨ ( t ) + c u ˙ ( t ) + k u ( t ) = F ( t )
Next, as Equation (3) shows, the acceleration can be expressed as a function of velocity and displacement:
u ¨ ( t ) = F ( t ) c u ˙ ( t ) k u ( t ) m
where m represents the mass of the system; u, c, and F are the displacement, stiffness coefficient, and external force, respectively.
In the Newmark-β method, it is assumed that acceleration and velocity are constant at each time step. Therefore, Equations (2) and (3) can be integrated to obtain:
u i + 1 = u i + Δ t v i + Δ t 2 2 [ ( 1 2 β ) F i m + 2 β F i + 1 m + ( 1 γ ) c m u ˙ i + γ c m u ˙ i + ( 1 α ) k m u i + α k m u i + 1 ]
v i + 1 = v i + Δ t [ ( 1 γ ) c m u ˙ i + γ c m u ˙ i + 1 + ( 1 α ) k m u i + α k m u i + 1 ]
where ui and vi, respectively, represent the displacement and velocity at the time steps; ui+1 vi+1 represents the displacement and velocity at time step i+1, respectively, and Δt is the time step; β, γ, and α are three constants, the values of which affect the accuracy and stability of the numerical solutions.
In practical calculations, the above equations can be iteratively solved by giving the initial conditions and using the external force function F(t) to obtain the displacement and velocity of the system at each time step.

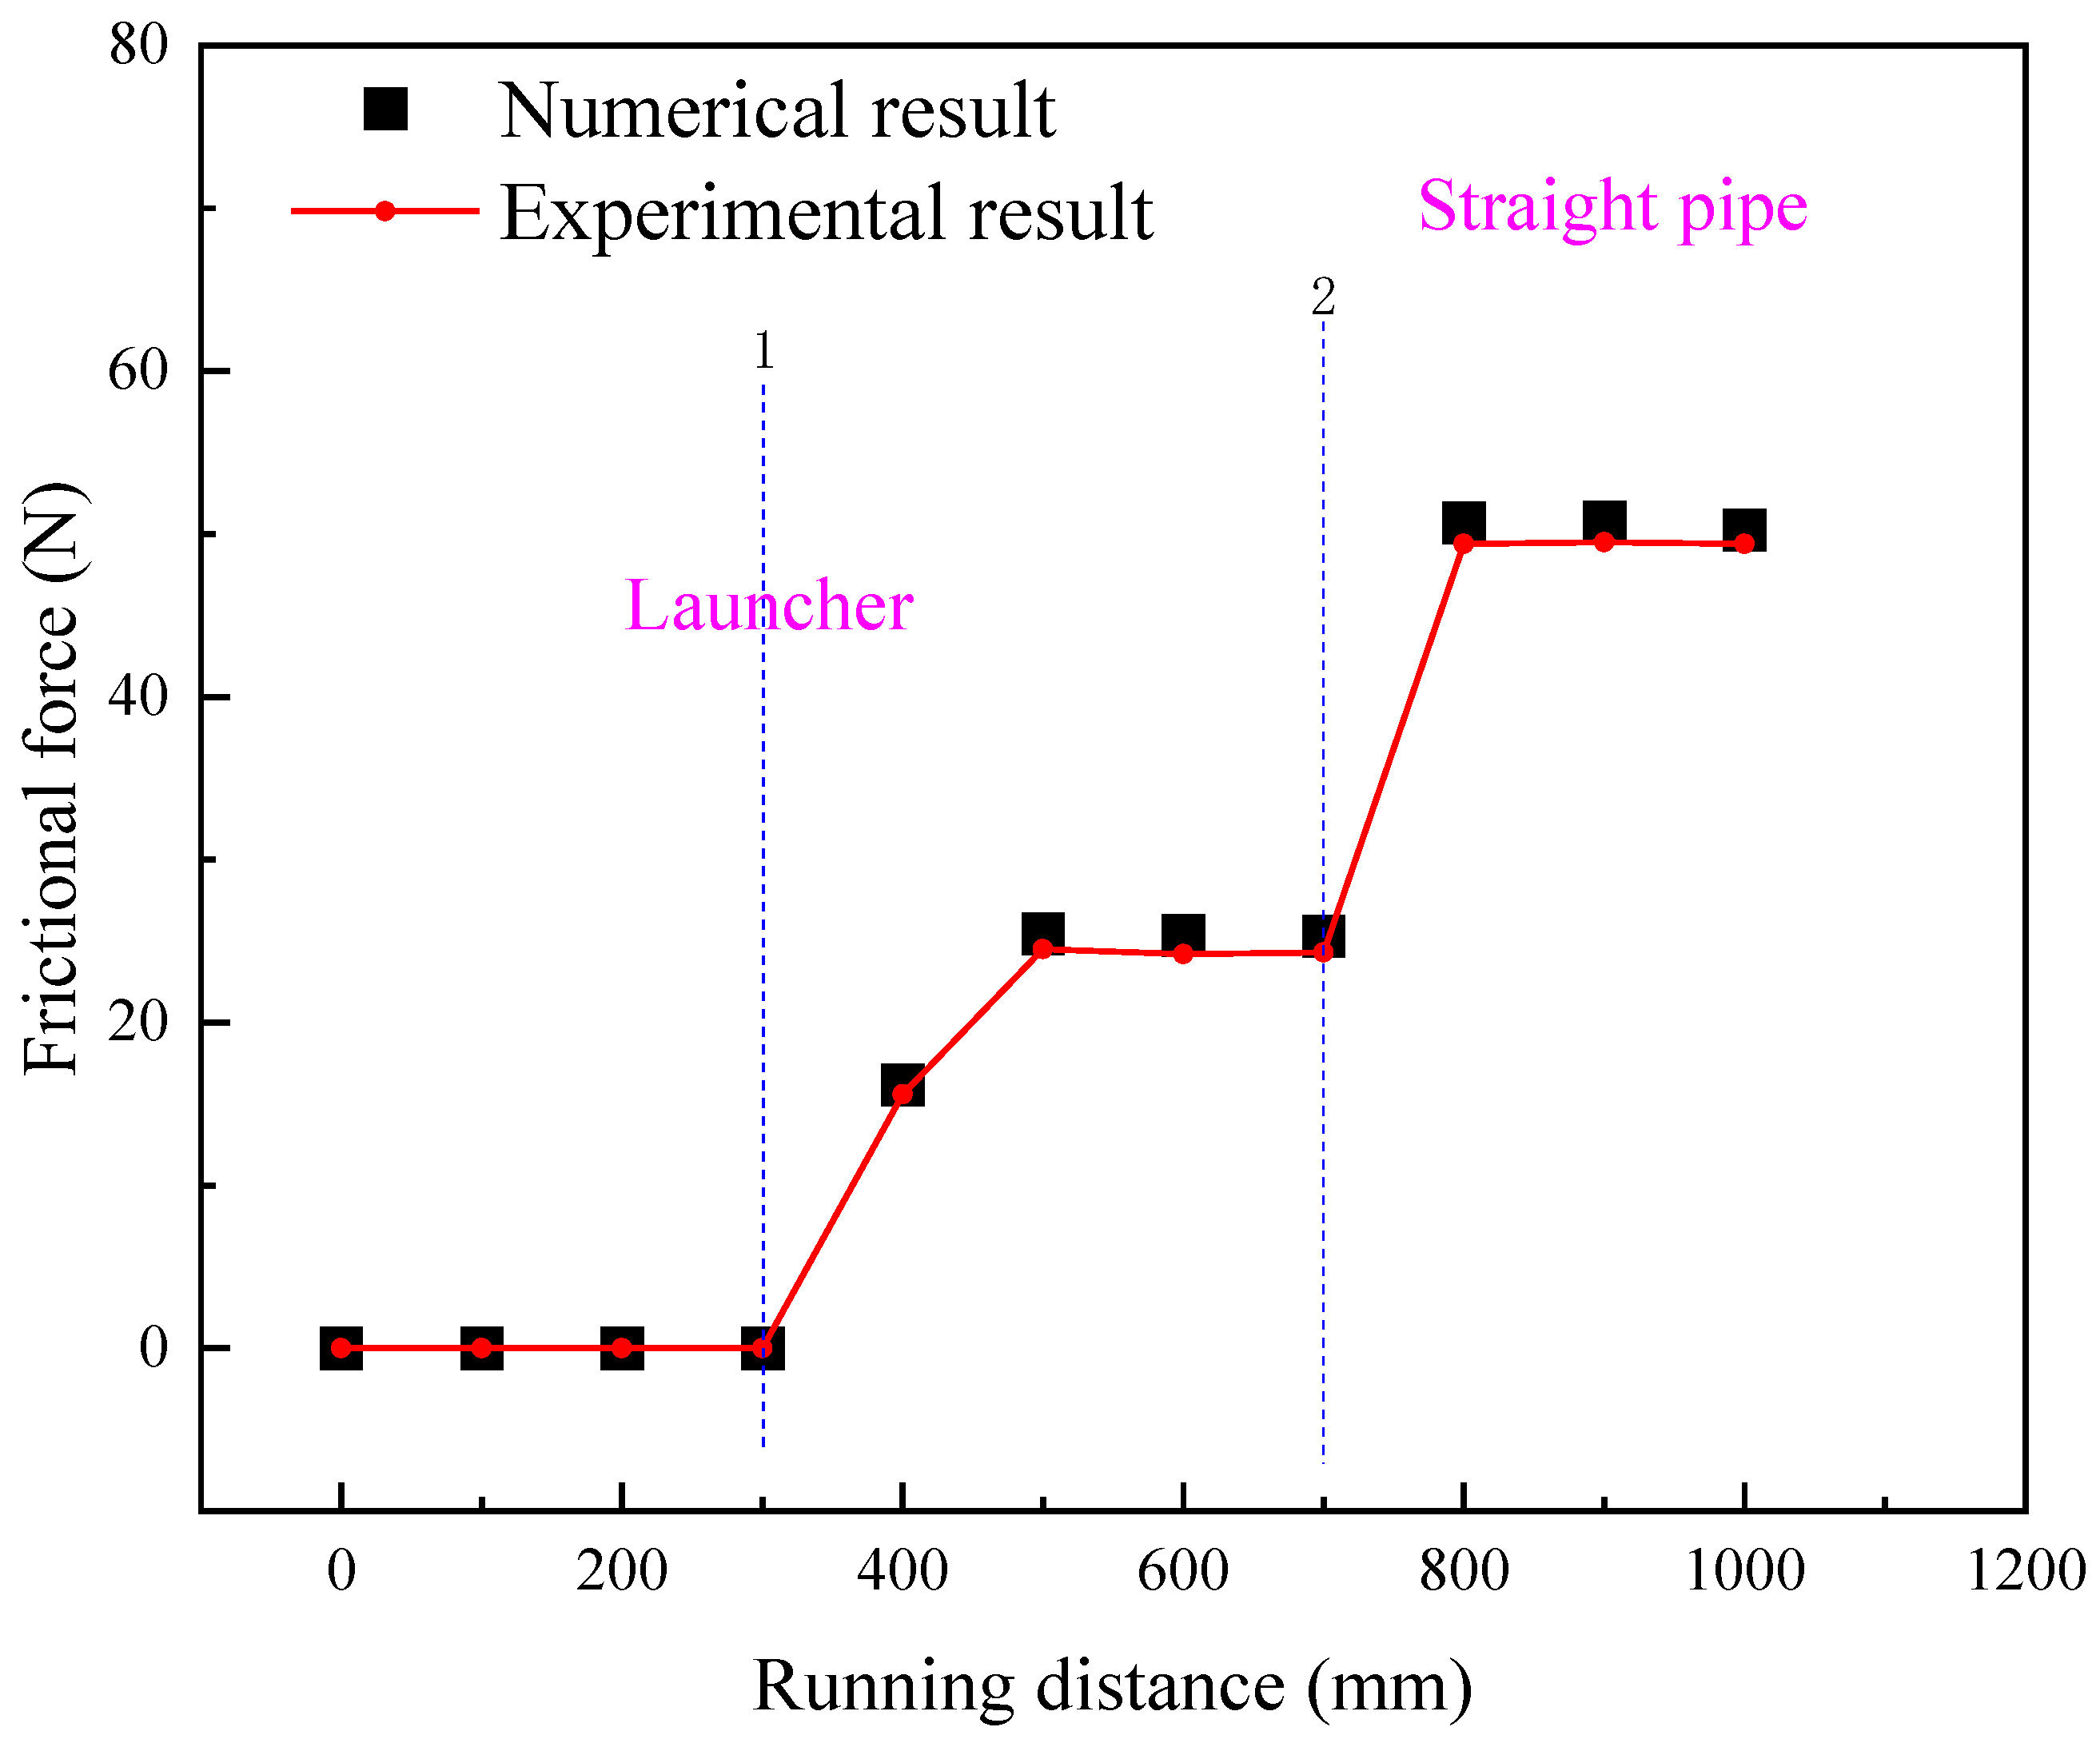
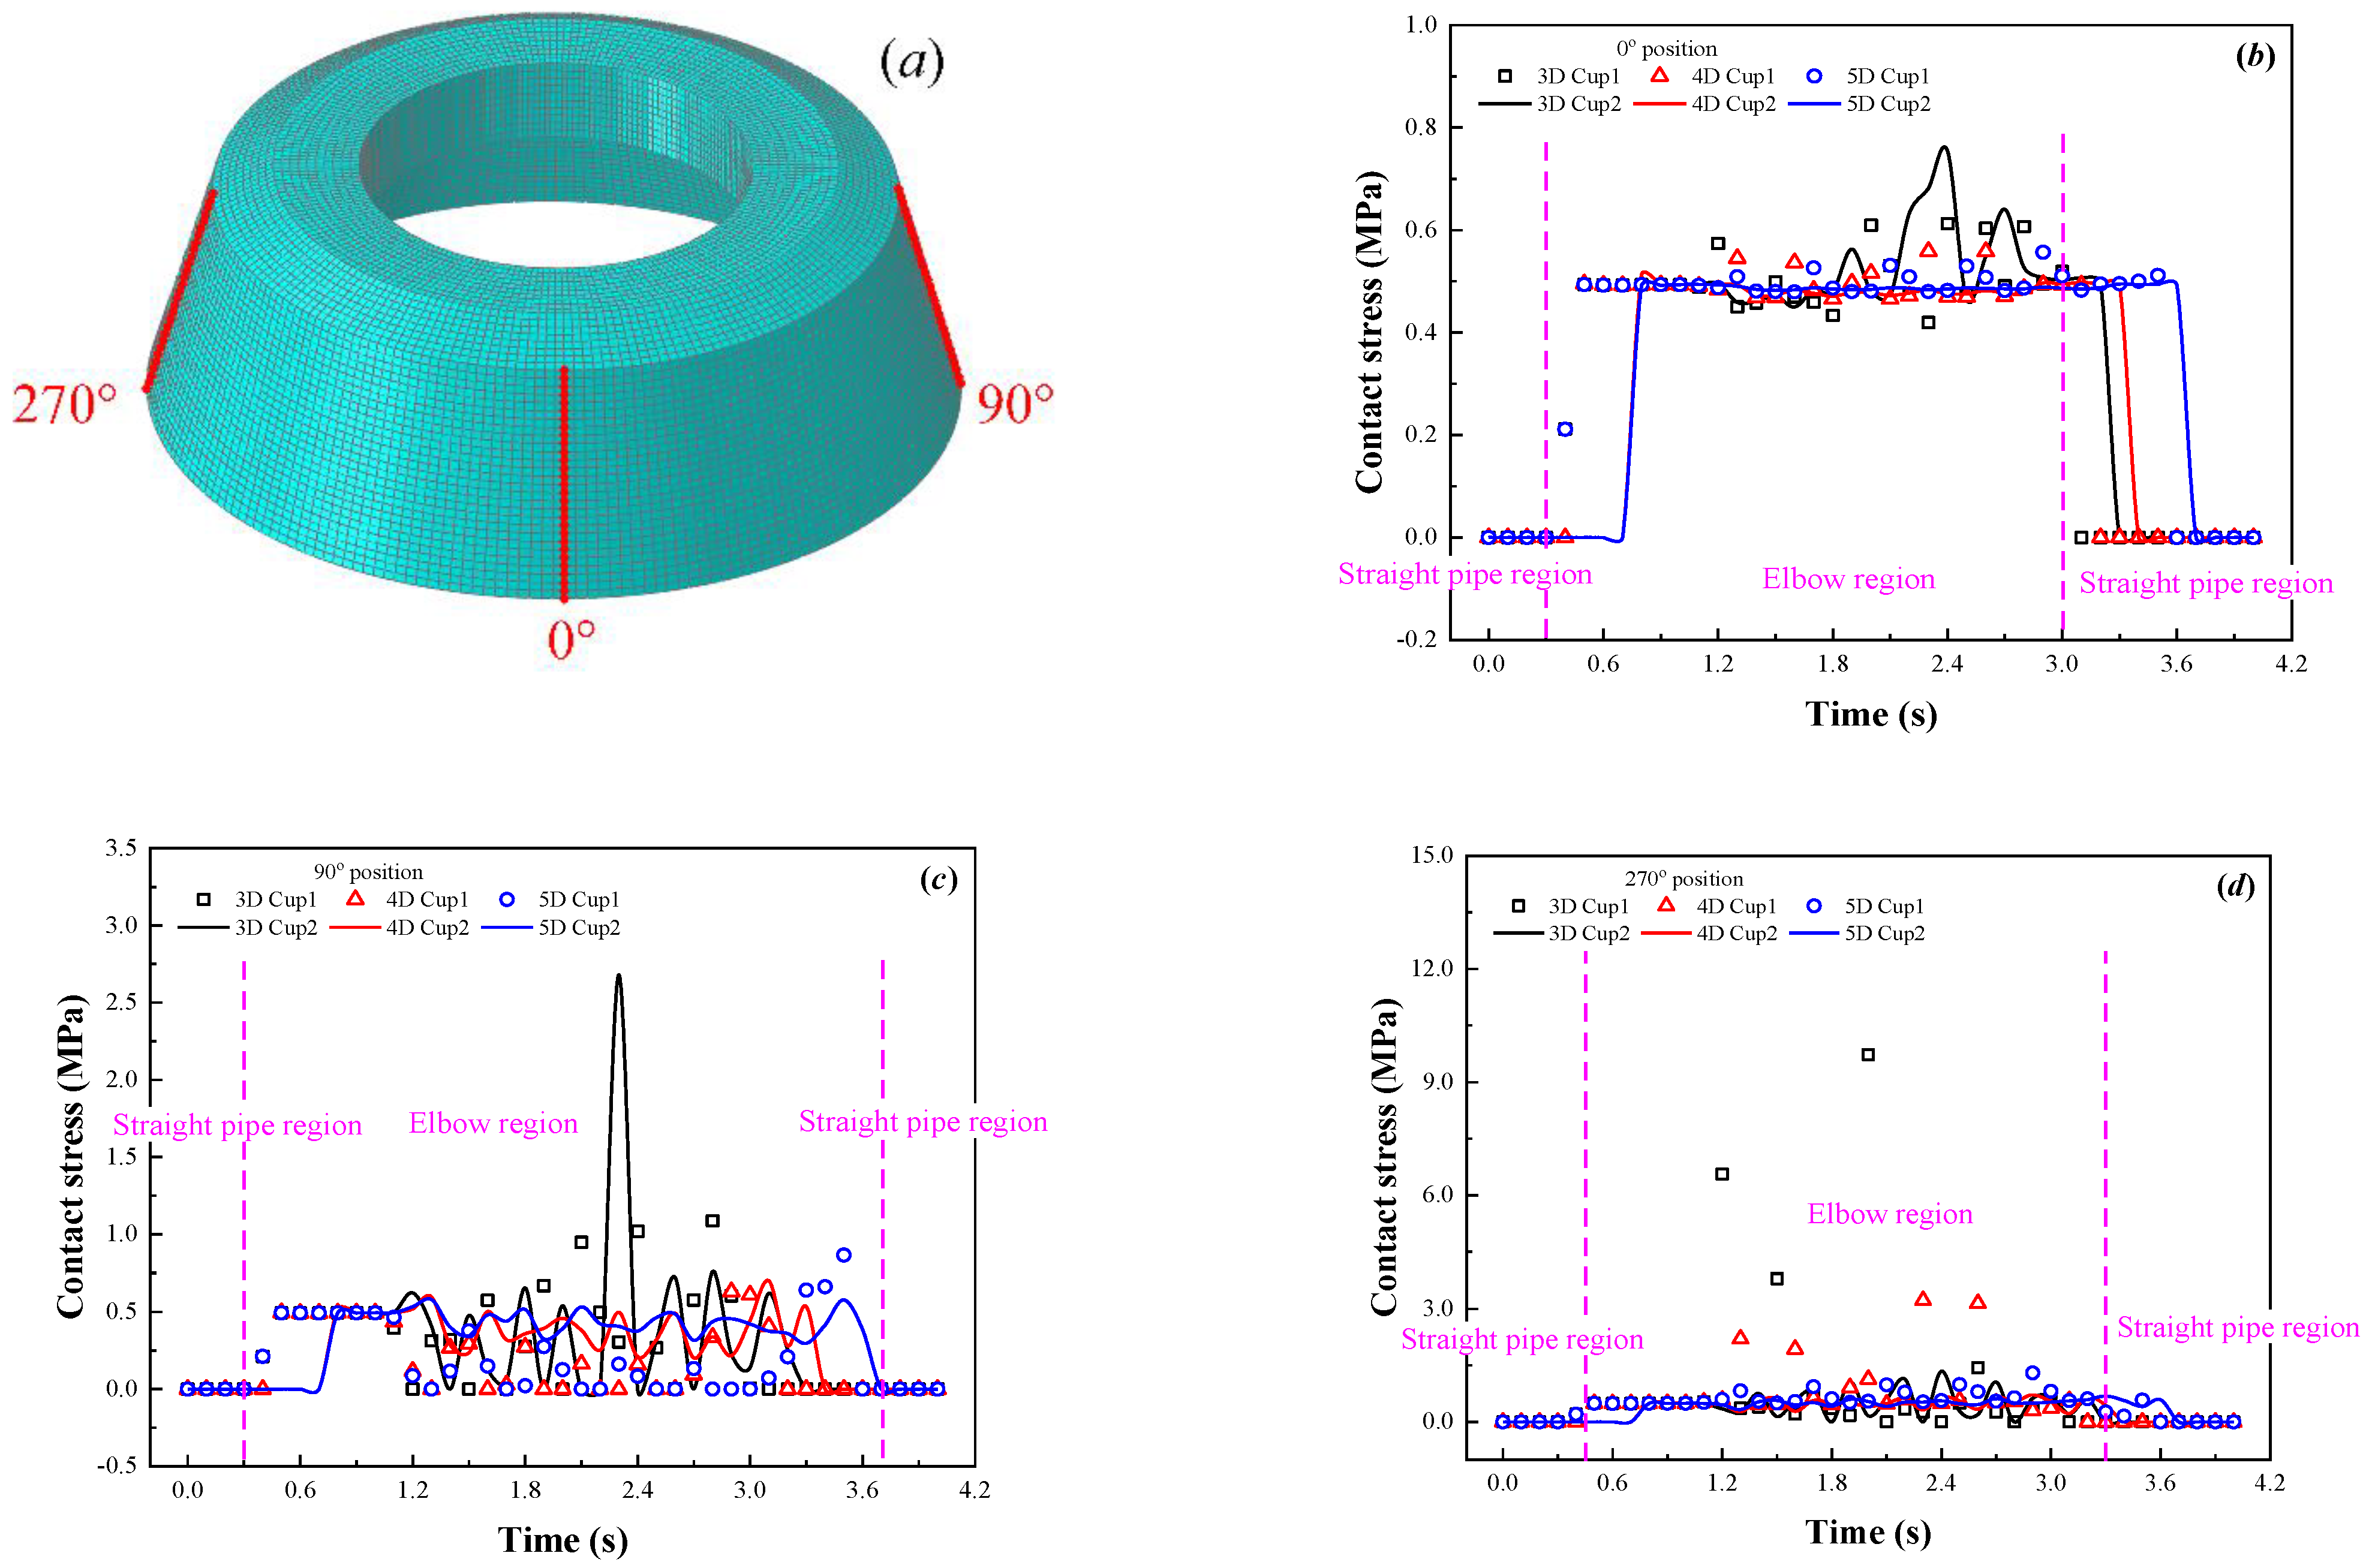
2.3. Verification of the 3D FE Model

The friction force on the PIG was obtained from the Abaqus post-processor, based on the established FE model. As shown in Figure 2, the calculation results proved that as the PIG enters the pipe, the friction force increases gradually and, when it enters the pipeline completely, the friction force is stable at about 50.55 N. The frictional force calculation result was verified by a pipeline traction experiment. The material parameters and the structure size of the device used in the experiment were identical to those used for the 3D FE model. As shown in Figure 1b–e, the launcher and the receiver were connected with the straight pipeline, which was fixed on the pipe rack. A surface roughness tester (model: TR-200, Time YuanFeng Technology Co., Ltd., China) was used to test the roughness of the experimental pipeline. A windlass (model: JM-0.5, JianKun Mechanical Equipment Co., Ltd., China) was set into the tail of the pipeline to provide the power needed for the experiment. An S-type tension sensor (model: DYLY-103, DaYang Sensing System Engineering Co., Ltd., China) was installed between the windlass and PIG to collect the voltage signal in the experiment. The signal converter was linked with the tension sensor and the computer, and the voltage signal was displayed by the computer.
After installing the experimental device, the windlass rotation frequency was set to ensure the smoothness of the traction speed. The windlass pulled the PIG to pass across the straight pipeline and was turned off when the PIG arrived at the receiver. The roughness of the pipe wall was measured to be 20 μm. In line with the report published by Zhu et al. [37], the effect of gravity on friction is not considered in this article. Therefore, the PIG can be balanced between the frictional force and the traction force during uniform motion.
As shown in Figure 2, the value for the experimental result (49.4 N) is smaller than the numerical result (50.55 N), which may be due to the smoother experimental pipe and lower friction coefficient. It can be seen that the relative error between them is 2.3%, which meets the accepted accuracy requirements. Therefore, this also proved that the 3D FEM is a reasonable choice for simulating the motion of the PIG.

3. Results and Discussion

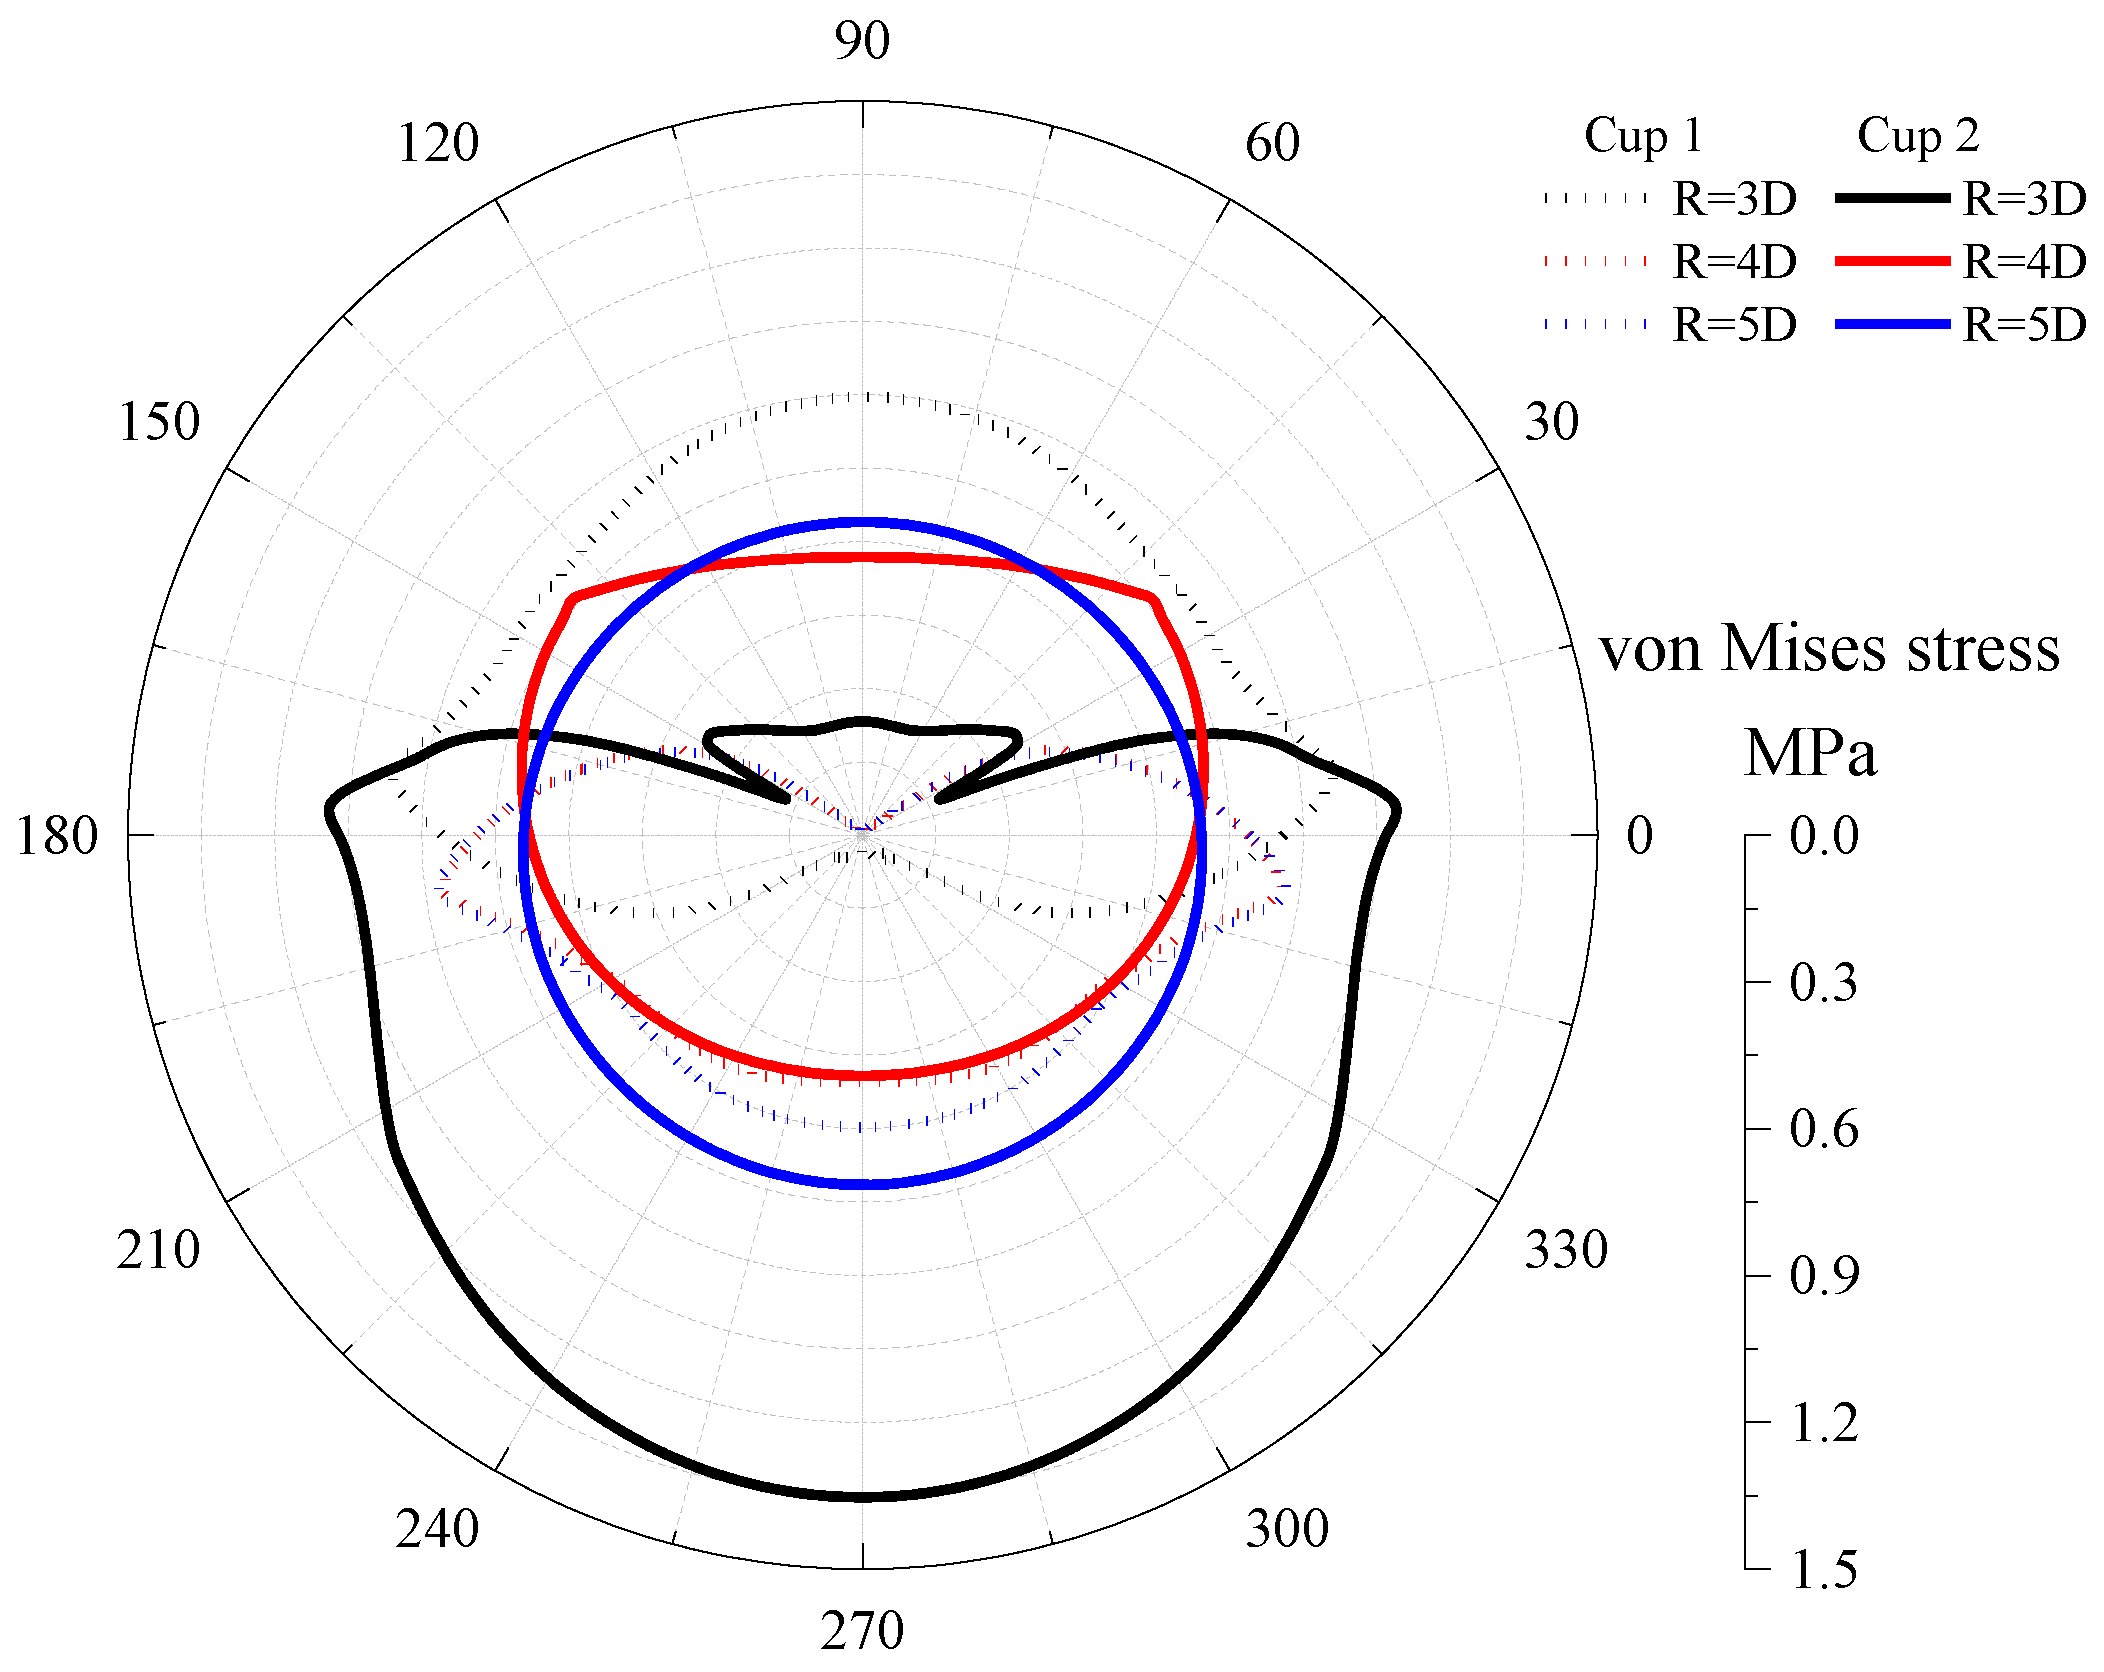
3.1. Analysis of the Safe Application Performance of the PIG

The force deformation of the PIG in the bend is different from that in the straight pipe. The cups are unevenly squeezed by the bend, resulting in a separate motion attitude of the PIG while it passes the bend. The process of the PIG moving through the bend is shown in Figure 3.
Along the circumference of the cup, the four nodes where the cup contacts the pipe are evenly distributed to explore whether the cup will fail due to excessive extrusion deformation when the PIG operates in the bend; these are positioned at 0°, 90°, 180°, and 270°, respectively. The distance in the cup between the two nodes is defined as δ1 (0° to 180°) and as δ2 (90° to 270°). Then, the degrees of δ1 and δ2 are used to characterize the deformation of the cup during the process of moving around the bend. The location and distribution of selected nodes in the cup are shown in Figure 1a.
The point line diagrams of the two selected groups of node spacings that change with time are shown in Figure 4. It can be concluded that the maximum change of δ1 and δ2 occurred in cup 2 at R = 3D. As the radius of curvature changed from 3D to 5D, the maximum change of δ2 decreased from 5.71 mm to 0.27 mm, a reduction of 95.3%; the decrease of δ1 was from 0.55 mm to 0.005 mm, a reduction of 99.1%. δ1 and δ2 kept changing during the whole process of maneuvering the PIG around the bend. The change in δ2 is larger than that in δ1. This is because the motion of the PIG changed as it moved through the bend and the contact point between the cups and the pipe wall changed accordingly. The positions at 90° and 270° of the cups are the locations of the main force deformation as the PIG moves through the bend, which finding is similar to the results obtained by Cao et al. [38].
It can be proved from the above research that the 90° position and 270° position of the cup are those experiencing the main force deformation while the PIG moves through the bend, and the turning force is provided by cup 2 as the PIG crosses the bend, leading to the deformation of cup 2 being more significant than that of cup 1. As shown in Figure 5, the maximum deformation occurs at t = 2.4 s and R = 3D (while the PIG was transported to approximately 60°), which could be considered the most dangerous location for the PIG. To compare and analyze the stress of the cup under three different curvature radii and to decide whether the cup will yield, the von Mises stress along the circumferential path at the bottom of each cup under three different curvatures of radii was calculated for the areas where the PIG maneuvers into the most dangerous position.
Once the cup yields under stress, the fluid can leak from the yielded position, causing different driving pressures between the front and tail of the PIG, where they are more minor, resulting in an extremely high risk of blockage for the PIG. Therefore, the maximum von Mises stress on the cup is defined to characterize the safe application performance of the PIG. As shown in Figure 5, with the curvature radius of the bend increasing from 3D to 5D, the maximum von Mises stress on cup 1 decreased from 0.98 MPa to 0.88 MPa, a reduction of 10.2%. The maximum von Mises stress of cup 2 was reduced from 1.35 MPa to 0.71 MPa. The safe application performance of the PIG can be improved by 47.4%, at most. As the cup is made from a super-elastic material, the yield strength can reach about 10 MPa. Therefore, when operating the PIG in the most dangerous position, the cup will not yet yield, which means that it can meet the conditions needed for safe application.

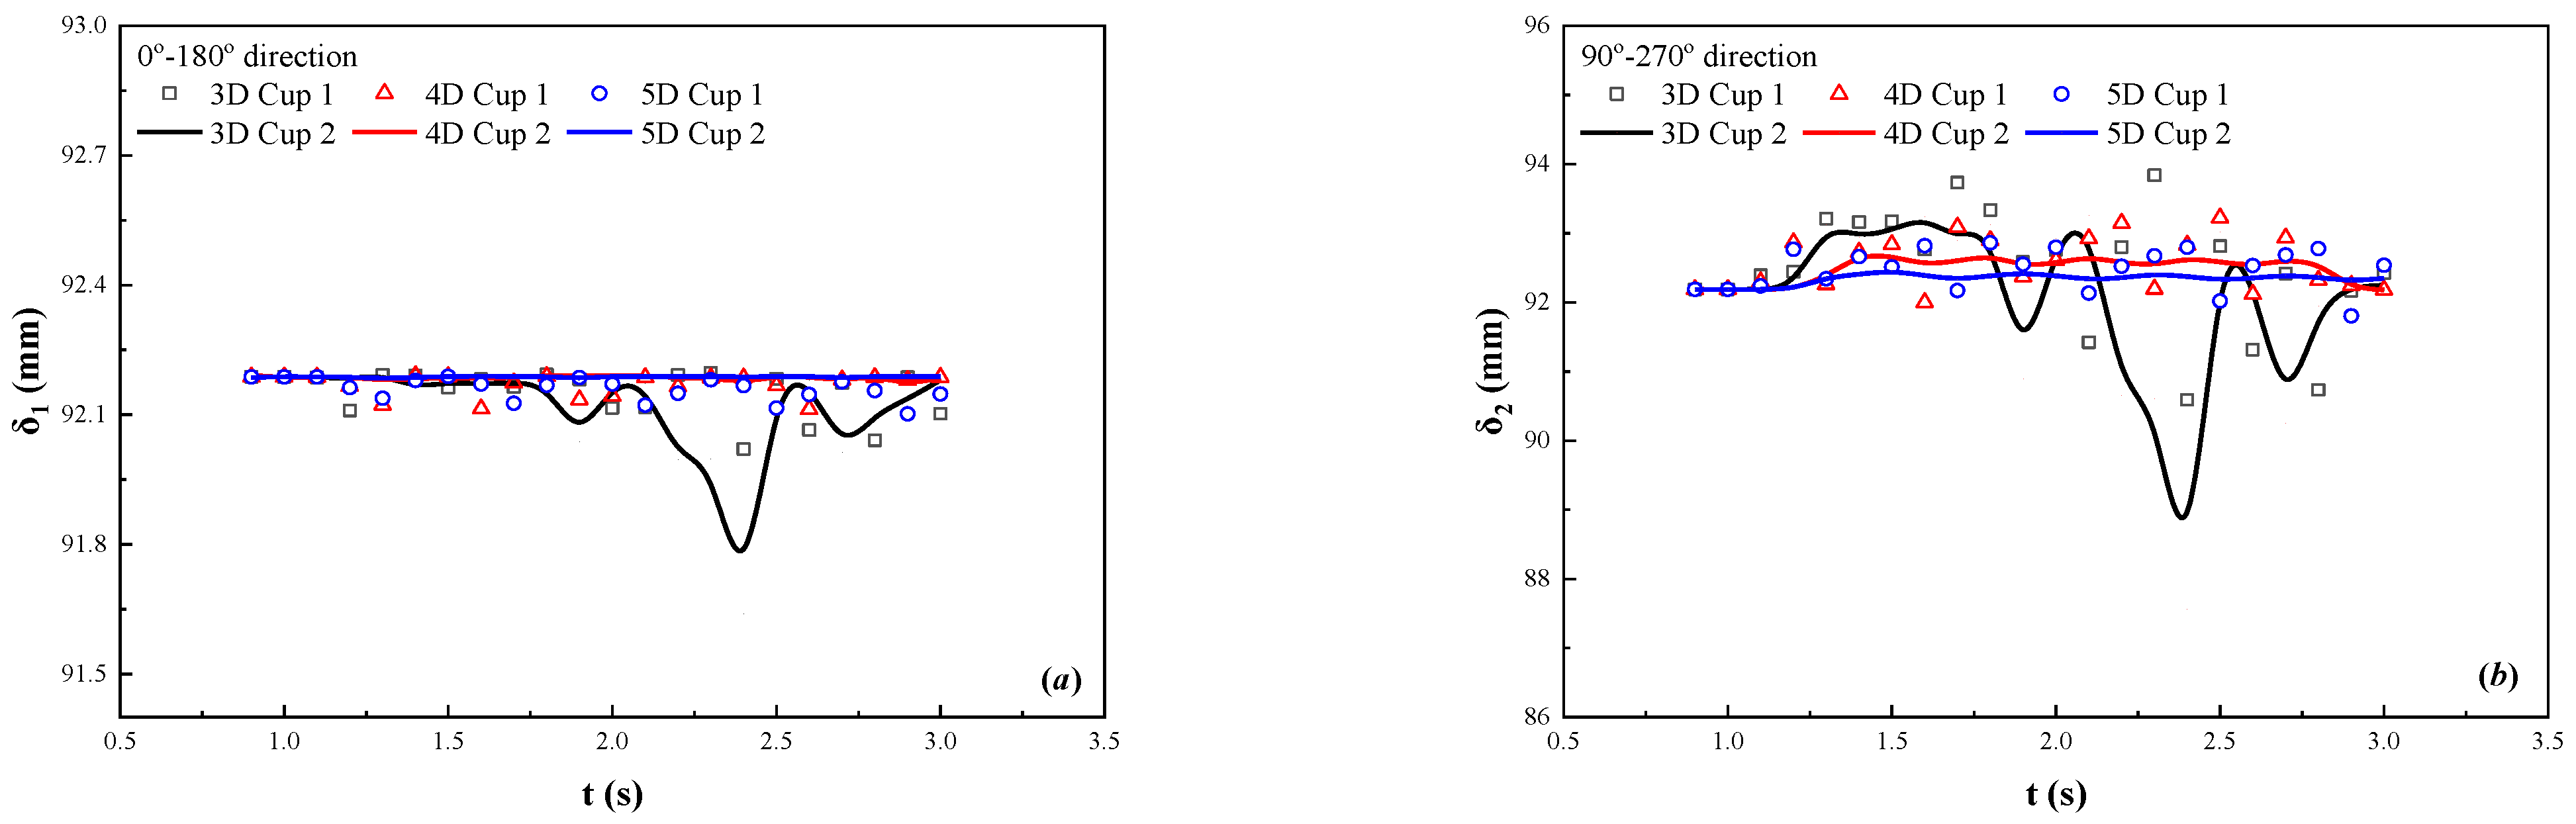
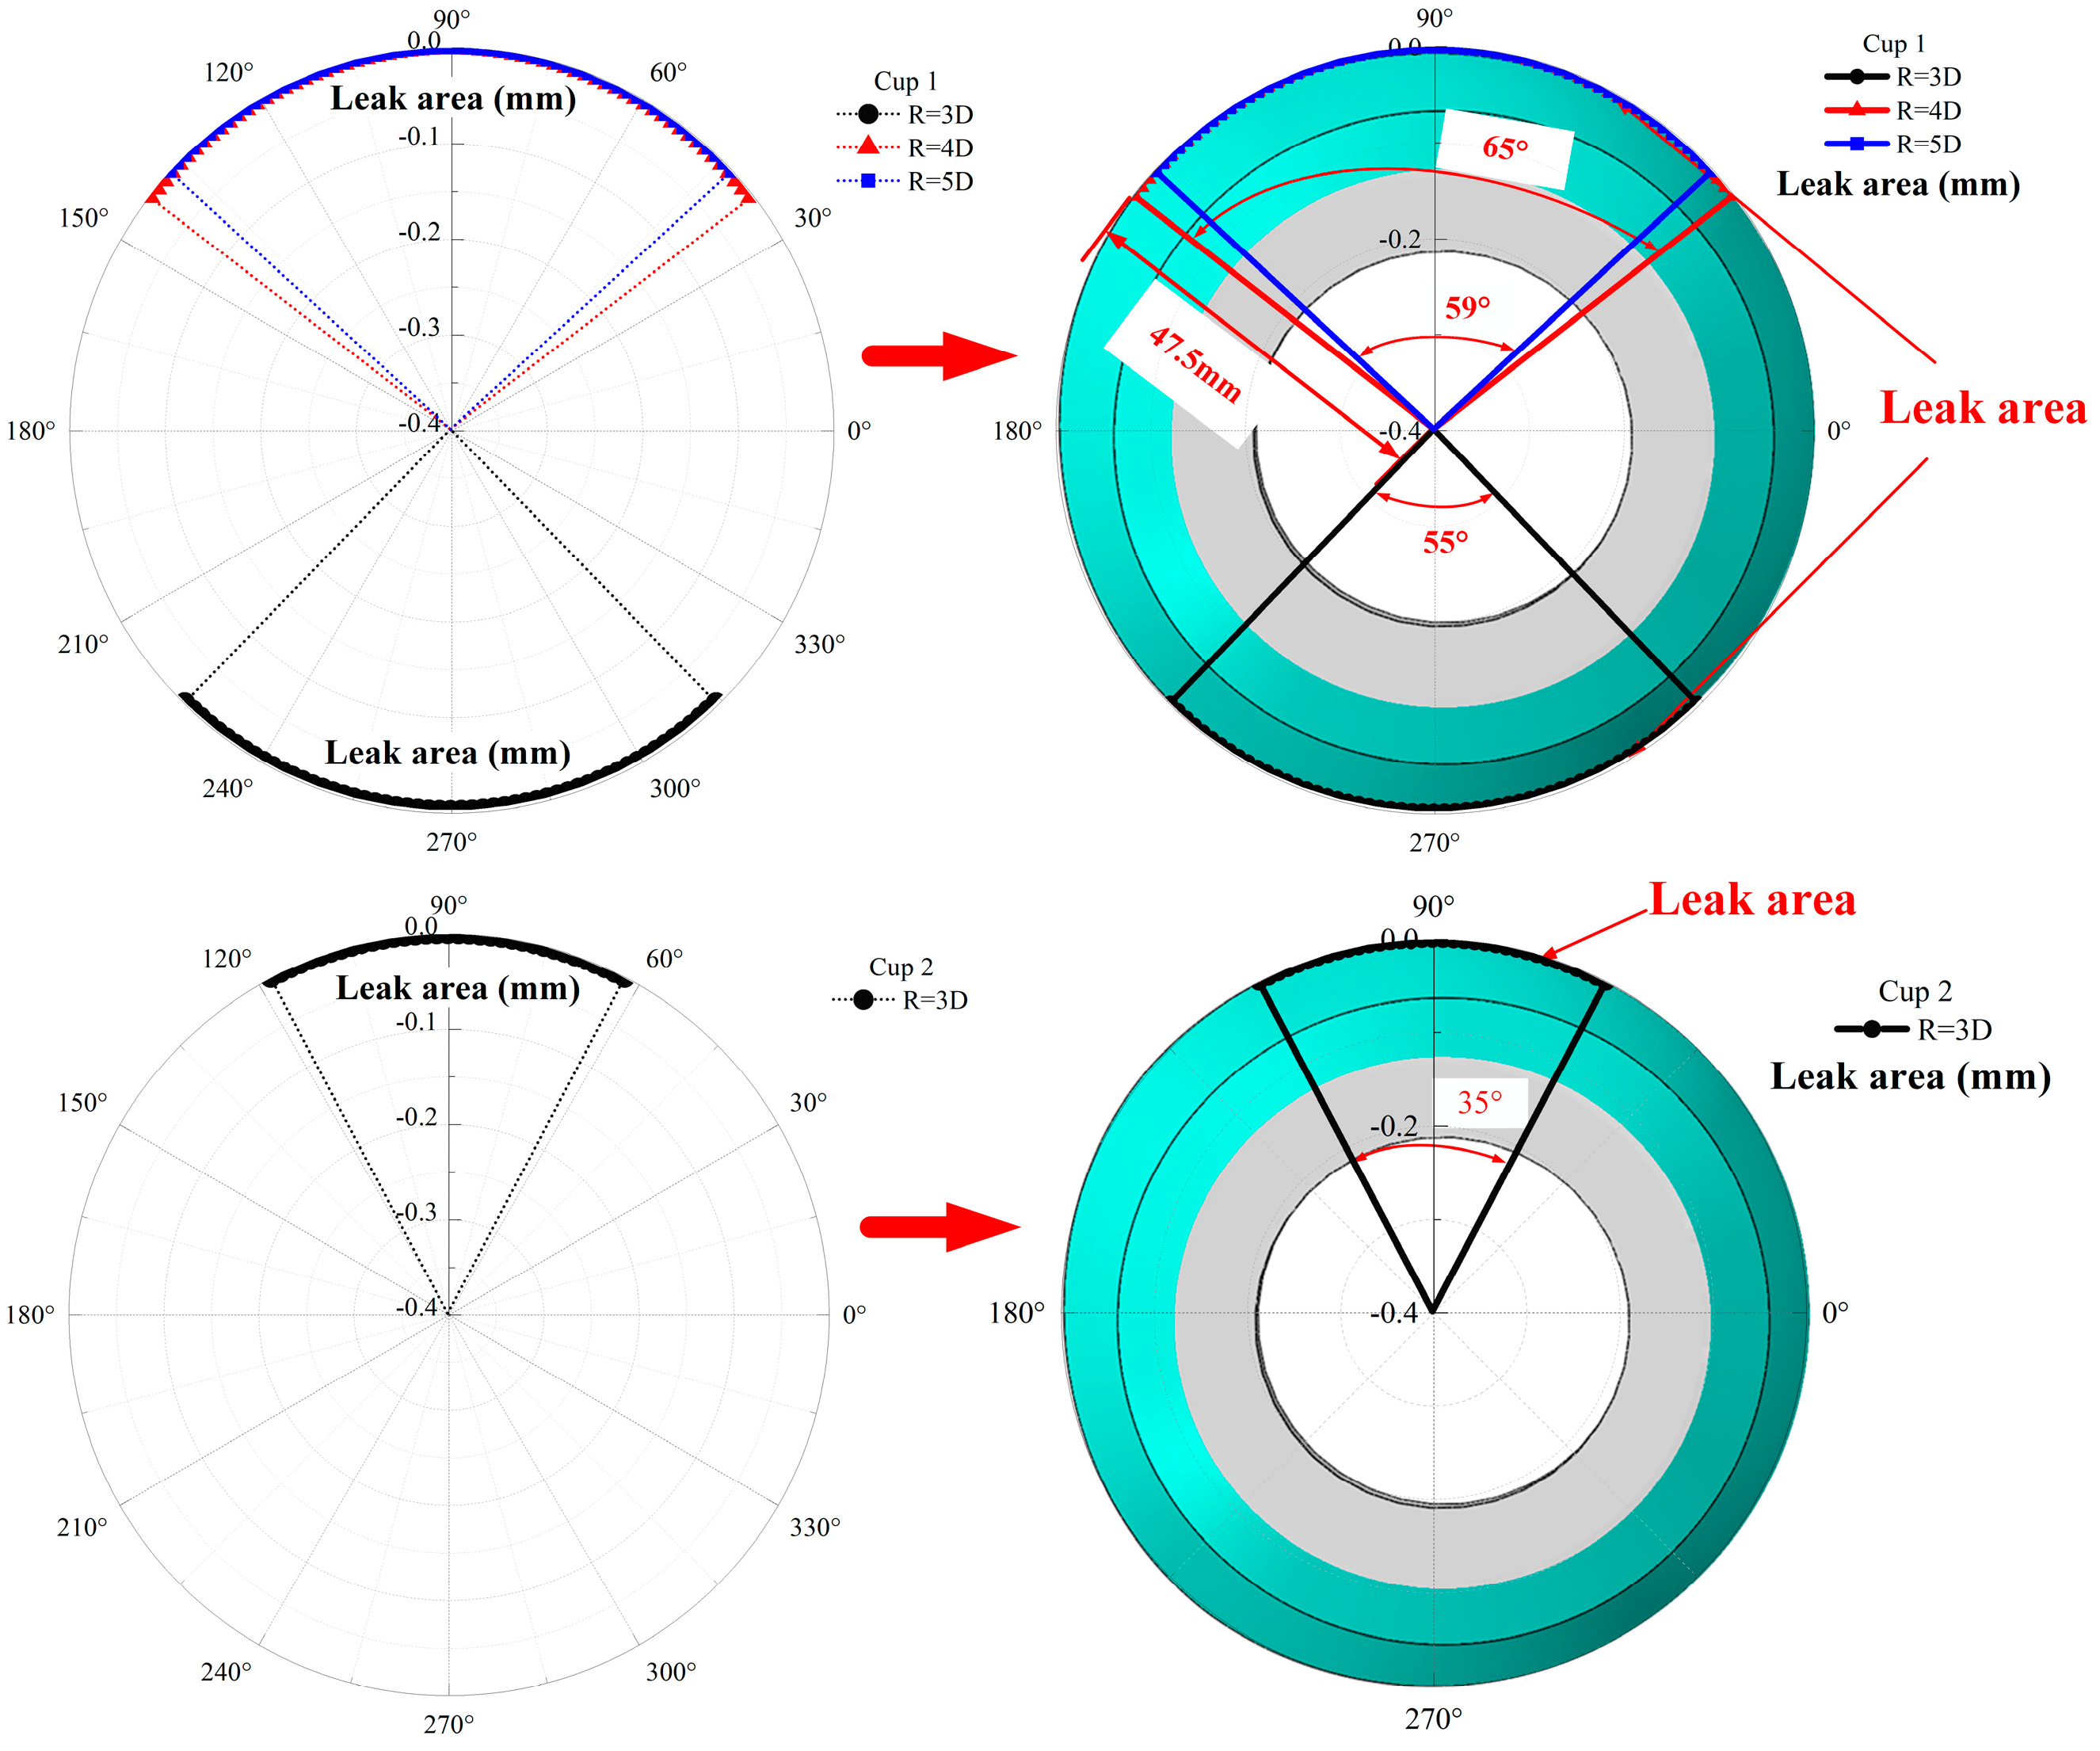
3.2. Sealing Performance of the PIG

It can be inferred from the analysis in Section 3.1 that during movement around the bend, the deformation along the cup at 0°–180° is the smallest and the leakage risk is the lowest, while, when the cup is significantly squeezed by the bend at 90°–270°, the deformation is the largest and the leakage risk is the highest.
As shown in Figure 6a, the size and distribution of the contact stress at the 0°, 90°, and 270° positions were studied, and the sealing performance of the PIG was characterized by the sum of the contact stress of all 29 nodes along its path. The changes in contact stress during the operation of the PIG are shown in the curves of Figure 6b–d. All cups were well-sealed at 0°, which verified the calculated contents inferred at the beginning of Section 3.2. However, since there were some points at 90° and 270° where the contact stress was 0, the contact stress of cup 1 was smaller within 2–3 s in the case of R = 3D. When R = 5D, the change in the contact stress of cup 1 and cup 2 was relatively stable compared to that when R = 4D.
The premise for ensuring sealing performance is that the sum of contact stresses of cup 1 and cup 2 is greater than 0. The only leakage position under the three curvature radii is R = 3D when the PIG moved to a 48° curve (t = 2.1 s), at which point the sum of the contact stresses of cup 1 and cup 2 are near to 0, and the sealing performance of the PIG cannot be guaranteed. Therefore, this location risks the most leakage. To further study the influence of the bend curvature radius on contact performance, the circumferential contact stress of each cup on the PIG was calculated for the point at which the PIG operated in the highest-risk position of leakage of the three curvature radii of the bend.
As shown in Figure 7, cup 2 was in good contact with the pipeline in the cases where R = 4D and 5D, and there was no point at which the contact stress was 0. While the contact was good, the sealing performance could be defined by the average contact stress of the cup. As the curvature radius of the bend increased from 4D to 5D, the average contact stress of cup 2 increased from 0.359 MPa to 0.412 MPa, and the sealing performance improved by 12.86%. These results suggest that the sealing performance of the PIG was better when operating in the higher curvature radius area of the bend.
The point where the contact stress is 0 is defined as the leakage point, and the leakage area is defined as the arc length of the circumference corresponding to the angle enclosed by the leakage point. As shown in Figure 8, with the increase in the curvature radius from 3D to 5D, the leakage area was 74.62 mm, 53.9 mm, and 49.0 mm, respectively, decreasing by 34.3%. The reason for this is that when the radius of curvature of the bend became higher, the PIG could move through the bend more evenly, the deformation of the cup would be smaller, and the possibility of leakage would be reduced further. While there was a leakage point on the cup, the sealing performance of the PIG could be characterized by the leakage area ratio. The leakage area ratio is defined as the circumference component corresponding to the leakage point, that is, the ratio of the leakage area to the contact area. As the radius of the bend curvature increased from 3D to 5D, the leakage area ratio was 25%, 18.1%, and 16.4%, respectively, and the sealing performance of the PIG improved by 8.6%.
In conclusion, the PIG exhibited superior sealing performance and a lower risk of blockage as it moved through a bend with a higher curvature radius.

3.3. Driving Performance of the PIG

The operation of the PIG was first sealed by an interference fit positioned between the cup on the PIG and the pipe wall, further generating a difference of fluid pressure between the head and tail of the PIG, driving the movement of the PIG [39]. Gravity was not considered in this paper. Hence, as shown in Equation (6), according to Newton’s second law, the motion of the PIG was affected by both the difference in fluid-driven pressure and the friction between the cup and the pipe wall:
Δ P · S F f = m a
where ΔP represents the difference in fluid pressure between the head and tail of the PIG, and S represents the sectional area of the pipe.
In order to explore the motion behavior of the PIG, the friction force on the PIG under three radii of curvature was counted, based on the FE model. As shown in Figure 9, the maximum friction force in the bend decreased from 158.8 N to 55.5 N when the radius of curvature increased from 3D to 5D, decreasing by about 65.1%. This is because when the radius of curvature becomes higher, the turning amplitude of the PIG will become more stable, and the contact area between the cup and the pipe wall will be more extensive. This will lead to a reduction in friction stress. Accordingly, the friction force will decrease.
The friction force of the PIG during the movement process through the bend was more significant than that in the straight pipe, which is similar to the result obtained by Kim et al. [40]. In addition, the friction force fluctuated as the PIG moved through the bend. This can be explained by the cup being made from a super-elastic material. While the PIG was moving through the bend, the cups were squeezed and deformed. The normal contact force between the PIG and the pipe wall increased, resulting in a higher friction force on the PIG. With the cup being deformed to a certain extent, it rebounded, resulting in a decrease in the normal contact force; thus, the friction force of the PIG decreased.
If we suppose that a PIG is operated stably and the pipeline is settled horizontally, Equation (6) can be simplified into Equation (7), an essential condition to ensure that the PIG does not become wedged during operation, which could also be described as the driving condition of the PIG; that is, the driving force applied to the PIG must be greater than or equal to the friction force. Otherwise, the PIG will lose its forward motion. As indicated by Equation (7), the minimum driving pressure difference required by the PIG under the different curvature radii can be calculated from the maximum friction force and the driving conditions of the PIG, which can be used to characterize the driving performance of the PIG. As shown in Table 3, with the radius of curvature increasing from 3D to 5D, the maximum friction force in the bend (occurring in the 38° position) decreased from 158.8 N to 55.5 N, and the driving performance of the PIG increased by 65.2%. Therefore, the driving performance of the PIG is better when running through a higher radius of curvature and it is less likely to become wedged.
Δ P · S = F f

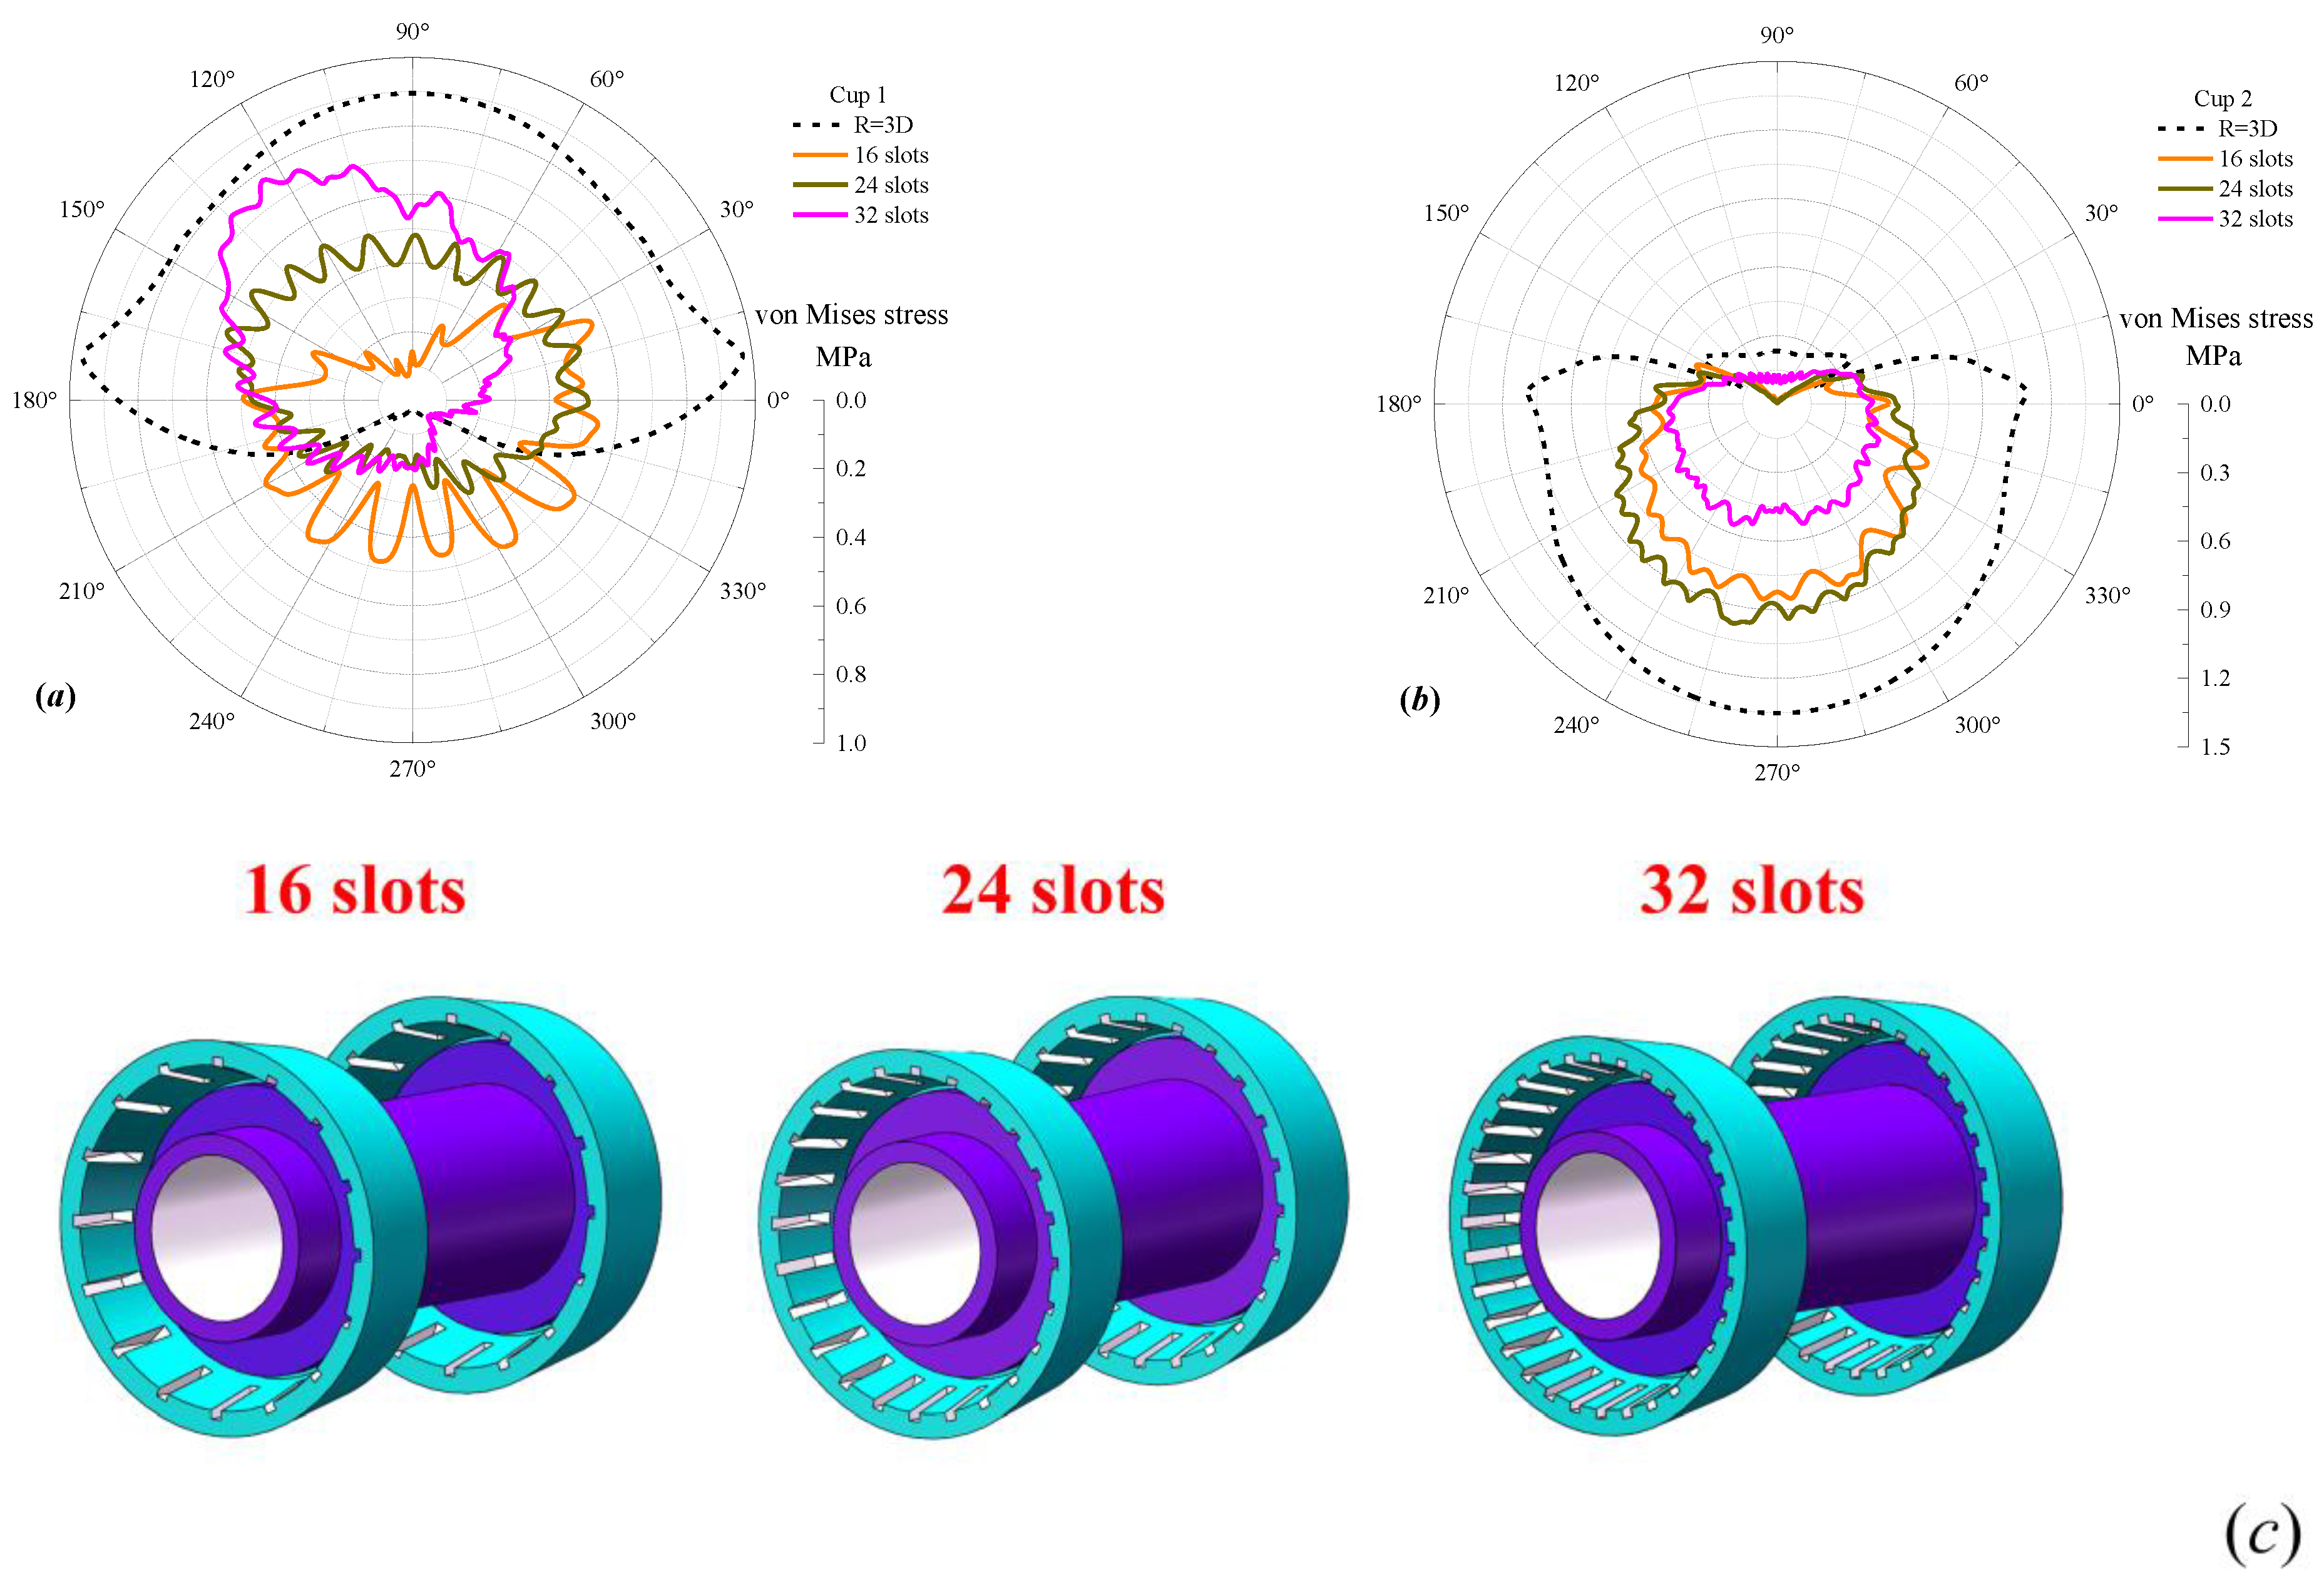
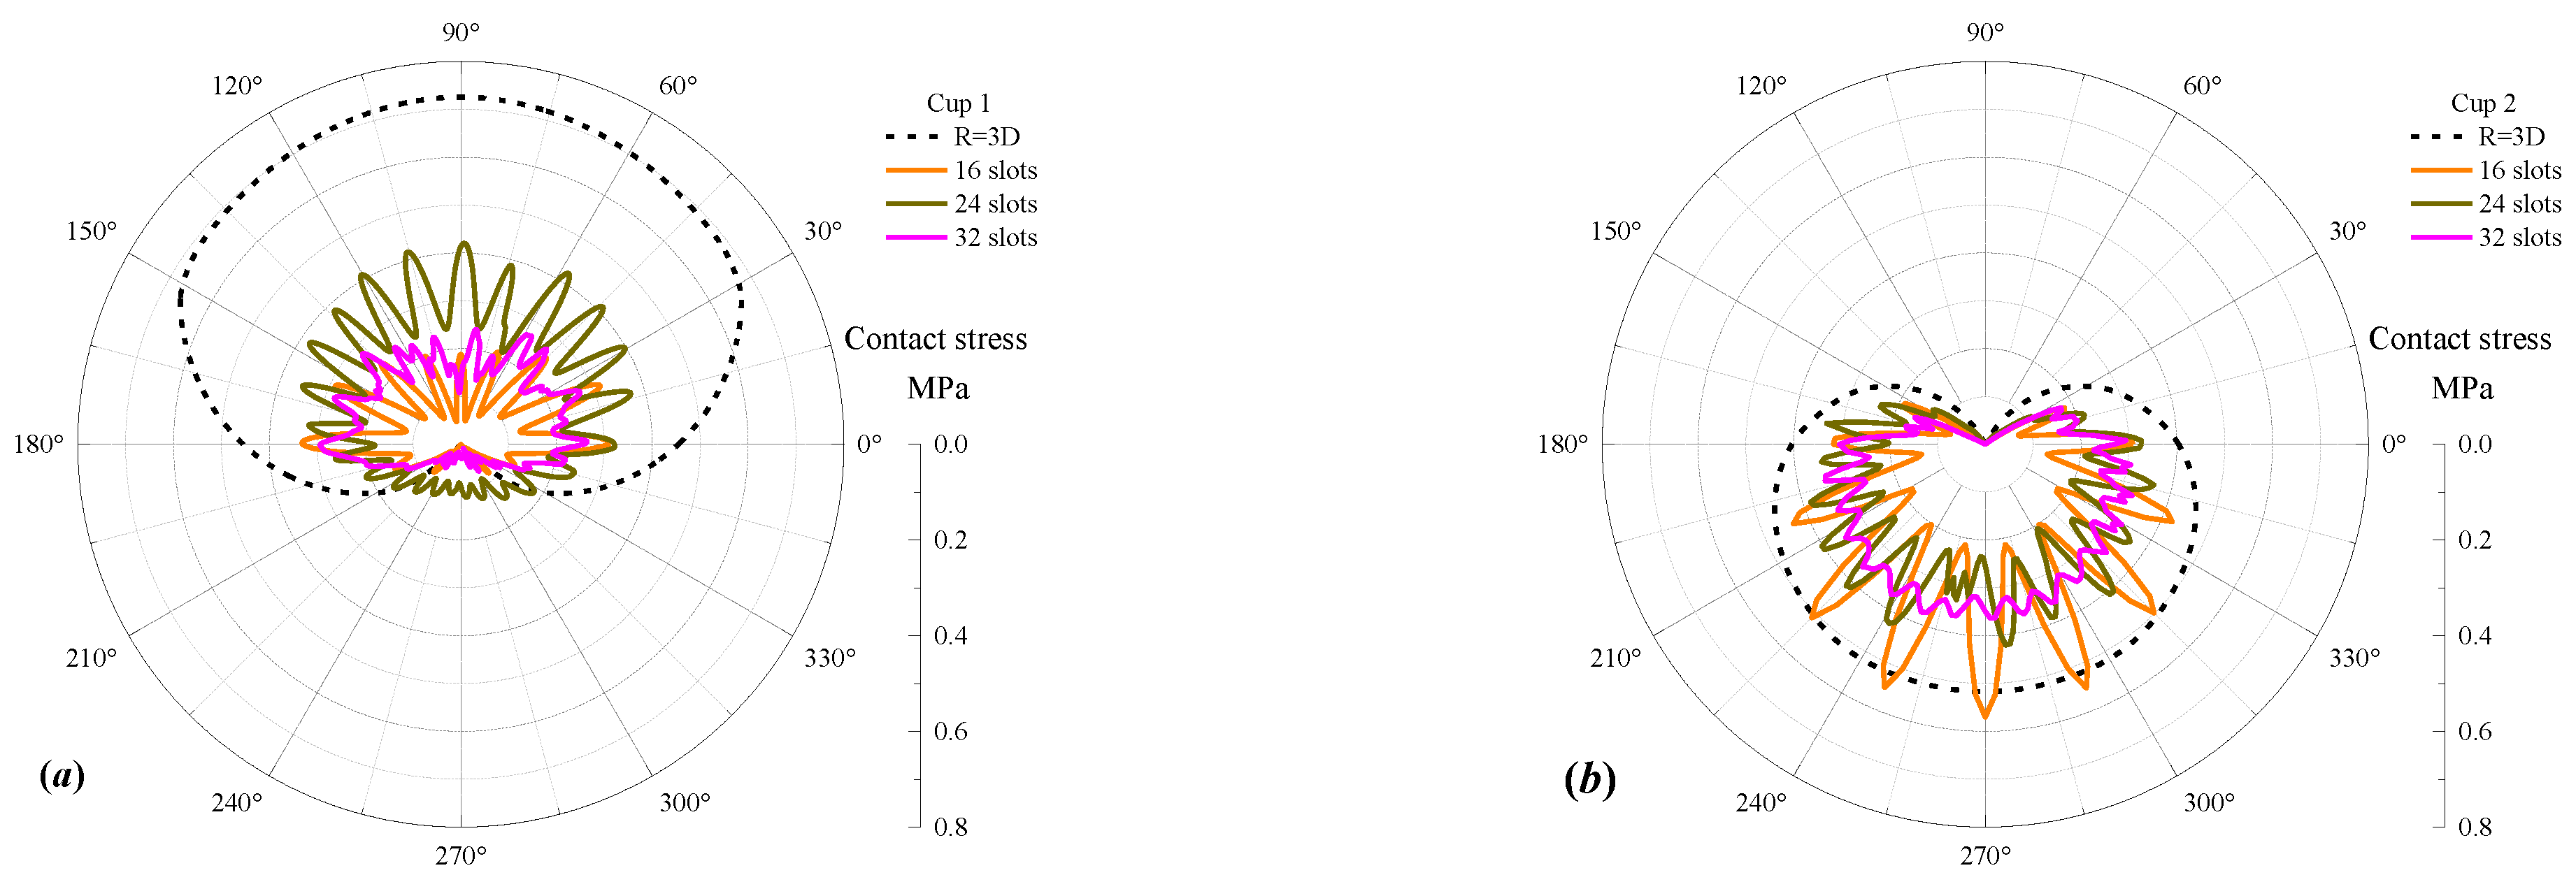
3.4. Optimization Analysis of Passing Capacity

The relationship between the performance of the safety application, the sealing performance, the driving performance of the PIG, and the radius of curvature of the bend has been analyzed in previous sections. For the PIG operated within a small pipe diameter, the blockage occurs at the place where the radius of curvature of the bend is smaller. Therefore, whether grooving in the cup can achieve the purpose of optimizing the passing capacity of the PIG has been studied, especially when the PIG is operated in a bend with the smallest radius of curvature. The optimization concept specifically refers to reducing the von Mises stress on the cup to prevent the cup’s failure due to excessive plastic deformation when the PIG moves through the small curvature radius bend, increasing the contact stress or reducing the leakage to ensure sealing, and reducing friction to reduce the risk of blockage. There are 16, 24, and 32 square grooves placed uniformly along the circumference of the lower part of the cup, where the width of the square groove is 3 mm, the length is 2 mm, and the depth is 15 mm. The grooved cup model is shown in Figure 10c.
According to Section 3.1, the most dangerous working position of the PIG is R = 3D, where t = 2.4 s (60°). Therefore, the safe application performance of the grooving model was first explored for the scenario where it ran in a 60° position. As shown in Figure 10a,b, when the number of grooves rose from 16 to 32, the maximum von Mises stress on cup 1 increased from 0.572 MPa to 0.780 MPa. Meanwhile, the safe application performance compared to 0.978 MPa of the maximum von Mises stress of the original model can be improved by 41.5%, 40.8%, and 20.2%, respectively. The maximum von Mises stress of cup 2 first increases and then decreases with the increase of the number of grooves, of which the 32-groove model is subjected to the minimum von Mises stress, and the 24-groove model is subjected to the maximum von Mises stress. As the number of grooves rises from 16 to 32, the safe application performance compared with 1.353 MPa of the maximum von Mises stress of the original model can be improved by 35.8%, 27.5%, and 58.5%, respectively.
For cup 1, creating 16 grooves can significantly reduce the von Mises stress of the PIG; for cup 2, creating 32 grooves can dramatically reduce the von Mises stress of the PIG, a result that is different from the conclusion drawn by Dong et al. [41], namely, that the effect of the number of grooves on stress is negligible. Because they only studied the movement of the PIG in a straight pipe, the stress on the two cups was almost unchanged during their entire operation process.
Although the above analysis shows that the von Mises stress of the PIG can be reduced and the safe application performance of the PIG can be improved by creating grooves in the cup, there is no apparent change relationship between the number of grooves and the improvement of safe application performance. The number of grooves should be determined according to the actual situation.
The highest risk position for leakage of the PIG obtained in Section 3.2 was R = 3D, t = 2.1 s (48°); the sealing performance of the grooved model was studied when the PIG operated in a 48° curve. As shown in Figure 11a,b, although the maximum contact stress and average contact stress of the grooved model were reduced compared with that of the original model, there existed no point at which the contact stress of cup 1 and cup 2 was at 0 at the same time, ensuring the sealing performance of the grooved model.
Furthermore, the leakage area and the leakage area ratio of the model with the three kinds of grooves were studied. It can be surmised from Figure 12 that when the number of grooves increased from 16 up to 32, the leakage area was 84.56 mm, 38.14 mm, and 58.03 mm, respectively. Compared to the 74.62 mm area of leakage in the original model, it can be seen that creating 16 grooves led to an increase in the leakage area, and a decrease in the leakage area of the 24-groove and 32-groove models, with the leakage area of the 24-groove model being the smallest, which would decrease by 22.23% at most.
As the number of grooves in the model increased from 16 to 32, the leakage area ratio first decreased and then increased, among which the leakage area ratio of the 24-groove model was the smallest, at 12.78%; the leakage area ratio of the 32-groove model was 19.44%, while the leakage area ratio of the model with 16 grooves was 28.33%. Compared to 25% at R = 3D for the model with 24 grooves, the sealing performance can be improved by 12.22% at most. However, the model with 16 grooves instead increased the leakage by 3.33%.
The above research shows that the risk of PIG leakage can be reduced and the sealing performance of the PIG can be improved by adding grooves. By comparing Figure 2 and Figure 8, it can be observed that the sealing performance of cup 1 was greatly improved by grooving, while the grooving of cup 2 added additional leakage compared with the original model when R = 3D. It is worth noting that the number of grooves should be determined according to the actual situation. Otherwise, other leakages may be added. Adding grooves to cup 1 and not cup 2 may be a direction for future research.
As shown in Figure 13, the friction force between the grooved model and the original model was compared. The maximum friction force of the grooved model decreased as the number of grooves increased. The calculations for friction force are shown in Table 4. As the number of grooves increased from 16 to 32, the maximum friction force of the PIG in the bend decreased from 136.04 N to 126.77 N, which was 20.2% lower than 158.8 N of the maximum friction force of the original model in the bend. The result can be construed to mean that the grooving in the cup is equivalent to reducing the thickness of the cup and, correspondingly, decreasing the stiffness of the cup. Furthermore, when the PIG moves through the bend, the supporting effect of the pipe wall on the cup is weakened, and the normal force on the cup is reduced accordingly. Therefore, according to the classical friction law, when the friction coefficient is constant, the friction force on the PIG decreases with the decrease in the normal force on the PIG.
Using the driving conditions given in Equation (3), the minimum driving differential pressure required by the PIG was calculated according to the different numbers of grooves. As shown in Table 4, with an increase in the number of grooves, the minimum driving differential pressure required by the PIG decreased. With the increase in the number of grooves from 16 to 32, the minimum differential pressure needed for the PIG decreased from 0.0192 MPa to 0.0180 MPa, which was 19.64% lower than the minimum differential pressure required by the original model of 0.0224 MPa.
As discussed above, both the friction of the PIG operating within the bend and the minimum driving pressure difference required for starting to move were reduced by increasing the number of grooves, enhancing the driving performance of the PIG.
Taking safe application performance, sealing performance, and driving performance into account, the introduction of 24 grooves is the best way to optimize the passing capacity of the PIG.

4. Conclusions

In this study, the passing capacity is proposed for characterizing the anti-blocking ability of the PIG as it operates in bends. A three-dimensional nonlinear finite element model was developed to investigate the passing capacity of PIGs operating in small-diameter pipelines with bends of varying curvature radii. The results indicate that there is a positive correlation between the passing capacity of PIGs and the radius of curvature of the bend. Aiming to address the issue that PIGs are most likely to become wedged in bends with small curvature radii, this study explores whether grooving can optimize the passing capacity of the PIG and determine the optimal optimization scheme. The results demonstrate that the passing capacity of the PIG can be improved by grooving the cup.
Therefore, when designing small-diameter pipelines with a diameter of φ105 × 5 mm, it is important to consider the impact of the bend radius of curvature on the passing capacity of the PIG. In engineering practice, it is important to adjust the structural parameters and operating parameters of the PIG in a reasonable manner to prevent blockages. The following conclusions can be drawn:
(1)
The maximum von Mises stress on the cup can be used as a measure to characterize the safety performance of PIG application. The calculation shows that the safe application performance of the PIG can be improved by 47.4% when the bend’s radius of curvature increases from 3D to 5D.
(2)
The two cups on the PIG have the poorest sealing performance at a 48° curvature of the bend. The sealing performance of the PIG is defined by the leakage area ratio while the PIG is leaking. As the radius of curvature increases from 3D to 5D, the leakage area ratio decreases from 25% to 16.4%, resulting in an 8.6% improvement in sealing performance.
(3)
The minimum driving differential pressure can be used to evaluate the driving performance, which can be improved by 65.2% when the ratio R = 3D increases to 5D.
(4)
Considering safe application performance, sealing performance, and driving performance, it is most appropriate to introduce 24 grooves to the cup in order to optimize the passing capacity of the PIG. Compared to the worst passing capacity performance in the case of R = 3D, creating 24 grooves can improve the safe application performance by 40.8%, improve the sealing performance by 12.22%, and improve the driving performance by 17%.

Author Contributions

Conceptualization, S.Z. and H.Z.; methodology, F.Z.; software, F.Z.; validation, F.Z. and H.L.; formal analysis, F.Z.; investigation, H.L.; resources, Y.Z.; data curation, H.L.; writing—original draft preparation, H.L.; writing—review and editing, F.Z.; visualization, H.L.; supervision, S.Z.; project administration, F.Z.; funding acquisition, S.F. and Y.Z. All authors have read and agreed to the published version of the manuscript.

Funding

This research was funded by the Natural Science Research Project of the Colleges and Universities of Jiangsu Province (grant number 20KJA470001) and the National Natural Science Foundation of China (grant number 21676031).

Data Availability Statement

Data are contained within the article.

Conflicts of Interest

The authors declare no conflict of interest.

References

  1. Guan, L.W.; Cong, X.D.; Sun, Y.L.; Gao, Y.B.; Iqbal, U.; Noureldin, A. Enhanced MEMS SINS Aided Pipeline Surveying System by Pipeline Junction Detection in Small Diameter Pipeline. IFAC-PapersOnLine 2017, 50, 3560–3565. [Google Scholar] [CrossRef]
  2. Glisic, B. 14-Sensing solutions for assessing and monitoring pipeline systems. In Sensor Technologies for Civil Infrastructures, 1st ed.; Wang, M.L., Lynch, J.P., Sohn, H., Eds.; Woodhead Publishing: Cambridge, UK, 2014; Volume 56, pp. 422–460. ISBN 978-1-78242-242-6. [Google Scholar]
  3. An, Z.T.; Tang, Q.; Huang, Y.F.; Li, H. Time-dependent analysis of buried high-density polyethylene (PE100) pipelines with a scratch defect subjected to touchdown impact loading of blasting collapsed body. Int. J. Pres. Ves. Pip 2022, 195, 104605. [Google Scholar] [CrossRef]
  4. Rastogi, A.; Fan, Y.L. Experimental and modeling study of onset of liquid accumulation. J. Nat. Gas Sci. Eng. 2020, 73, 103064. [Google Scholar] [CrossRef]
  5. Bagheri, M.; Sari, A. Study of natural gas emission from a hole on underground pipelines using optimal design-based CFD simulations: Developing comprehensive soil classified leakage models. J. Nat. Gas Sci. Eng. 2022, 102, 104583. [Google Scholar] [CrossRef]
  6. Yan, Y.T.; Dong, X.Q.; Li, J.M. Experimental study of methane diffusion in soil for an underground gas pipe leak. J. Nat. Gas Sci. Eng. 2015, 27, 82–89. [Google Scholar] [CrossRef]
  7. Askari, M.; Aliofkhazraei, M.; Afroukhteh, S. A comprehensive review on internal corrosion and cracking of oil and gas pipelines. J. Nat. Gas Sci. Eng. 2019, 71, 102971. [Google Scholar] [CrossRef]
  8. Liu, C.; Cao, Y.G.; Chen, J.Z.; Dai, C.L.; He, R.Y.; Zhou, Z.G. The blockage risk in the bend of the Bi-directional pig used for submarine pipeline based on the modified Burgers-Frenkel (MB-F) model. Ocean Eng. 2023, 268, 113508. [Google Scholar] [CrossRef]
  9. Coramik, M.; Ege, Y. Discontinuity inspection in pipelines: A comparison review. Measurement 2017, 111, 359–373. [Google Scholar] [CrossRef]
  10. Sampath, S.; Chaurasiya, L.K.; Aryan, P.; Bhattacharya, B. An innovative approach towards defect detection and localization in gas pipelines using integrated in-line inspection methods. J. Nat. Gas Sci. Eng. 2021, 90, 103933. [Google Scholar] [CrossRef]
  11. Song, H.D.; Yang, L.; Liu, G.H.; Tian, G.Y.; Ona, D.; Song, Y.P.; Li, S.Q. Comparative Analysis of In-line Inspection Equipments and Technologies. IOP Conf. Ser. Mater. Sci. Eng. 2018, 382, 032021. [Google Scholar] [CrossRef]
  12. Liu, C.; Wei, Y.G.; Cao, Y.G.; Zhang, S.H.; Sun, Y.T. Traveling ability of pipeline inspection gauge (PIG) in bend under different friction coefficients by 3D FEM. J. Nat. Gas Sci. Eng. 2020, 75, 103134. [Google Scholar] [CrossRef]
  13. Zhang, H.X.; Qin, M.; Liao, K.X.; Wang, K.; He, G.X. Pipe-soil vibration characteristics of natural gas pipelines during the pigging process. J. Nat. Gas Sci. Eng. 2021, 95, 104148. [Google Scholar] [CrossRef]
  14. Zhang, H.; Zhang, S.M.; Liu, S.H.; Wang, Y. Collisional vibration of PIGs (pipeline inspection gauges) passing through girth welds in pipelines. J. Nat. Gas Sci. Eng. 2017, 37, 15–28. [Google Scholar] [CrossRef]
  15. Miao, X.Y.; Zhao, H.; Gao, B.X.; Ma, Y.H.; Hou, Y.G.; Song, F.L. Motion analysis and control of the pipeline robot passing through girth weld and inclination in natural gas pipeline. J. Nat. Gas Sci. Eng. 2022, 104, 104662. [Google Scholar] [CrossRef]
  16. Kim, S.; Jeong, J.; Yoo, K.; Yoo, H.; Seo, Y. Experimental investigation on speed excursion of PIG due to friction variation in natural gas pipeline. J. Nat. Gas Sci. Eng. 2022, 104, 104659. [Google Scholar] [CrossRef]
  17. Bernasconi, G.; Giunta, G. Acoustic detection and tracking of a pipeline inspection gauge. J. Pet. Sci. Eng. 2020, 194, 107549. [Google Scholar] [CrossRef]
  18. Zhao, J.G.; Wang, J.; Liu, Q.Y.; Luo, X.; Dong, X.C. A review of mechanical model, structure, and prospect for long-distance pipeline pig and robot. Robotica 2022, 40, 4271–4307. [Google Scholar] [CrossRef]
  19. Lee, D.H.; Moon, H.; Koo, J.C.; Choi, H.R. Map building method for urban gas pipelines based on landmark detection. Int. J. Control Autom. Syst 2013, 11, 127–135. [Google Scholar] [CrossRef]
  20. Shi, M.; Yang, L.J.; Gao, S.W.; Wang, G.Q. Small-Diameter Tube Wall Damage-Detection Method Based on TE01 Mode Microwave. Sensors 2022, 22, 6476. [Google Scholar] [CrossRef]
  21. Davoudi, M.; Heidari, Y.; Mansoori, S.A.A. Field experience and evaluation of the South Pars sea line pigging, based on dynamic simulations. J. Nat. Gas Sci. Eng. 2014, 18, 210–218. [Google Scholar] [CrossRef]
  22. Soorgee, M.H. A numerical study on differential pressure needed for ball pig motion in pipelines based on nonlinear hyperelastic material model. J. Nat. Gas Sci. Eng. 2018, 59, 466–472. [Google Scholar] [CrossRef]
  23. Naeini, H.S.; Soorgee, M.H. Experimental investigation on sphere pig movement in multiple thickness pipe. J. Nat. Gas Sci. Eng. 2021, 95, 104152. [Google Scholar] [CrossRef]
  24. Cao, Y.G.; Liu, C.; Tian, H.J.; Zhang, S.H. Prediction of the driving force for a cup pig based on the distribution of contact stress. J. Nat. Gas Sci. Eng. 2020, 81, 103415. [Google Scholar] [CrossRef]
  25. Cao, Y.G.; Zhang, L.; Liu, C.; Li, X.Y.; Wei, Y.G.; Sun, Y.T. Prediction of the Driving Force for the Bidirectional Pig Based on the Cantilever-Kelvin Combination Model. J. Pipeline. Syst. Eng. 2021, 12, 04021004. [Google Scholar] [CrossRef]
  26. Zhu, X.X.; Zhang, S.M.; Li, X.L.; Wang, D.G.; Yu, D. Numerical simulation of contact force on bi-directional pig in gas pipeline: At the early stage of pigging. J. Nat. Gas Sci. Eng. 2015, 23, 127–138. [Google Scholar] [CrossRef]
  27. Zhu, X.X.; Wang, W.; Zhang, S.M.; Liu, S.H. Experimental Research on the Frictional Resistance of Fluid-Driven Pipeline Robot with Small Size in Gas Pipeline. Tribol. Lett 2017, 65, 49. [Google Scholar] [CrossRef]
  28. Hendrix, M.H.W.; Graafland, C.M.; van Ostayen, R.A.J. Frictional forces for disc-type pigging of pipelines. J. Pet. Sci. Eng. 2018, 171, 905–918. [Google Scholar] [CrossRef]
  29. Hendrix, M.; den Heijer, A.; Breugem, W.-P.; Henkes, R.A.W.M. Frictional forces during pigging of multiphase pipelines. In Proceedings of the 10th North American Conference on Multiphase Technology, Banff, AB, Canada, 8–10 June 2016. BHR: 2016–2103. [Google Scholar]
  30. Zhang, H.; Zhang, S.M.; Liu, S.H.; Wang, Y.; Lin, L. Measurement and analysis of friction and dynamic characteristics of PIG’s sealing disc passing through girth weld in oil and gas pipeline. Measurement 2015, 64, 112–122. [Google Scholar] [CrossRef]
  31. Wang, S.; Yao, X.F.; Yang, H.; Huang, S.H. Measurement and evaluation on contact stress at the rubber contact interface. Measurement 2019, 146, 856–867. [Google Scholar] [CrossRef]
  32. Chen, Z.; Qiu, X.Y.; Yang, L.L. Deformation and stress analysis of cup on pipeline inspection gauge based on reverse measurement. Energy Sci. Eng. 2022, 10, 2509–2526. [Google Scholar] [CrossRef]
  33. Chen, S.T.; Xia, L.; Wang, X.L.; Teng, K.; Zhang, Y.B.; Zhang, M.Y.; Gong, Y.J. Motion Law and Mechanical Properties of PIGs When Passing through a Pipe Bend. Machines 2022, 10, 963. [Google Scholar] [CrossRef]
  34. Zhang, H.; Dong, J.H.; Cui, C.; Liu, S.H. Stress and strain analysis of spherical sealing cups of fluid-driven pipeline robot in dented oil and gas pipeline. Eng. Failure Anal. 2020, 108, 104294. [Google Scholar] [CrossRef]
  35. Jiang, J.X.; Zhang, H.; Ji, B.L.; Yi, F.N.; Yan, F.; Liu, X.B. Numerical investigation on sealing performance of drainage pipeline inspection gauge crossing pipeline bends. Energy Sci. Eng. 2021, 9, 1858–1871. [Google Scholar] [CrossRef]
  36. Zheng, C.; Zheng, X.F.; Qin, J.; Liu, P.; Aibaibu, A.; Liu, Y.H. Nonlinear finite element analysis on the sealing performance of rubber packer for hydraulic fracturing. J. Nat. Gas Sci. Eng. 2021, 85, 103711. [Google Scholar] [CrossRef]
  37. Zhu, X.X.; Wang, W.; Zhang, S.M.; Wang, C. The Pig gravity impact on its frictional force in oil and gas pipeline. In Proceedings of the 27th International Ocean and Polar Engineering Conference, San Francisco, CA, USA, 25 June 2017; pp. 140–144. [Google Scholar]
  38. Cao, Y.G.; Zhen, Y.; Shi, Y.J.; Zhang, S.H.; Sun, Y.T.; Nie, W.J. Stress Distribution of the Power Section Cup of Pipeline Inspection Gauges by Finite Element Method. J. Pipeline. Syst. Eng. 2018, 9, 04017039. [Google Scholar] [CrossRef]
  39. Rashid, M.Z.A.; Yakub, M.F.M.; Salim, S.A.Z.S.; Mamat, N.; Putra, S.M.S.M.; Roslan, S.A. Modeling of the in-pipe inspection robot: A comprehensive review. Ocean Eng. 2020, 203, 107206. [Google Scholar] [CrossRef]
  40. Kim, S.; Yoo, K.; Yoo, B.; Kim, D.; Yoo, H.; Seo, Y. Speed excursion simulation of PIG using improved friction models. J. Nat. Gas Sci. Eng. 2022, 97, 104371. [Google Scholar] [CrossRef]
  41. Dong, J.H.; Zhang, H.; Liu, S.H. 3D printed bio-inspired sealing disc of pipeline inspection gauges (PIGs) in small diameter pipeline. J. Nat. Gas Sci. Eng. 2019, 61, 344–356. [Google Scholar] [CrossRef]
Figure 1. (a) FE models of the PIG and pipe; photographs of (b) the experimental pipe; (c) the PIG; (d) the S-type tension sensor; (e) the signal converter.
Processes 11 03288 g001
Figure 2. Comparison of the friction between the traction experiment and the numerical simulation. Before line 1, the PIG is entirely located in the launcher; between lines 1 and 2, the PIG’s head (cup 1) has left the launcher, while the PIG’s tail (cup 2) is still in the launcher; after line 2, the PIG has completely entered the straight pipe.
Processes 11 03288 g002
Figure 3. The displacement cloud diagram of the pig passing through the bend. (a) 15° position; (b) 30° position; (c) 45° position; (d) 60° position; (e) 75° position; (f) 90° position.
Processes 11 03288 g003
Figure 4. The distance between two groups of nodes on the cup: (a) 0° to 180°; (b) 90° to 270°.
Processes 11 03288 g004
Figure 5. The circumferential von Mises stress distribution of the cups: cup 1 and cup 2.
Processes 11 03288 g005
Figure 6. The extraction path and the results of contact stress. (a) Extraction path; (b) 0° position; (c) 90° position; (d) 270° position.
Processes 11 03288 g006
Figure 7. Circumferential contact stress distribution of the cups.
Processes 11 03288 g007
Figure 8. Leakage area of the cup under different curvature radii.
Processes 11 03288 g008
Figure 9. Friction force variation of the PIG under three curvature radii.
Processes 11 03288 g009
Figure 10. Circumferential von Mises stress of the original model and the grooved model in the 60° position. (a) Cup 1; (b) cup 2; (c) grooved cup.
Processes 11 03288 g010
Figure 11. Circumferential contact stress of the cups with different numbers of grooves and that of the original model. (a) Cup 1; (b) cup 2.
Processes 11 03288 g011
Figure 12. Leakage area of the groove model.
Processes 11 03288 g012
Figure 13. Friction comparison between the grooved model and the original model.
Processes 11 03288 g013
Table 1. The main parameters of the FE model.
ParameterValue
Length of PIG132 mm
Outer diameter of the cup97.85 mm
Thickness of the cup6 mm
Diameter of the mandrel50 mm
Diameter of the flange65 mm
Hardness of the cup 78 HA
Elastic modulus of the cup8.34 MPa
C101.42
C010.36
Mesh of pipeC3D20H
Mesh of cupC3D8H
Mesh of mandrel and flangeC3D10M
Boundary conditions of pipeConstant
Boundary conditions of the cup, mandrel, and flangeBound
Table 2. Element accuracy verification results.
Mesh of CupSize (mm)N GridTrue StrainError (%)Contact Area (mm2)Error (%)
coarser1.751536010.85-0.76-
coarse1.353569011.031.660.699.21
original18825611.060.270.681.44
refined0.725472011.100.360.654.41
more refined0.5554468011.170.630.633.08
Table 3. Frictional forces under different curvature radii.
Curvature Radius (mm)Average Friction Force on Straight Pipe (n)Maximum Friction Force in the Bend (N)Minimum Required Drive Differential Pressure (MPa)
3D24.56158.80.0224
4D23.3371.20.0100
5D24.5955.50.0078
Table 4. Comparison of the friction force between the different groove models and the original model.
Number of GroovesMaximum Friction Force in Bend (N)Minimum Required Drive Differential Pressure (MPa)
0158.800.0224
16136.040.0192
24132.130.0186
32126.770.0180
Disclaimer/Publisher’s Note: The statements, opinions and data contained in all publications are solely those of the individual author(s) and contributor(s) and not of MDPI and/or the editor(s). MDPI and/or the editor(s) disclaim responsibility for any injury to people or property resulting from any ideas, methods, instructions or products referred to in the content.

