
A Novel Prediction Model of the Drag Coefficient of Irregular Particles in Power-Law Fluids


Abstract
:1. Introduction
2. Experimental Method
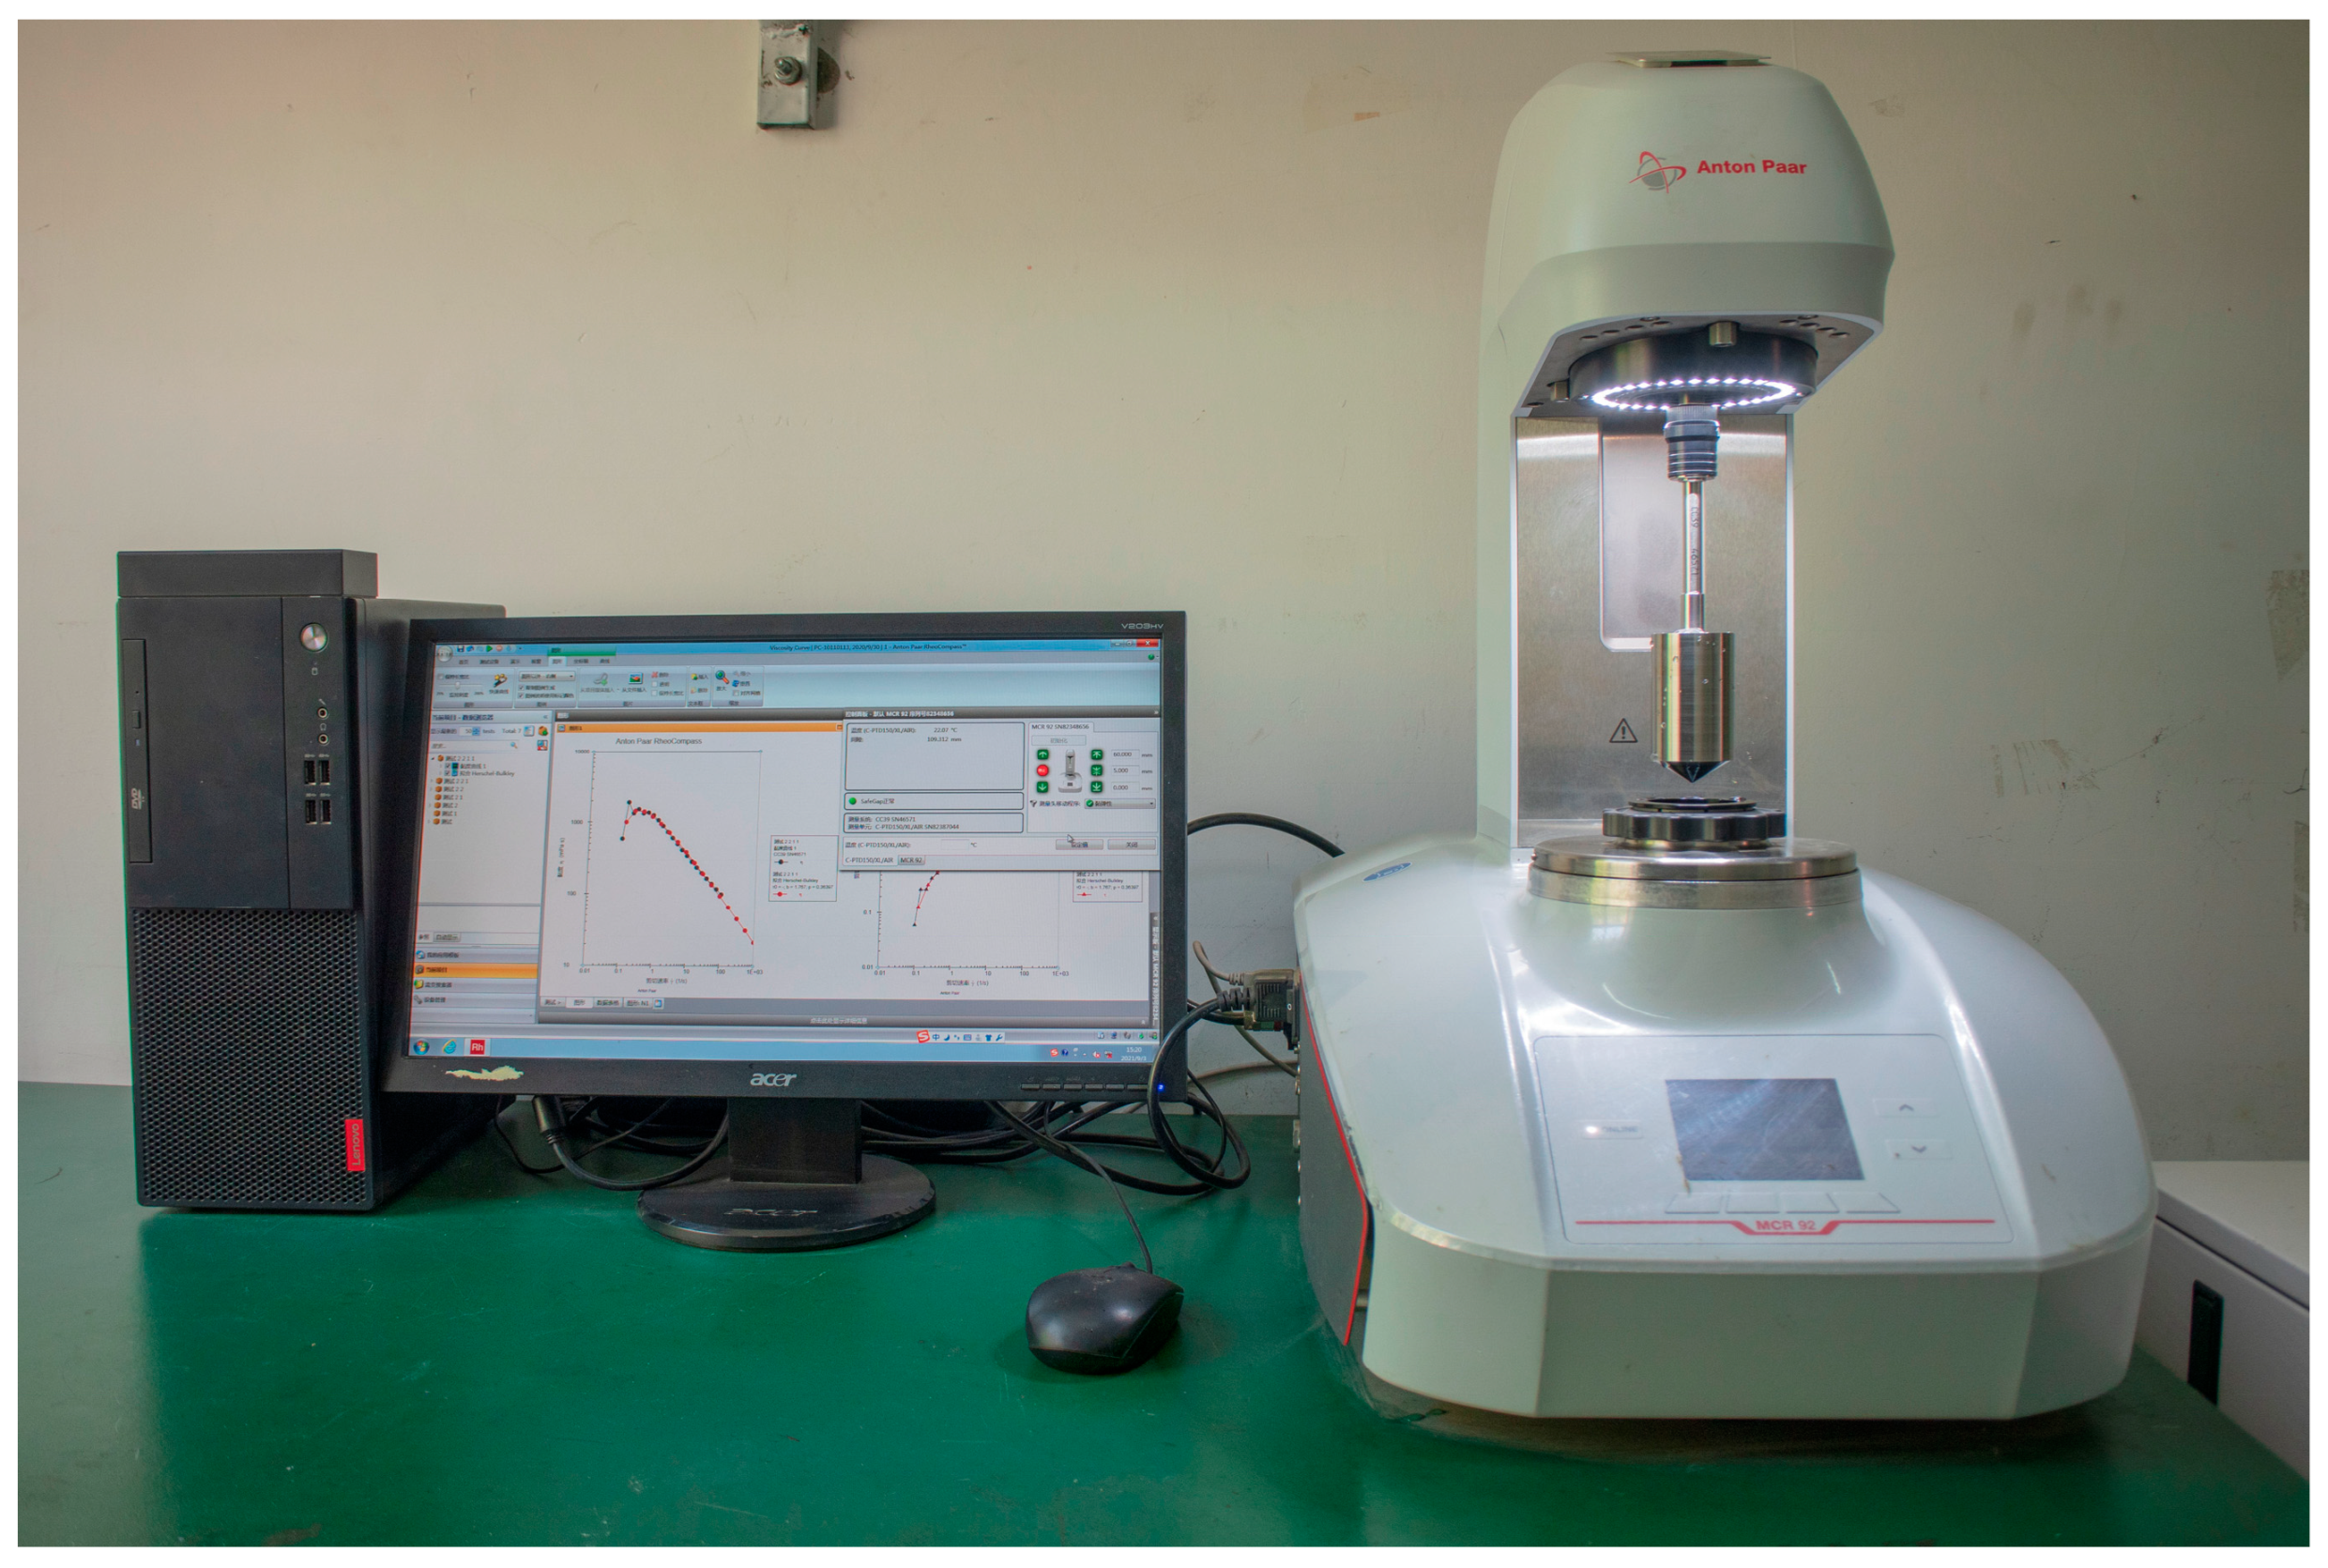
2.1. Experimental Apparatus and Materials
2.2. Experimental Method
3. Results and Discussion
3.1. Spherical Particle Settling in the Power-Law Fluid
3.2. Irregular Particle Resistance Coefficient
4. Conclusions
- (1)
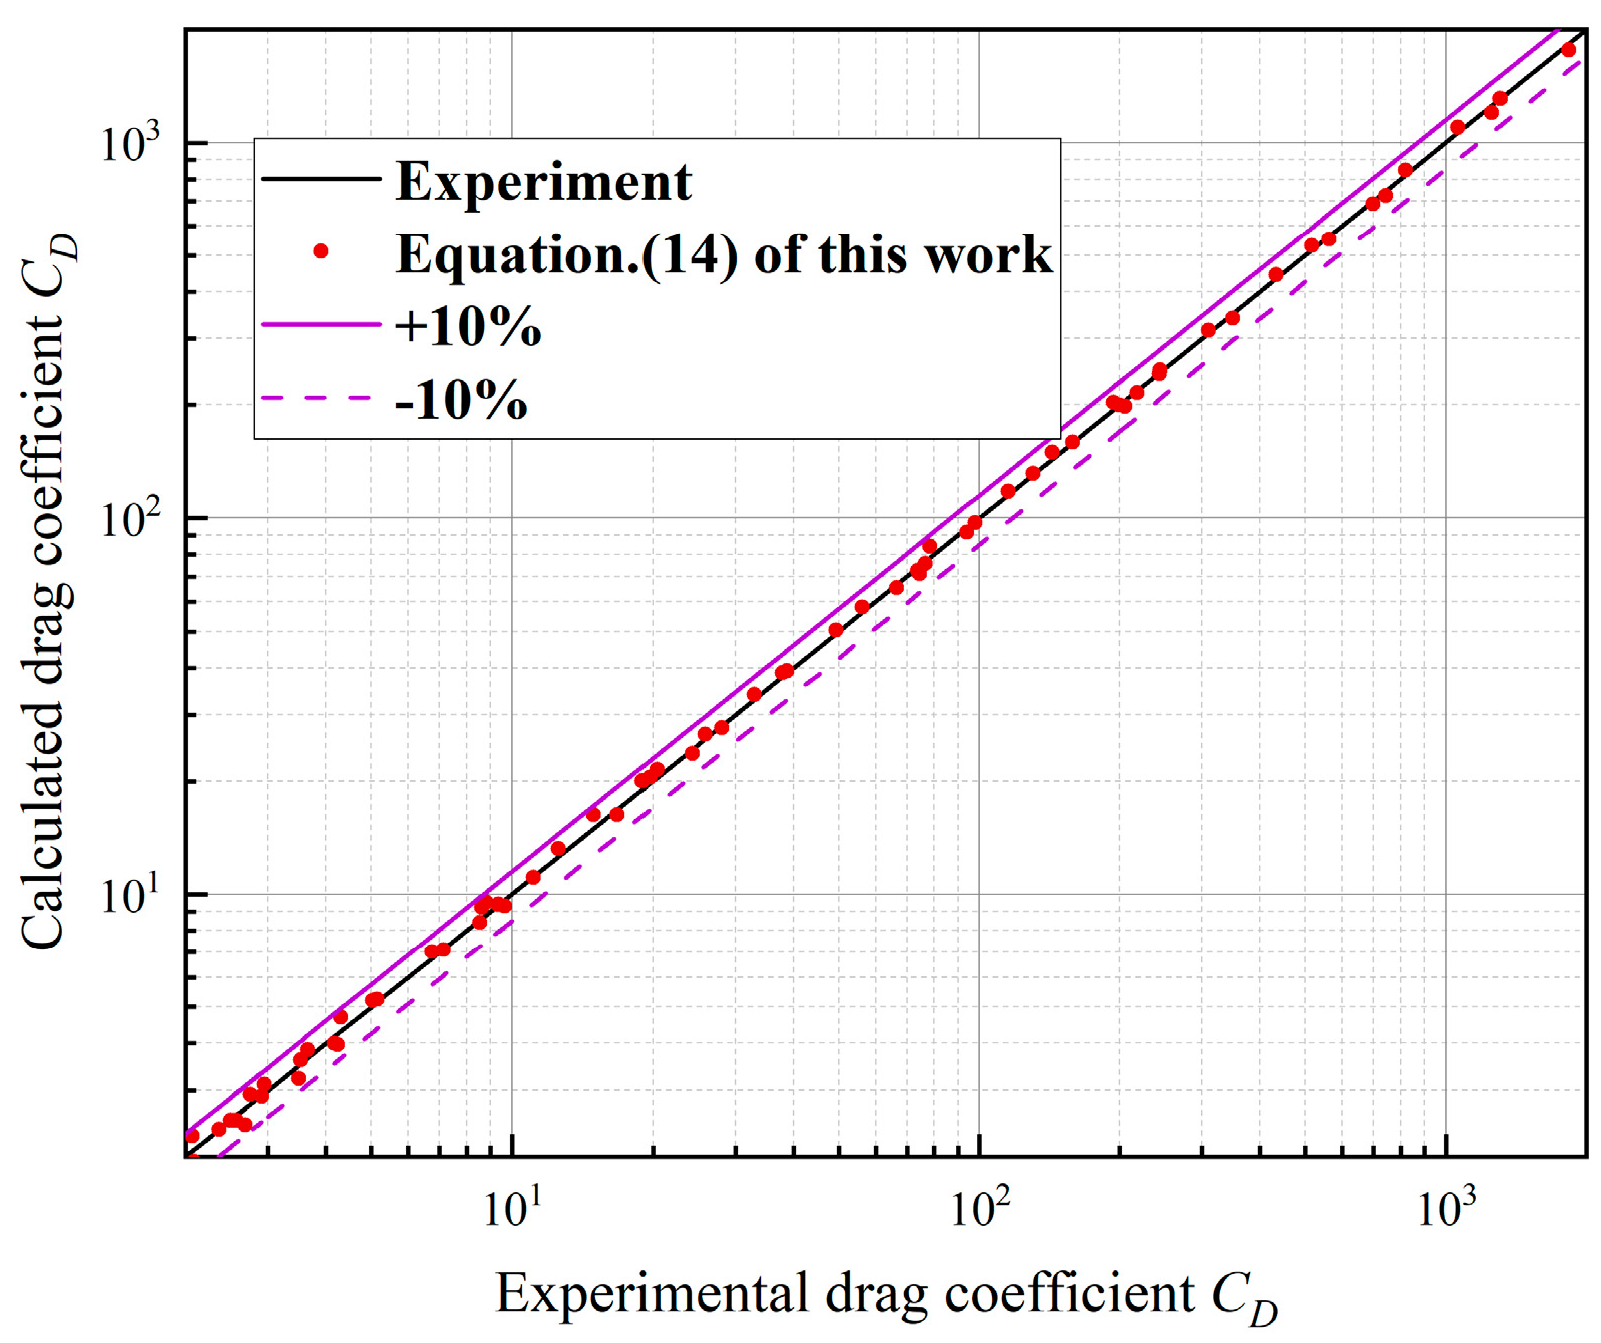
- A model for predicting the settling drag coefficient of spherical particles in power-law fluid is established by modifying the correlation proposed by Kelessidis and Mpandelis. The mean relative error is 3.85%;
- (2)
- For irregular particles, based on the spherical particle prediction model, using image analysis technology, and introducing two-dimensional shape description parameters, a resistance coefficient model for predicting the settlement of irregular particles in power-law fluid is established. The results show that the model has good prediction ability, with a mean relative error of 4.47. This work can provide a valuable reference for those interested in fracturing scheme design and wellbore cleaning;
- (3)
- The existing CD-Res prediction models are mostly for Newtonian fluid, power-law fluid, and Heba fluid. However, there are relatively few studies on CD-Res prediction models for other non-Newtonian fluids, such as Bingham fluid and viscoelastic fluid, and the existing models are difficult to use in actual field operations. Therefore, it is the main research direction in the future to study the particle sedimentation law in other types of fluids via experimental means and establish the corresponding CD-Res correlation;
- (4)
- At present, the single particle sedimentation method based on the Stokes theory formula is used to measure the particle sedimentation velocity in the laboratory. It is to observe and measure the time required for single particles to settle in the fracturing fluid to the bottom of the container in a static state and calculate the sedimentation rate. However, the single-particle sedimentation method cannot measure the sedimentation velocity of multiple particles. Therefore, it is urgent to develop new devices and new experimental methods to further explore the sedimentation mechanism of multi-particles.
Author Contributions
Funding
Data Availability Statement
Conflicts of Interest
Nomenclature
| CD | drag coefficient, dimensionless |
| CD-N | the experimental value of the irregular particle settlement drag coefficient, dimensionless |
| CD-S | predicted drag coefficient of spherical particle settlings, dimensionless. |
| Res-n | particle Reynolds number in Newtonian fluid, dimensionless |
| Res-p | particle Reynolds number in the power-law fluid, dimensionless |
| ρs | density of particles (kg/m3) |
| ρl | density of fluid (kg/m3) |
| g | acceleration of gravity (m/s2) |
| d | particle diameter (m) |
| vs | settling velocity (m/s) |
| μ | Newton viscosity of the fluid (Pa·s) |
| n | fluid behavior index, dimensionless |
| K | power-law fluid consistency index (Pa·sn) |
| τ | shear stress (Pa) |
| γ | shear rate (1/s) |
| dA | diameter of the equivalent circle of the maximum projection surface of the |
| particle (m) | |
| P | entire projection perimeter of the particle (m) |
| c | circularity |
| Ap | the surface area of the largest projection surface of particles (m2) |
| A, B, C, D, and E | correlation coefficients, Equation (13) |
| N | total number |
| α, β, and λ | the correlation coefficients and dimensionless numbers |
| FB | buoyancy (N) |
| FG | gravity (N) |
| FD | drag force (N) |
| MRE | mean relative error |
| RMSLE | root mean square logarithm error |
| CMC | carboxymethyl cellulose |
| CMC1 | 0.25 wt% CMC |
| CMC2 | 0.5 wt% CMC |
| CMC3 | 0.75 wt% CMC |
| CMC4 | 1.0 wt% CMC |
| CMC5 | 1.25 wt% CMC |
| CMC6 | 1.5 wt% CMC |
| CMC7 | 1.75 wt% CMC |
| CMC8 | 2.0 wt% CMC |
References
- Yan, T.; Qu, J.Y.; Sun, X.F. A novel predictive model of drag coefficient and settling velocity of drill cuttings in non-Newtonian drilling fluids. Pet. Sci. 2021, 18, 1729–1738. [Google Scholar] [CrossRef]
- Li, S.Q.; Chen, Z.; Li, W.; Yan, T. A FE Simulation of the Fracture Characteristics of Blunt Rock Indenter under Static and Harmonic Dynamic Loadings using Cohesive Elements. Rock Mech. Rock Eng. 2023, 56, 2935–2947. [Google Scholar] [CrossRef]
- Hu, Q.; Li, Y.; Sun, X.; Chen, M.; Bu, Q.; Gong, B. Integrating test device and method for creep failure and ultrasonic response of methane hydrate-bearing sediments. Rev. Sci. Instrum. 2023, 94, 025105. [Google Scholar] [CrossRef]
- Khan, N.S.; Hussanan, A.; Kumam, W. Accessing the thermodynamics of Walter-B fluid with magnetic dipole effect past a curved stretching surface. ZAMM-J. Appl. Math. Mech./Z. Angew. Math. Mech. 2023, 103, e202100112. [Google Scholar] [CrossRef]
- Khan, N.S.; Humphries, U.W.; Kumam, W. Assessment of irreversibility optimization in Casson nanofluid flow with leading edge accretion or ablation. ZAMM-J. Appl. Math. Mech./Z. Angew. Math. Mech. 2022, 102, e202000207. [Google Scholar] [CrossRef]
- Zhu, Z.; Zhou, M.; Song, X. Settling behavior of spherical particles in vertical annulus: Experimental study and model development. Particuology 2022, 68, 114–123. [Google Scholar] [CrossRef]
- Sun, X.; Sun, M.; Li, Z. A Novel Prediction Model of the Drag Coefficient of Shale Cuttings in Herschel–Bulkley Fluid. Energies 2022, 15, 4496. [Google Scholar] [CrossRef]
- Brown, P.P.; Lawler, D.F. Sphere drag and settling velocity revisited. J. Environ. Eng. 2003, 129, 222–231. [Google Scholar] [CrossRef]
- Arnipally, S.K.; Kuru, E. Settling velocity of particles in viscoelastic fluids: A comparison of the shear-viscosity and elasticity effects. SPE J. 2018, 23, 1689–1705. [Google Scholar] [CrossRef]
- Stokes, G.G. On the effect of the internal friction of fluids in the motion of pendulums. Trans. Camb. Philos. Soc. 1851, 9, 8–106. [Google Scholar]
- Abraham, F.F. Functional dependence of drag coefficient of a sphere on Reynolds number. Phys. Fluids 1970, 13, 2194–2195. [Google Scholar] [CrossRef]
- Terfous, A.; Hazzab, A.; Ghenaim, A. Predicting the drag coefficient and settling velocity of spherical particles. Powder Technol. 2013, 239, 12–20. [Google Scholar] [CrossRef]
- Ofei, T.N. Effect of yield power law fluid rheological properties on cuttings transport in eccentric horizontal narrow annulus. J. Fluids 2016, 2016, 4931426. [Google Scholar] [CrossRef]
- Lali, A.; Khare, A.; Joshi, J. Behaviour of solid particles in viscous non-Newtonian solutions: Settling velocity, wall effects and bed expansion in solid-liquid fluidized beds. Powder Technol. 1989, 57, 39–50. [Google Scholar] [CrossRef]
- Chhabra, R.P. Motion of spheres in power law (viscoinelastic) fluids at intermediate Reynolds numbers: A unified approach. Chem. Eng. Process. Process Intensif. 1990, 28, 89–94. [Google Scholar] [CrossRef]
- Peden, J.M.; Luo, Y. Settling Velocity of Variously Shaped Particles in Drilling and Fracturing Fluids. SPE Drill. Eng. 1987, 2, 337–343. [Google Scholar] [CrossRef]
- Reynolds, P.A.; Jones, T.E.R. An Experimental Study of the Settling Velocities of Single Particles in Non-Newtonian Fluids. Int. J. Miner. Process. 1989, 25, 47–77. [Google Scholar] [CrossRef]
- Kelessidis, V.C. Terminal velocity of solid spheres falling in Newtonian and non-Newtonian liquids. Tech. Chron. Sci. J. TCG 2003, 5, 43–54. [Google Scholar]
- Shah, S.N.; El, Y.; Chhabra, R.P. New model for single spherical particle settling velocity in power law (visco-inelastic) fluids. Int. J. Multiph. Flow 2007, 33, 51–66. [Google Scholar] [CrossRef]
- Okesanya, T.; Abdukarimov, A.; Kuru, E. Generalized models for predicting the drag coefficient and settling velocity of rigid spheres in viscoelastic and viscoinelastic power-law fluids. J. Pet. Sci. Eng. 2020, 191, 107077. [Google Scholar] [CrossRef]
- Battistella, A.; van Schijndel, S.J.G.; Baltussen, M.W. On the terminal velocity of single bubbles rising in non-Newtonian power-law liquids. J. Non-Newton. Fluid Mech. 2020, 278, 104249. [Google Scholar] [CrossRef]
- Mohammad, H.; Munshi, B. Wall effect on cluster particle’s settling terminal velocity and drag coefficient in Newtonian and non-Newtonian fluid medium. Phys. Fluids 2023, 35, 073314. [Google Scholar] [CrossRef]
- Shajahan, T.; Breugem, W.P. Influence of concentration on sedimentation of a dense suspension in a viscous fluid. Flow Turbul. Combust. 2020, 105, 537–554. [Google Scholar] [CrossRef]
- Ahonguio, F.; Jossic, L.; Magnin, A. Influence of surface properties on the flow of a yield stress fluid around spheres. J. Non-Newton. Fluid Mech. 2014, 206, 57–70. [Google Scholar] [CrossRef]
- Xu, Z.; Song, X.; Li, G. Settling behavior of non-spherical particles in power-law fluids: Experimental study and model development. Particuology 2019, 46, 30–39. [Google Scholar] [CrossRef]
- Pettyjohn, E.S.; Christiansen, E.B. Effect of particle shape on free-settling rates of isometric particles. Chem. Eng. Prog. 1948, 44, 157–172. [Google Scholar]
- Komar, P.D. Settling velocities of circular cylinders at low Reynolds numbers. J. Geol. 1980, 88, 327–336. [Google Scholar] [CrossRef]
- Dioguardi, F.; Mele, D. A new shape dependent drag correlation formula for non-spherical rough particles. Experiments and results. Powder Technol. 2015, 277, 222–230. [Google Scholar] [CrossRef]
- Wadell, H. The coefficient of resistance as a function of Reynolds number for solids of various shapes. J. Frankl. Inst. 1934, 217, 459–490. [Google Scholar] [CrossRef]
- Bouwman, A.M.; Bosma, J.C.; Vonk, P. Which shape factor(s) best describe granules. Powder Technol. 2004, 146, 66–72. [Google Scholar] [CrossRef]
- Corey, A.T. Influence of the Shape on the Fall Velocity of Sand Grains. Ph.D. Thesis, Colorado State University, Fort Collins, CO, USA, 1949. [Google Scholar]
- Williams, G.P. Particle roundness and surface texture effects on fall velocity. J. Sediment. Petrol. 1997, 36, 255–259. [Google Scholar] [CrossRef]
- Tran-Cong, S.; Gay, M.; Michaelides, E.E. Drag coefficients of irregularly shaped particles. Powder Technol. 2004, 139, 21–32. [Google Scholar] [CrossRef]
- Chien, S.F. Settling velocity of irregularly shaped particles. SPE Drill. Complet. 1994, 9, 281–289. [Google Scholar] [CrossRef]
- Yang, F.; Zeng, Y.H.; Huai, W.X. A new model for settling velocity of non-spherical particles. Environ. Sci. Pollut. Res. 2021, 28, 61636–61646. [Google Scholar] [CrossRef]
- Hölzer, A.; Sommerfeld, M. New simple correlation formula for the drag coefficient of non-spherical particles. Powder Technol. 2008, 184, 361–365. [Google Scholar] [CrossRef]
- Swamee, P.K.; Ojha, C.S.P. Drag coefficient and fall velocity of nonspherical particles. J. Hydraul. Eng. 1991, 117, 660–667. [Google Scholar] [CrossRef]
- Zhu, X.; Zeng, Y.H.; Huai, W.X. Settling velocity of non-spherical hydro-chorous seeds. Adv. Water Resour. 2017, 103, 99–107. [Google Scholar] [CrossRef]
- Li, Y.; Tang, B.; Jiao, S.; Su, Q. Snake Optimization-Based Variable-Step Multiscale Single Threshold Slope Entropy for Complexity Analysis of Signals. IEEE Trans. Instrum. Meas. 2023, 72, 6505313. [Google Scholar] [CrossRef]
- Yao, L.; Yuan, P.; Tsai, C.Y.; Zhang, T.; Lu, Y.; Ding, S. ESO: An Enhanced Snake Optimizer for Real-world Engineering Problems. Expert Syst. Appl. 2023, 230, 120594. [Google Scholar] [CrossRef]
- Maiti, S.B.; Bar, N.; Das, S.K. Terminal settling velocity of solids in the pseudoplastic non-Newtonian liquid system–Experiment and ANN modeling. Chem. Eng. J. Adv. 2021, 7, 100136. [Google Scholar] [CrossRef]
- Liu, J.; Hou, Z.; Xu, G. New Model for Non-Spherical Particles Drag Coefficients in Non-Newtonian Fluid. Processes 2022, 10, 1990. [Google Scholar] [CrossRef]
- Khan, A.R.; Richardson, J.F. The resistance to motion of a solid sphere in a fluid. Chem. Eng. Commun. 1987, 62, 135–150. [Google Scholar] [CrossRef]
- Cheng, N.S. Comparison of formulas for drag coefficient and settling velocity of spherical particles. Powder Technol. 2009, 189, 395–398. [Google Scholar] [CrossRef]


| Fluid Type | Mass Concentration, % | Temperature, T °C | Density, kg/m3 | Consistency Index, K | Flow Behavior Index, n |
|---|---|---|---|---|---|
| CMC1 | 0.25 | 23.0 | 1001.2 | 0.0187 | 0.9032 |
| CMC2 | 0.5 | 22.0 | 1001.5 | 0.0805 | 0.7805 |
| CMC3 | 0.75 | 22.5 | 1001.7 | 0.0642 | 0.7011 |
| CMC4 | 1 | 21.5 | 1002 | 0.5104 | 0.6562 |
| CMC5 | 1.25 | 22.0 | 1002.8 | 1.1247 | 0.5914 |
| CMC6 | 1.5 | 23.2 | 1003 | 1.8019 | 0.5604 |
| CMC7 | 1.75 | 22.7 | 1003.5 | 2.9412 | 0.5198 |
| CMC8 | 2 | 22.1 | 1005 | 4.7646 | 0.4806 |
| Material Type | Particle Size dA, mm | Density ρs, kg/m3 | Circularity c |
|---|---|---|---|
| Steel | 1,2,3,4,5 | 7930 | 1 |
| Zirconia | 1,2,3,4,5 | 6080 | 1 |
| Glass | 1,2,3,4,5 | 2500 | 1 |
| Quartz sand particle | 1.64–5.8 | 2600 | 0.49~1 |
| Author | CD-Res-p Empirical Correlations | Equation |
|---|---|---|
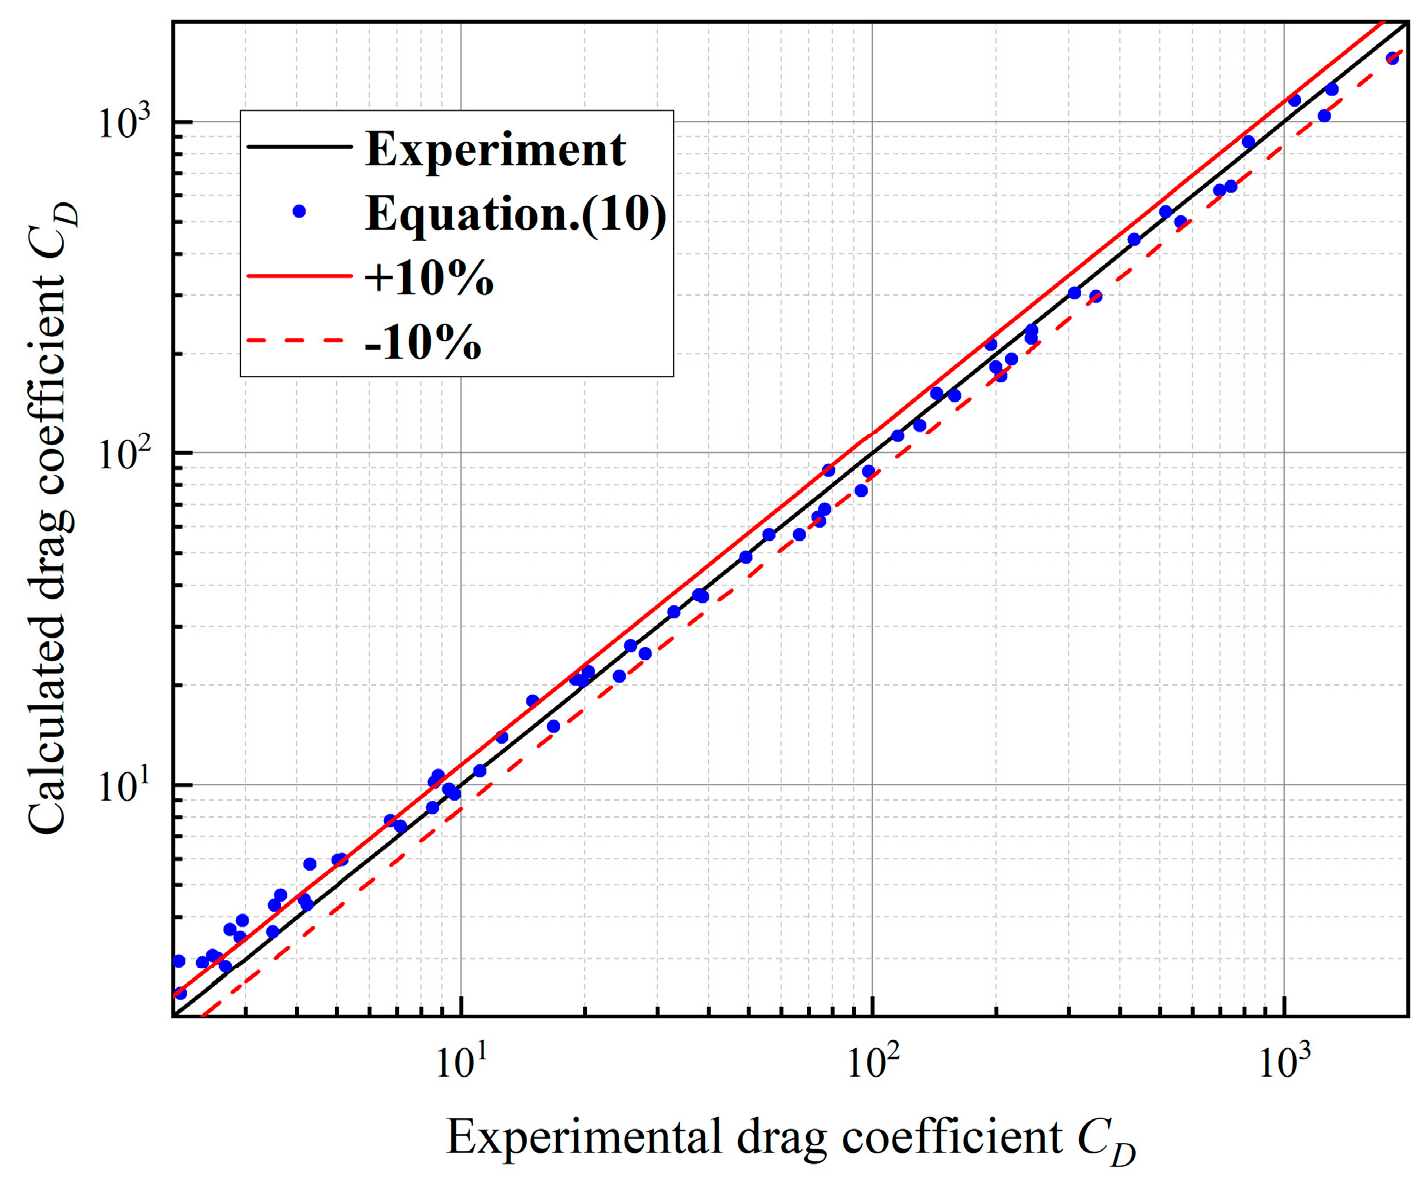
| Khan and Richadson | (10) | |
| Kelessidis and Mpandelis | (11) | |
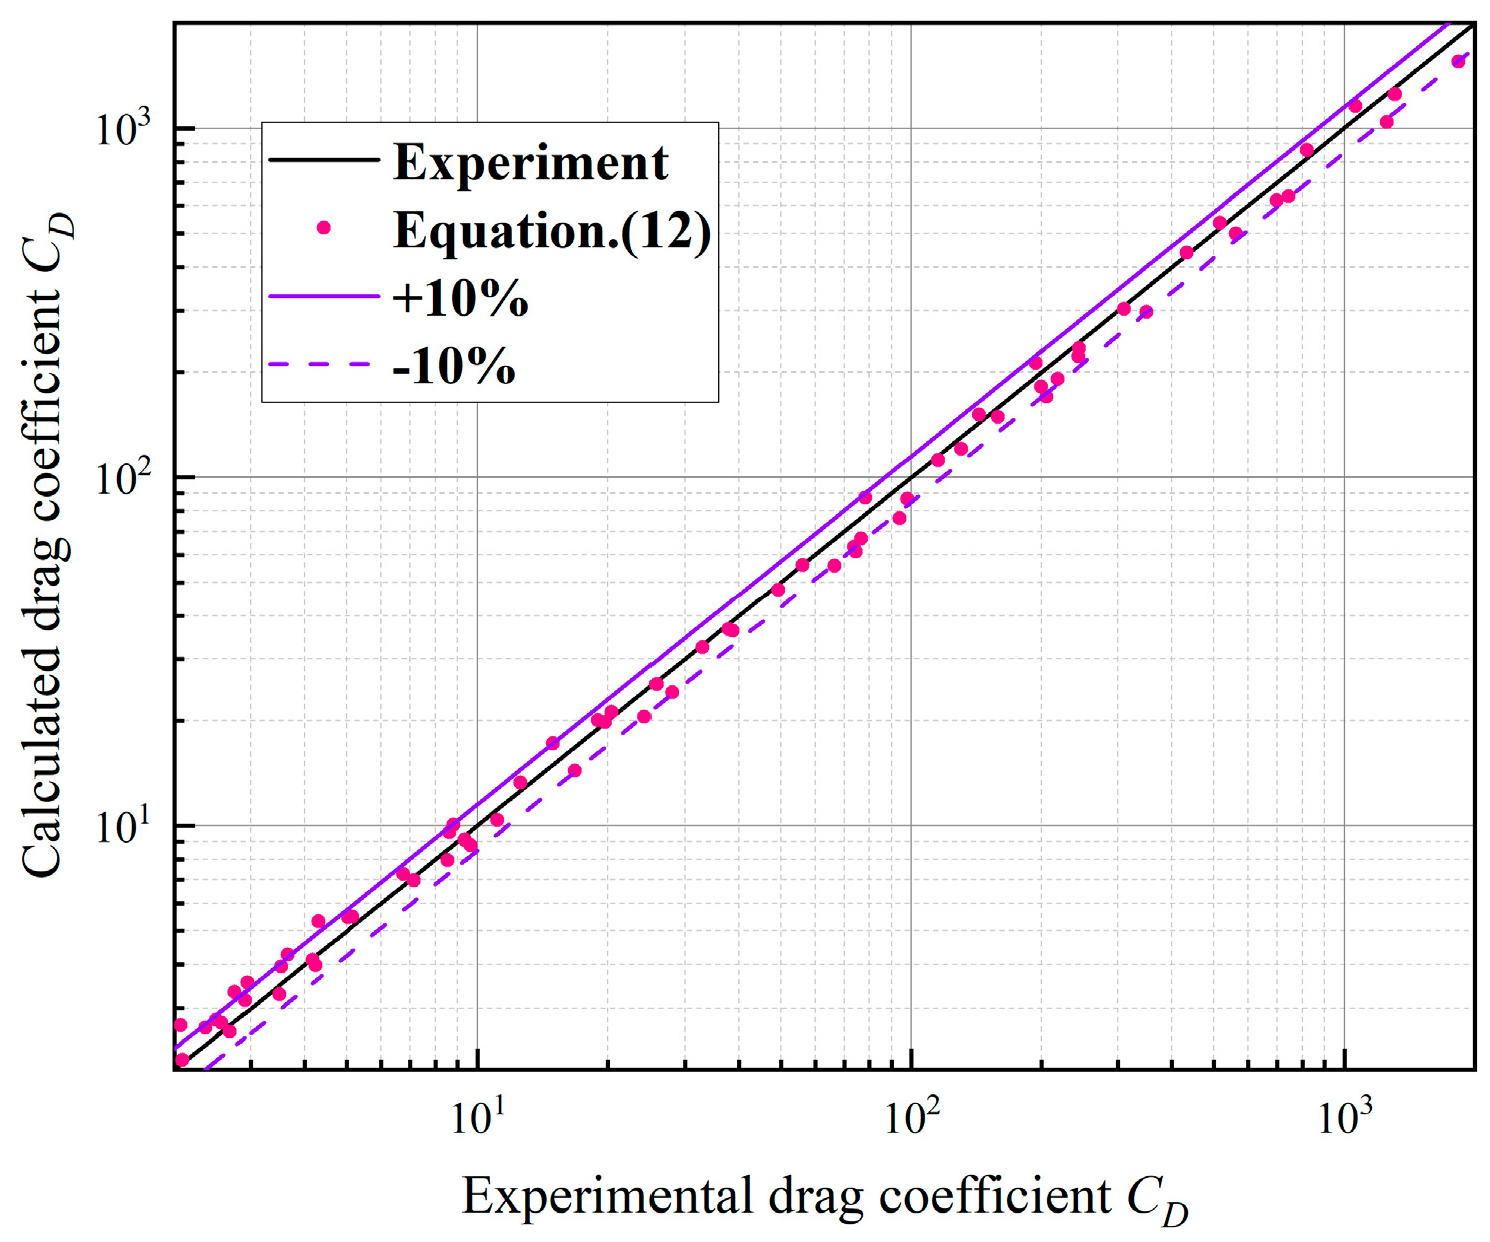
| Cheng | (12) |
| A | B | C | D | E |
|---|---|---|---|---|
| 0.16 | 0.498 | 0.422 | 0.129 | 0.072 |
| Res-p | Author | Error | ||
|---|---|---|---|---|
| MRE | RMSLE | Max MRE | ||
| 0.001 < Res-p < 373 | Khan and Richadson | 9.66% | 11.27% | 26.08% |
| Kelessidis and Mpandelis | 8.09% | 9.64% | 17.61% | |
| Cheng | 9.37% | 11.17% | 29.69% | |
| This chapter (Equation (14)) | 3.85% | 4.88% | 14.05% | |
| α | β | λ |
|---|---|---|
| 1.35 | 0.028 | 0.002 |
| Res-p | Error | ||
|---|---|---|---|
| MRE | RMSLE | Max MRE | |
| 0.001 < Res-p < 373 | 4.47% | 5.83% | 13.72% |
Disclaimer/Publisher’s Note: The statements, opinions and data contained in all publications are solely those of the individual author(s) and contributor(s) and not of MDPI and/or the editor(s). MDPI and/or the editor(s) disclaim responsibility for any injury to people or property resulting from any ideas, methods, instructions or products referred to in the content. |
© 2023 by the authors. Licensee MDPI, Basel, Switzerland. This article is an open access article distributed under the terms and conditions of the Creative Commons Attribution (CC BY) license (https://creativecommons.org/licenses/by/4.0/).
Share and Cite
Hou, Z.; Jiang, E.; Chen, Y.; Wang, H.; Feng, J.; Tao, X. A Novel Prediction Model of the Drag Coefficient of Irregular Particles in Power-Law Fluids. Processes 2023, 11, 3213. https://doi.org/10.3390/pr11113213
Hou Z, Jiang E, Chen Y, Wang H, Feng J, Tao X. A Novel Prediction Model of the Drag Coefficient of Irregular Particles in Power-Law Fluids. Processes. 2023; 11(11):3213. https://doi.org/10.3390/pr11113213
Chicago/Turabian StyleHou, Zhaokai, Enyuan Jiang, Ye Chen, Huaishan Wang, Jinyu Feng, and Xutao Tao. 2023. "A Novel Prediction Model of the Drag Coefficient of Irregular Particles in Power-Law Fluids" Processes 11, no. 11: 3213. https://doi.org/10.3390/pr11113213
APA StyleHou, Z., Jiang, E., Chen, Y., Wang, H., Feng, J., & Tao, X. (2023). A Novel Prediction Model of the Drag Coefficient of Irregular Particles in Power-Law Fluids. Processes, 11(11), 3213. https://doi.org/10.3390/pr11113213