1. Introduction
Gold is valued highly, not only for its appearance, but also for its rarity, utility and material properties. It is an indispensable and important material in various fields. Traditionally, in the past, gold was used to make coins, jewellery and various precious alloys. In modern industry, gold is also used in medicine for the purposes of diagnosing diseases, dentistry, the aviation industry and electronics [
1]. Recently, we have seen an exponential increase in the number of publications of scientific works, especially in the field of gold nanoparticles (AuNPs), which have special properties [
2].
In recent years, AuNPs, due to their unique properties, have also gained an important role in the field of diagnostics. During the coronavirus pandemic, humanity was forced to face severe financial and life losses. It has become apparent that rapid and sensitive virus diagnostics are crucially important in controlling the spread of a pandemic before vaccines and effective treatments are available. AuNP-based rapid antigen tests were developed in the absence of a means to test for virus infection efficiently [
3,
4,
5,
6]. Namely, AuNPs play the role of a marker in rapid tests that confirm the presence of the SARS-CoV-2 virus in the mucous membrane of a patient or in asymptomatic carriers. With the increasing need for rapid antigen tests, the amount of waste subjected to incineration has also increased substantially. With the incineration of one million rapid tests containing AuNPs, we threw away 0.1 g of gold and about 5 tons of plastic. This represents an estimated value of EUR 15,000 [
7].
Considering the amount of used and discarded rapid antigen tests, the idea of reusing individual components was developed, according to the rules of the circular economy concept. In the article we investigated the possibility of their reuse through the process of recycling and restoring existing materials for other products [
8]. By separating the materials of the rapid antigen tests, the plastics of the housings could be reused for the housings of electrical installations, and the AuNPs in cosmetic or optical products [
7].
A fluid bed device usually consists of a pipe with an inserted distribution plate, on which a bed of particulate solids is positioned that we want to fluidise. At the bottom of the pipe is the liquid (gas) inlet, which passes through the distribution plate and the bed of particles, and exits at the top of the device through a gas outlet [
9].
A fluidised bed is, therefore, a physical phenomenon in which solid particles, which, in their original state, lie motionless on the distribution plate, begin to behave like a liquid, or float due to the passage of a liquid over them at a certain critical velocity [
9,
10,
11].
The particles become fluidised when the upward oriented fluid produces a drag force high enough to overcome the downward oriented gravitational force. The drag force is the frictional force that a fluid exerts on a particle; the particle exerts an equal and oppositely directed force on the fluid. The particles become fluidised when the velocity of the fluid is high enough that the drag force on the particle is equal to its weight. The velocity at which this happens, is called the minimum fluidization velocity [
12,
13].
In our case, the ground material that we want to fluidise consists of particles of antigen test cases and test strips on which the AuNPs are located.
The behaviour of particulate solids in the fluidized bed is affected by their properties, such as density, size, shape and distribution. The roughness of the particles and the proportion of voids in between them should also be taken into account in fluid–particle interactions [
9,
10,
11,
12,
13,
14,
15,
16].
For gas–solid systems, we know at least six distinct regimes that can be observed experimentally: fixed bed, particulate fluidization, bubbling fluidization, the merging of bubbles, turbulent fluidization and fast fluidization or pneumatic transport. The aim of the research work was to achieve a floating state of the particles of the casings, and the pneumatic transport of the test strip particles to a further cyclone, where they would be removed from the air [
14,
15,
16].
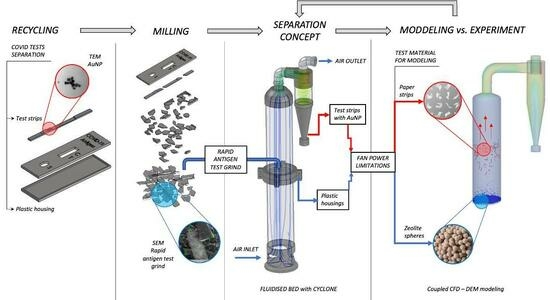
The aim of the research work was to separate the test strips of rapid antigen tests, on which the AuNPs are located, successfully from the plastic casings. In the development phase of the recycling procedure, it was necessary to determine the method of separation and which grind was the most suitable for it. After successful separation, it was necessary to determine the presence of AuNPs on the test strips. In the research we therefore dealt with the possibility of the reconstruction of a fluid bed device for the purpose of the separation of the grind, and the establishment of an appropriate coupled CFD (computational fluid dynamics) and DEM (discrete element method) numerical model, which we verified with an experiment.
2. Materials and Methods
2.1. Material Preparation
The rapid antigen tests were ground using a cutting mill SM 200 (Retsch GmbH, Haan, Germany) with three different sieves: two with circular openings with sizes of 4 mm and 9 mm, and one with an oval opening (3 cm × 1.5 cm). Sample 1 was prepared using the sieve with 4 mm openings, sample 2 using the sieve with 9 mm openings, and sample 3 using the sieve with the oval openings. In total, 1200 g of rapid antigen tests were ground, 400 g with each sieve. Used and contaminated antigen tests were processed accordingly and decontaminated with a thermal procedure. The decontamination was carried out before grinding and further sieving or fluidised bed processing, so that the material used for separation did not pose a health risk. In addition, the fluidised bed system used later for separation was designed to operate under negative pressure, so that potential contaminants were kept in the system as much as possible.
2.2. Sieve Analysis
The sieve analysis was conducted on an AS 200 CONTROL (Retsch GmbH, Haan, Germany). Sieves were used with openings with sizes 4 mm, 2 mm, 1 mm, 500 μm, 250 μm and 125 μm.
Three repetitions were made for each sample. The sieving parameters were as follows: sample mass: 100 g, sieving time: 15 min, amplitude 1.00 mm.
2.3. Density Measurements
The densities of the rapid antigen test housing and the test strip were measured using a gas pycnometer Ultrapyc 5000 (Anton Paar, Graz, Austria). The measurements were carried out at 20.00 °C, using helium at 0.70 bar until the last three conducted measurements had a variance below 0.05%.
2.4. Characterisation
2.4.1. X-ray Fluorescence Spectrometry (XRF)
The X-ray fluorescence spectrometry (XRF) was conducted with an X-MET 8000 (Hitachi, Tokyo, Japan) on the samples of the sieve analysis. Three measurements were performed on each measured sample.
2.4.2. Scanning Electron Microscopy (SEM)
Three samples were prepared for scanning electron microscopy (SEM). We carried out an experiment, in which we poured 100 g of ground rapid antigen tests (sample 2) into the fluid bed device and fluidised them for 5 min. In the device, the cyclone was replaced by a cartridge filter, which was inserted into the lid of the fluid bed device. The first sample for microscopy was taken from the pile of particles before the experiment, and the second sample was taken after 5 min of fluidization. The third sample was represented by particles that had accumulated on the cartridge filter during the operation of the device.
An FEI Quanta 200 3D microscope (FEI Technologies Inc., Hillsboro, OR, USA) was used for imaging. The samples were glued to a graphite tape, and the microscopy was performed in a low vacuum (60 Pa), at a voltage of 10 kV and at different magnifications, at a current aperture of 0.45 nA, at variable working distances. A large field detector (LFD) was used, for which the particles in the sample did not need to be conductive.
2.4.3. Energy Dispersive X-ray Spectroscopy (EDX)
EDX analysis was performed on the three samples described in the previous chapter, namely:
Sample 2.1: grindings before fluidization,
Sample 2.2: grindings after fluidization,
Sample 2.3: particles from the filter.
2.4.4. Transmission Electron Microscopy (TEM)
We analysed a test strip sample from the LFIA rapid antigen tests. The sample for microscopy was prepared by the droplet deposition method, according to the following procedure:
A test strip sample was taken from the LFIA rapid antigen Test;
The sample was treated in a centrifuge filled with pure ethanol;
The ethanol and sample solution were applied to the TEM grid with a dropper and left in the desiccator overnight to dry.
The sample was analysed with a JEM-2100HR (JEOL, Tokyo, Japan) transmission electron microscope at an accelerating voltage of 200 kV, which did not damage the sample. The probe size was 10 nm or 25 nm, at 100,000× magnification.
2.5. Separation with a Fluid Bed Device
Due to the complexity of simulating the ground particles and the limitation of the fan power, we tested the separation concept on a mixture of zeolite spheres and paper strips. Zeolite spheres with a density of 770 kg/m3 and a diameter between 2 and 4 mm were used, as well as paper strips of different lengths, with widths of 3.2 mm, thicknesses of 0.1 mm and densities of 800 kg/m3. Due to the limitation of the fan flow rate and significant pressure drops along the system, the experiment was conducted at the maximum possible mass flow, which was 0.03828 kg/s.
In the first part of the experiment, the separation process was tested on paper strips in order of size, which represents the majority of the mass fraction of the sieve analysis (4–2 mm). This size class also corresponds to the dimensions of the zeolite spheres.
The amount of zeolite spheres and paper strips used in the experiment was determined by calculating the ratio of the mass of test strips and plastic cases of rapid antigen tests, so that the ratio of one component to the other was the same in both cases.
The mixture of spheres and paper strips was positioned onto the mesh in the fluid bed device, and the device was left to operate for 4 min. The mass of the separated paper strips in the cyclone were measured after 4 min.
In the second part of the experiment, we determined the influence of the paper strip size on the separation process efficiency. We tested the concept on paper strips of three different lengths (3, 2 and 1 cm), with widths of 3.2 mm and thicknesses of 0.1 mm. We placed 300 g of zeolite spheres and 1.5 g of paper strips onto an aluminium wire mesh in the fluid bed device and observed what happened to them during the operation of the device. We left the device to operate for 5 min and then checked the amount of separated paper strips in the cyclone. The efficiency of the separation process was determined by the mass of separated paper strips.
2.6. Coupled Numerical Simulation
The numerical simulation consisted of a coupled simulation CFD, using Ansys Fluent, and DEM using Ansys Rocky. To simplify the numerical simulation and reduce the time needed to complete the calculations, the separation process simulation was completed for the separation process of zeolite spheres and paper strips. The way the coupling was implemented allowed both solvers, the DEM solver and the CFD solver, to work in parallel. Several CPU processors were used to solve the fluid phase, and several GPU processors were used to solve the particle phase.
2.6.1. Computational Fluid Dynamics
Transport phenomena in fluids are described by physical laws that are independent of the state and nature of the substance. The laws apply to the mass system; they are subject to the conservation of the mass of matter, whose state is determined by a finite number of state variables. The governing equations in the form of systems of equations describe the fundamental physical laws of fluid flow in nature. In the analysis of fluid dynamics, the equations that are solved are conservation laws for mass and momentum. The equation for the conservation of mass (continuity equation) is written as follows:
The balance of momentum is described by:
where
represents the gravitational force. The stress tensor
is given by:
where
I is the unit tensor.
Geometry and computational mesh
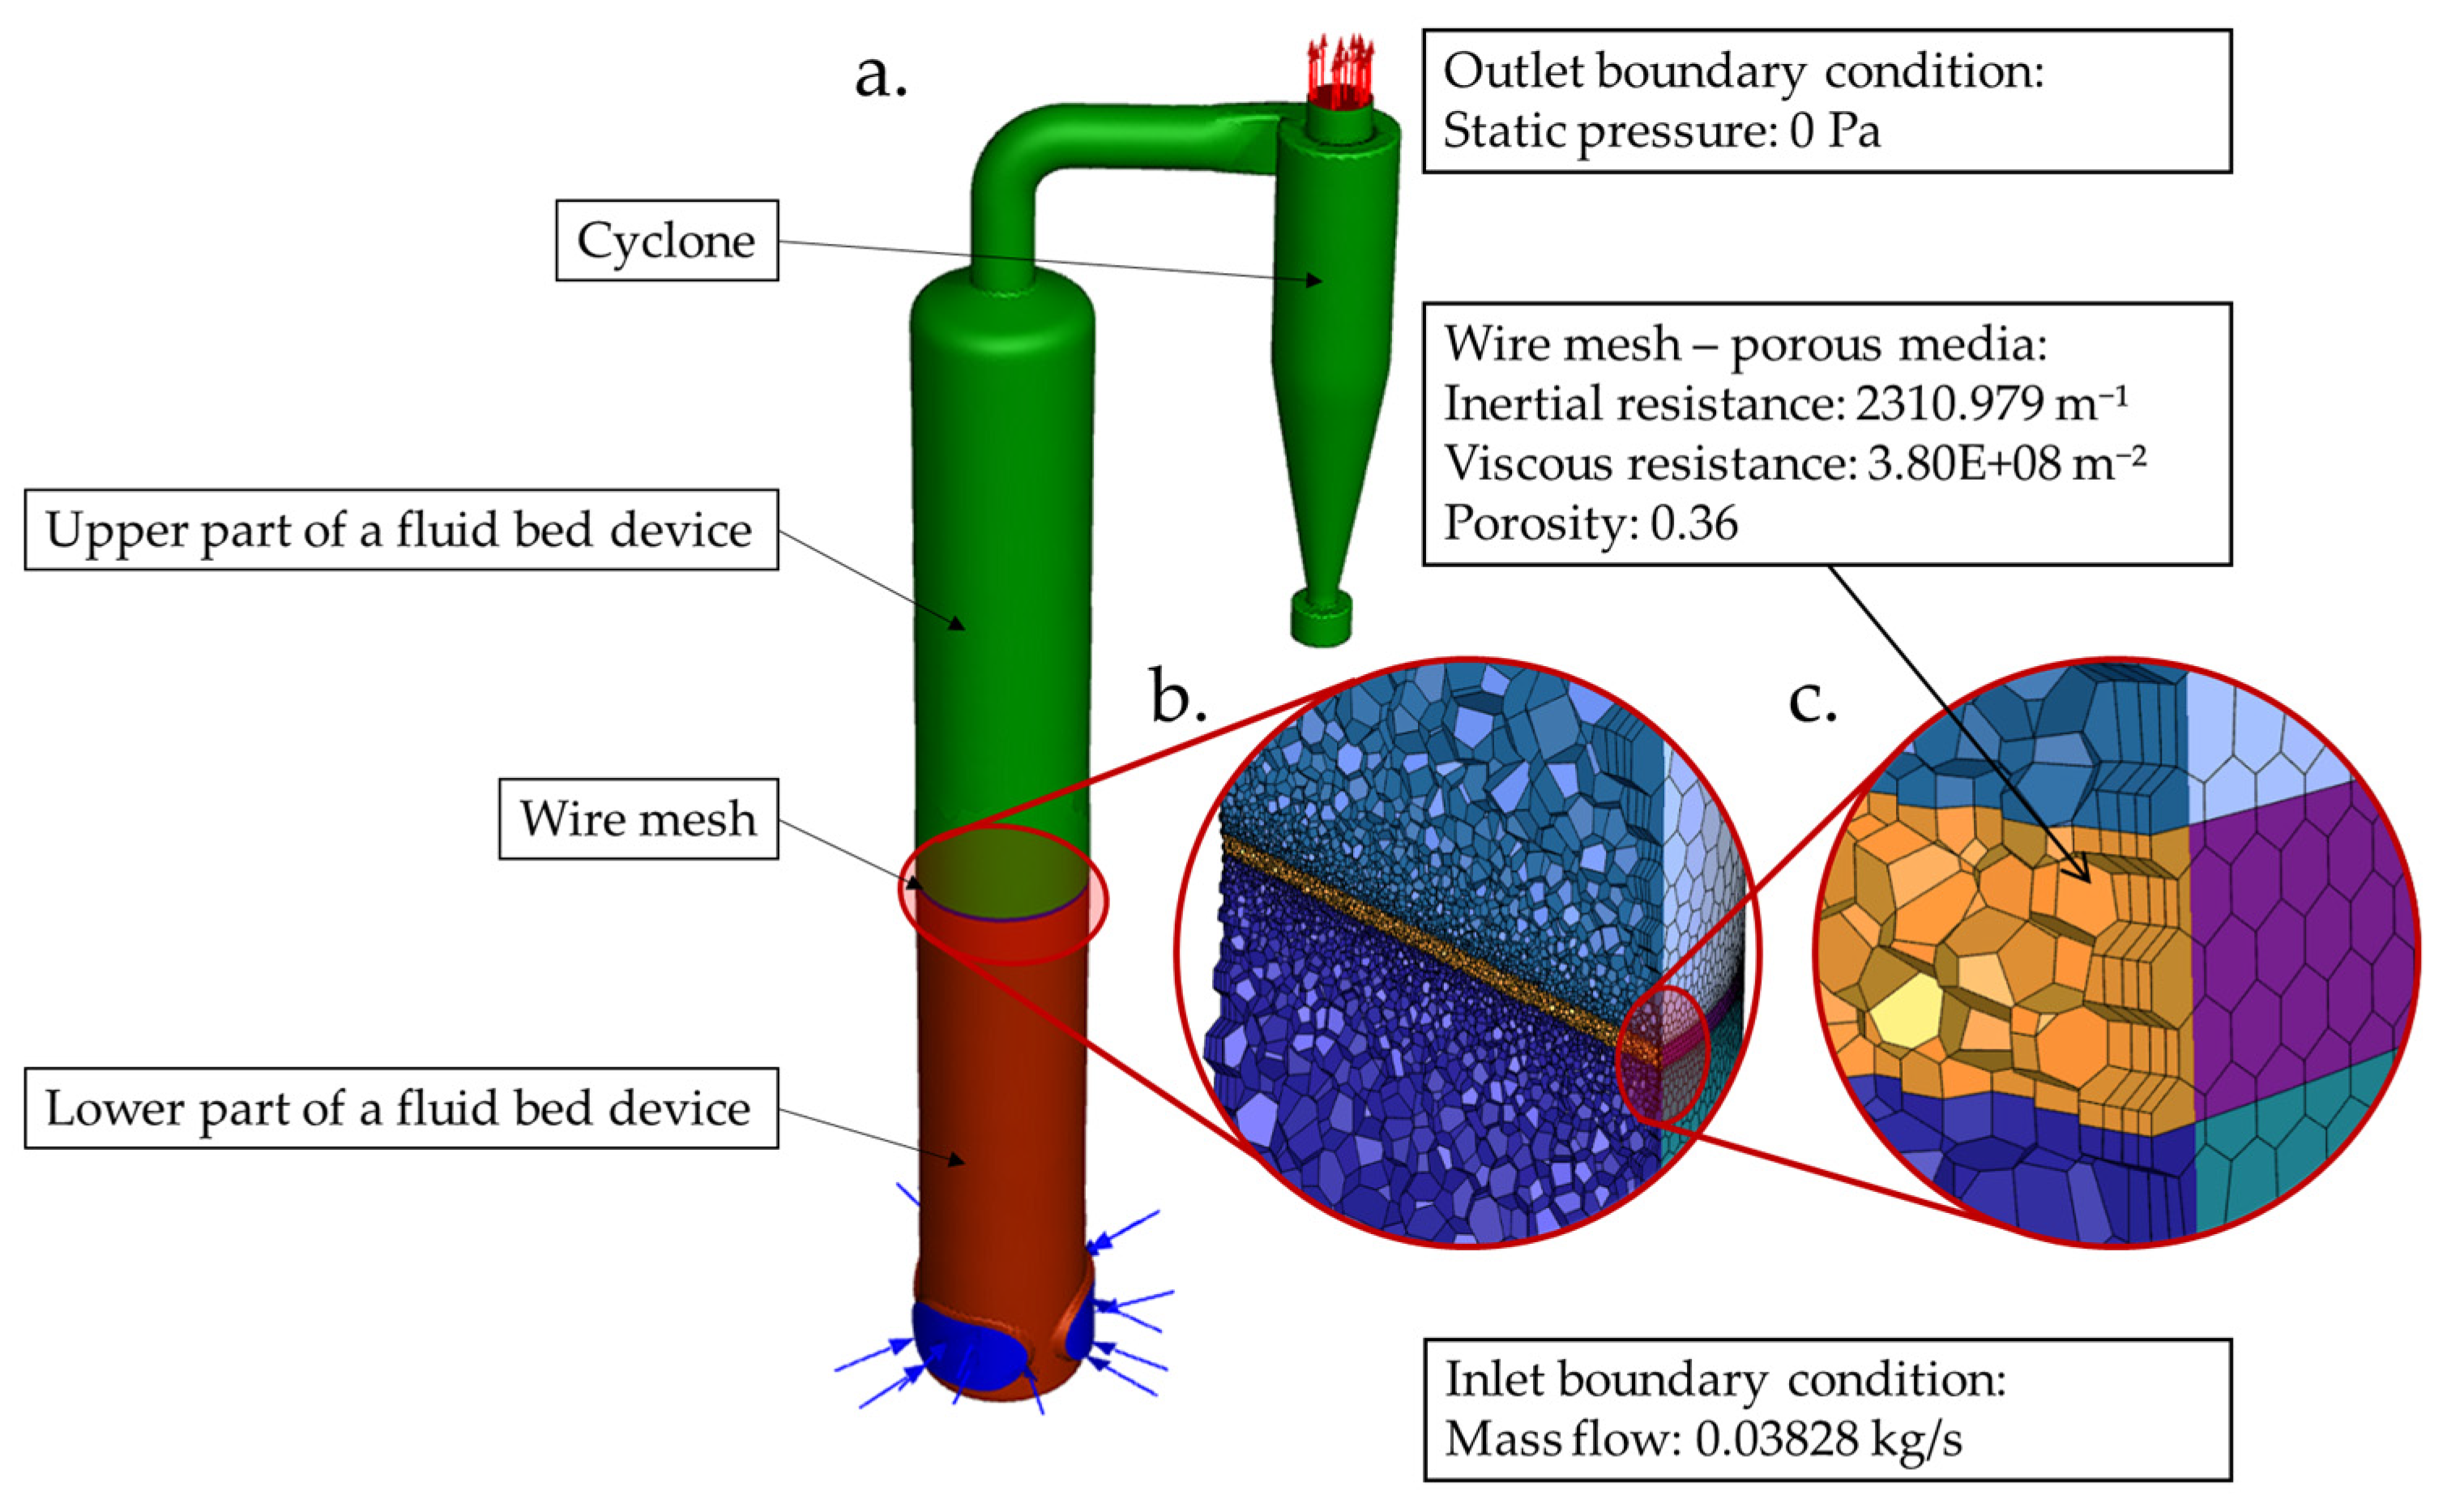
The simulation geometry consists of the lower part of the fluid bed device, the upper part of the fluid bed device, the cyclone and the wire mesh, where the ground material rests (
Figure 1). The upper and lower parts of the fluid bed device were each 450 mm long in height (total 900 mm), with an inner diameter of 144 mm, and can be seen in
Figure 1. To assess numerical accuracy, three computational mesh densities were created, resulting in a final mesh with 230,000 elements. The coarse mesh had 230,000 elements, the medium 690,000 and the dense 1,600,000 elements, in all cases with a mesh boundary layer on the walls. Based on the results obtained, a Richardson extrapolation was performed, comparing the predicted pressure values in the drying upper part of the fluid bed device. The element size ratio for the dense and medium meshes was 1.3 and 1.4 for the medium and coarse meshes, respectively, resulting in a GCI (grid convergence index) of 0.9% between the fine and medium meshes, and 1.2% between the medium and coarse meshes. Since the differences between all the considered grids were almost negligible, a coarse grid was chosen for the final calculations. The convergence criterion was set to 10
−5 to obtain the mass and momentum, for three different meshes.
Simulation setup
The ANSYS Fluent code [
17] was used with the SIMPLE algorithm to describe the transport of the gas phase through the system. The PRESTO algorithm (PRESsure Staggering Option) was used to discretise the pressure, with a second order discretisation scheme. For turbulence description, a two-equation realisable k-epsilon model with a scalable wall function was applied in the modelling. The boundary conditions were given at the inlet to the fluid bed, where the mass flow of air was prescribed at 15 °C—0.03828 kg/s. A Gauge pressure of 0 Pa was prescribed on the outlet. All the walls were modelled as no-slip walls. The boundary conditions can be seen in
Figure 1.
The wire mesh between the lower and upper parts of the fluid bed device consisted of dense perforation, which are, in larger scale simulations, often replaced by some type of porosity model in order to reduce calculation time. These models act as a momentum sink on the specified volume or surface, which blocks a part of fluid from passing through, depending on the equivalent pressure difference caused by the drum perforations. A porous media model was chosen in this case, which requires two input parameters when viscous effects are neglected: an inertial resistance coefficient and a viscous resistance coefficient, which approximate the pressure difference due to the inertial and viscosity effects. In order to determine the inertial and viscous resistance coefficients, multiple simulations were performed on a smaller part of the wire mesh geometry of the actual wire area, where pressure differences were observed depending on the different inlet velocities. A polynomial function was then fitted to acquire the inertial and viscous resistance coefficients [
17,
18]. The inertial resistance coefficient was 2310.979 m
−1, the viscous resistance coefficient was 3.80 × 10
8 m
−2 and the porosity of the wire mesh was 0.36.
2.6.2. Discrete Element Method
Discrete element method (DEM) simulations are often based on particle material calibrations, where, depending on the type of material behaviour, the material properties in simulations such as coefficient of restitution and friction are being varied and adjusted to match particle behaviour visually in experiments [
19,
20]. This is due mostly to the inaccuracies of DEM models, particularly in situations where the particles are bumping into each other more frequently [
21]. Since the main goal of this work is to analyse the effects of air on the discrete phase, the exact properties of individual materials will not be analysed, due to the limited scope of this project, and they will be chosen to match the properties of the observed materials approximately [
22]. The DEM simulation was therefore focused on modelling various processes which are crucial for the fluidised beds, which, in our case, includes two types of particle movement modelling, as well as modelling interactions between the particles and air phase in the system.
Coupled simulation was realised using a coupling interface between Rocky and Ansys Fluent running in the background [
23]. The two-way coupling algorithm performs the data exchange between DEM and CFD at the beginning of each CFD time step. This means that both solvers work continuously with each other’s previous results, i.e., DEM uses the CFD solution from the previous time step to calculate momentum exchange with the fluid, while CFD uses the DEM solution from the previous time step to integrate the governing equations up to the next time step. This coupling approach is numerically and computationally efficient, as it reduces both the number of exchanges and potential delays that can occur when one of the solvers stops to wait for the other to finish its task. However, this approach can lead to some instabilities if an inappropriate time step is chosen. Since the required DEM time steps are usually much smaller than CFD time steps, the DEM program usually needs to calculate multiple time steps for a single CFD time step. This can sometimes lead to physical inconsistencies, especially in cases where the CFD–DEM time step ratio exceeds the optimal ratio (1:10) greatly. The geometries in both programs were synchronised relative to their coordinate system origin. The particle interactions are calculated entirely using DEM’s chosen contact models.
In the DEM, all particles within the computational domain are tracked according to the Lagrangian principle by solving Euler’s first and second laws explicitly, which determine the translational and rotational particle motions, respectively:
where
is the particle mass,
is the particle velocity vector,
is the gravitational acceleration vector,
is the contact force that accounts for particle–particle and particle–wall interactions,
is the angular velocity vector,
is its moment of inertia tensor, and
is the net torque generated by tangential forces that causes the rotation of the particle. According to the fluid interaction, two additional terms appear when DEM is coupled to CFD simulation:
is the additional force accounting for the interaction with the fluid phase and
is the additional torque due to the fluid phase’s velocity gradient.
Geometry for particle domain
The discrete element method (DEM) simulation was undertaken using only the upper part of the fluid bed geometry with the cyclone. The computations were undertaken using the domain size described previously in
Section 2.6.1.
Simulation setup
The particles used in the discrete element method (DEM) were zeolite spheres and paper strips. The zeolite spheres had the density of 770 kg/m
3 and a diameter with a cumulative distribution between 2 mm and 4 mm. The paper strips’ dimensions were 20 mm × 3.2 mm × 0.1 mm and had a density of 800 kg/m
3. For the zeolite spheres and paper strips, the Huilin and Gidaspow drag model and Ganser drag model were used, respectively [
24].
3. Results and Discussion
3.1. Sieve Analysis
We obtained data on the particle size distribution of ground particles of three different samples ground in different mills using the sieve analysis.
Figure 2 shows the size distribution of the individual samples of the sieve analysis. We came to the conclusion that the most uniform distribution of the particle size was in sample 1, which was ground on a Granulator GRS 183 A9 mill (DIPRE New technology, San Giorgio delle Pertiche, Italy). The majority share (76.93 wt%) of the ground material in sample 1 is represented by particles in the size class between 4 and 2 mm.
3.2. Density Measurements
The measured density of the rapid antigen test cases was 1035 kg/m3, and the density of the test strips was 1277 kg/m3. The gas pycnometry provided us with an insight into the density of individual components of the rapid antigen tests. We found that the test strip had a higher density than the casing, from which we can infer that, compared to the test cases, a larger surface area of test strips is required for successful separation with a fluid bed device.
3.3. X-ray Fluorescence Spectrometry (XRF)
Gold was identified in samples of the smaller size classes (below 500 μm). The average Au content was 124.66 ppm per size class; the minimum detected value was 101 ppm, and the maximum was 158 ppm, as shown in
Table 1. Silver was also detected in the samples of smaller size classes, which is most likely the result of impurities in the grinding process.
3.4. Scanning Electron Microscopy (SEM)
Figure 3 shows microscopic images of all three samples.
Figure 3b–e shows the membrane structure of the test strips. We can see that they have a rectangular shape, their width varies between 3.1 and 3.2 mm, and their length varies. We cannot define the shape of the grindings of the plastic casings, as it was different for each particle. Fracture surfaces can be observed on their edges, which are characteristic of a brittle fracture. Cracks can also be observed on some particles that extend into the interior and would most likely lead to disintegration into smaller particles during the fluidization process.
3.5. Energy Dispersive X-ray Spectroscopy (EDX)
EDX microchemical analysis of the ground samples’ composition revealed that the ground particles were composed mostly of carbon (average 50–60 wt%) and oxygen (average 30–40 wt%). Sodium, chlorine, silicon, calcium and phosphorus were also present in the ground particles (up to 10–20 wt%). The analysis also showed traces of aluminium, magnesium, chromium, titanium and iron, which are most likely the result of impurities introduced during the grinding process. We did not detect any gold in the bulk ground samples of the plastic casings and ground pieces by EDX analysis at low magnifications. The gold content and AuNPs were detected in the test strip membranes at higher magnifications, visible as white dots in the electron image, due to the high atomic number of gold compared to the test strip background (
Figure 3).
3.6. Transmission Electron Microscopy (TEM)
Using TEM microscopy, spherically and irregularly shaped AuNPs with sizes between 10 and 50 nm were found (
Figure 4). The EDX analysis confirmed the presence of Au in the nanoparticles on the membranes of the rapid antigen tests. The confirmed presence of AuNPs shows that the separated test strips from the fluid bed device are usable in further steps of recycling the nanogold from a large number of waste rapid antigen tests and reusing this material in new applications. An example of the process of separating the AuNPs from the tests strips and reusing the gold was described in a previous research [
25].
3.7. Separation Process Experiment Using a Fluid Bed Device and Cyclone System
3.7.1. Separation Process Using the Paper Strips of the Size Class of the Ground Material
The separation process of the mixture of paper strips and zeolite spheres was found to be efficient. Within 4 min of device operation, 65.5% of the total weight of inserted paper strips was separated from the mixture. We assume that the entire amount of paper strips would be removed with a longer operating time.
3.7.2. The Effect of Paper Strip Size on the Efficiency of the Separation Process
In the second part of the experiment, we studied the effect of the paper strip size on the efficiency of the separation process. The experiment was performed with paper strips of three different lengths, namely 1, 2 and 3 centimetres. The results of the experiment are shown in
Table 2.
The obtained data have shown that the efficiency of the separation process was the highest in the case of paper strips with a length of 1 cm. We can conclude that the efficiency of the separation process increases as the paper strips’ length decreases.
3.8. Numerical Simulation
From a coupled CFD–DEM simulation we see the coupled kinetic of air and particles in the fluid bed device, which is shown in
Figure 5 at different time steps.
From the time evolution of particle behaviour, we can see the paper strips begin to rise and travel towards the top of the fluid bed device and into the cyclone, where they are eliminated from the air. Meanwhile, the zeolite spheres bounce around at the bottom of the device. The separation process in the numerical simulation takes place in less than 1 s.
By comparing the results of the coupled simulation of air flow and particles with the results of the experiment, we can see that, because we did not take into account the deformation of the paper strips but simulated them as rigid particles, there was a deviance of particle entrainment in the experiment. During the experiment it was possible to see that the paper strips were deformed, causing them to have less air resistance and travel through the device more slowly. The reason for this is that the paper strips in the experiment are not rigid. This means that the paper strips have been folded, and therefore the projection surface on which the air flows is smaller. Accordingly, the drag force on the paper strips is lower, as they are not folded. During the experiment, the zeolite particles moved up along the walls of the device, while the particles in the middle of the fluidised bed were very low or did not rise from the bed of particles positioned on the mesh at all. We assume that this was due to the deflection of the aluminium mesh under the weight of the packed bed of particles, which makes the bed thicker in the middle of the device. The air penetrates through the thicker layer of particles with difficulty, which results in a local increase in velocity alongside the walls of the device, as the air flow avoids the thicker layer and flows in a greater proportion along the walls of the device. In the case of the numerical model, the airflow field is uniform throughout the entire diameter of the device, since the aluminium mesh in the numerical model is non-deformable and does not bend in the middle. Therefore, the particles do not come to a standstill in the middle of the device but are in a state of floating regime throughout the cross-section above the mesh and bounce up and down continuously. The result of a more ideal fluidization of zeolite particles in the simulation thus contributes to a better separation of paper strips, which then travel further into the cyclone. According to these simulation results, the aluminium mesh is replaced by another, stiffer mesh, which leads to more stable fluidisation and a higher separation efficiency. The difference between the simulation and the reality of the process is most likely also in the air mass flow, as we failed to ensure complete airtightness of the device.
4. Conclusions
Using a set of experimental techniques, we obtained information about the ground particles of rapid antigen tests. Data on the particle size classes were obtained using sieve analysis, data on their shapes were obtained using SEM, and their elemental composition was checked using EDX analysis. The presence of gold in the grind was confirmed by XRF analysis; it was detected in particles of smaller size classes (below 500 μm).
The presence of gold on the test strips in the form of nanoparticles was confirmed by TEM, and spherical and irregular AuNPs were found between 10 and 50 nm in size. Intact AuNPs on the test strips support the use of the fluid bed device for rapid antigen test material separation and the recycling of nanogold from a large number of waste rapid antigen tests.
The separation of the test strips of rapid antigen tests, on which AuNPs are located, from the plastic cases can be ensured by reconstructing and upgrading the fluid bed device with a cyclone.
We simplified the separation process and tested it on a mixture of zeolite spheres and paper strips. The separation concept proved to be successful, as 65.5% of the total weight of inserted paper strips was separated from the mixture within 4 min of operation of the reconstructed device. We found that the efficiency of the separation process increased with a decrease in the particle size.
We did not achieve the set goal of numerical modelling of the coupled airflow and ground particles of rapid antigen tests. Due to the complexity of simulating the shape of the ground particles (the shape of the plastic particles) we had to simplify the model. We set up a numerical model of a mixture of spherical zeolite spheres and paper strips successfully, which confirmed the adequacy of the concept of the separation process.
Further experimental work would be necessary to determine the adequacy of the process when using the rapid antigen test grind.
A better match between simulation and experiment results could be achieved with a more accurate extended numerical model of deformable paper strips and a deformable mesh. The paper strips were described as rigid particles in the simulation, so they did not deform. Also, in the numerical model, we did not take into account the electrical charge of the walls of the device (additional forces on the walls of the model), which caused the particles to “stick” to them. The experiment could be improved further by providing better airtightness of the device. The results of the experiment could be improved further by performing the experiment several times and determining the confidence interval of the measured values, due to the repeatability of the experiment.


