Article

The Effect of Reverse Sorption on an Extraction Kinetics Melanin Case

by
Igor Lomovskiy
1,
Aleksey Kiryanov
1,2,* and
Tatiana Skripkina
1
1
Laboratory of Mechanochemistry, Institute of Solid State Chemistry and Mechanochemistry SB RAS, 630090 Novosibirsk, Russia
2
Department of Chemical Materials Science, Faculty of Natural Sciences, Novosibirsk State University, 630090 Novosibirsk, Russia
*
Author to whom correspondence should be addressed.
Processes 2023, 11(11), 3192; https://doi.org/10.3390/pr11113192
Submission received: 5 October 2023 / Revised: 19 October 2023 / Accepted: 3 November 2023 / Published: 8 November 2023

Abstract

:
Research into extraction kinetics is one of the crucial factors in a technological process. Extraction is used predominantly when working with organic feedstock. The study of the kinetics of extraction of a substance is a complex process, which is influenced by a large number of factors. This paper presents an analysis of one of these factors, namely the influence of reverse sorption on the process of substance release from the matrix. Sorption can directly affect the intraparticle diffusion constants and, consequently, the rate of release of the substance. Using buckwheat husk as an example, its sorption capacity was assessed to assess the sorption factor on the rate of melanin release. To select the optimal parameters of the chemical process, the experiment was carried out at temperatures of 40, 50, and 60 degrees Celsius. The Axelrud and Baker–Lonsdale equations were used to describe the kinetic models.

1. Introduction

Melanin, one of the most abundant pigments, is a metabolic product in both plants and animals. Melanin has recently been detected in ancient fossil remnants of dinosaurs, early birds [1,2], and primitive cephalopods [3].
It is an endogenous compound and is characterized by extensive biochemistry and metabolic pathways [4]. Melanin per se and the products of its chemical modification are promising biologically active agents both for metabolic correction in healthy humans [5] and for treating certain diseases [6]. One of the most common causes of human cell damage is liver lipid oxidation. During this process, free radicals take electrons from the lipids of the cell membrane, which leads to the destruction of cells in the human body. Melanin, in turn, is able to inhibit lipid oxidation, thereby preventing damage to humans [7]. From a chemical standpoint, melanin is a poly-indolequinone biopolymer and exhibits unique physical and chemical properties for producing novel types of materials, stabilizing nanoparticles, and designing novel types of sensors [8].
Previously, melanin was isolated either from cuttlefish ink or dark hair/feathers of animals. However, the major problem in melanin production using these sources is that most melanin molecules are tightly bound to some cellular components such as proteins or minerals. Therefore, the melanin extraction procedure usually involves rough chemical treatment to completely remove the protein fraction, cell remnants, and unused nutrients [9].
There currently exists no certain extraction method suitable for all melanin types because of their chemical diversity in the biomass. Therefore, each melanin type requires an individual approach.
Animal melanin is extracted from keratin-containing raw material. However, a drawback of this method is that the resulting melanin contains a significant amount of peptides and sulfur, which unfavorably affects quality of the synthesized melanin [10].
There is an alternative method for melanin production, which is based on boiling keratin in the presence of enzymes. However, at the industrial scale, this method is difficult to use because of the limited access to enzymes and high cost of the process [11].
A different method of melanin synthesis involves hydroxylation of tyrosine amino acid to L-3,4-dihydroxyphenylalanine using the tyrosinase enzyme. Melanin is synthesized without involvement of cysteine or glutathione via a spontaneous reaction or with involvement of dopachrome tautomerase. The other reactions (except for the reaction catalyzed with tyrosinase) occur spontaneously and require no additional catalysts [12].
The technologies for melanin production from plant biomass are rather diverse, since melanin is found in many plants such as grapes, sunflower, buckwheat, etc. Plant biomass is characterized by higher melanin concentration compared to animal-based feedstock. Fungus Inonotus obliquus, commonly known as chaga, is the most rich in melanin (its content can be as high as 20 wt.%) [13].
However, this fungus grows very slowly and is difficult to culture. Therefore, two melanin sources (buckwheat or sunflower hulls) are considered for its industrial production. These plants rank second in terms of melanin content among plant-based sources (~8 wt.%) [14]. Furthermore, this feedstock is very technologically simple, since hulls are easily separated from kernels directly at the grain elevator, i.e., the original feedstock is accumulated in large quantities on a centralized basis.
Melanin production from sunflower hulls has certain shortcomings that need to be taken into account. First, the energy cost of this process is rather high, making it economically unsound for producing the target product.
Buckwheat hulls can be used as the main source of feedstock for obtaining melanin because buckwheat production is a large-scale manufacturing process that is inexpensive and has no side products. This raw material is easily accessible and rich in melanin, which resides in the entire hull of this grain crop [15].
Melanin extraction from buckwheat hulls involves treatment of comminuted feedstock with a solution of sodium hydroxide or other alkalis, followed by precipitation with strong acids [16].
Because of its structure and thick cell wall, processing of buckwheat faces a number of challenges. Therefore, it is reasonable to perform proper mechanochemical treatment before extraction to increase the surface area of phase contacts and disorder the cellular structure [17].
The key components of plant biomass are hydrocarbon polymers (cellulose/hemicellulose) and lignin polyphenol. All of them can interact with melanin during extraction [18].
The interaction between melanin and cell wall components can significantly reduce the extraction rate and cause sorption of the melanin, which has already been dissolved, from the solution. This effect is expected to be particularly strong for the finely comminuted biomass characterized by a high degree of cell wall disordering.
Melanin is incredibly resistant to temperature and can withstand over 100 °C. However, this statement is only true for pure, dry melanin. When dissolved in an aqueous solution, some functional groups of melanin react with the solvent (Tris), which leads to a decrease in its thermal stability. It has been revealed in many studies that melanin should be preferably extracted in the temperature range of 38–65 °C. As temperature is further increased, this compound becomes unstable [19].
Therefore, our study aimed to analyze the effect of sorption on polyphenol extraction from the plant biomass as exemplified with buckwheat hulls. By assessing the sorption properties, it is possible to determine to what extent reverse sorption can influence the overall extraction kinetics and what correction it can bring. The experiment was conducted at 40, 50, and 60 °C to plot the Langmuir and Freundlich adsorption isotherms. The resulting ultimate adsorption values can be used to apply a correction coefficient for Baker–Lonesdale and Akselrud’s equations. These models allow us to construct an inverse relationship between the diffusion constant and the crystallinity index.

2. Materials and Methods

2.1. Materials

The following plant biomass and reagents were used in this study: hulls of buckwheat grown in the Cherepanovo district (Novosibirsk region, Russia), hydrochloric acid (Sigma Aldrich, Moscow, Russia), and tris(hydroxymethyl)aminomethane (ACS reagent, ≥99.8%, MERCK KGaA, Darmstadt, Germany).
The experiments on melanin extraction and sorption were conducted at a constant pH (pH = 9.0) during thermostating. A buffer solution of 0.2 M Tris (0.2 M HCl + 0.2 M tris(hydroxymethyl)aminomethane (HOCH2)3CNH2) for maintaining a constant pH was used as a solvent in the entire experimental series.

2.2. Mechanical Treatment

Mechanochemical activation of the hulls was conducted on an AGO-2 laboratory-scale planetary activator with steel jars and grinding balls equipped with a water cooling system.

2.3. Studying the Extraction Kinetics

The extraction kinetics were studied spectrophotometrically. The experimental part mainly consisted of three stages. At the first stage, buckwheat husks purified from melanin were prepared. In this work, it acts as a sorbent. The main method for preparing the sorbent is as follows: an aqueous solution of tris(hydroxymethyl)aminomethane (pH = 9.0) was added to 1 g of an accurately weighed portion of plant biomass and kept in an ultrasonic bath for 30 min. After this, the solution was filtered, and 20 mL of the Tris buffer solution was again added to the solid phase and placed in an ultrasonic bath. This cycle was carried out 10 times until the solution was completely discolored. This guaranteed us that the resulting sorbent would contain a minimum concentration of melanin in the substance matrix, which would provide a greater number of free sorption centers.
The second stage was to prepare a solution saturated with melanin. The weight of the husk varied from 0.5 to 20 g to prepare solutions of different concentrations of melanin. In total, 100 mL of the Tris buffer solution was added to the exact weight of the husk sample and melanin was extracted for 6 h. Every hour, 1 mL of solution was taken from the sample volume to determine the melanin concentration using a spectrophotometer. This method made it possible to determine the equilibrium concentration of melanin in the resulting solution.
At the third stage, the resulting aqueous extract was filtered and 0.1 g of sorbent was added to it. After the start of sorption, 1 mL of sample was taken every hour to determine changes in melanin concentration. Sorption lasted 6 h until equilibrium concentration was established.
The spectrophotometric analysis was conducted on a LOMO SF-2000 spectrophotometer (OJSC LOMO, St. Petersburg, Russia) at a wavelength of 500 nm.

2.4. Mathematical Models

A first-order equation based on Fick’s second law was used for calculating changes in concentration:
C = C 0 · 1 e D · t r ,
where C is concentration in the solution at instant t, mg/mL; C0 is the equilibrium concentration at t → ∞ (mg/mL); r is the characteristic diffusion length (in this case, it is equal to the particle radius), µm; and t is time, min [20,21].
By modifying the first-order equation using the Baker–Lonsdale model and taking into account the spherical shape of particles, we derived the equation
3 2 1 M t M 2 / 3 M t M = 3 D m C m s r 0 2 C I n i t t ,
where Mt is the amount of substance released at instant t, mg; M is the amount of substance released after an infinite time, mg; Dm is the diffusion coefficient, µm2/min; Cms is the solubility of the substance in the matrix, mg/mL; r0 is the radius of the spherical matrix, µm; CInit is the initial substance concentration in the matrix, mg/mL; and t is time, min [22].
Solid-state diffusion and unsteady-state diffusion may fail to obey Fick’s law; therefore, an empirical equation based on the power law (namely, the Ritger–Peppas model) was additionally used. This model was elaborated as a semi-empirical model establishing a correlation between substance release and time [23]:
f 1 = M t M = K · t n ,
where f1 is the amount of substance released; M is the amount of substance in the equilibrium state; Mt is the amount of substance released at instant t; K is the constant taking into account structural modifications and geometric characteristics of the system (also being regarded as the desorption rate constant); and n is the power exponent of release (associated with the mechanism of substance release) as a function of time t.
Graphical correlation with the left-side part of the equation can be determined using time linearization, which yields the Baker–Lonsdale equation:
f 1 = 3 2 1 M t M 2 / 3 M t M = K · t ,
where fi is the amount of substance released, mg; M is the amount of substance in the equilibrium state, mg; Mi is the amount of substance released at instant t, mg; K is the constant taking into account structural modifications and geometric characteristics of the system depending on time t, min−1; and t is time, min.
Akselrud’s equation is another equation describing changes in the diffusion coefficient. It is remarkable because this equation can be used for analyzing extraction of non-spherical particles:
l g ( C C 1 ) ( C I n i t C 1 ) = l g B i 0.434 μ i 2 D t R 2 ,
where CInit is the initial solid-phase concentration, mg/mL; C is the concentration in the solid state (in the substance) at instant t, mg/mL; C1 is the concentration in the solution at instant t, mg/mL; Bi is the constant form factor of a particle (a dimensionless unit); D is the effective diffusion coefficient in the solid-phase pores, µm2/min; R is the size of solid particles (µm); µi is the characteristic root (a dimensionless unit); and t is time, min [24].

2.5. Structure and Morphology Analysis

The degree of crystallinity of buckwheat hulls was measured with an X-ray diffraction (XRD) analysis. The X-ray diffraction studies were carried out using a D8 Advance powder diffractometer (Bruker, Karlsruhe, Germany) with monochromatic CuKα radiation (wavelength, 1.5406 Å) in the Bragg–Brentano geometry. The analysis was conducted in a range of 2θ angles (5–60°) at a voltage of 40 kV and a current of 40 mA. The crystallinity index is a characteristic of the disordered structure of plant raw materials under the influence of mechanical influences relative to its initial form. Under various mechanical influences, the crystal structure of the raw material changes, and with it the diffusion coefficient. To assess the change in crystal structure, a crystallinity index was introduced.
The crystallinity index was calculated in accordance with Segal’s method using the following formula [25]:
C I = I 200 I m i n I 200 · 100 % ,
where CI is the crystallinity index; I200 is the intensity of reflection (200); and Imin is the minimum between reflections (110) and (200).
The size of buckwheat hull particles after comminution was measured on a CAMSIZER X2 optical analyzer (Retsch GmbH, Haan, Germany) (detection limit, 0.8–8000 µm) equipped with a compressed air dispenser (pressure, 50 kPa). The average particle size was calculated using the image analysis method in accordance with the standard 13322-2:2006. The form factor of a sphere b/l is the ratio between the minimal and maximal inscribed chords [26].

3. Results and Discussion

3.1. Analysis of the Effect of Temperature on Extraction

In this study, we calculated the ultimate melanin concentration in the selected samples. Next, we investigated the sorption capacity of buckwheat hulls at 40, 50, and 60 °C. The results of studying the effect of temperature on the sorption rate are summarized in Table 1.
The findings show that the sorption capacity of buckwheat hulls increases with melanin concentration in the solution. Once the concentration threshold of 200 µg/mL is reached, the sorption centers on the surface of the husk are mostly filled, which significantly slows down further sorption and brings the dependence to a plateau. It should also be noted that with increasing temperature, the maximum sorption capacity of plant raw materials increases.
For illustrative purposes, we plotted the dependence of the sorption capacity of buckwheat husks purified from melanin (g) on the equilibrium concentration of melanin in the solution (mg of melanin per mL of buffer solution) (Figure 1).
The sorption isotherms shown in Figure 1 indicate that at initial concentrations <150–200 µg/mL, the amount of melanin sorbed onto 1 g of buckwheat hulls increases depending on the initial melanin concentration in the solution. Sorption is characterized by a threshold effect; once the concentrations of 150–200 µg/mL are attained, it slows down and reaches a plateau at 40–50 °C to subsequently decrease at 60 °C. The maximum adsorption value is 12, 17, and 19 µg of melanin per g of buckwheat hulls at 40, 50, and 60 °C, respectively. At 60 °C, sorption instability can be attributed to the competitive processes of melanin desorption back into the solution or to competition with sorption of the solvent on the surface of buckwheat hulls, which can be more intense at high temperatures.
When constructing isotherms, the Langmuir and Freundlich equations are most often used.
Initially, the Langmuir equation was proposed for the adsorption of gases onto the surface of a solid phase, but over time it was modified for aqueous solutions. The Langmuir adsorption model deviates significantly in many cases, primarily because it does not take into account surface roughness and assumes single-site sorption.
The main parameters of the Langmuir isotherm are the equilibrium constant k and the limiting sorption of a substance on the surface of the solid phase A.
The Freundlich equation, in turn, is purely empirical. It is valid only up to certain concentrations, above which it becomes nonlinear. The distribution coefficient K changes with temperature.
The main parameters of the Freundlich isotherm are the maximum absorption capacity a and the slope angle 1/n.
From this table, it can be seen that according to the Langmuir equation, with increasing temperature, the limiting sorption begins to decrease, and the equilibrium constant increases significantly. According to Freundlich, with increasing temperature, the tangent of the angle of inclination increases, which tells us about a more intense sorption process.
In our case, both the Langmuir equation and the Freundlich equation for the most part satisfy our experimental data, which tells us about the heterogeneity of isothermal sorption.
The Freundlich model is empirical and assumes that there are heterogeneous sorption sites.
Figure 2 and Figure 3 demonstrate that at 40 °C, adsorption is best fitted with the Langmuir equation. When temperature increases to 50 and 60 °C, the correlation degree is fairly high for both models.
Next, the coefficients of Freundlich and Langmuir equations were calculated and are listed in Table 2 at 40, 50, and 60 °C.
The Langmuir and Freundlich sorption isotherms were plotted using the resulting parameters.
The process of extracting melanin from plant materials occurs in three stages. The first is the diffusion of the solvent into the particle, the second is the dissolution of melanin inside the particle and the establishment of an equilibrium concentration, and the third is the diffusion of melanin from the particle to the outside.
Knowing that melanin in plant materials can be sorbed in very high quantities, comparable to its content in plant materials, it can be assumed that the melanin concentration inside the particle is lower than in the case without sorption. Which, in turn, should change the expected concentration gradient and affect the calculation of the diffusion constant.
According to the Langmuir model, sorption involves formation of a monolayer on the homogeneous surface; attraction forces between adsorbate molecules and their mobility along the surface can be neglected.
Based on the calculated adsorption value A, we can apply a correction for Baker–Lonsdale and Akselrud’s equations to take into account melanin desorption in the matrix.

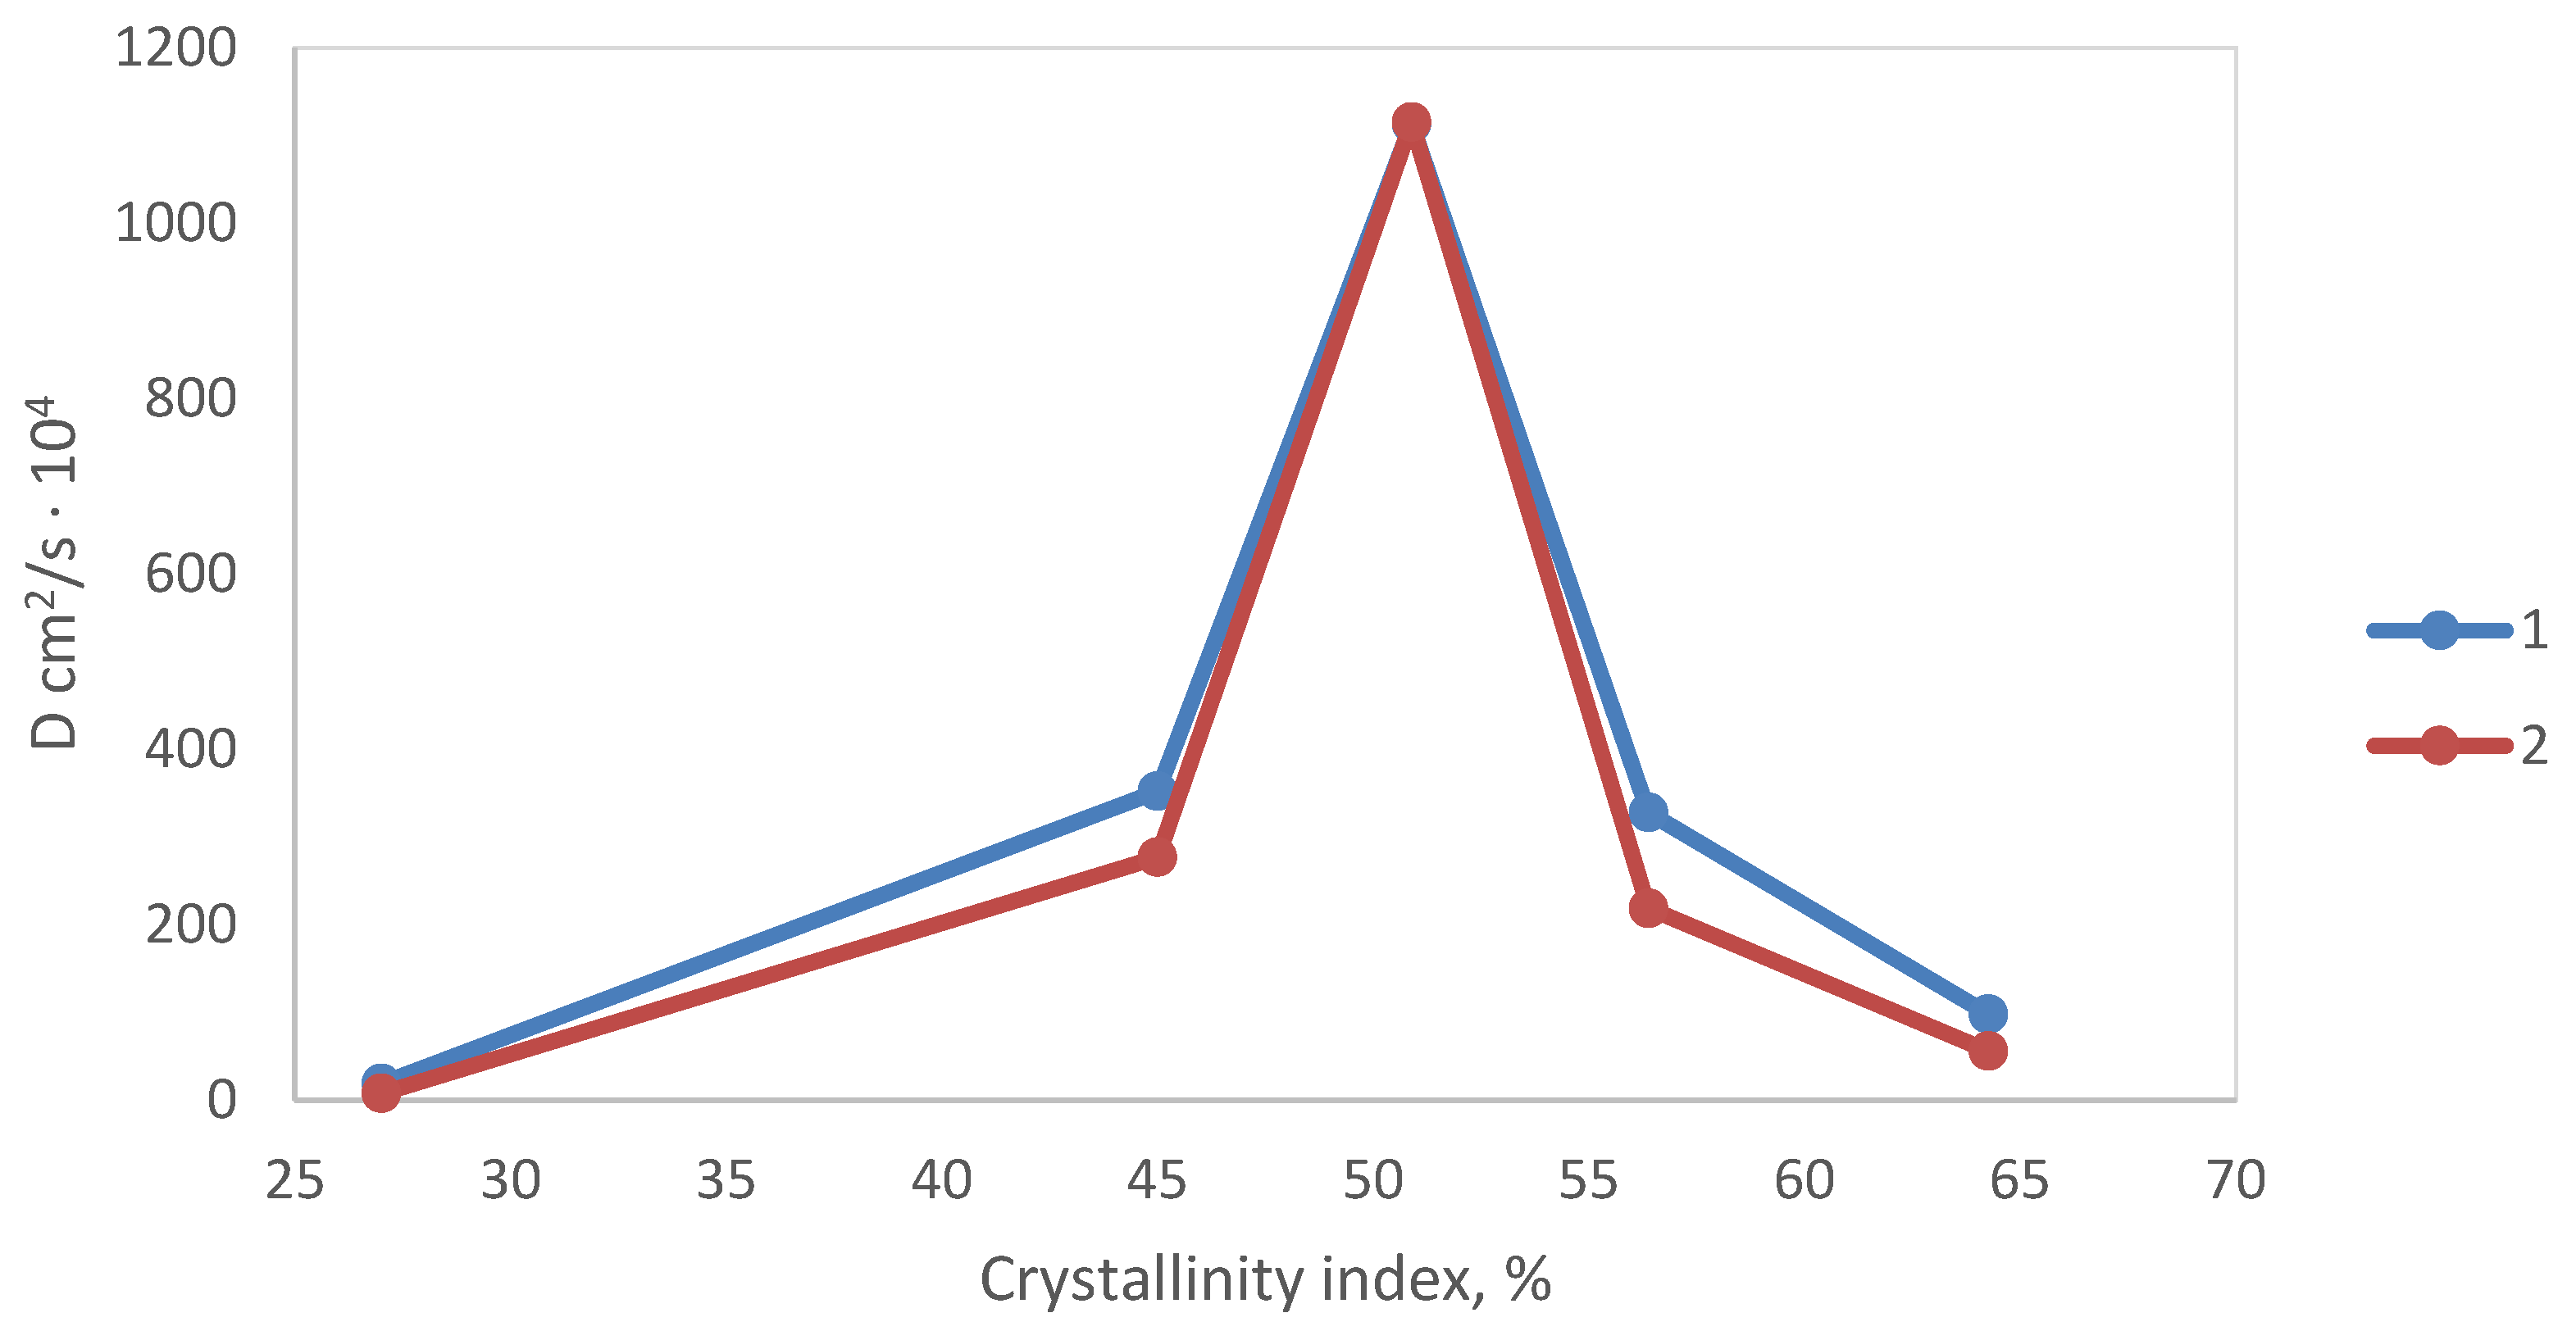
3.2. Calculation of the Diffusion Coefficient Using the Baker–Lonsdale Model

The data on calculating the diffusion coefficients were taken from our previous study [17]. For these data, we applied a correction to allow for the effect of temperature on the diffusion coefficient.
When taking into account melanin sorption according to the Baker–Lonsdale model, a correction was applied to Equation (4):
C new = C ( 1 m s a m p l e · A )
The reliability of the model was controlled using the simplest assessment method, the least squares correlation coefficient (R2).
Table 3 summarizes the data for comparing the recalculated diffusion coefficient D with allowance for the correction coefficient according to the Baker–Lonsdale equation and the data without such correction (Figure 4).

3.3. Calculation of the Diffusion Coefficient Using the Akselrud’s Model

When taking into account melanin sorption on the matrix according to Akselrud’s model, we applied a correction to Equation (5):
M n e w = M C i n s · m s a m p l e · A
where C i n s is melanin concentration inside a particle, mg/g.
Table 4 lists the data for comparing the recalculated diffusion coefficients D with allowance for the correction coefficient according to Akselrud’s equation and the data without applying this correction (Figure 5).
The effect remains the same when using Akselrud’s model. Correlation between the model and the experimental data is somewhat augmented after applying a correction for melanin sorption during extraction.
One can see that whereas the crystallinity index of the original feedstock is ~65%, after feedstock disordering, the diffusion coefficient first increases to subsequently drop drastically. It is most likely related to the collapse of diffusion channels inside the particles.
Applying a correction reduces the constants but has no effect on diffusion drop in highly disordered particles. The coefficients of the model’s correlation with the experimental data remain high (>0.9).

4. Discussion

This study focused on the kinetics of melanin extraction from buckwheat hulls. Among the selected mathematical models for describing the extraction kinetics, Akselrud’s model of extraction kinetics more clearly emphasized the effect of the applied correction.
In order to determine the predominant mechanism of sorption, this process was described using the Freundlich and Langmuir isotherms. The sorption isotherms were shown to correspond to both models with a high degree of correlation, thus being indicative of the mixed sorption mechanism.
The resulting Freundlich adsorption isotherms are characterized by a certain threshold. It is fair to assume that sorption occurs via different mechanisms at low and high melanin concentrations in the solution. At 40 °C, the calculations were conducted for the entire isotherm, while being performed only for the first six points at 50 and 60 °C, since the values obtained using the last three points are negative (lacking physical sense).
The constants of Freundlich isotherms a and l/n are empirical; however, it is believed that the l/n value correlates with the average adsorption energy: the 1/n value declines with increasing adsorbent–adsorbate affinity. If 1/n < 1, the sorption process is efficient. The l/n value can also be considered a parameter characterizing sorption site heterogeneity: it approaches zero when heterogeneity increases, while approaching unity as the homogeneity rises.
The kinetics of melanin extraction were calculated with allowance for melanin desorption on the surface of the initial feedstock. It was demonstrated that upon melanin dissolution, desorption contributes to the process; however, the diffusion coefficient D is different before and after the correction factor is taken into account. The general view of the dependence between the diffusion coefficient and the degree of matrix disordering remains unchanged.

5. Conclusions

It was found by summarizing the data on the kinetics of melanin extraction that both the total amount of melanin released and sorption capacity of buckwheat hulls increase with the temperature of the system; however, at temperatures ≥ 60 °C, melanin starts to be oxidized, and sorption capacity cannot be further increased because melanin becomes unstable.
Sorption capacity of buckwheat hulls is different only at the early stage of the experiment; at higher melanin concentrations in the solution, it converges to a single point at any temperature analyzed.
It is fair to infer that desorption of melanin on buckwheat hulls is described more adequately using the Langmuir adsorption model.
Changes in the diffusion coefficient after applying correction are best fitted with Akselrud’s model.

Author Contributions

Software, T.S.; data curation, T.S.; visualization, A.K.; project administration, I.L.; funding acquisition, T.S. All authors have read and agreed to the published version of the manuscript.

Funding

Sorption kinetics and mathematical modelling were supported by the Russian Science Foundation (project no. 21-13-00046). The analysis of the effect of temperature on extraction of melanin using Langmuir and Freundlich models was supported by the Russian Science Foundation (project no. 22-73-00192).

Data Availability Statement

Data are contained within the article.

Conflicts of Interest

The authors declare no conflict of interest.

References

  1. Zhang, F. Fossilized melanosomes and the colour of Cretaceous dinosaurs and birds. Nature 2010, 463, 1075–1078. [Google Scholar] [CrossRef] [PubMed]
  2. Wogelius, R.A.; Manning, P.L.; Barden, H.E. Trace metals as biomarkers for eumelanin pigment in the fossil record. Science 2011, 333, 1622–1626. [Google Scholar] [CrossRef] [PubMed]
  3. Glass, K.; Ito, S.; Wilby, P.R. Direct chemical evidence for undegraded eumelanin pigment from the jurassic period. Proc. Natl. Acad. Sci. USA 2012, 109, 10218–10223. [Google Scholar] [CrossRef] [PubMed]
  4. Schlessinger, D.I.; Anoruo, M.; Schlessinger, J. Biochemistry, Melanin. 1 May 2023. In StatPearls [Internet]; StatPearls Publishing: Treasure Island, FL, USA, 2023. [Google Scholar]
  5. Yang, X.; Tang, C.; Zhao, Q.; Jia, Y.; Qin, Y.; Zhang, J. Melanin: A promising source of functional food ingredient. J. Funct. Foods 2023, 105, 105574. [Google Scholar] [CrossRef]
  6. El-Naggar, N.E.; Saber, W.I.A. Natural Melanin: Current Trends, and Future Approaches, with Especial Reference to Microbial Source. Polymers 2022, 14, 1339. [Google Scholar] [CrossRef] [PubMed]
  7. Cavallini, C.; Vitiello, G.; Adinolfi, B.; Silvestri, B.; Armanetti, P.; Manini, P.; Pezzella, A.; d’Ischia, M.; Luciani, G.; Menichetti, L. Melanin and melanin-like hybrid materials in regenerative medicine. Nanomaterials 2020, 10, 1518. [Google Scholar] [CrossRef] [PubMed]
  8. Mostert, A.B. Melanin, the What, the Why and the How: An Introductory Review for Materials Scientists Interested in Flexible and Versatile Polymers. Polymers 2021, 13, 1670. [Google Scholar] [CrossRef] [PubMed]
  9. Prota, G. The chemistry of melanins and melanogenesis. In Fortschritte der Chemie Organischer Naturstoffe. Progress in the Chemistry of Organic Natural Products/Progrès Dans la Chimie des Substances Organiques Naturelles; Herz, W., Kirby, G.W., Moore, R.E., Steglich, W.T.C., Eds.; Springer: Vienna, Austria, 1995; pp. 93–148. [Google Scholar]
  10. Giteru, S.G.; Ramsey, D.H.; Hou, Y.; Cong, L.; Mohan, A.; Bekhit, A.E.D.A. Wool keratin as a novel alternative protein: A comprehensive review of extraction, purification, nutrition, safety, and food applications. Compr. Rev. Food Sci. Food Saf. 2023, 22, 643–687. [Google Scholar] [CrossRef] [PubMed]
  11. Raman, N.M.; Shah, P.H.; Mohan, M.; Ramasamy, S. Improved production of melanin from Aspergillus fumigatus AFGRD105 by optimization of media factors. AMB Express 2015, 5, 72. [Google Scholar] [CrossRef] [PubMed]
  12. Tran-Ly, A.N.; Reyes, C.; Schwarze, F.W.; Ribera, J. Microbial production of melanin and its various applications. World J. Microbiol. Biotechnol. 2020, 36, 170. [Google Scholar] [CrossRef] [PubMed]
  13. Sun, S.; Zhang, X.; Sun, S.; Zhang, L.; Shan, S.; Zhu, H. Production of natural melanin by Auricularia auricula and study on its molecular structure. Food Chem. 2016, 190, 801–807. [Google Scholar] [CrossRef] [PubMed]
  14. Sapmak, A.; Boyce, K.J.; Andrianopoulos, A.; Vanittanakom, N. The pbrB gene encodes a laccase required for DHN-melanin synthesis in conidia of Talaromyces (Penicillium) marneffei. PLoS ONE 2015, 10, e0122728. [Google Scholar] [CrossRef] [PubMed]
  15. Jan, B.; Parveen, R.; Zahiruddin, S.; Khan, M.U.; Mohapatra, S.; Ahmad, S. Nutritional constituents of mulberry and their potential applications in food and pharmaceuticals: A review. Saudi J. Biol. Sci. 2021, 28, 3909–3921. [Google Scholar] [CrossRef] [PubMed]
  16. Li, C.; Chen, Y.; Tang, B. Physicochemical properties and biological activities of melanin extracted from sunflower testae. Food Sci. Technol. Res. 2018, 24, 1029–1038. [Google Scholar] [CrossRef]
  17. Lomovskiy, I.; Podgorbunskikh, E.; Lomovsky, O. Effect of ultra-fine grinding on the structure of plant raw materials and the kinetics of melanin extraction. Processes 2021, 9, 2236. [Google Scholar] [CrossRef]
  18. Montes-Avila, J.; Ojeda-Ayala, M.; López-Angulo, G.; Pío-León, J.F.; Díaz-Camacho, S.P.; Ochoa-Terán, A.; Delgado-Vargas, F. Physicochemical properties and biological activities of melanins from the black-edible fruits Vitex mollis and Randia echinocarpa. J. Food Meas. Charact. 2018, 12, 1972–1980. [Google Scholar] [CrossRef]
  19. Manivasagan, P.; Venkatesan, J.; Senthilkumar, K.; Sivakumar, K.; Kim, S.K. Isolation and characterization of biologically active melanin from Actinoalloteichus sp. MA-32. Int. J. Biol. Macromol. 2013, 58, 263–274. [Google Scholar] [CrossRef] [PubMed]
  20. Bruschi, M.L. Mathematical models of drug release. In Strategies to Modify the Drug Release from Pharmaceutical Systems; Woodhead Publishing: Cambridge, UK, 2015; pp. 63–86. [Google Scholar]
  21. Nedich, R.L. Mechanism of dissolution I: Mathematical interpretation of concentration gradients developed during dissolution of a solid. J. Pharm. Sci. 1972, 61, 214–218. [Google Scholar] [CrossRef] [PubMed]
  22. Baker, R.W.; Lonsdale, H.K. Controlled release: Mechanisms and rates. In Controlled Release of Biologically Active Agents; Taquary, A.C., Lacey, R.E., Eds.; Plenum: New York, NY, USA, 1974; pp. 15–71. [Google Scholar]
  23. Ritger, P.L. A simple equation for describing of solute release. I. Fickian and non-Fickian release from non-swellable devices in the form of slabs, spheres, cylinders or discs. J. Control Release 1987, 5, 23–36. [Google Scholar] [CrossRef]
  24. Akselrud, G.A.; Lysyansky, V.M. Ekstragirovaniye (Sistema Tvordoye Telo–Zhidkost’) [Extraction, a Solid-Liquid System]; Leningrad Press: Saint Petersburg, Russia, 1974; pp. 244–256. [Google Scholar]
  25. Segal, L.; Creely, J.J.; Martin, A.E.; Conrad, C.M. An empirical method for estimating the degree of crystallinity of native cellulose using the X-ray diffractometer. Text. Res. J. 1959, 29, 786–794. [Google Scholar] [CrossRef]
  26. Krumbein, W.C.; Sloss, L.L. Stratigraphy and Sedimentation, 2nd ed.; W.H. Freeman and Company: San Francisco, CA, USA, 1963. [Google Scholar]
Figure 1. Changes in melanin sorption capacity of the plant biomass compared to that for the equilibrium concentration of melanin in the solution at different temperatures: curve 1—dependence at 40 °C; curve 2—dependence at 50 °C; and curve 3—dependence at 60 °C.
Processes 11 03192 g001
Figure 2. The Langmuir isotherms of melanin adsorption on buckwheat hulls: 1—dependence at 40 °C; 2—dependence at 50 °C; and 3—dependence at 60 °C.
Processes 11 03192 g002
Figure 3. The Freundlich isotherms of melanin adsorption on buckwheat hulls: 1—dependence at 40 °C; 2—dependence at 50 °C; and 3—dependence at 60 °C.
Processes 11 03192 g003
Figure 4. The plot showing comparison of D according to the Baker–Lonsdale model before and after applying the correction coefficient: 1—before applying the correction coefficient; 2—after applying the correction coefficient.
Processes 11 03192 g004
Figure 5. The plot showing comparison of D according to Akselrud’s model before and after applying the correction coefficient: 1—before applying the correction coefficient; 2—after applying the correction coefficient.
Processes 11 03192 g005
Table 1. Changes in melanin concentration in the solution with respect to the equilibrium concentration.
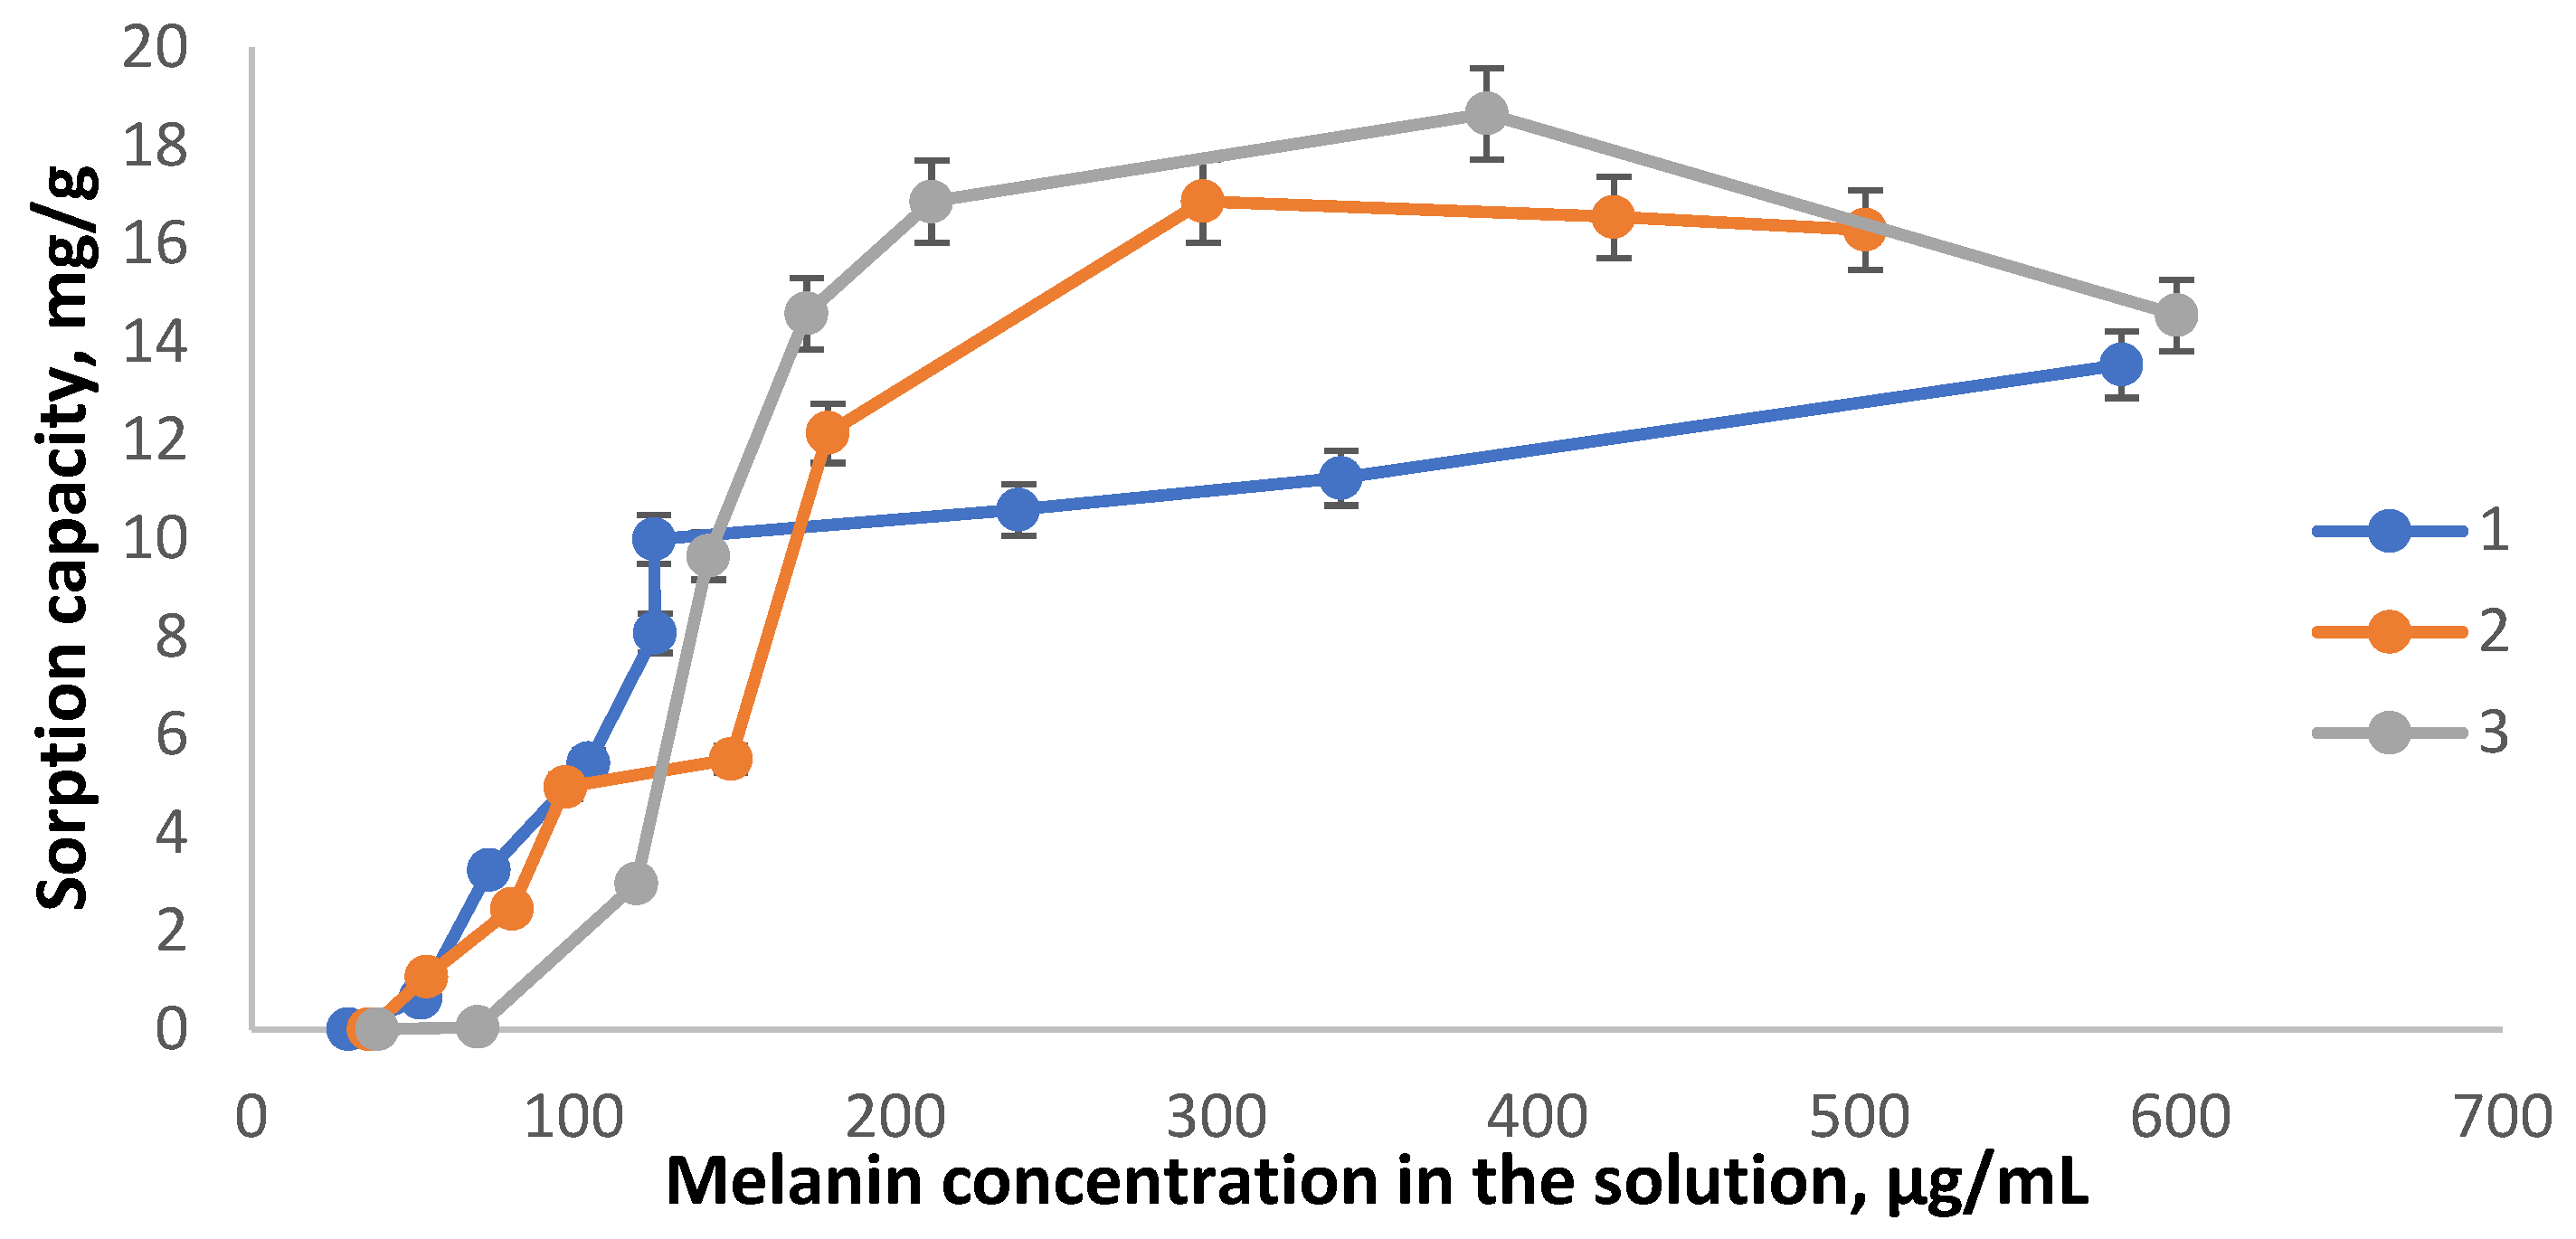
Weight of the Sample of Buckwheat Hulls for Melanin Extraction, gUltimate Equilibrium Concentration of Melanin in the Solution, µg/mLChanges in Melanin Concentration in the Solution after the Equilibrium Was Attained, µg/mL
Temperature: 40 °CTemperature: 50 °CTemperature: 60 °C
0.539 ± 1.951.7 ± 1.23.0 ± 1.20.1 ± 0.9
1.070.3 ± 3.529.0 ± 0.76.8 ± 1.08.2 ± 0.9
1.5119.6 ± 5.9815.1 ± 0.813.7 ± 0.826.8 ± 0.6
2.0142.1 ± 7.1022.4 ± 1.315.3 ± 1.040.5 ± 0.8
3.0172.6 ± 8.6327.7 ± 1.033.7 ± 1.435.7 ± 1.2
3.5211.4 ± 10.5729.4 ± 1.046.8 ± 1.551.8 ± 2.1
7.0384.2 ± 19.2131.2 ± 2.245.9 ± 2.740.4 ± 1.7
14.0598.7 ± 29.9337.6 ± 1.045.2 ± 1.342.4 ± 3.4
20.0705.5 ± 35.2842.8 ± 3.144.4 ± 1.043.1 ± 2.1
Table 2. The coefficients of Freundlich and Langmuir equations for the isotherms of melanin adsorption on buckwheat hulls at 40, 50, and 60 °C.
Equation FormTemperature, °CCorrelationSorption Parameters
Freundlich equation A = a · C 1 n
or
l g A = l g a + 1 n · l g C
40R2 = 0.8309a = 0.067 ± 0.021,
1/n = 0.60 ± 0.11
50R2 = 0.9846a = 4.1 ± 1.4,
1/n = 1.9 ± 0.10
60R2 = 0.9334a = 1494 ± 13
1/n = 4.0 ± 0.9
Langmuir equation c A = 1 A · k + c A 40R2 = 0.9037A = 0.012 ± 0.002 mmol/g *,
k = 10.9 ± 1.8
50R2 = 0.9858A = 0.008 ± 0.001 mmol/g *,
k = 102 ± 1
60R2 = 0.9799A = 0.007 ± 0.001 mmol/g *,
k = 925 ± 1
* When calculating the amount of melanin, we used the putative molecular weight of melanin (2000 g/mol).
Table 3. The results of calculating the diffusion coefficient without and with allowance for correction.
No.Crystallinity Index, %Average Particle size, µmD Baker–Lonsdale · 10 3 ,   µ m 2 /min.
Before Applying the Correction Coefficient
R 2 D Baker–Lonsdale · 10 3 ,   µ m 2 /min.
After Applying the Correction Coefficient
R 2
Buckwheat Hulls
364 ± 2262980.907560.906
256 ± 33003280.9642190.964
151 ± 452911130.91011150.901
545 ± 33983520.9122770.911
427 ± 435190.81480.815
Table 4. The results of our previous study and the data of calculations with a correction applied.
No.Crystallinity Index, %Average Particle Size, µmD Akselrud · 10 4 ,   c m 2 /s
Before Applying the Correction Coefficient
R 2 D Akselrud · 10 4 ,   c m 2 /s
After Applying the Correction Coefficient
R 2
Buckwheat Hulls
364 ± 226210.00.9361.510.945
256 ± 330014.70.9252.120.928
151 ± 452955.40.94149.50.952
545 ± 339822.20.9314.320.923
427 ± 4341.80.9200.090.918
Disclaimer/Publisher’s Note: The statements, opinions and data contained in all publications are solely those of the individual author(s) and contributor(s) and not of MDPI and/or the editor(s). MDPI and/or the editor(s) disclaim responsibility for any injury to people or property resulting from any ideas, methods, instructions or products referred to in the content.

