Article

The Influence of Blade Tip Clearance on the Flow Field Characteristics of the Gas–Liquid Multiphase Pump

Bailie School of Petroleum Engineering, Lanzhou City University, Lanzhou 730071, China
*
Author to whom correspondence should be addressed.
Processes 2023, 11(11), 3170; https://doi.org/10.3390/pr11113170
Submission received: 30 August 2023 / Revised: 18 September 2023 / Accepted: 22 September 2023 / Published: 7 November 2023
(This article belongs to the Special Issue Modeling, Simulation and Control in Energy Systems)

Abstract

:
Gas–liquid multiphase pumps are critical transportation devices in the petroleum and chemical engineering industries, and improving their conveyance efficiency is crucial. This study investigates the influence of blade tip clearance variations on the flow characteristics within a multiphase pump. Numerical simulations were conducted using Eulerian two-phase and SST k-ω turbulence models with four distinct tip clearance sizes (0 mm, 0.3 mm, 0.6 mm, and 0.9 mm). The performance curve, tip leakage flow (TLF), and internal gas distribution were subjected to analysis. The results indicate that the TLF is linearly related to the clearance size and traverses multiple flow passages, resulting in energy losses and a reduced pump head coefficient. Larger tip clearances (0.6 mm and 0.9 mm) exhibited a more uniform flow pattern, contrasting the irregularities seen with a 0.3 mm clearance. Compared to no tip clearance (0 mm), gas holdup within the impeller passages decreased by 18.39%, 39.62%, and 58.53% for clearances of 0.3 mm, 0.6 mm, and 0.9 mm, respectively, leading to decreased overall system efficiency. This study highlights the connection between tip clearance size and flow dynamics in multiphase pumps, offering insights for optimal tip clearance selection during multiphase pump design.

1. Introduction

Gas–liquid multiphase pumps, characterized by their simple design, extensive flow capability, and minimal sensitivity to solid particle entrainment, are integral to the transportation of petroleum. Since the 21st century’s onset, offshore oil and gas exploration and development have surpassed onshore activities, leading to a steady increase in production and storage volumes. As a result, offshore regions are now viewed as strategic reserves for global oil and gas supplies [1]. The evolution of gas–liquid multiphase pump technology is anticipated to further enhance production from both marginal and deep-water fields.
Despite the considerable advancements, the internal dynamics of gas–liquid multiphase pumps remain intricately complex, leaving various flow mechanisms unexplored. Previous studies have examined the influence of different flow parameters on pump performance, including inlet gas void fraction (IGVF), rotational speed, etc. Cheng et al. [2] introduced a novel cylindrical vane pump, whose efficiency was corroborated through experimental and numerical methods. The Computational Fluid Dynamics (CFD) model of the pump exhibited a maximum error rate of 5.7%, validating its successful design as a positive-displacement pump. Furthermore, the pump maintained consistent efficiency across diverse conditions. Xu et al. [3] tested the multiphase pump under various flow rates and IGVF conditions, finding that increasing IGVF corresponded to a decreasing stable operational range, peaking stability at 50% IGVF. Saadawi et al. [4] studied a blade-type gas–liquid multiphase pump in an oil field, noting enhanced pressure performance with higher rotational speeds. This conclusion was echoed by Ali and Zhang [5,6] through both numerical and experimental research. The medium’s viscosity significantly influences the performance of multiphase pumps. Specifically, increased viscosity results in reduced pressure during the transport of high-viscosity media [7,8,9]. In the realm of optimization, Liu et al. [10,11] thoroughly investigated pump–turbine behavior during power-off scenarios, blending numerical simulations with empirical methods. Their work clarifies critical aspects such as transient flow characteristics, pressure fluctuations, and operational shifts, providing valuable theoretical and practical insights into the field. Zhang et al. [12] proposed a three-dimensional design methodology suitable for high-flow pumps based on the impeller passage mesh of a gas–liquid multiphase pump, a method verified experimentally. Cao et al. [13] combined the three-dimensional design method with computational fluid dynamics (CFD) to design a multiphase pump and conducted experiments using this approach. Zhang et al. [14] merged a backpropagation (BP) neural network with a multi-objective genetic algorithm, achieving optimal outcomes in numerical simulations under distinct operating scenarios with varying IGVF. Kim et al. [15] optimized specific structural pump parameters, determining that their enhanced design minimized flow separation, thus improving operational efficiency.
Currently, a cohesive and mature design theory for multiphase pumps is absent. With the progression of computer technology, the field is evolving towards a more multi-objective and intelligent paradigm. Zhang et al. [16] performed a numerical simulation to study the flow field within a multistage gas–liquid multiphase pump under various operational conditions. Li et al. [17,18] employed the Eulerian model to predict the bubble distribution and diameter in the pump, providing a better understanding of bubble motion characteristics. Zhang et al. [19,20] investigated the effects of flow parameters on gas distribution and interphase forces in single-stage and multistage pumps under different flow rates, IGVF, and viscosity using numerical simulations. Sun et al. [21] analyzed the impact of blade tip clearance on vortex structure, gas distribution, and energy characteristics, concluding that a wider clearance leads to substantial energy losses and alters gas accumulation patterns. Zhang et al. [22] studied the resistance variation under different IGVF conditions using a non-uniform bubble model with different drag coefficients. Another investigation by Zhang et al. [23] empirically assessed experimental analyses of pressure pulsation under different IGVF and rotational speed conditions. Their findings indicate that both dynamic and static interference lead to heightened pressure pulsation. With decreasing rotational speed, the pressure pulsation initially declines, but later increases with elevated IGVF. This suggests that controlled air ingress into the pump can optimize pressure pulsation. However, elevated IGVF levels tend to amplify pressure pulsation. Shi et al. [24] used numerical simulations to study the influence of the clearance at the blade tip on the pressure and velocity fields on the S2 flow surface of the impeller in a multiphase pump.
In summation, prevailing research on the impact of tip clearance on flow characteristics largely emphasizes leakage vortex cavitation and velocity distribution within the clearance gap. However, a more comprehensive examination is required, especially concerning leakage flow patterns and gas holdup distribution in the gap region of gas–liquid multiphase pumps. This investigation employs the Eulerian two-fluid model for numerical simulations of internal flow in a gas–liquid multiphase pump with different clearances. This methodology provides insights into the effects of tip clearance on the pump’s external characteristics, gap leakage flow, and gas distribution in the impeller. The findings from this study can be crucial references in optimizing the design of gas–liquid multiphase pumps.

2. Numerical Model

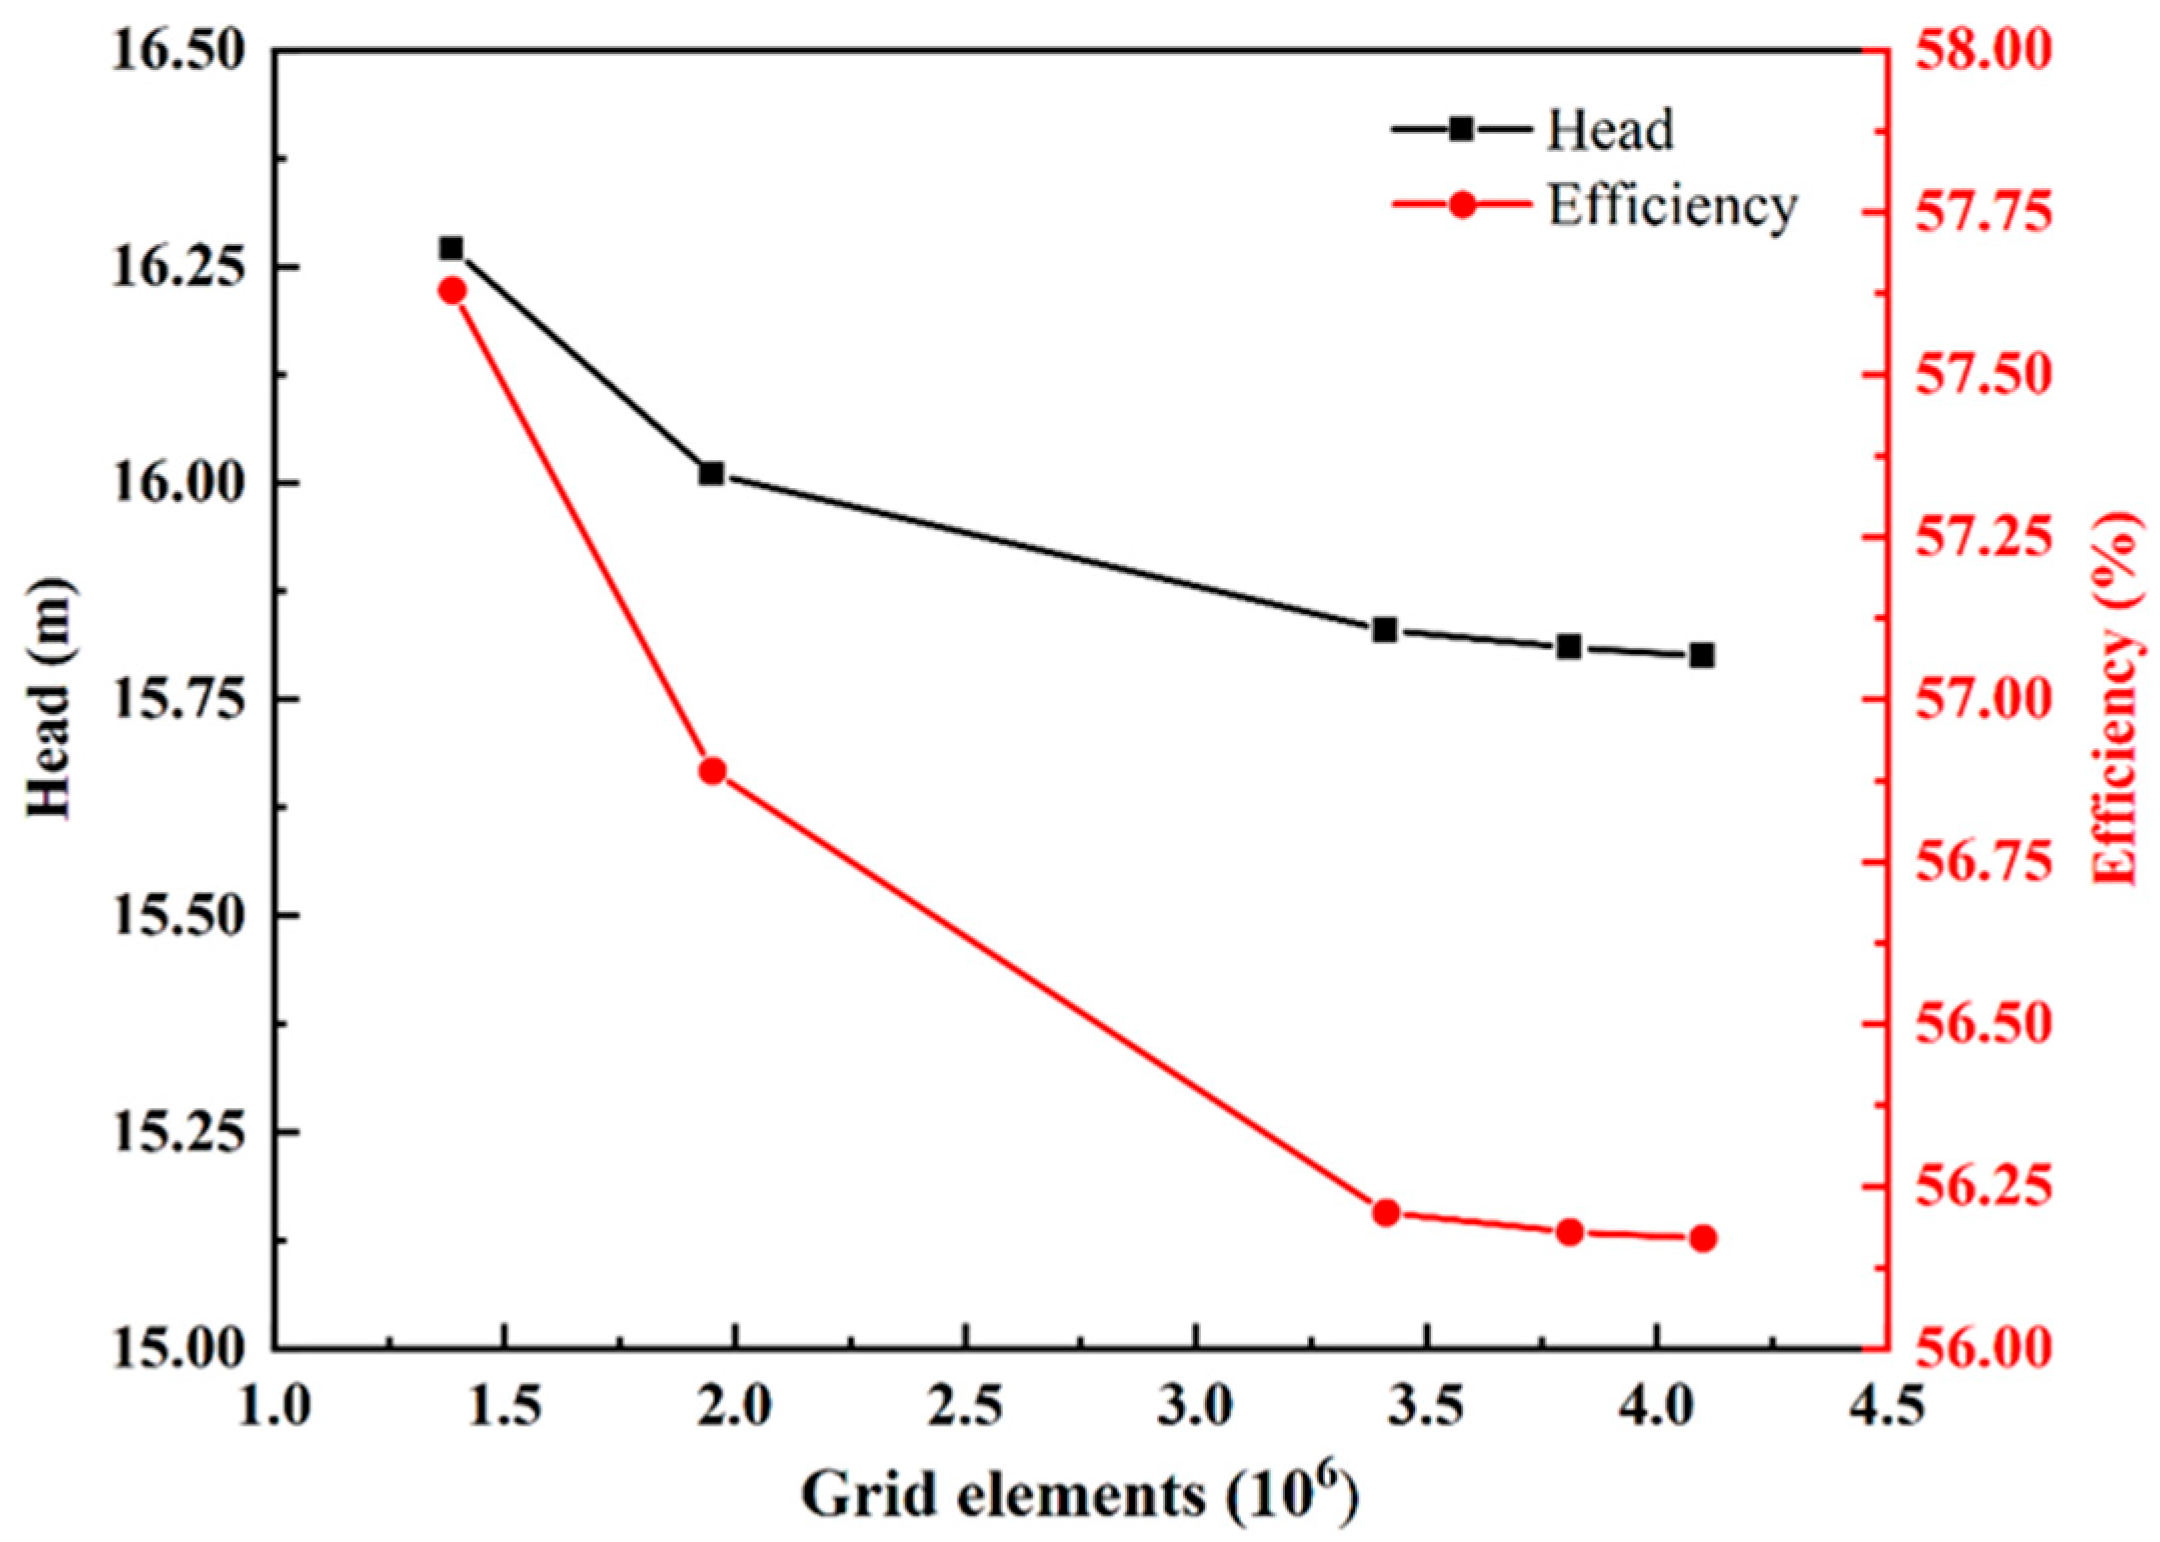
2.1. Computational Method

In multiphase pumps, the flow of two-phase fluids is inherently non-uniform. Although factors such as slip velocity and momentum transfer can often be neglected, the non-uniform assumption offers a more accurate depiction of the pump’s internal flow dynamics compared to a uniform model. This study employs the non-uniform Eulerian two-fluid model for its calculations. While both fluid phases operate within a shared pressure field, they maintain individual velocity fields. The Reynolds-averaged Navier–Stokes equation for a steady, incompressible fluid is solved. The governing equations are as follows:
Continuity Equation:
( α k ρ k V k ) = 0
Momentum Equation:
( α k ρ k V k V k ) = α k p + ( α k τ i j ) + M k + f k
where the subscript k represents any phase (l is liquid, g is gas). α k is the k-phase volume fraction, satisfying α g + α l = 1 . ρ k is the k-phase density, V k is the k-phase absolute velocity, p is the pressure, τ is the viscous stress tensor, M k is the interphase force on k-phase, and f k is the mass force.
The steady flow within the multiphase pump was calculated using ANSYS CFX 17.0, a commercial computational fluid dynamics software. We employed the SST k-ω turbulence model to address the Reynolds stress. This model combines the characteristics of the k-ω and k-ε models, and can accurately predict flow separation under adverse pressure gradients. Additionally, it exhibits specific adaptability in predicting the movement of clearance leakage vortices [25,26].

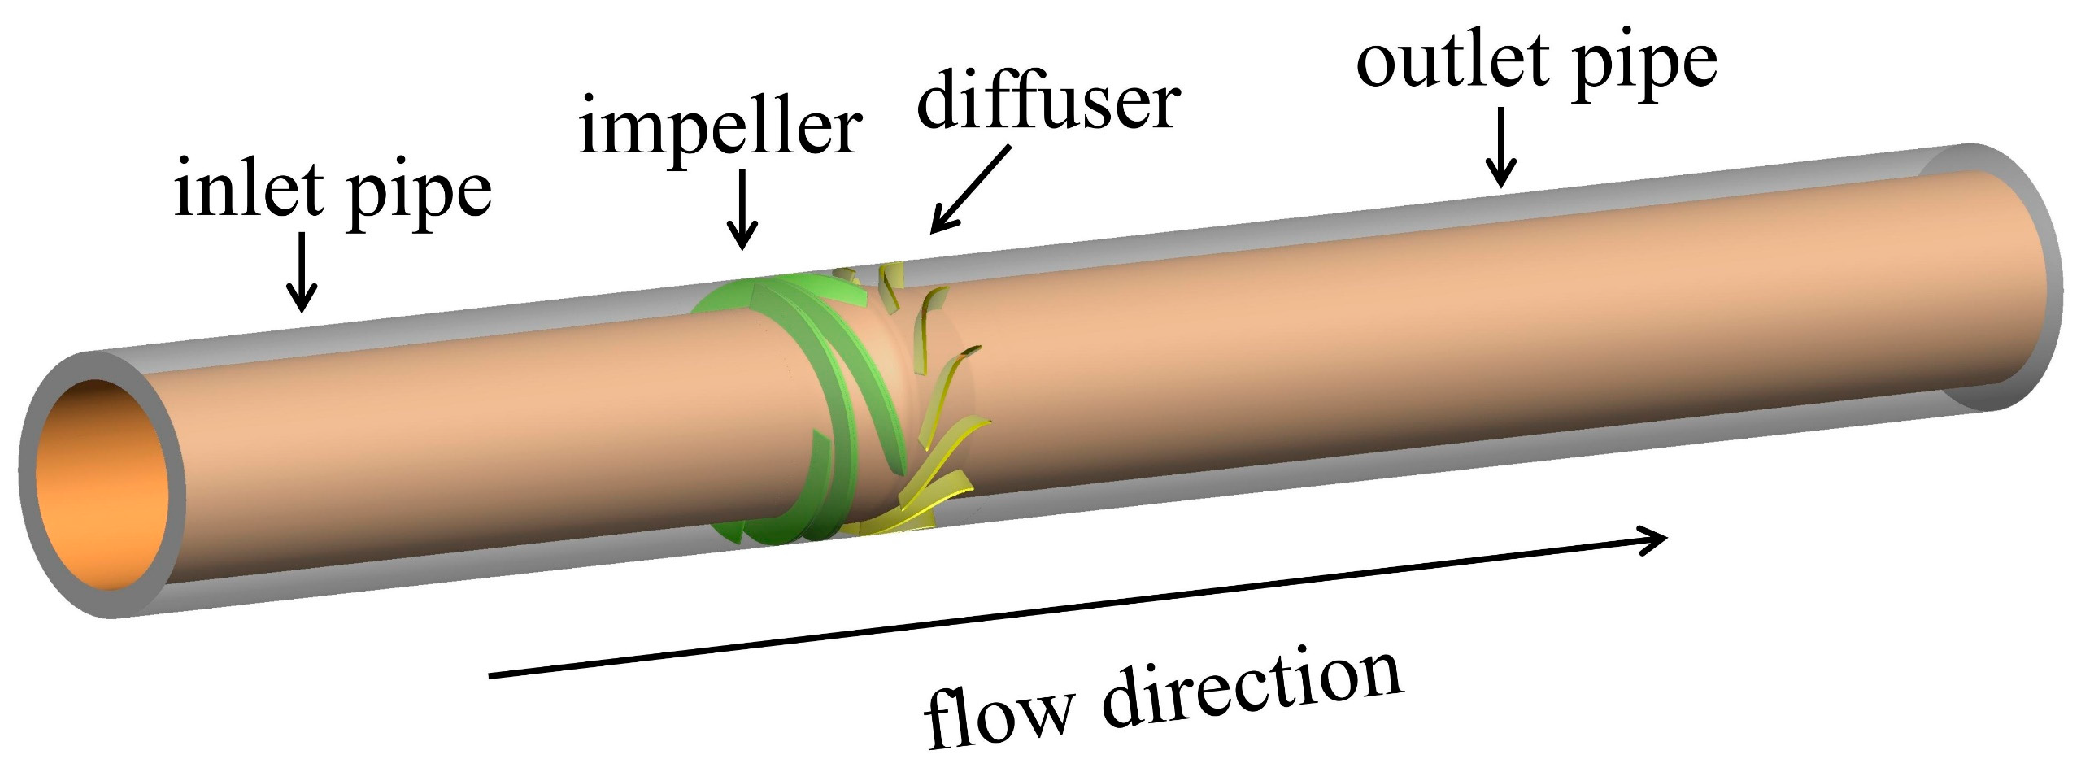
2.2. Computational Model

The computational model presented in this paper consists of four primary components: the inlet pipe, impeller, diffuser, and outlet pipe, as depicted in Figure 1. Key design parameters for the multiphase pump are a design flow rate Qd = 50 m3/h, a design head H = 15 m, and a rotational speed n = 2950 r/min. Other main technical parameters can be found in Table 1.
The tip clearance is defined as the gap between the blade wheel edge and the inner wall of the pump casing, as depicted in Figure 2. The presence of this clearance allows a portion of the fluid to flow from the high-pressure side of the blade to the low-pressure suction side, resulting in TLF. This phenomenon significantly alters the flow dynamics within the impeller passage, subsequently impacting the pump’s performance. In this study, four tip clearance sizes, δ1 = 0 mm, δ2 = 0.3 mm, δ3 = 0.6 mm, and δ4 = 0.9 mm, were selected to investigate the influence of the tip clearance on the flow characteristics of the multiphase pump.
The computational domains were discretized using a high-precision structured grid, making use of both ICEM and TurboGrid tools. For components with slender geometries, including diffusers and impellers, an “O-shaped” grid was adopted for localized refinement, ensuring a smooth transition between component grids and capturing flow intricacies effectively. Additionally, grid refinement was focused on the near-wall region to capture the flow dynamics within the impeller passages with greater accuracy. Specifically, a gap grid of 12 layers was designated for δ2 = 0.3 mm, while 26 and 40 layers were assigned for δ3 = 0.6 mm and δ4 = 0.9 mm, respectively. Figure 3 illustrates both the computational domains and the local grid. For details of the tip clearance grid, refer to Supplementary Figure S1 in the Supplementary Materials.
A grid independence verification analysis was executed to confirm the quality of the grid. This verification process was based on calculations performed on five distinct grid sets, each varying by specific parameters, with the IGVF set to 0%. The head and efficiency were used as evaluation metrics. The data suggests consistency in both head and efficiency across the last three grid sets, as illustrated in Figure 4. To achieve a balance between computational efficiency and result accuracy, the third grid set was selected for subsequent numerical calculations.

2.3. Boundary Conditions and Setting

The selected flow medium consists of a two-phase mixture, with water serving as the continuous phase and air as the dispersed phase. The water has a density of 997 kg/m3, and the bubble diameter is consistently 0.1 mm. Volume fractions for both water and air are determined by operating conditions, ensuring their combined sum always equals 1. The inlet boundary condition is defined by the total mass flow rate, whereas the boundary condition for the outlet corresponds to the average static pressure. The pump operates at a rotational speed of 2950 rpm. Since the impeller is a rotating domain, the interface between the inlet extension pipe and the impeller and the impeller and the diffuser were modeled using the frozen rotor approach. The simulations were deemed converged when the residuals for all equations fell below a threshold of 1 × 10⁻⁵.

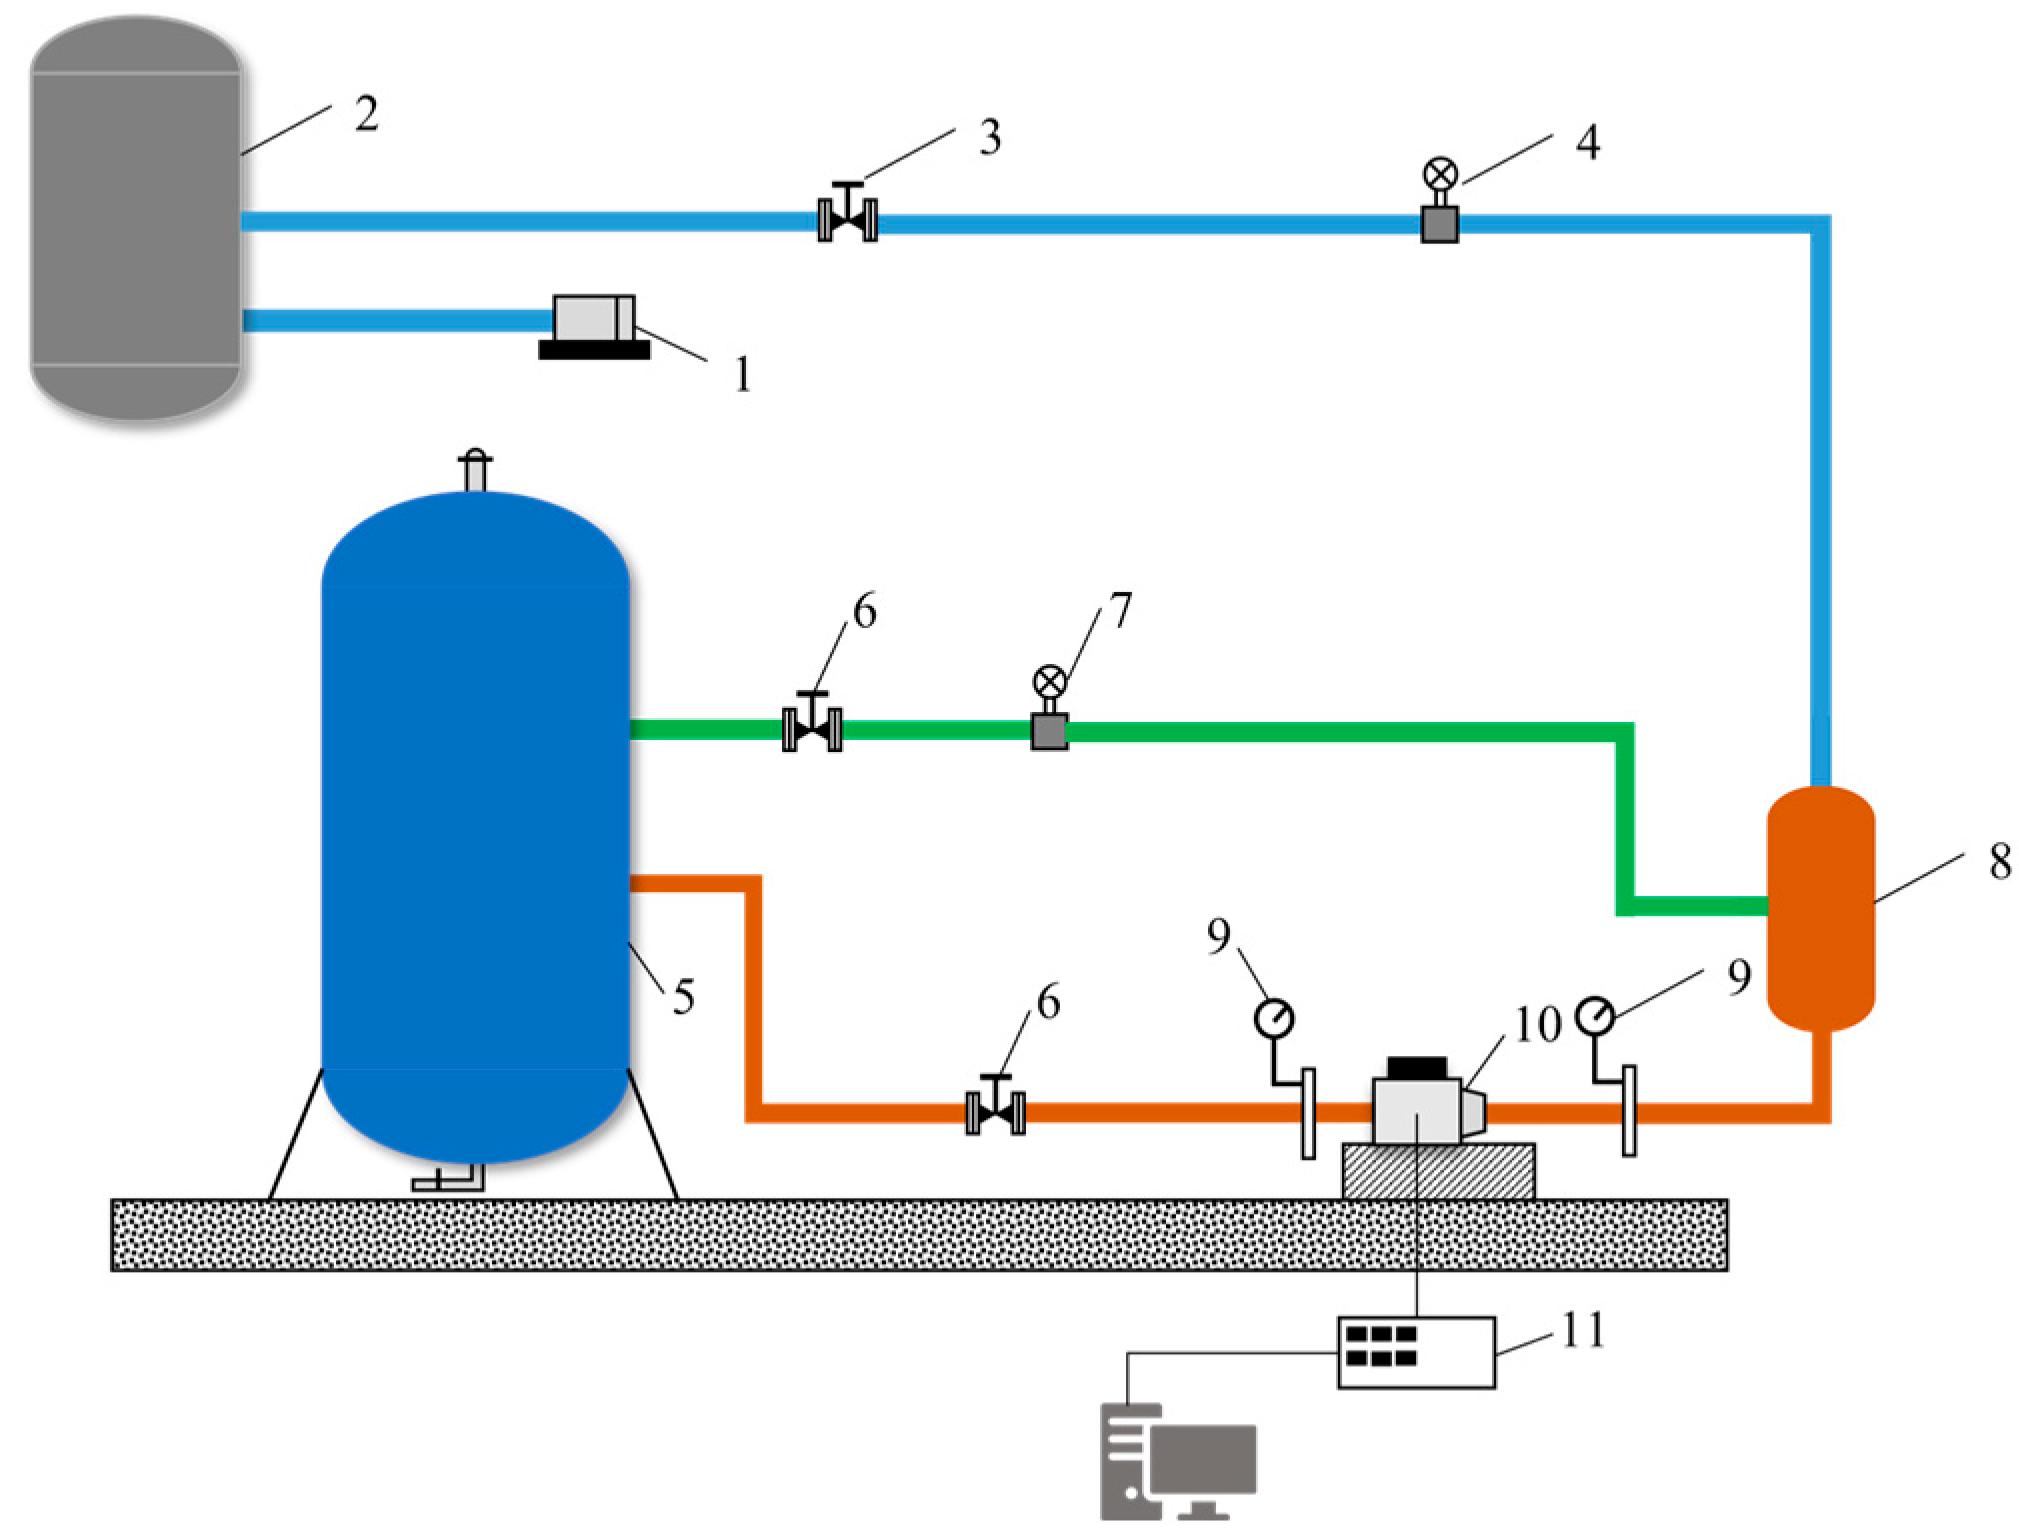
2.4. Gas–Liquid Multiphase Pump Test Rig

The experimental setup is illustrated in Figure 5. Air was supplied by an air compressor, while water was provided by a water tank. The water and air were individually channeled into the buffer, where they were thoroughly mixed before entering the gas–liquid multiphase pump. Subsequently, the water was recirculated back into the tank, while the air was discharged into the atmosphere. Flowmeters and pressure sensors were strategically positioned on the relevant pipes to monitor the gas and liquid flow rates, as well as the pump’s inlet and outlet pressures, respectively. The main sensor parameters are shown in Table S1 of the Supplementary Materials.

3. Results and Discussion

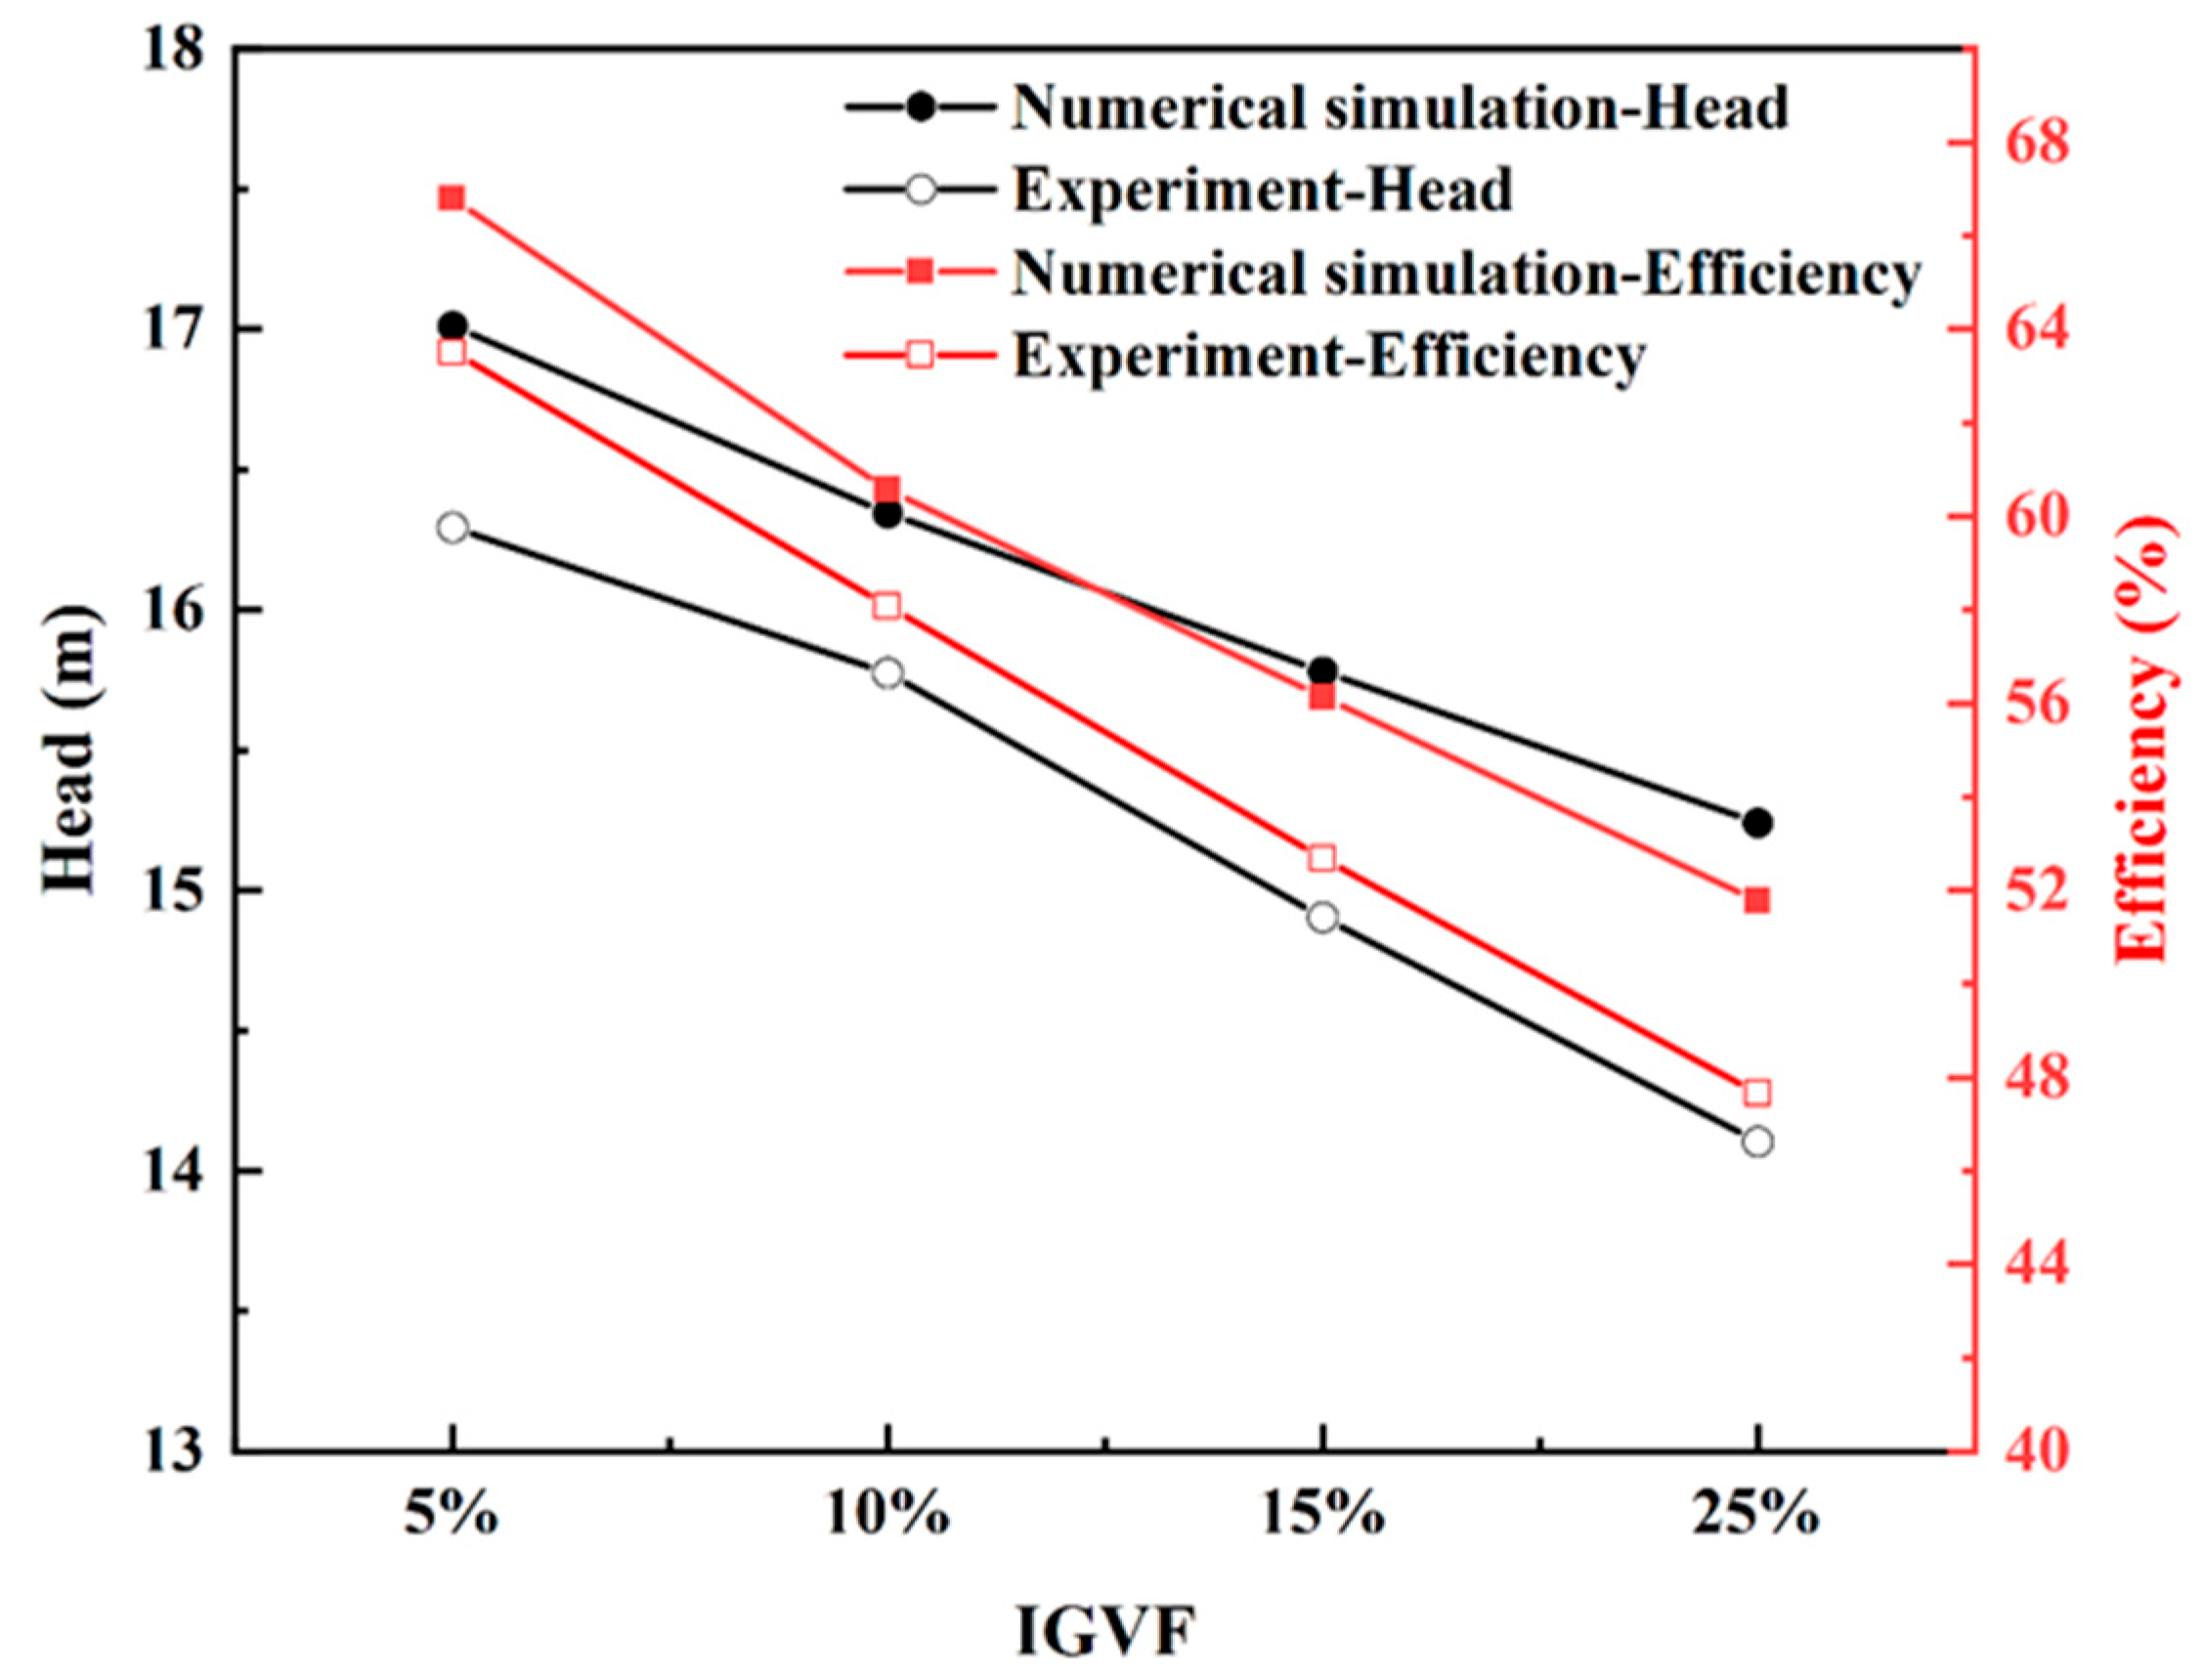
3.1. Validation of Numerical Calculation Methods

To assess the accuracy of the numerical calculations, a comparison was conducted between the experimental and numerically calculated results for both head and efficiency, as depicted in Figure 6. The efficiency exhibited a maximum error of 7.95% at IGVF = 20%, while the head presented a minimum error of 3.48% at IGVF = 10%. Overall, both experimental and calculated data showed congruent trends, affirming the accuracy of the numerical approach. However, it is noteworthy that as IGVF escalates, discrepancies in results become more apparent. This phenomenon primarily arises from the need to equalize pressures in the gas and liquid pipelines, ensuring the gas–liquid mixture does not enter the contrasting phase’s pipeline before reaching the buffer. During the tests, maintaining identical pressures in the gas and liquid pipes conduits grows more arduous as the IGVF increases, leading to fluctuations in the measured data and larger errors.

3.2. External Characteristics Prediction

In order to analyze the impact of tip clearance on the head of the gas–liquid multiphase pump, the head is dimensionless. The head coefficient φh is defined as:
ϕ h = p 2 p 1 ρ u 2 2
where p1 and p2 are the inlet and outlet pressures of the pump, respectively, and u2 is the circumferential velocity at the impeller outlet rim.
The values of the pump head coefficient, calculated under various tip clearances, are presented in Table 2. These values were derived for a pump with an IGVF of 10%. Analysis of Table 2 reveals a consistent decline in the pump head coefficient with the progressive increase in tip clearance from 0 mm to 0.9 mm. When comparing the results with the case of a 0 mm tip clearance, the declines recorded are 1.82% at 0.3 mm, 3.21% at 0.6 mm, and 4.83% at 0.9 mm. The decrease in the head coefficient is attributed to increased liquid recirculation when the IGVF is at a specific condition. As the impeller processes the fluid, an increasing tip clearance prompts a fraction of this fluid to circulate back to the impeller’s suction side. This recirculation negatively impacts the fluid’s effective inflow, subsequently reducing the pump head, leading to a reduced coefficient. Additionally, the quantitative relationship between the gap and head coefficient is elaborated upon in Supplementary Figure S2.

3.3. Influence of Tip Clearance on the TLF

Figure 7 illustrates the relationship between TLF and varying tip clearances. A nearly linear correlation is evident between gap leakage and clearance size, with leakage surging markedly as the tip clearance expands. As the tip clearance increases from 0 mm to 0.9 mm by increments of 0.3 mm, the corresponding TLF volumes are 2.23 kg/s, 4.65 kg/s, and 7.24 kg/s, accounting for 17.89%, 37.31%, and 58.09% of the inlet mass flow rate, respectively. Data analysis reveals an ongoing surge in leakage with increasing tip clearance, peaking at 58.09% for 0.9 mm. This trend is explained by Figure 8a, which demonstrates that a significant portion of the leakage flow passing through the first tip clearance (marked as I) proceeds to subsequent tip clearance (marked as II), with portions even advancing to further clearances (marked as III, IV). This leads to the fluid navigating multiple flow paths, incurring cumulative losses. In addition, leakage can substantially diminish energy efficiency due to the associated decrease in fluid pressure within the pump, directly impacts its performance. Enhanced tip clearance offers a wider flow route, intensifying fluid losses. The compact streamlines depicted in Figure 8b corroborate this, illustrating an increased level of fluid leakage with broader tip clearance.
The investigation of external characteristics reveals a steady decrease in the head coefficient of the gas–liquid multiphase pump as the tip clearance increases. This phenomenon is intricately related to TLF, which interrupts mainstream motion and induces turbulence within the flow field. Figure 9 represents the vorticity distribution at 90% of the impeller blade height. At tip clearance of 0 mm, the absence of tip clearance eliminates any potential TLF, yielding a distinctly different vorticity distribution than in situations with tip clearance. Predominantly, vorticity in such situations stems from a fluid collision with the blade surface, followed by backflow. With greater tip clearance, both the range of vorticity distribution and the vortex intensity rise. This trend is due to the leakage flow through the clearance, potentially triggering a vortex effect and consequent energy loss. Incremental expansion of the tip clearance amplifies the leakage flow, resulting in increased energy consumption. It is evident that tip clearance significantly affects the overall performance of the pump. This influence is dynamic, changing with variations in the tip clearance and follows a consistent trend: as the tip clearance widens, the pump’s head coefficient consistently reduces. This insight enhances our understanding of fluid dynamics and provides critical guidance for designing and optimizing gas–liquid multiphase pumps.
Flow leakage through the clearance gaps significantly influences the flow distribution within the impeller passages and their corresponding mass flow rates. Figure 10 illustrates the mass flow rate variation across each impeller passage with different tip clearances. Notably, Passage 2, with no tip clearance (0 mm), exhibits much lower flow rates compared to other passages. At a tip clearance of 0.3 mm, the flow rates in both Passages 2 and 3 diminish. In contrast, clearances of 0.6 mm and 0.9 mm showcase more consistent flow distribution. This inconsistency is largely attributed to the complexities of gap fluid dynamics. Tip leakage flow (TLF) is particularly pronounced in passages with smaller clearances, exemplified by Passage 2. Such flow perturbations disturb the adjacent flow, causing non-uniform flow velocities within the passage, compromising impeller stability and efficiency, potentially leading to vibrations and jeopardizing the pump’s operational robustness. Passages with larger clearances typically demonstrate more balanced flow rates, usually augmenting impeller performance. In summary, the magnitude of the tip clearance critically determines the flow and mass flow rate distribution within the passages. Strategic design and optimization of this clearance are vital to boost pump efficiency and reliability, mitigating undesirable leakages, refining flow distribution, and enhancing overall performance.
Figure 11 illustrates the gas void fraction (GVF) distribution within the flow passage at a blade height of 0.5. Figure 11 reveals pronounced gas accumulation in Passage 2 with a tip clearance of 0 mm and in Passages 2 and 3 with a clearance of 0.3 mm. This accumulation diminishes the overflow of liquid, leading to a notably uneven mass flow distribution. Nonetheless, when the tip clearance increases to 0.6 mm and 0.9 mm, there is a marked change in gas distribution. In these scenarios, gas disperses more uniformly throughout the passages, resulting in a more equitable mass flow distribution. This enhanced uniformity, which presumably augments pump performance, corresponds with the data in Figure 10. Uniform gas distribution at broader tip clearances implies a pivotal threshold beyond which gas obstruction in the impeller passage can be effectively reduced. This revelation holds considerable relevance for the design and strategic optimization of gas–liquid multiphase pumps.

3.4. Influence of Blade Tip Clearance on Gas Void Fraction Distribution

In the impeller, a randomly selected flow passage is analyzed to examine the distribution of the gas void fraction near the tip clearance. Cross-sections are designated every 15° around the rotational axis, extending from the inlet to the outlet. These sections are labeled sequentially from A1 to A6, as shown in Figure 12.
In Figure 12, it is evident that under various tip clearance conditions, there is no significant accumulation of gas either in the gap region or on the blade’s pressure surface adjacent to the gap. The absence of this accumulation is likely due to the increased flow velocity at the gap, which causes the gas to become entrained in the liquid flow. The reduced relative pressure on the nearby suction surface results in gas accumulation. Moreover, at a tip clearance of 0.3 mm, the GVF in each section notably increases, compared to clearances of 0.6 mm or 0.9 mm. This trend can be linked to the expansion of the TLF area with an increasing tip clearance which, in turn, reduces the primary flow and boosts the liquid flow velocity. As shown in Figure 13, with the rise in tip clearance, there is a proportional increase in the liquid phase’s velocity. This elevated velocity encourages the entrainment of a larger gas volume by the liquid flow. The gas entrainment effect is especially prominent at a tip clearance of 0.3 mm, confirming our previous observations. However, as the clearance expands further to 0.6 mm and 0.9 mm, the amount of entrained gas starts to decrease, possibly due to a higher liquid flow velocity resulting in gas–liquid separation. Further examination of the figure shows a denser region of gas concentration at a tip clearance of 0.3 mm. Such concentrated gas aggregations might compromise the liquid flow’s stability, subsequently impacting blade performance and efficiency.
Figure 14 illustrates the variations in the average GVF within the impeller passages across different tip clearances. The GVF is at its peak with no tip clearance and decreases as the clearance expands. Notably, the GVF experiences a significant decline when the clearance reaches 0.9 mm, consistent with the observations in Figure 11. The average GVF in the impeller passages transitions sharply from 15.12% at 0 mm clearance to 12.34%, 9.13%, and then 6.27%. These percentages correspond to reductions of 18.39%, 39.62%, and 58.53%, respectively, compared to the condition with no clearance. The pronounced reduction in GVF with increasing clearance can be ascribed to several factors. Firstly, a larger clearance may introduce heightened turbulence within the impeller passages, facilitating the more efficient dispersion of gas bubbles and thereby decreasing the local gas concentration. Secondly, a larger clearance might enhance gas–liquid separation, allowing gas to evacuate more easily from the impeller area, resulting in a decreased GVF. However, while increased tip clearance reduces gas concentration in the impeller passages, amplifying its gas transport capability, it also augments the potential for leakage through the gap. Such leakage could negate the advantages of diminished gas concentration, leading to a decline in the system’s overall efficiency.

4. Conclusions

Using the Eulerian non-uniform two-fluid model, this study investigates the effects of varying blade tip clearances on the external characteristics of the multiphase pump, the leakage flows across the clearance gap, and the internal gas distribution inside the impeller. The results provide guidance for selecting the optimal tip clearance during multiphase pump design.
(1)
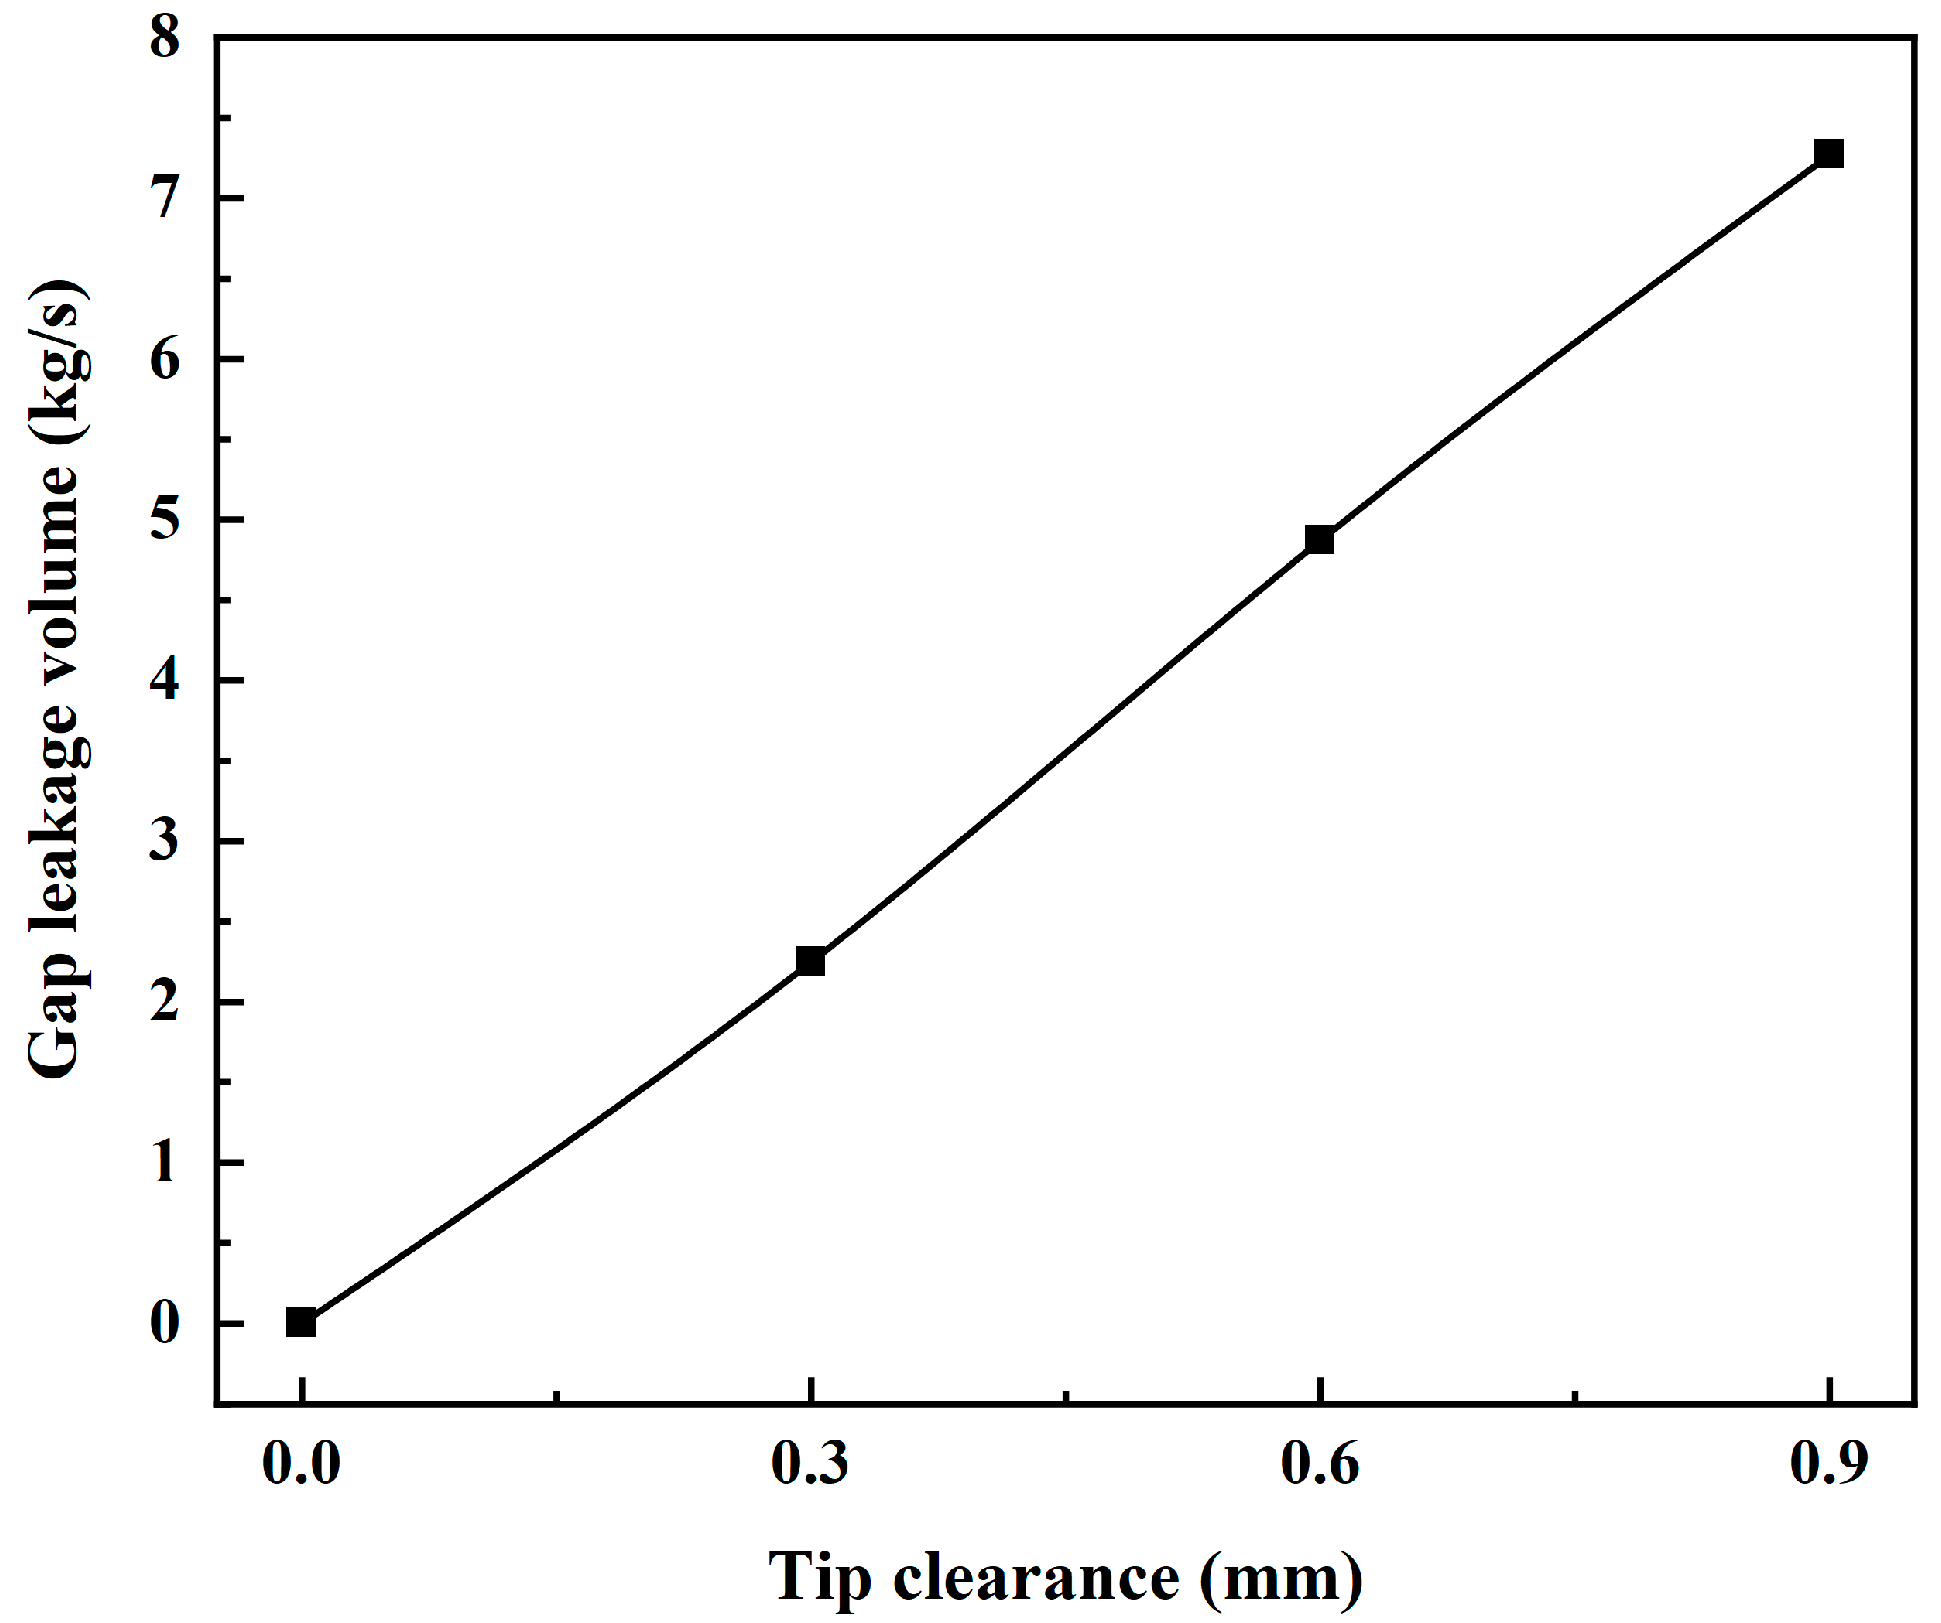
The presence of a tip clearance in the multiphase pump leads to leakage flow within the gap. This leakage flow has a near-linear relationship with the size of the clearance. As the clearance increases, the leakage volume grows, dispersing across multiple flow passages, resulting in energy loss and a notable reduction in the pump head coefficient.
(2)
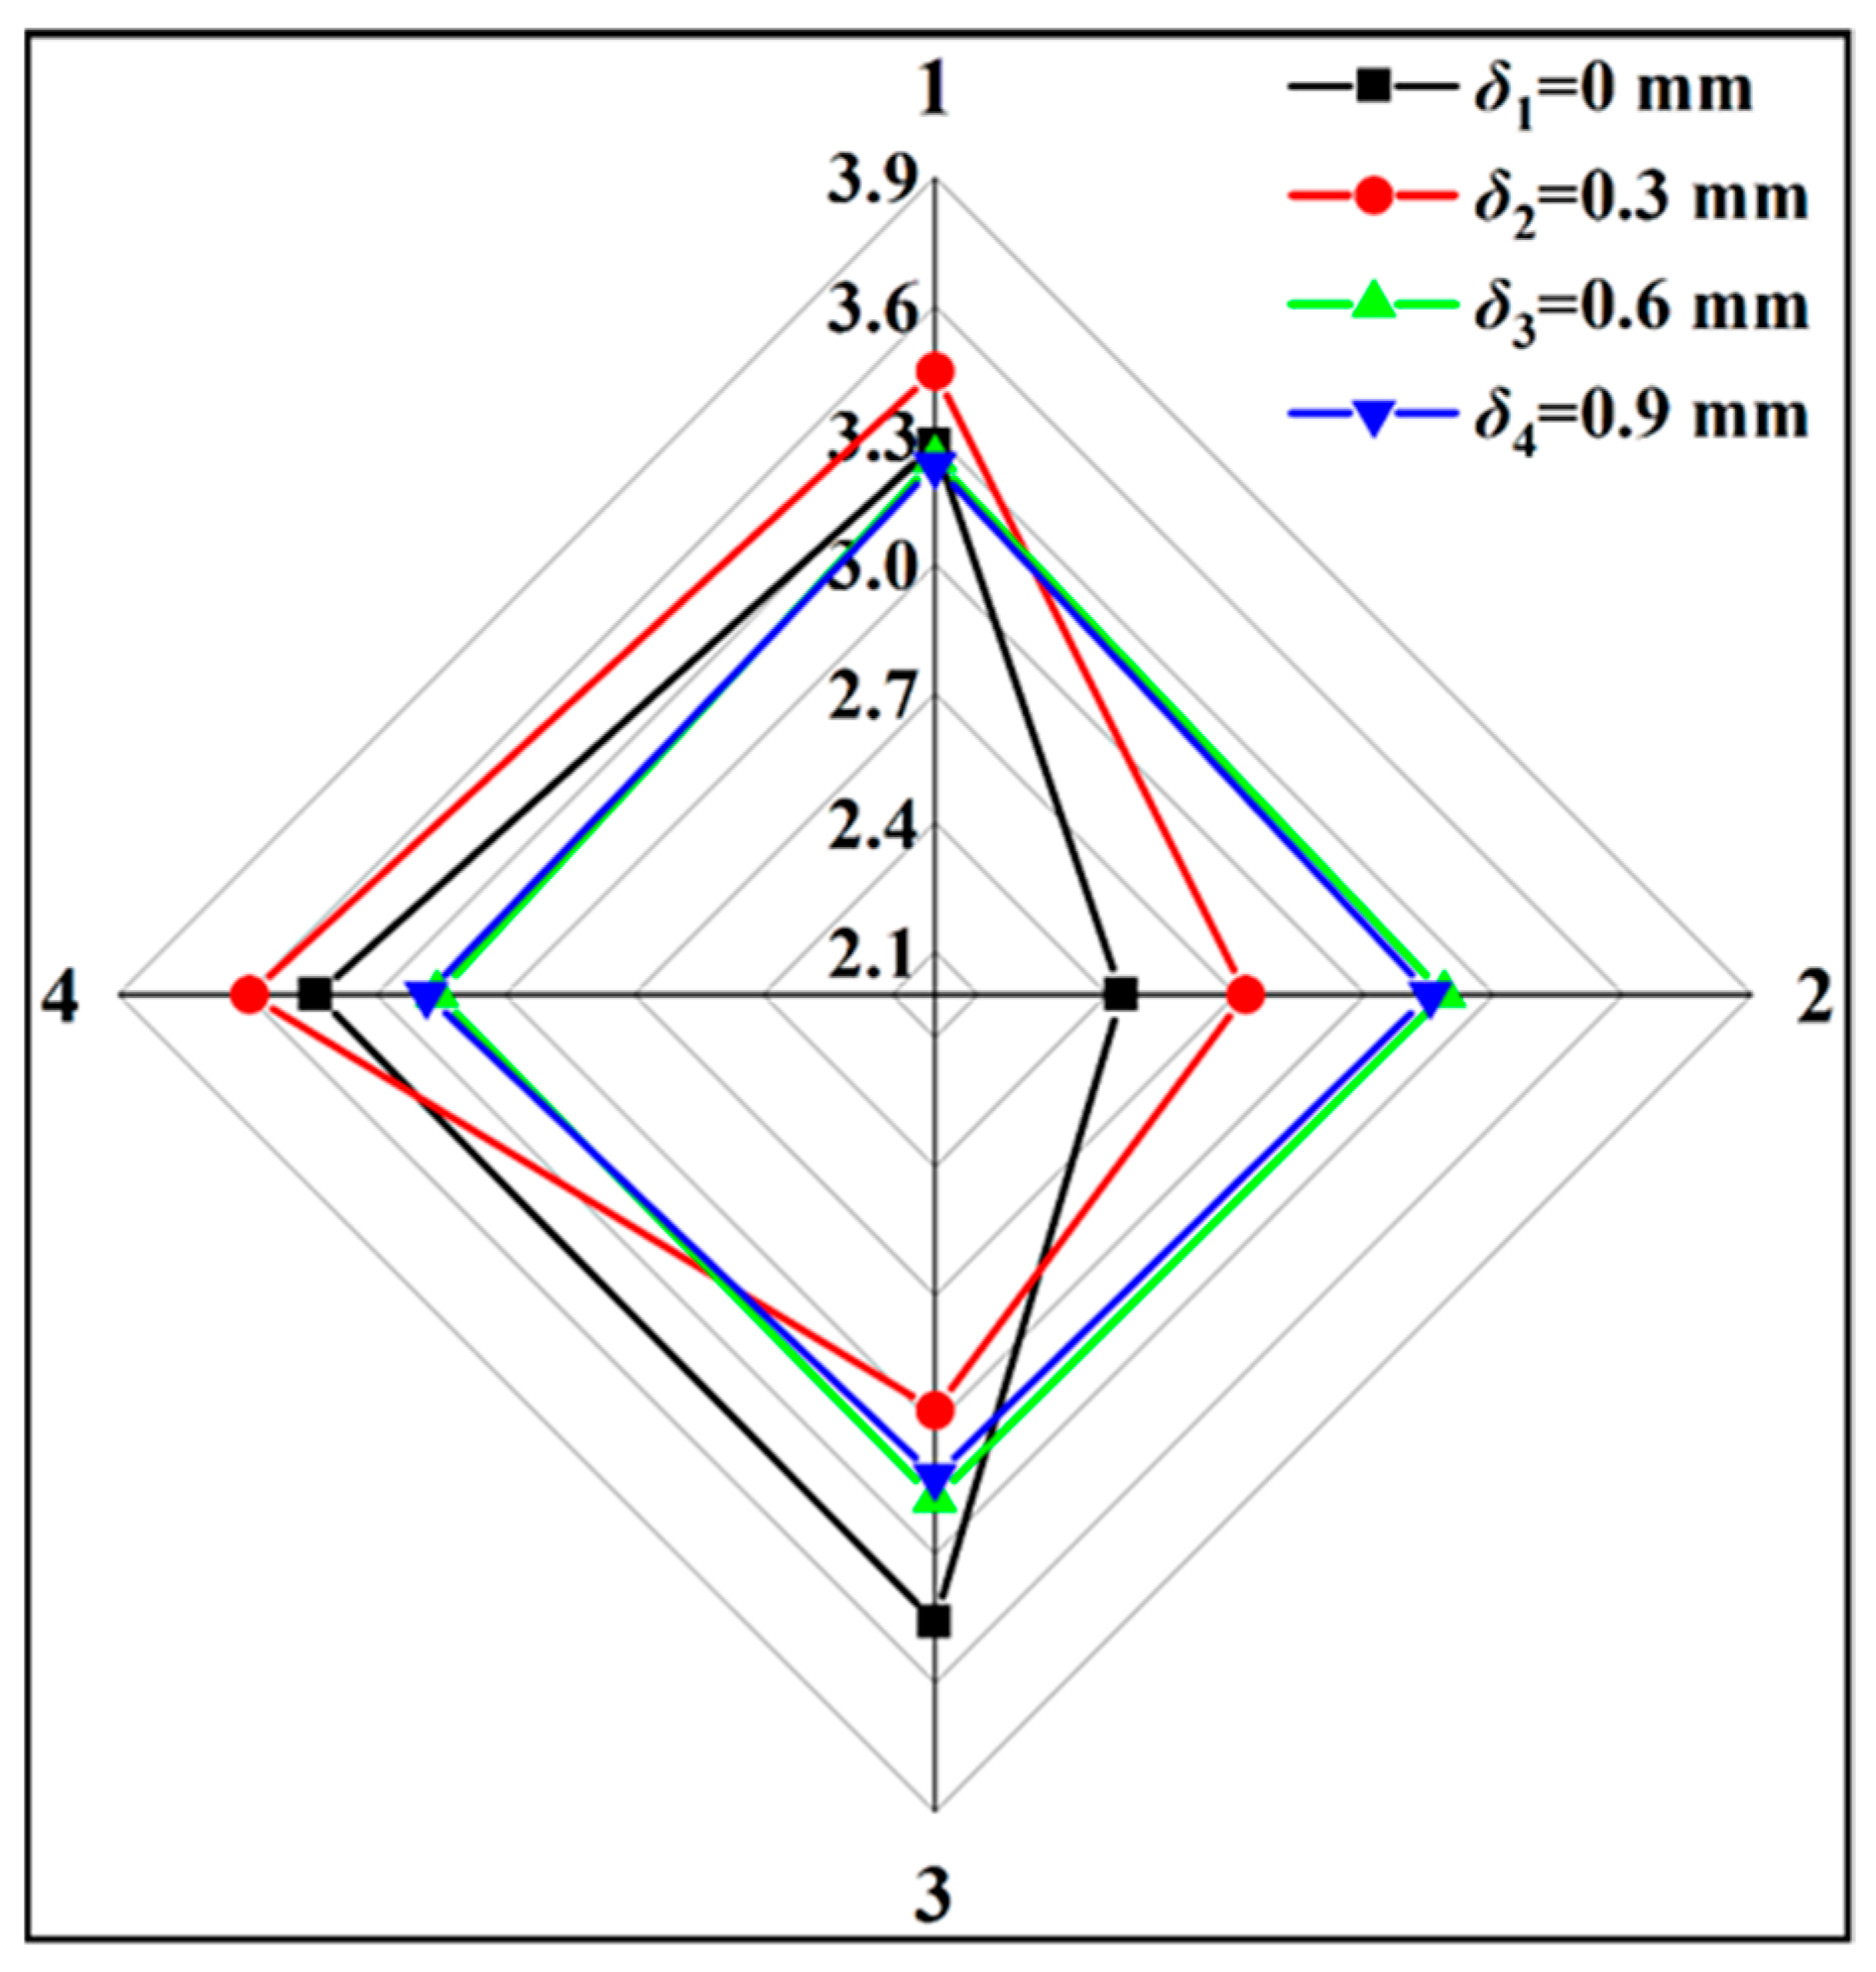
The tip clearance plays a pivotal role in influencing the flow distribution within the passages. Clearances of 0 mm and 0.3 mm show marked irregularities in flow distribution. However, larger clearances, such as 0.6 mm and 0.9 mm, promote a more uniform flow distribution. This suggests that a greater tip clearance can reduce the often-seen flow irregularities or “clogging” inside the impeller passage.
(3)
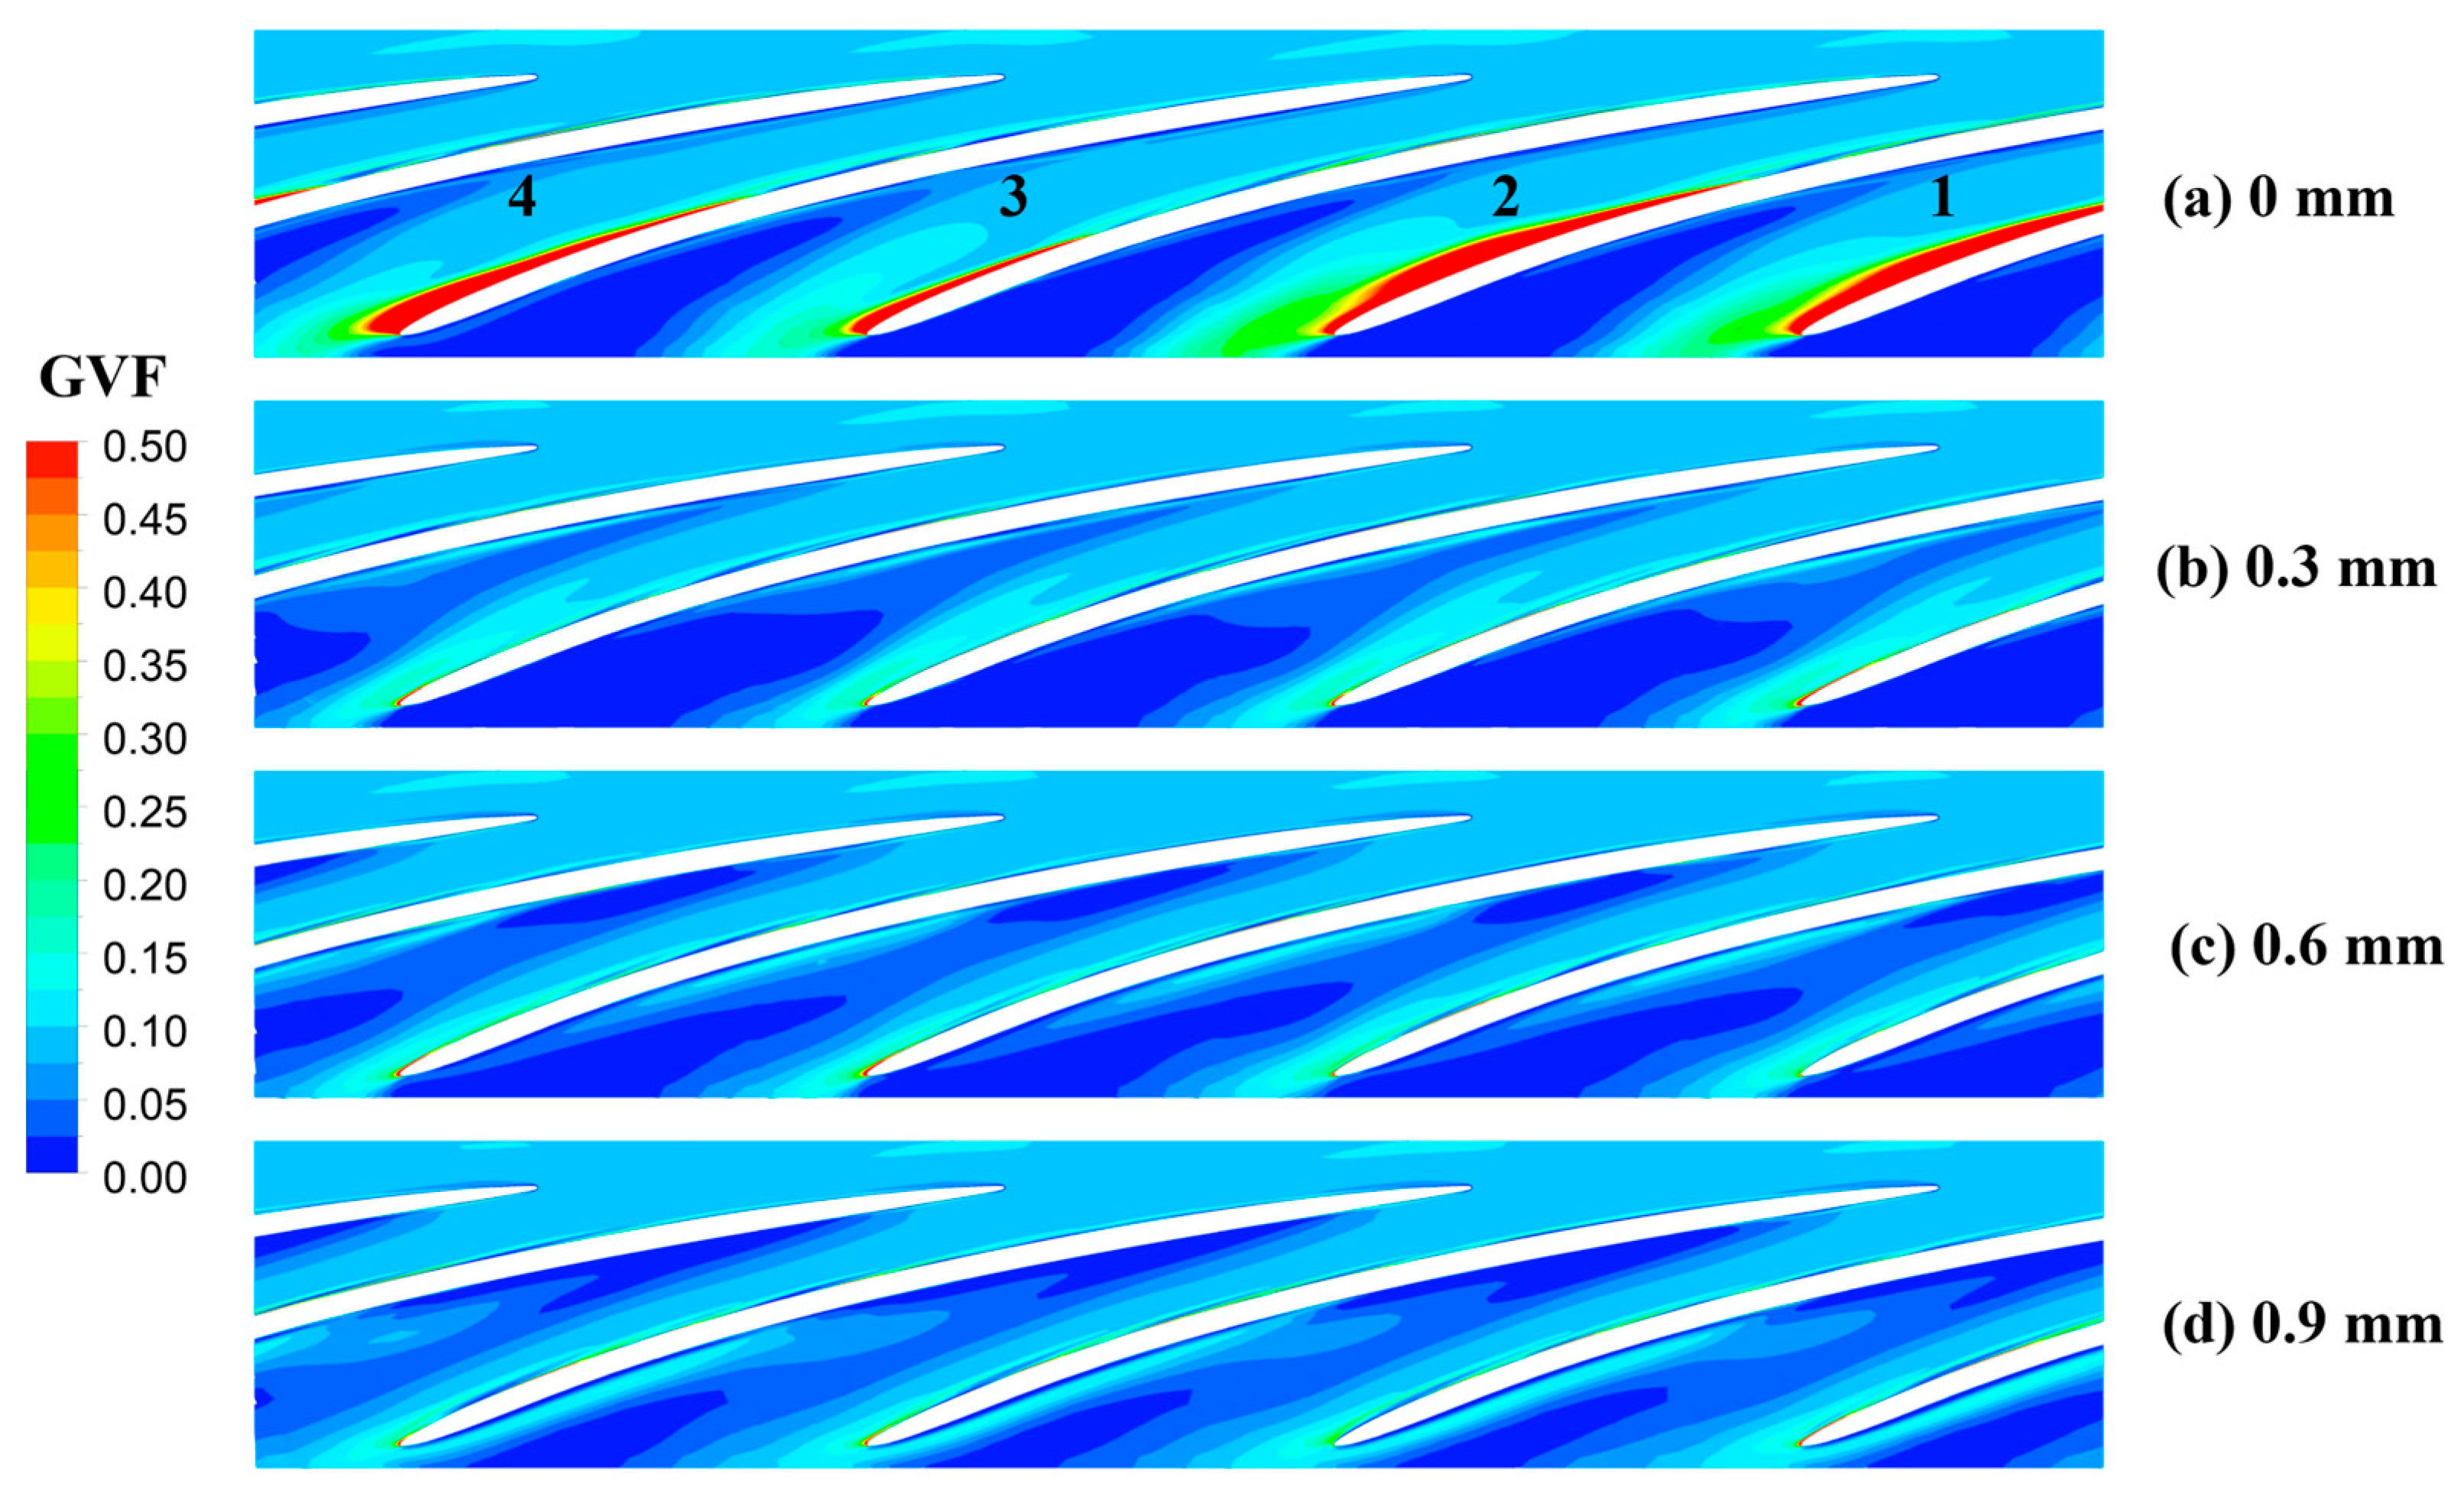
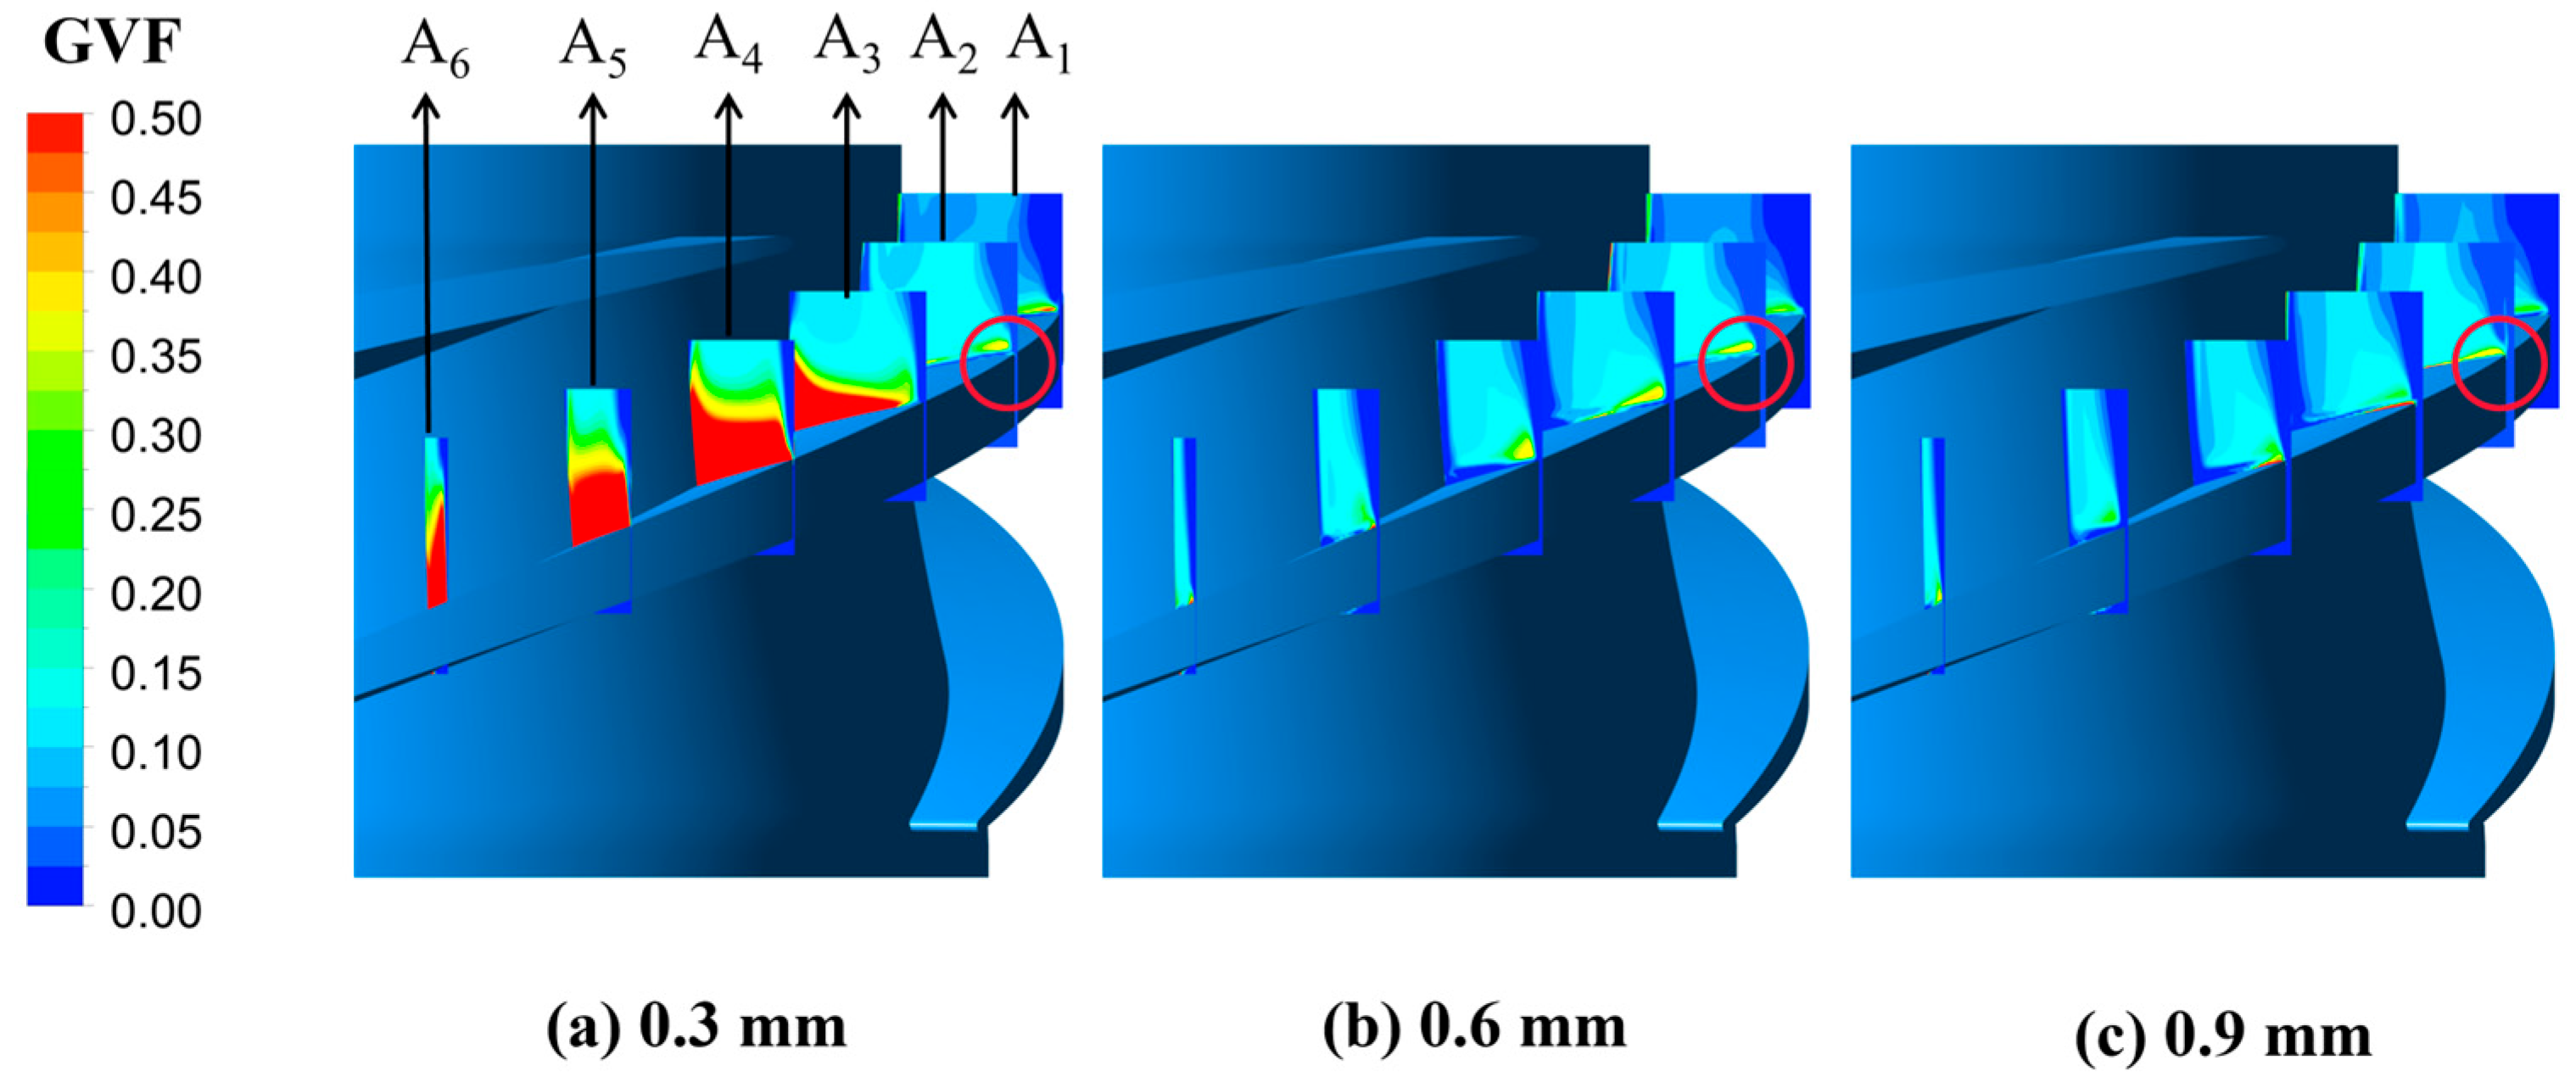
While the tip clearance does not lead to substantial gas accumulation, a discernible concentration is present near the clearance on the blade’s suction side. A notable observation is the diminishing gas content in the impeller passage with increasing tip clearance. Compared to a scenario with no tip clearance (0 mm), there is a significant 58.53% decrease in gas content at a clearance of 0.9 mm.

Supplementary Materials

The following supporting information can be downloaded at: https://www.mdpi.com/article/10.3390/pr11113170/s1, Figure S1: Tip clearance grid. Figure S2: Relationship between the gap and head coefficient. Table S1: Main sensor parameters.

Author Contributions

Conceptualization, Y.D.; Methodology, Y.D.; Writing—Original Draft Preparation, J.X.; Writing—Review and Editing, Y.L.; Visualization, Y.Z.; Supervision, Y.D.; Software, C.K. All authors have read and agreed to the published version of the manuscript.

Funding

This research was funded by the Open Research Subject of Key Laboratory of Fluid and Power Machinery, Ministry of Education (Grant No. LTDL2020-005), Gansu Provincial Key R&D Program (Grant No. 22YF7GA129).

Data Availability Statement

All the data are already in the article.

Acknowledgments

The authors would like to thank all staff of the treatment plants for making this study possible.

Conflicts of Interest

The authors declare no conflict of interest.

References

  1. Hu, W.; Bao, J.; Hu, B. Trend and progress in global oil and gas exploration. Pet. Explor. Dev. 2013, 40, 439–443. [Google Scholar] [CrossRef]
  2. Cheng, Y.; Wang, X.; Ur Rehman, W.; Sun, T.; Shahzad, H.; Chai, H. Numerical simulation and experimental performance research of cylindrical vane pump. Proc. Inst. Mech. Eng. Part C J. Mech. Eng. Sci. 2021, 236, 1698–1720. [Google Scholar] [CrossRef]
  3. Xu, Y.; Cao, S.L.; Reclari, M.; Wakai, T.; Sano, T. Multiphase performance and internal flow pattern of helico-axial pumps. IOP Conf. Ser. Earth Environ. Sci. 2019, 240, 032029. [Google Scholar] [CrossRef]
  4. Saadawi, H. Operating Multiphase Helicoaxial Pumps in Series To Develop a Satellite Oil Field in a Remote Desert Location. SPE Proj. Facil. Constr. 2008, 3, 1–6. [Google Scholar] [CrossRef]
  5. Ali, A.; Yuan, J.; Deng, F.; Wang, B.; Liu, L.; Si, Q.; Buttar, N.A. Research Progress and Prospects of Multistage Centrifugal Pump Capability for Handling Gas–Liquid Multiphase Flow: Comparison and Empirical Model Validation. Energies 2021, 14, 896. [Google Scholar] [CrossRef]
  6. Zhang, J.; Cai, S.; Li, Y.; Zhu, H.; Zhang, Y. Visualization study of gas–liquid two-phase flow patterns inside a three-stage rotodynamic multiphase pump. Exp. Therm. Fluid Sci. 2016, 70, 125–138. [Google Scholar] [CrossRef]
  7. Maleki, A.; Ghorani, M.M.; Haghighi, M.H.S.; Riasi, A. Numerical study on the effect of viscosity on a multistage pump running in reverse mode. Renew. Energy 2020, 150, 234–254. [Google Scholar] [CrossRef]
  8. Liu, M.; Tan, L.; Xu, Y.; Cao, S. Optimization design method of multistage multiphase pump based on Oseen vortex. J. Pet. Sci. Eng. 2020, 184, 106532. [Google Scholar] [CrossRef]
  9. Shamsuddeen, M.M.; Ma, S.-B.; Kim, S.; Yoon, J.-H.; Lee, K.-H.; Jung, C.; Kim, J.-H. Flow Field Analysis and Feasibility Study of a Multistage Centrifugal Pump Designed for Low-Viscous Fluids. Appl. Sci. 2021, 11, 1314. [Google Scholar] [CrossRef]
  10. Liu, J.; Liu, S.; Sun, Y.; Wu, Y.; Wang, L. Three Dimensional Flow Simulation of Load Rejection of a Prototype Pump-Turbine. Eng. Comput. 2013, 29, 417–426. [Google Scholar] [CrossRef]
  11. Liu, J.; Liu, S.; Sun, Y.; Jiao, L.; Wu, Y.; Wang, L. Three-Dimensional Flow Simulation of Transient Power Interruption Process of a Prototype Pump-Turbine at Pump Mode. J. Mech. Sci. Technol. 2013, 27, 1305–1312. [Google Scholar] [CrossRef]
  12. Cao, S.; Peng, G.; Yu, Z. Hydrodynamic Design of Rotodynamic Pump Impeller for Multiphase Pumping by Combined Approach of Inverse Design and CFD Analysis. J. Fluids Eng. 2004, 127, 330–338. [Google Scholar] [CrossRef]
  13. Zhang, J.; Zhu, H.; Yang, C.; Li, Y.; Wei, H. Multi-objective shape optimization of helico-axial multiphase pump impeller based on NSGA-II and ANN. Energy Convers. Manag. 2011, 52, 538–546. [Google Scholar] [CrossRef]
  14. Kim, J.H.; Lee, H.C.; Kim, J.H.; Choi, Y.S.; Yoon, J.Y.; Yoo, I.S.; Choi, W.C. Improvement of Hydrodynamic Performance of a Multiphase Pump Using Design of Experiment Techniques. J. Fluids Eng. 2015, 137, 081301. [Google Scholar] [CrossRef]
  15. Zhang, Y.; Zhang, J.; Zhu, H.; Cai, S. 3D Blade Hydraulic Design Method of the Rotodynamic Multiphase Pump Impeller and Performance Research. Adv. Mech. Eng. 2014, 6, 803972. [Google Scholar] [CrossRef]
  16. Zhang, J.; Li, Y.; Vafai, K.; Zhang, Y. An investigation of the flow characteristics of multistage multiphase pumps. Int. J. Numer. Methods Heat Fluid Flow. 2018, 28, 763–784. [Google Scholar] [CrossRef]
  17. Li, Y.; Yu, Z.; Zhang, W.; Yang, J.; Ye, Q. Analysis of bubble distribution in a multiphase rotodynamic pump. Eng. Appl. Comput. Fluid Mech. 2019, 13, 551–559. [Google Scholar] [CrossRef]
  18. Li, Y.; Yu, Z. Distribution and motion characteristics of bubbles in a multiphase rotodynamic pump based on modified non-uniform bubble model. J. Pet. Sci. Eng. 2020, 195, 107569. [Google Scholar] [CrossRef]
  19. Zhang, W.; Yu, Z.; Li, Y. Analysis of flow and phase interaction characteristics in a gas-liquid two-phase pump. Oil Gas Sci. Technol.-Rev. IFP Energ. Nouv. 2018, 73, 69. [Google Scholar] [CrossRef]
  20. Zhang, W.; Xie, X.; Zhu, B.; Ma, Z. Analysis of phase interaction and gas holdup in a multistage multiphase rotodynamic pump based on a modified Euler two-fluid model. Renew. Energy 2021, 164, 1496–1507. [Google Scholar] [CrossRef]
  21. Sun, W.; Yu, Z.; Zhang, K.; Liu, Z. Analysis of Tip Clearance Effect on the Transportation Characteristics of a Multiphase Rotodynamic Pump Based on the Non-Uniform Bubble Model. Fluids 2022, 7, 58. [Google Scholar] [CrossRef]
  22. Zhang, W.; Yu, Z.; Li, Y. Application of a non-uniform bubble model in a multiphase rotodynamic pump. J. Pet. Sci. Eng. 2019, 173, 1316–1322. [Google Scholar] [CrossRef]
  23. Zhang, J.; Cai, S.; Zhu, H.; Qiang, R. Characteristic Analysis of Pressure Fluctuation in a Three-Stage Rotodynamic Multiphase Pump. ASME Int. Mech. Eng. Congr. Expo. 2018, 140, 101107. [Google Scholar] [CrossRef]
  24. Shi, G.; Liu, Z.; Xiao, Y.; Li, H.; Liu, X. Velocity characteristics in a multiphase pump under different tip clearances. Proc. Inst. Mech. Eng. Part A J. Power Energy 2020, 235, 454–475. [Google Scholar] [CrossRef]
  25. Li, X.; Li, Z.; Zhu, B.; Wang, W. Effect of Tip Clearance Size on Tubular Turbine Leakage Characteristics. Processes 2021, 9, 1418. [Google Scholar] [CrossRef]
  26. Kock, F.; Herwig, H. Local Entropy Production in Turbulent Shear Flows: A High-Reynolds Number Model with Wall Functions. Int. J. Heat Mass Transf. 2004, 47, 2205–2215. [Google Scholar] [CrossRef]
Figure 1. Computational model.
Processes 11 03170 g001
Figure 2. Schematic diagram of tip clearance.
Processes 11 03170 g002
Figure 3. Computational grid. (a) Blade; (b) diffuser; (c) tip clearance.
Processes 11 03170 g003
Figure 4. Grid independence verification.
Processes 11 03170 g004
Figure 5. Experimental schematic diagram. 1, air compressor; 2, gas tank; 3, valve; 4, gas flowmeter; 5, water tank; 6, valve; 7, liquid flowmeter; 8, buffer; 9, pressure sensor; 10, multiphase pump; 11, data collector.
Processes 11 03170 g005
Figure 6. Validation of the numerical calculation.
Processes 11 03170 g006
Figure 7. TLF volume at different tip clearance.
Processes 11 03170 g007
Figure 8. TLF streamlines at different tip clearances. (a) Leakage flow in runners; (b) leakage flow in the clearance.
Processes 11 03170 g008
Figure 9. Vortex swirling strength distribution of the impeller.
Processes 11 03170 g009
Figure 10. Flow distribution in each flow passage of the impeller.
Processes 11 03170 g010
Figure 11. Distribution of gas void fraction in impeller.
Processes 11 03170 g011
Figure 12. Distribution of gas void fraction around tip clearances.
Processes 11 03170 g012
Figure 13. Distribution of liquid phase velocity in impeller passage.
Processes 11 03170 g013
Figure 14. Distribution of average gas void fraction in impeller passage.
Processes 11 03170 g014
Table 1. Main technical parameters.
ParameterImpellerDiffuser
Blade number411
Shroud radius (mm)7575
Inlet hub radius (mm)58.9667
Outlet hub radius (mm)6760
Axial length (mm)5565
Table 2. Head coefficient under different tip clearance.
Tip Clearance (mm)Head Coefficient (φh)
00.3023
0.30.2968
0.60.2926
0.90.2877
Disclaimer/Publisher’s Note: The statements, opinions and data contained in all publications are solely those of the individual author(s) and contributor(s) and not of MDPI and/or the editor(s). MDPI and/or the editor(s) disclaim responsibility for any injury to people or property resulting from any ideas, methods, instructions or products referred to in the content.

