1. Introduction
In recent years, the 4th industrial revolution has gained momentum in the manufacturing industry, driven by the innovative use of big data. Within the manufacturing sector, the main application of big data has traditionally been concentrated on image-based detection of defects in semi-finished and finished products, as well as quality-control-related activities. However, recent research has revealed an expanded array of big data applications within this field. By incorporating big data technology into manufacturing processes, significant advancements in accuracy and precision have been realized across various aspects such as planning, production, and logistics. This integration is not only leading to enhanced efficiency but also fueling a growing demand for the utilization of big data to augment equipment safety and performance.
Building upon this emerging paradigm, this paper presents a novel model designed to predict the NG (Natural Gas) discharge temperature of the pneumatic vaporizer in a liquefied gas vaporization facility, employing field data. The proposed methodology harnesses artificial intelligence models, positioning itself as an essential tool for maximizing the operational efficiency of pneumatic vaporizers. Furthermore, the implications of this model extend beyond mere efficiency enhancements. It also offers valuable support for operation automation, meticulously considering vital safety parameters. This advancement symbolizes a broader shift towards data-driven solutions in the manufacturing sector that synergize efficiency, innovation, and safety. Ultimately, this research underscores the transformative role of big data, heralding a new era of possibilities in manufacturing technology and methodologies.
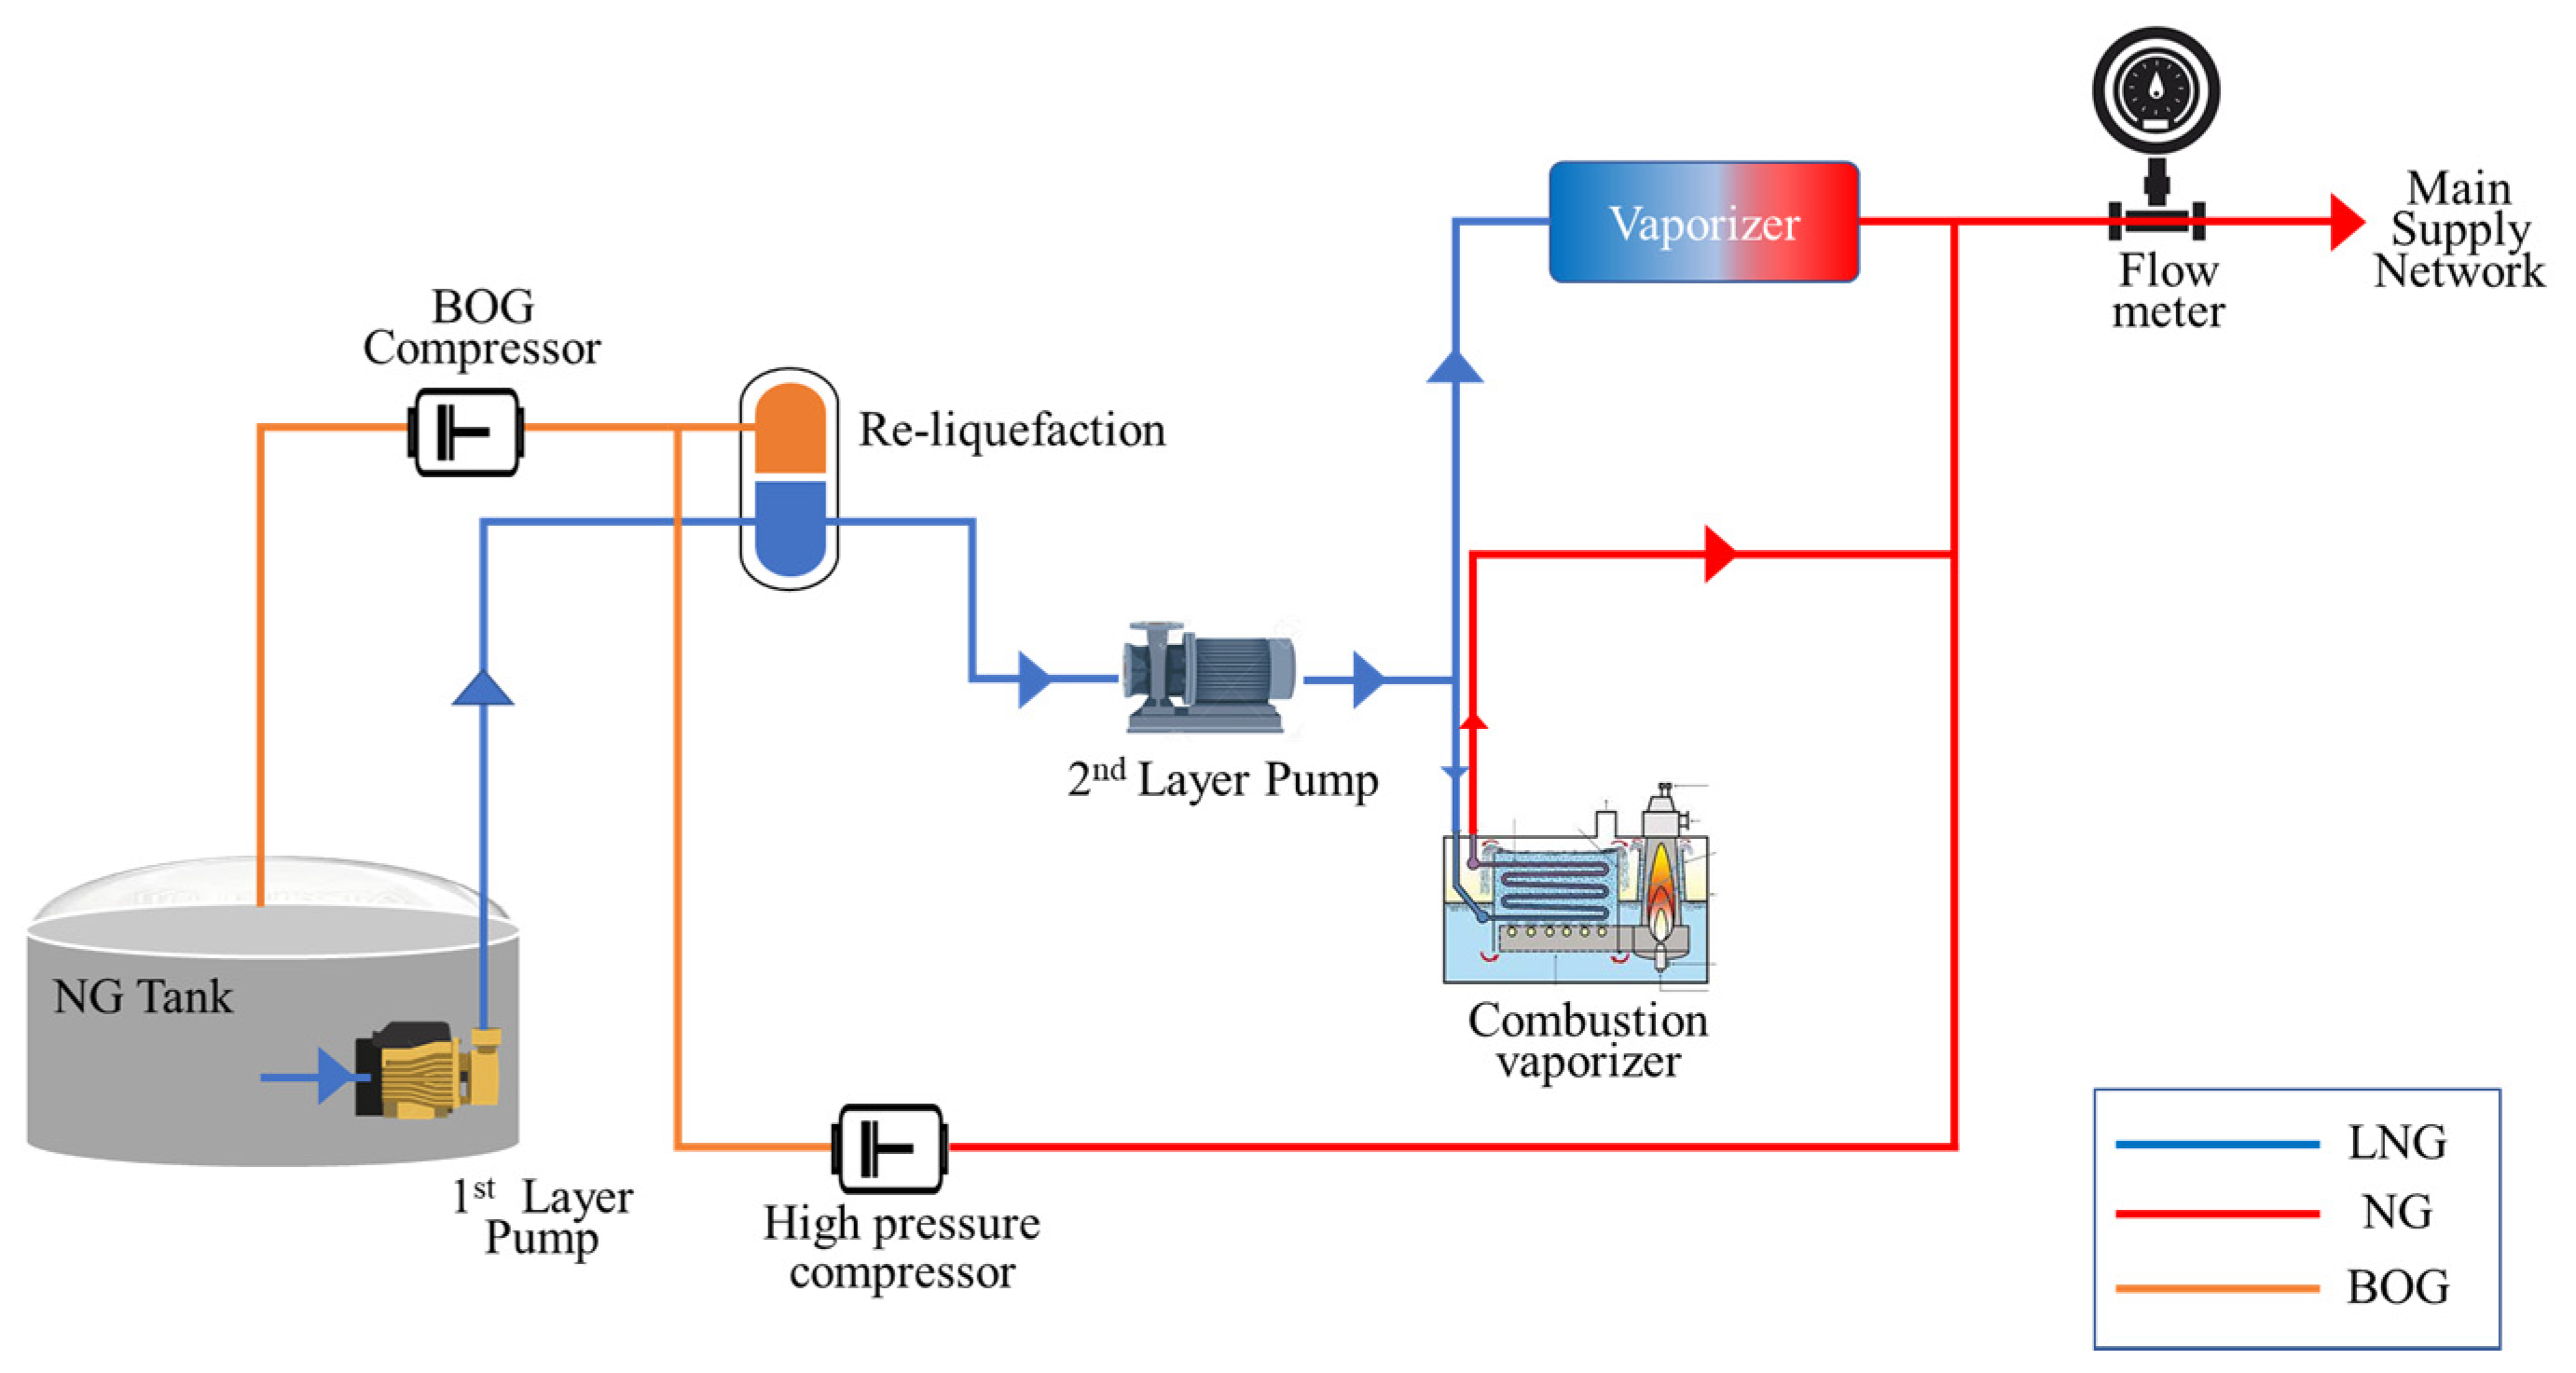
When transporting natural gas from one continent to another, the volume of the gas is reduced through liquefaction, converting it from a gaseous state to a liquid state for more efficient shipping by sea. Once delivered, the liquefied natural gas (LNG) is stored in tanks at a vaporization facility, where it is gasified in accordance with demand by using vaporizers. It is then distributed through natural gas (NG) supply pipes to various demand sites. NG is not only supplied to households via urban gas pipelines but also serves as fuel for natural-gas-powered power plants and large industrial complexes (
Figure 1).
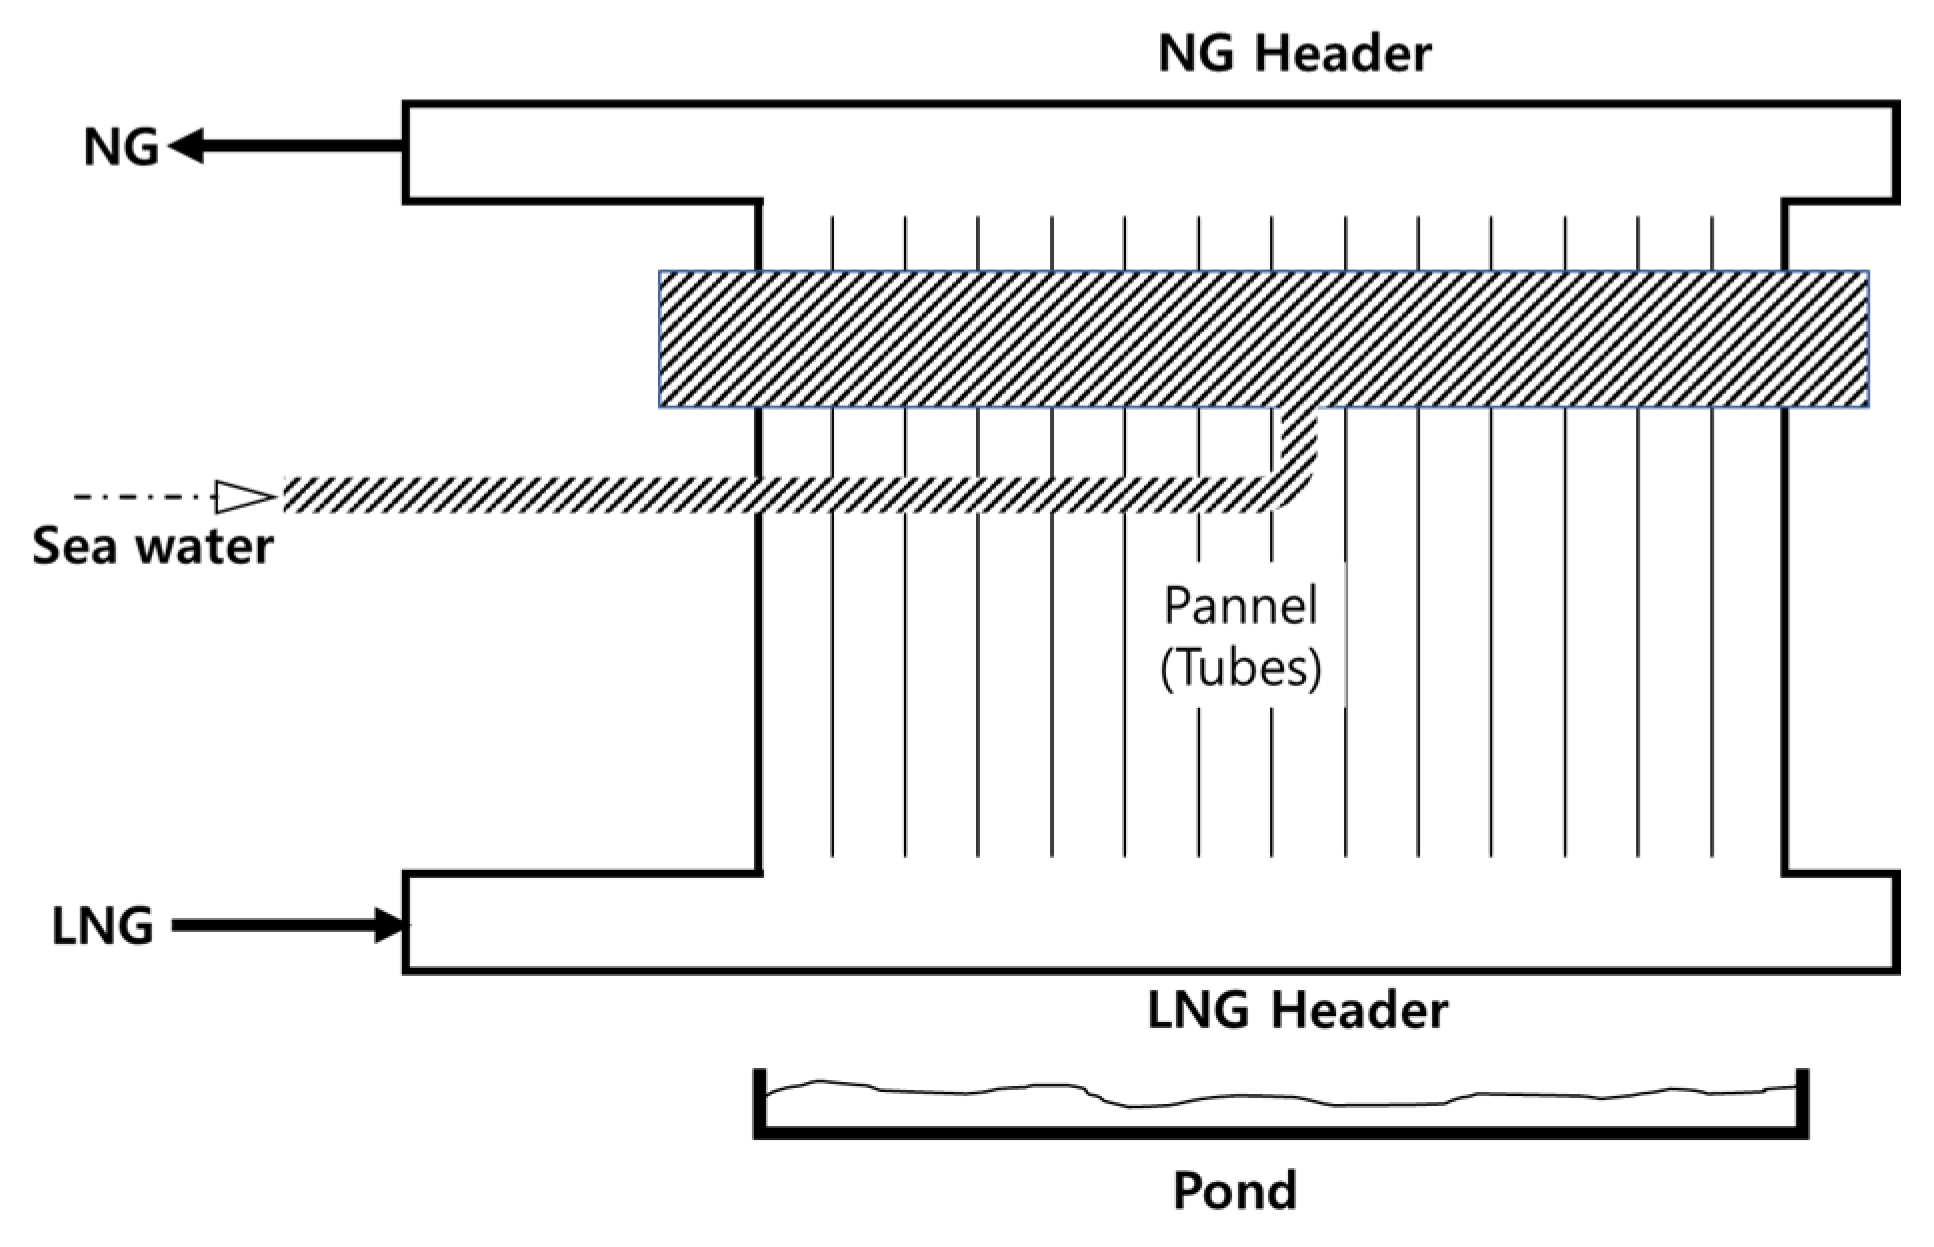
The vaporization of liquefied natural gas (LNG) to natural gas (NG) is the crucial process within a liquefied gas vaporization facility, and the vaporizer plays a pivotal role in the NG production process. Various types of vaporizers are utilized, including: (1) the open rack vaporizer (ORV), which employs seawater as a heat source via heat exchange, and (2) the ambient air vaporizer (AAV), which utilizes ambient air as a heat source. The ORV (
Figure 2) is generally more efficient in vaporizing NG than the AAV due to the higher heat capacity of seawater compared to ambient air. However, the ORV can negatively impact the marine ecosystem by reducing the seawater temperature near the plant. Conversely, the AAV (
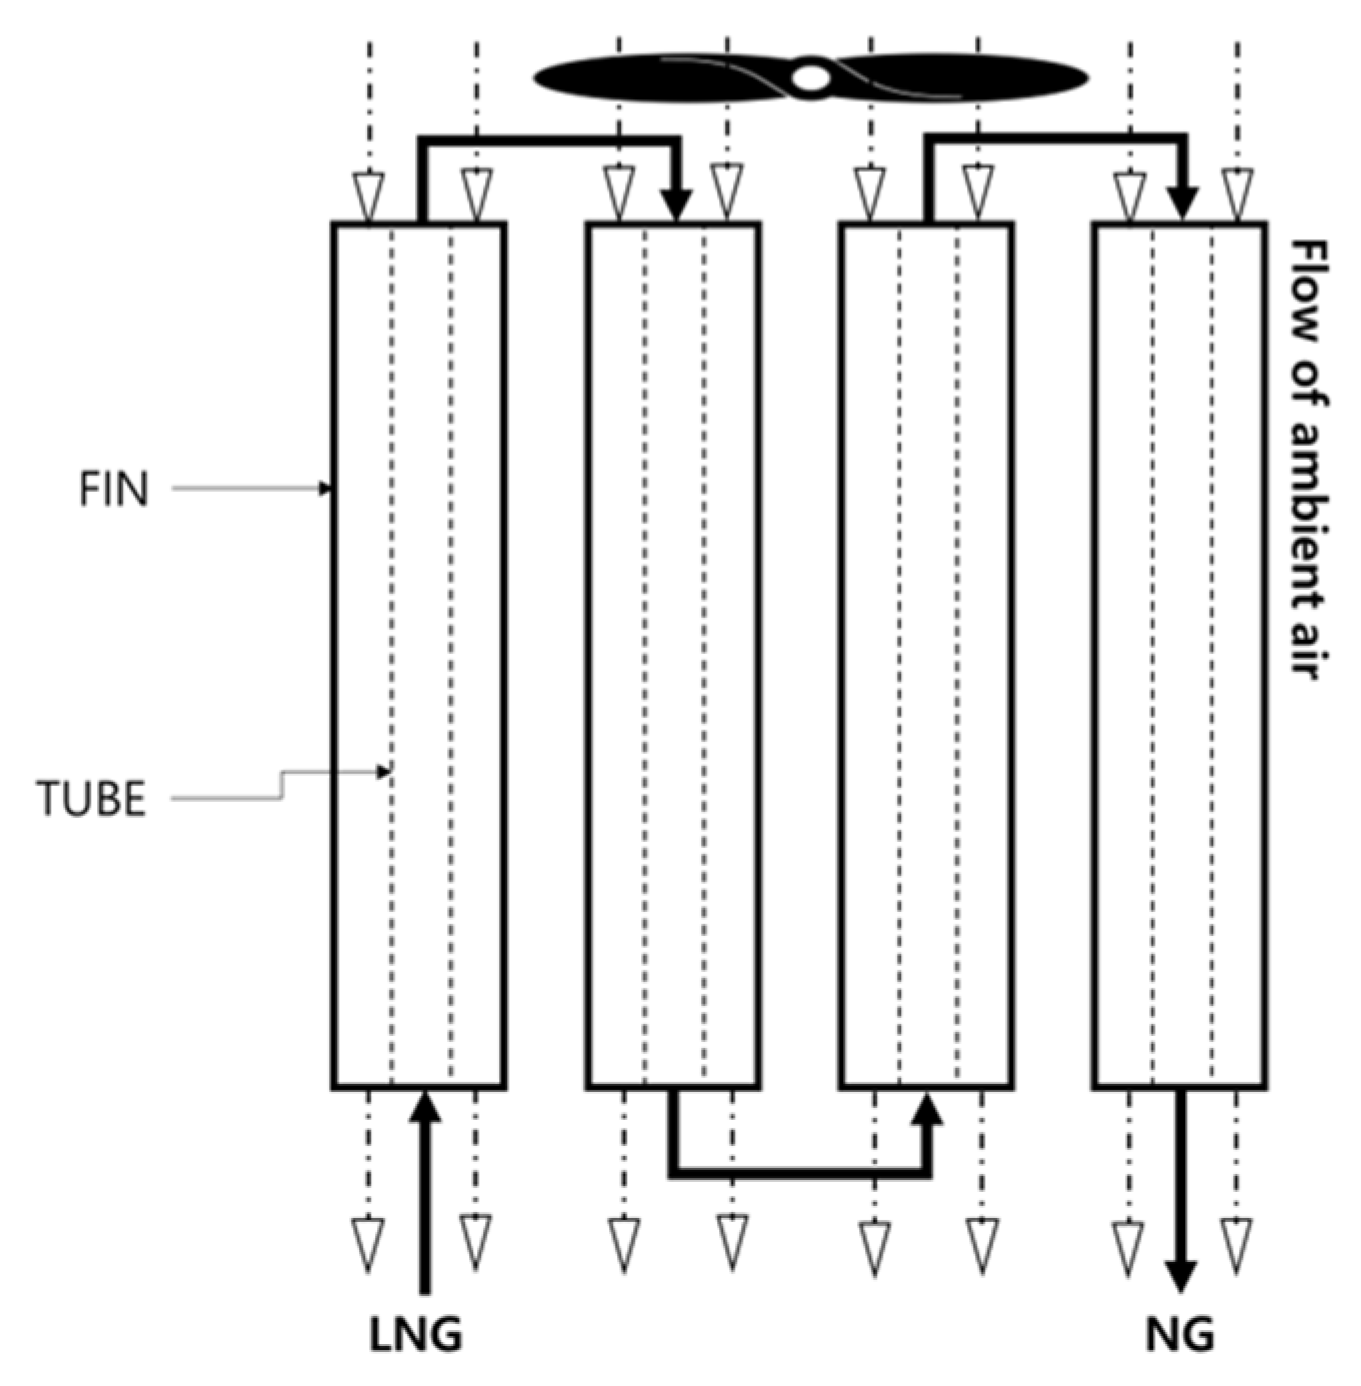
Figure 3) minimizes its impact on the surrounding ecosystem by quickly discharging and dispersing the warmed air during the vaporization of LNG. Within the AAV system, LNG is injected into the heat exchanger’s inlet, and fans atop the vaporizer tower circulate the ambient air. This air flows briskly from the top to the bottom of the heat exchanger and then scatters into the surrounding atmosphere, reducing environmental impact.
As described above, the Ambient Air Vaporizer (AAV) is a more environmentally friendly option, with reduced impact on the surrounding environment. However, it does have some limitations, particularly in terms of efficiency. The heat capacity of ambient air is less than that of water, leading to lower heat exchange efficiency, especially when the “icing phenomenon” occurs. This phenomenon happens when ice forms on the fins during the heat exchange process, hindering the efficiency. To resolve this issue, a defrosting operation must be carried out periodically. During this operation, the fan at the top of the vaporizer works without LNG flow to remove the ice around the heat exchanger’s fins. In favorable weather conditions with high temperatures and low humidity, the vaporization process can be maintained for longer periods. Conversely, in conditions of low temperatures and high humidity, the icing phenomenon is more likely, and the fans must circulate more quickly to sustain the vaporization. Therefore, the efficient operation of the AAV depends on carefully controlling the fan’s rotational speed (RPM) in line with atmospheric conditions to keep the vaporization process running as long as possible.
In the present investigation, a Deep Neural Network (DNN)-based prediction model has been meticulously devised to predict the outlet NG temperature of the Ambient Air Vaporizer (AAV), contingent on input variables such as the fan’s Rotations Per Minute (RPM) atop the heat exchanger within the AAV, in conjunction with the inlet temperature and flow rate of LNG. The rest of this manuscript is organized as follows.
Section 2 surveys antecedent works pertinent to the utilization of artificial intelligence in both operation and natural gas (NG) production plants.
Section 3 describes the architecture of the AAV and delineates its operational procedures, while concomitantly defining the problem under investigation in detail.
Section 4 provides a comprehensive account of the preprocessing and analysis procedures of extant real operation data of AAV, and isolates significant input data germane to the outlet temperature of NG from the scrutiny of this data. Also,
Section 4 elucidates the predictive DNN modeland validates the model’s accuracy through empirical analysis of field data. Finally,
Section 5 succinctly encapsulates the contributions of the present study and proffers directions for prospective research endeavors.
In the engineering plant industry, large and intricate machinery operate systematically to produce products by consuming energy or vital resources. Like many other industrial sectors, engineering plants have been making great efforts over the past several years to achieve production optimization by applying machine learning to their operational controls. In particular, research in the specialized field of predictive control has emerged as one of the most promising approaches toward this end. The progress and realization of this objective have been the subject of several scholarly investigations. Zhang et al. (2017) suggested a generalized architecture that utilizes big data analytics to improve Product Lifecycle Management (PLM) and to enhance decision-making processes for production [
1]. Reddy et al. (2019) developed data-driven empirical models specific to LNG BOG (boil-off gas) compressors, demonstrating superior performance over traditional Artificial Neural Network (ANN) and Kriging models [
2]. Walther et al. (2019) engaged traditional machine learning algorithms such as Random Forest (RF), Extremely Randomized Trees, and Gradient Boosting Regression Trees with the objective of forecasting the short-term electric load within a factory setting [
3]. Park et al. (2020) conducted an exploration to identify critical factors influencing the quality of steel plate manufacturing, subsequently utilizing machine learning to predict these variables [
4]. Complementing these studies, Mohamadi and Ehteram (2020) engineered a machine learning model capable of predicting the monthly evaporation of water resources with marked accuracy [
5].
Another significant domain of application for machine learning within plant engineering pertains to decision-making processes and defect detection in products, aimed at facilitating preventive maintenance of facilities. A comprehensive synthesis of cases and research findings, wherein machine learning algorithms have been employed for preventive maintenance, has been meticulously catalogued in the survey paper by Carvalho et al. (2019) [
6]. The task of defect detection in products has been the subject of rigorous investigation, traditionally employing methods geared toward classifying product images. In more recent developments, Convolutional Neural Network (CNN)-based models have emerged as the principal approach for determining product defects. Westphal and Seitz (2021) advanced this field by proposing a sophisticated transfer learning (TL) method, leveraging both the VGG16 and Xception CNN models explicitly for defect detection [
7]. Their study utilized non-destructive test data, with the VGG16-model-based TL method demonstrating a markedly high level of accuracy in comparison to alternative models. Complementing this, Zhang et al. (2021) explored various classifiers, including Long Short-Term Memory (LSTM) and Backpropagation Neural Network (BPNN), specifically for acoustic test data, in order to discern defects in glass bottles, subsequently evaluating the accuracy of these models [
8].
This study delves into the application of machine learning algorithms specifically for optimization within the domain of LNG or NG production operations. Related research in this field includes the following contributions. Adib et al. (2015) constructed an SVM-based predictive model to gauge hydrogen sulfide pressure during the removal process, utilizing input data such as top stabilizer column pressure, temperature, seal pressure, and volumetric flow rate of the condition [
9]. Zhou et al. (2020) employed diverse machine learning models, including ANN, Random Forest, AdaBoost, and XGBoost (Extreme Gradient Boosting), to anticipate the heat transfer coefficient of a capacitor, a component possessing a function contrary to that of a vaporizer [
10]. The research findings revealed that these algorithms could robustly predict condition heat transfer coefficients within mini/microchannels. Complementing these efforts, Wood (2021) designed ANN and transparent open-box learning network (TOB) models to refine tank pressure control, subsequently demonstrating that the TOB model yielded more accurate predictions of saturated vapor pressure within tanks than conventional ANN models [
11].
Research focusing on the performance of LNG vaporizers can be classified into the realm of traditional heat transfer studies, and our investigation primarily centers on this area. A substantial body of work employing the conventional approach to heat transfer within vaporizers has been conducted, both broadly and in-depth [
12,
13,
14,
15,
16]. Such studies have emphasized the analysis of vaporization characteristics, utilizing numerical models founded on the underlying equations of heat transfer, and integrating these findings into the optimal design of the vaporizer. In addition to this, there have been recent endeavors to predict vaporizer performance through machine learning, leveraging extensive field data. Notably, Shin et al. (2021) introduced a dynamic prediction model for determining NG outlet temperature and discharge seawater temperature in response to variations in an ORV’s seawater flow rate, seawater temperature, and LNG flow rate [
17]. The ensuing results indicated that the predictive accuracy as measured in MES followed the sequence of LSTM, AutoML, and FNN. Recently, Chen et. al. (2023) proposed a new hybrid model for predicting the remaining useful life (RUL) of lithium-ion batteries, combining a channel attention (CA) mechanism with long short-term memory networks (LSTM). The model demonstrates strong predictive performance, improving the use of local features in limited data scenarios and mitigating the effects of battery capacity rebound, and its effectiveness is validated using NASA and University of Maryland datasets [
18].
Despite substantial efforts to optimize the operation of vaporizers, the application of machine learning technology in this domain remains underexplored. As industries increasingly recognize the need to integrate artificial intelligence within their operational frameworks, the drive to harness its capabilities extends to both the management of production processes and the detection of defects. The primary objective of this paper is to explore the application of artificial intelligence, specifically in enhancing the efficiency of the production process, as well as in the vital task of identifying defects.
2. Problem Description
Liquefied Natural Gas (LNG) flows within the tubes of the heat exchanger, absorbing heat from the warm ambient air outside the tubes, and subsequently being converted into Natural Gas (NG). To facilitate this heat exchange process between the ambient air and LNG, a fan situated above the tubes is activated, thereby increasing the circulation of ambient air. This air is drawn into the upper side of the Ambient Air Vaporizer (AAV) by the fan, channeled through the tubes, and finally discharged at the bottom of the AAV. Since the cooled, discharged air has minimal impact on the surrounding environment, this method is often considered more eco-friendly. However, its efficiency is generally lower than that of combustion or seawater-based systems.
The effective operation of an AAV is more complex than that of other vaporizer types, as the vaporization performance can fluctuate significantly depending on unpredictable atmospheric conditions, such as temperature and humidity. A notable challenge arises when icing forms on the fins of the heat exchanger during the vaporization process, severely hindering heat exchange and causing a drastic drop in efficiency. In some instances, this icing can lead to NG temperatures falling below 0 °C, necessitating a halt in the vaporization process to perform defrosting.
The operational conditions further dictate that when the atmospheric temperature is high and humidity is low, vaporization can persist for an extended period without requiring an increase in fan rotational speed. Conversely, when the temperature and humidity levels are insufficient to maintain the planned vaporization period, the fan’s rotational speed must be increased to enhance heat exchange, thus preserving the desired vaporization duration. However, this increased speed leads to greater energy consumption. Therefore, for an energy-efficient operation of the AAV, dynamic control of the fan’s rotational speed is imperative, requiring careful adjustment in response to atmospheric conditions during the vaporization period.
Figure 4 illustrates the configuration of Ambient Air Vaporizer (AAV) groups employed in the Natural Gas (NG) production process studied in this research. This particular plant is currently under the management of an NG supply company in South Korea. The vaporization infrastructure encompasses 16 AAV cells, systematically organized into hierarchical groupings. Specifically, two cells are combined to constitute one unit, and two such units are further assembled to create four distinct groups. Within this structure, the two cells that comprise the same unit are synchronized to undertake either the vaporization or defrosting operation simultaneously. Furthermore, within the same group, the two units are coordinated so that they do not operate concurrently; in other words, if one unit is engaged in vaporizing or defrosting, the other remains inactive. This operational design is predicated on the understanding that the simultaneous activation of two adjacent units within the same group can result in a diminished heat exchange performance.
However, the system is designed to allow for flexibility, and the two units within a group may operate in tandem if the situation warrants. In such cases, while one unit undertakes the defrosting operation, the other can continue with the vaporization process. This careful orchestration ensures both efficiency and responsiveness to the variable demands of the NG production process.
The production volume of Natural Gas (NG) must align with the demands of gas consumers, thereby dictating the quantity of Liquefied Natural Gas (LNG) dispensed into Ambient Air Vaporizer (AAV) facilities according to NG requirements. In order to manage the flow of LNG through the AAV system, a seasoned operator assesses the number of units required for activation and carefully calibrates the fan speed within these units to match the processing needs. As depicted in
Figure 4, an array of data is systematically gathered during the vaporization process to inform operational decisions. Several key parameters are monitored across different stages:
- (1)
Valve Opening Angle: at the entrance of each AAV unit, the angle of the valve is tracked in degrees to regulate the flow rate of LNG entering the unit;
- (2)
Temperature Monitoring: the temperatures of both the LNG and NG are observed through thermometers positioned at the inlet and outlet of the tubes within each unit;
- (3)
Production Quantity: the volume of NG produced by each group is documented using a specialized vaporization flow meter;
- (4)
Operating States: within individual units, the duration of three distinct operating states—vaporizing, defrosting, and readiness for operation—is recorded;
- (5)
Vaporizing Period Data: for units in the vaporizing phase, pertinent data such as the rotational fan speed and the time elapsed since the initiation of vaporization are collected;
- (6)
Ambient Conditions: the surrounding air temperature and humidity levels are monitored, as they can significantly impact the efficiency of the vaporization process.
These multifaceted data points are integral to the precise and efficient control of the AAV system, ensuring that the production of NG is responsive to fluctuating consumer demands
The aforementioned data collected during the vaporization process constitute time-series information, where the temperature of the produced Natural Gas (NG) at a given moment is closely correlated with these measurements. Throughout the vaporization period, ambient air is drawn from the top of the heat exchanger and expelled at a reduced temperature from the bottom. As this bypassing of ambient air facilitates heat exchange, icing occurs on the surface of the tubes’ fins, causing a gradual decrease in the temperature of the produced NG. If the temperature of the produced NG falls below 0 °C, it must be reheated, incurring additional costs. Increasing the rotational fan speed can postpone the point at which the temperature of the produced NG drops below 0 °C. However, the operational cost of the fan, driven by electrical energy, rises in direct proportion to the rotational speed. Therefore, the challenge lies in developing an efficient operational methodology that minimizes energy expenses while maintaining vaporization performance for the targeted duration. Striking this balance requires a nuanced understanding of the interplay between temperature control, fan speed regulation, and energy consumption, highlighting the importance of sophisticated monitoring and control mechanisms within the LNG vaporization process.
At present, the control of the AAV’s fan speed and the decision to halt the vaporization operation rely heavily on human expertise, informed by various data collected during the vaporization process. Determining the optimal operation policy based on real-time data fluctuations presents a significant challenge. Predicting the precise moment when the temperature of the produced NG will fall below 0 °C under specific operational policies in a variable environment further complicates this task. To address this complex issue, we introduce a predictive model utilizing a deep neural network. The model aims to forecast the temperatures of produced NG at the outlet of the heat exchanger’s tubes—a critical factor in devising an optimal operation policy for the vaporization system. This approach seeks to integrate advanced machine learning techniques with traditional control methods, enhancing accuracy, and efficiency in a continually evolving industrial landscape.
4. Prediction Model with DNN and Test Results
To predict the temperature of NG at the outlet of the tubes in the heat exchanger after a specific time period (Δ
t), a deep learning model is designed and applied. Independent variables described in
Section 3 are given as input data of the deep neural network (DNN) model and the NG temperature at the outlet of the tubes after a specific time period (Δ
t) is defined as the output to be predicted. The input/output model structure used in the DNN is shown in
Figure 6.
We conducted training and testing on various DNN model architectures and selected two models with superior performance, naming them DNN1 and DNN2. The details of the DNN models, such as the number of hidden layers, number of nodes, and activation functions, are summarized in
Table 3. The training options set in the Keras software package (version 2.14.0) are listed in
Table 4. The raw data of AAV operation is pre-processed and synchronized in 10 min intervals and prepared for use as input/output data. About 70% of the data are used as training data and the remaining 30% are used as test data. Since the fan speed is adjusted every 4 h, the specific time period (Δ
t) for the next prediction is set to 30 min without loss of generality in the field. The performance indexes used for evaluating the prediction accuracy of the DNN models are Mean Absolute Error (MAE), Mean Square Error (MSE), and R
2 Score.
Figure 7 shows the learning curve of the training loss of a DNN1 model over epochs. As can be observed, the Mean Squared Error (MSE) starts at a high value, indicating a significant discrepancy between the model’s predictions and the actual values during the initial stages of training. However, as the training progresses through subsequent epochs, there is a rapid decline in the MSE. This suggests that the model is effectively learning and adjusting its weights to minimize the error. Around the 50th epoch, the decrease in MSE begins to stabilize, indicating that the model has reached a point where further training offers diminishing returns in error reduction.
The resulting prediction performance of the proposed DNN models is shown in
Table 5. The DNN1 model has an MSE of 3.013 °C and an MAE of 0.935, with an R
2 Score (calculated as 1–SSE/SST, where SSE represents the Sum of Squared Error and SST is the Sum of Squared Total) of 0.961. This indicates the robust performance of the proposed model. The performance of DNN2 is nearly identical to that of DNN1. Despite having different layers, both DNN1 and DNN2 models yielded similar results. From this, it is inferred that the performance of Deep Neural Networks may not be highly sensitive to their architectural variations. Additionally, we trained the following machine learning models and compared their performance to that of the DNN models: Random Forest (RF), Gradient Boosting Regression (GBR), K-Neighbors Regression (K-NR), and Support Vector Regression (SVR). Overall, the performance of RF is comparable to that of DNN1 and DNN2, while the other models did not match the satisfactory results of the DNNs. Notably, while the SVR model exhibited excellent performance on the training data, its performance on the test data was markedly poor, rendering it unsuitable for practical use. This suggests a severe overfitting issue during the training of the SVR model.
In
Table 6, the results of prediction are re-grouped into two categories: (1) NG outlet temperature is below 0 °C and (2) overall temperature range of NG outlet. As the prediction accuracy of the NG outlet temperature becomes lower according to
Table 6, the prediction error tends to increase for both low-speed RPM and high-speed RPM. It seems that there are unique characteristics in the dataset that result in a prediction inaccuracy for low outlet NG temperatures. Considering the real operation of AAVs in the field, if the outlet temperature of the NG falls below 0 °C, the operator urgently tries to adjust the outlet temperature higher by increasing the fan speed. Therefore, cases of both the outlet temperature of the NG and the fan speed being low are very rare. This imbalanced data characteristic decreases prediction performance at low outlet temperatures and low fan speeds. A more diverse test case should be done in the field and more related data should be collected in order to increase the accuracy across the whole range of temperatures and fan speeds.
5. Conclusions
In this study, we embarked on preliminary research with the goal of developing artificial intelligence technology to enhance the efficiency and safety of the entire Ambient Air Vaporizer (AAV) system. Leveraging real operational data collected over approximately one whole year, we gained critical insights. We identified seasonality in both production and energy costs and through regression and variance analyses, found that future natural gas (NG) outlet temperatures are significantly influenced by current atmospheric conditions, fan speeds, and existing NG outlet temperatures.
Building on these findings, a Deep Neural Network (DNN) prediction model was subsequently developed. This model is capable of predicting the outlet temperature of vaporized NG after a given time interval. Given the operational constraints—namely, a limited range of fan speeds and safety-oriented guidelines—the task of developing an effective prediction model presented unique challenges. To overcome these, we evaluated various learning models under diverse conditions, ultimately arriving at a DNN model with minimized absolute mean error (MAE) and mean square error (MSE).
With its multiple potential applications, the artificial intelligence model serves as a valuable tool, primarily for facility operators. It can provide customized, efficient AAV operational policies based on specific environmental conditions and LNG inlet flow rates. Looking ahead, we aim to expand this work by integrating the proposed DNN prediction model into a production simulation framework. This integration will pave the way for the development of optimal production strategies, leading to more intelligent facility operations.


