Article

The Reservoir Sensitivity of Triassic Baikouquan Formation in Mahu Depression

1
School of of Earth Sciences, Yangtze University, Wuhan 430100, China
2
Geological Research Institute of CNPC Xibu Drilling Engineering Company Limited, Karamay 834000, China
3
Hubei Cooperative Innovation Center of Unconventional Oil and Gas, Yangtze University, Wuhan 430100, China
*
Author to whom correspondence should be addressed.
Processes 2023, 11(11), 3142; https://doi.org/10.3390/pr11113142
Submission received: 11 August 2023 / Revised: 23 August 2023 / Accepted: 16 October 2023 / Published: 3 November 2023

Abstract

:
The Triassic Baikouquan Formation in the slope area of the Mahu Depression is the largest glutenite reservoir in the Junggar Basin, with low porosity and permeability; however, its physical properties are poor, the distribution of oil and gas is quite different, and the output fluctuates greatly. It is of great guiding significance to study the sensitivity characteristics of the reservoir for oil and gas development and productivity design. In this paper, the reservoir of the Triassic Baikouquan Formation in the Mahu Depression of Junggar Basin is taken as the research object, and the geological characteristics, pore structure characteristics and clay mineral characteristics of the reservoir are investigated through the use of X-ray diffraction and scanning electron microscope; moreover, the sensitivity of velocity, water, salt and stress of the reservoir are studied through the use of a sensitive flow test. The research results show that the lithology of the reservoir is mainly glutenite, composed of tuff and metamorphic mudstone, and the minerals are mainly Yimeng mixed-layer clay minerals, with fine particle size, average porosity of 10.5% and an average permeability of 9 × 10⁻⁴ μ m2, forming pore structures such as dissolved pores, cemented pores and intergranular gaps, which belong to the poor pore structure reservoir with low porosity and low permeability. The velocity-sensitive damage rate of reservoirs in the study area is between 4 and 46, and the reservoirs are moderately weak and poor in velocity sensitivity. The damage rate of the reservoirs’ water sensitivity in the study area is between 36 and 58, which can be defined as medium–weak and medium–strong water sensitivity. The reservoir in the study area contains clay minerals in a Yimeng mixed layer, which easily hydrate and swell, and the clay minerals in different parts of the Yimeng mixed layer are different, resulting in great differences in salt sensitivity at different depths. The maximum permeability damage rate of the reservoir is 80%, the irreversible permeability damage rate is 20%, and the stress sensitivity is weak. The research results provide theoretical data support for adopting targeted reservoir protection measures in the process of oil and gas exploration, development and construction.

1. Introduction

Junggar Basin is the earliest sedimentary basin in China where oil and gas were discovered. Rich in oil and gas resources, it has good reservoir-forming conditions. More than 30 oil and gas fields have been located, among which the Mahu slope area is the most favorable oil and gas reservoir depression in the Junggar Basin, with proven oil reserves of 600 million tons, making it the largest conglomerate oil field in the world [1]. The Triassic Baikouquan Formation in the Mahu Depression is the main oil-bearing strata in the Mahu Depression, which has high economic value. In the process of oil and gas development, due to the inflow of water and other liquids during exploitation, physical and chemical reactions between the reservoir rock mass and the inflow liquid occur, leading to the expansion and flow of the clay minerals in the reservoir, and even blocks the oil and gas seepage channel in the reservoir, resulting in reduced reservoir permeability and productivity. The sensitivity of the reservoir includes velocity sensitivity, water sensitivity, salt sensitivity and stress sensitivity, all of which will damage the reservoir. It is of great significance for the development of reservoir resources to study the sensitivity of the Triassic Baikouquan Formation in the Mahu Depression [1,2,3,4,5]. Because the sensitivity of reservoirs directly affects the optimization of oil and gas development plans, the accurate prediction of production capacity and maximization of oil recovery can provide key guidance for effective development and economic benefits.
Some achievements have been made in the research of reservoir sensitivity. Wang (2021) studied the difference in the sensitivity of different reservoirs. Tight sandstone reservoirs are characterized by poor physical properties, poor water injection effect and complex pore structures. Mercury injection method, scanning electron microscope and X-ray diffraction technology were used to analyze the pore structure and clay mineral composition of oil-bearing reservoirs, and the evaluation marks of reservoir pore structure were established, and the reservoirs were divided into three categories: excellent, general, and poor. The excellent reservoirs are characterized by low speed, low water, medium and low salt, medium and low alkali and medium and high acid sensitivity. The reservoirs with poor oil layers are characterized by medium and low speed, low water, low salt sensitivity, low acid sensitivity and low alkaline sensitivity [6]. Zhu et al. (2021) studied the reservoir sensitivity of the Kela 2 gas field, and it was considered that with the increase in the effective pressure of the reservoir, its permeability decreased. Under the same stress, the stress sensitivity of different permeability reservoirs is very different [7]. For high permeability reservoirs, the stress sensitivity is low. For reservoirs in the Kela 2 gas field, more than 80% of them have high permeability, resulting in low stress sensitivity. According to reservoir permeability and Zhang et al. (2022), the water sensitivity of the upper member 3 reservoir of the Shahejie Formation was studied. It is found that the reservoir is a fan–delta gravel reservoir with low maturity in terms of the sedimentary structure of the rock mass, relatively weak diagenesis, high permeability and porosity of primary pores, weak and unstable cementation of clay minerals mixed with illite and montmorillonite, and medium and strong water sensitivity of reservoir [8]. Li et al. (2022) studied the salt sensitivity of the Baikouquan Formation in the Ma Block of the Mahu Depression, and it was concluded from the samples that the salinity of the fluid in this reservoir should be strictly controlled at 8000 and 10,000 mg/L during oil and gas development. During the early stage of water injection development, the salinity of injected water should be well controlled to reduce damage to the reservoir. According to the influence of reservoir sedimentation and diagenesis on the pore structure, combined with nuclear magnetic resonance logging technology, a quantitative calculation model of reservoir productivity was established [9].
The reservoir of the Triassic Baikouquan Formation in the Mahu Depression has the continuity characteristics of oil and gas reservoirs. A lot of research has been carried out on the geological characteristics and diagenetic types of this reservoir, but little research has been undertaken on the sensitivity characteristics of the reservoir [10]. In this paper, the reservoir of the Triassic Baikouquan Formation in the Mahu Depression of the Junggar Basin is taken as the research object, and the geological characteristics, pore structure characteristics and clay mineral characteristics of the reservoir are investigated through the use of X-ray diffraction and scanning electron microscopy. The sensitivity flow test was used to study the sensitivity of velocity, water, salt and stress of the reservoir and provide theoretical data support for taking targeted measures to protect reservoirs in the process of oil and gas exploration, development and construction.

2. Research Methods

2.1. Geological Characteristics of the Study Area

The reservoir of Triassic Baikouquan Formation in Mahu Sag is located on the Madong slope of Mahu Sag in the central depression of Junggar Basin, belonging to Xinjiang Uygur Autonomous Region and Bukeser Mongolian Autonomous County, adjacent to Manas Lake, 20 km east of Hefeng Yanchi, and is an important oil and gas exploration and development zone in China. The structure of the study area is gentle and inclined to the south, and the reservoir thickness is about 200 m, which is divided into the third member (T1b3), the second member (T1b1) and the first member (T1b1) of Baikouquan Formation from top to bottom, mainly composed of glutenite mixed with mudstone; the thickness of glutenite is relatively large [11].
The reservoir studied belongs to continental sedimentary rocks, which is mainly composed of sandstone, mudstone and shale [12]. The fine grain size of sandstone leads to extremely low reservoir porosity, and, at the same time, many pore structures such as dissolution pores, cementation pores and intergranular gaps are formed [13]. Through the observation of core microscope and the analysis of whole rock composition, it is considered that the lithology of the studied reservoir is mainly glutenite, followed by medium-fine sandstone [13]. The maximum particle size of gravel is more than 8 cm, mostly 1~2 cm, and the particles keep line contact and point-line contact, which is characterized by pressure-embedding pore cementation. Table 1 shows the composition of reservoir glutenite. It can be seen that the main glutenite is mainly composed of tuff and metamorphic mudstone, and the maturity of reservoir composition and structure is low. Through core measurement and mercury injection test, it is concluded that the average porosity of this reservoir is 10.5%, the average permeability is 9 × 10⁻⁴ μ m2, the average displacement pressure is 0.58 MPa, the average capillary radius is 0.58’m, and the average mercury removal efficiency is 38.3% [13]. Therefore, it can be considered that this reservoir has low porosity and low permeability and poor pore structure.
Reservoir sensitivity is mainly related to the kinds of clay minerals [14]. X-ray diffraction analysis of reservoir characteristics first requires sample preparation, collection and fine grinding of reservoir rock samples to turn them into powder for easy analysis of reservoir characteristics. Then, the sample powder is placed in an X-ray diffraction instrument, and diffraction patterns are obtained by scanning X-rays from different angles and ranges. Then, standard spectra of known minerals are compared to obtain information about rock composition, including crystal structure and composition. The composition and proportion of clay minerals in the reservoir are obtained by X-ray diffraction (
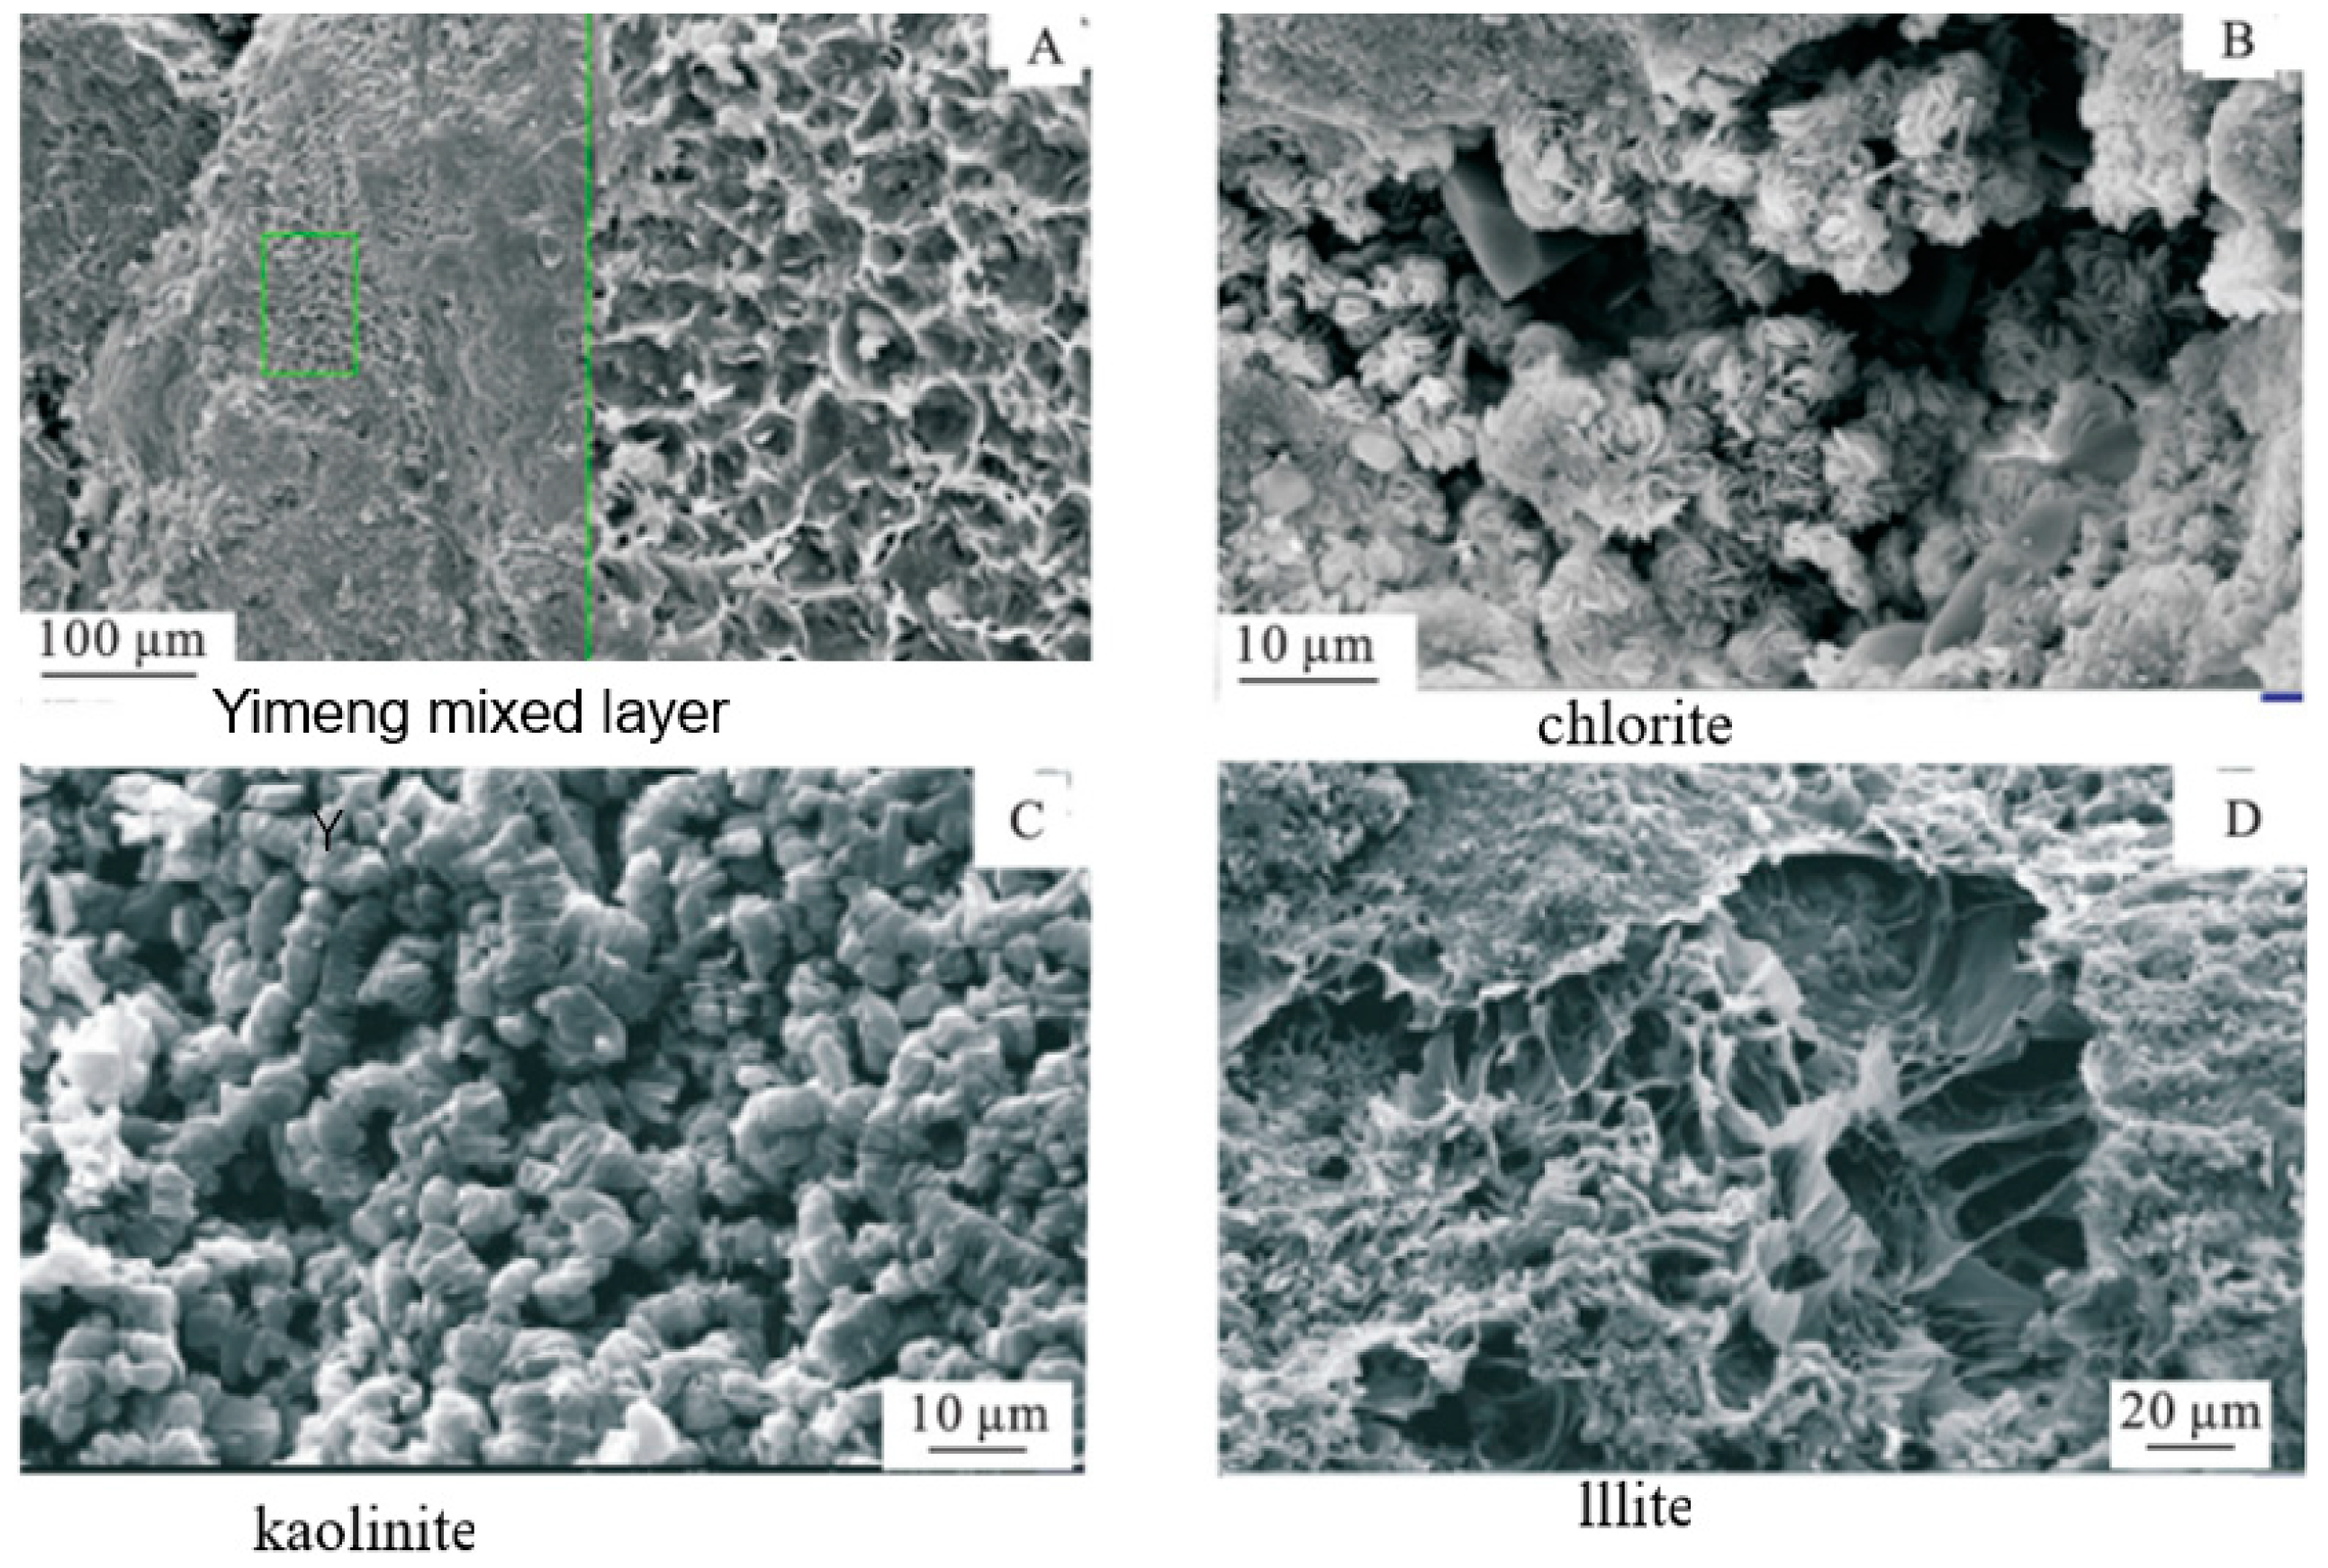
Table 2). Clay minerals in Yimeng mixed layer in the study area are mainly clay minerals, followed by chlorite and kaolinite, with a small amount of illite. Montmorillonite accounts for more than 60% in Yimeng mixed layer, so the mixed-layer minerals mainly show the physical and chemical properties of montmorillonite, so the reservoir is water-sensitive and salt-sensitive, kaolinite is speed-sensitive, and chlorite is acid-sensitive, which makes the reservoir have speed-sensitive and acid-sensitive properties. To obtain reservoir characteristics using a scanning electron microscope, it is necessary to first slice the sample to obtain thin or blocky samples for SEM observation. Then, the sample is placed in an SEM instrument and the surface of the sample is scanned by an electron beam to obtain a high magnification image. These images can display the microstructure, pore distribution, and particle characteristics of rocks. Scanning electron microscopy (SEM) was used to observe the cores. It was found that the mixed layer of illite and montmorillonite was mainly irregular flake, chlorite was a foliated or fluffy aggregate, kaolinite filled the reservoir pores with worms, and illite filled the pores with clay bridges (Figure 1).
The study of reservoir geological characteristics is mainly affected by depression structure and sedimentation. The sag structure experienced multiple periods of uplift and subsidence, forming multiple structural zones and uneven topography, which affected the distribution and connectivity of reservoirs. Under the deposition of terrestrial clastic rocks such as rivers, lakes and sedimentary fans, it has a great influence on the physical properties and pore structure of reservoirs. For example, the porosity of sandstone reservoirs is generally higher under lake deposition and lower related to the kinds of clay minerals [15].

2.2. Research Methods and Test Steps

In order to simulate the dynamic damage of different fluids to the reservoir and evaluate the damage degree of different sensitivities to the reservoir, different types of fluids are configured in this paper to carry out core mobility tests. By using the method of reservoir sensitive flow test and evaluation, the reservoir sensitive flow test is carried out.
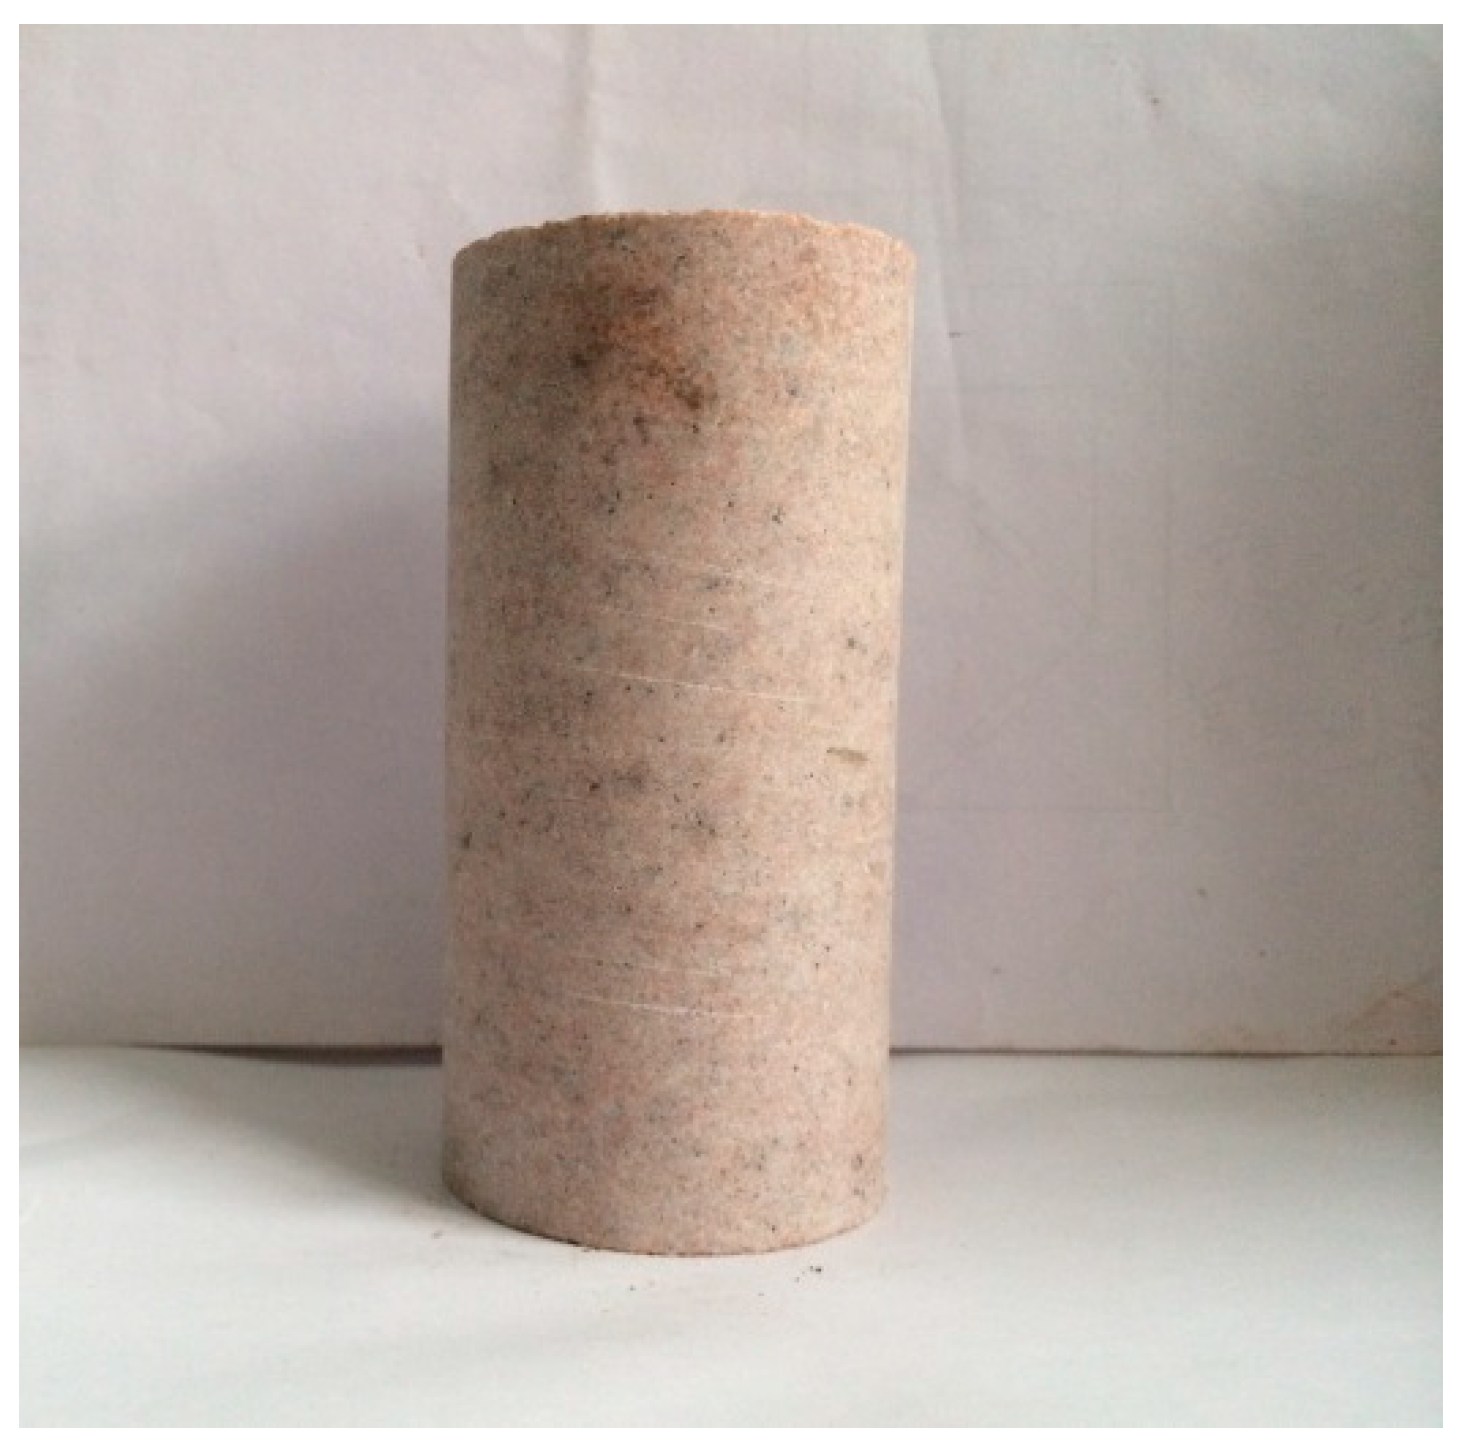
Preparation of the rock sample: A flat cylindrical sample with a diameter of 2.5 cm and a length of 5 cm was obtained by drilling and coring (Figure 2). Before the test began, the core was cleaned with toluene to clean the liquid (oil) inside the core. The core was placed in a dryer at 70 °C and dried for more than 24 h, while the clay mineral properties of the core were kept unchanged [16].
According to the physical parameters of the sample, the seepage pressure of gas in the core was determined, and the gas permeability of the sample was obtained according to Darcy’s law. According to the ion concentration in reservoir formation water measured by logging, the dosage of chemical reagents in the testing process was calculated and different types of formation water are prepared. Standard saline with 8% salinity can also be tested via this method. The core was then immersed in the prepared formation water, and was kept in this vacuum-saturated state for more than 4 h. Afterwards, it was let to stand for one day, and the core was placed into the core holder, and the reservoir sensitive flow test was started (Figure 3).
Velocity sensitivity test: Set the flow rates of formation water to be 0.1, 0.25, 0.50, 0.75, 1.0, 2.0, 3.0, 4.0, 5.0 and 6.0 cm 3/min, then calculate the displacement time according to the pore size of the test, record the displacement pressure and environmental temperature, and obtain the core permeability corresponding to each flow rate, thus obtaining the formation water.
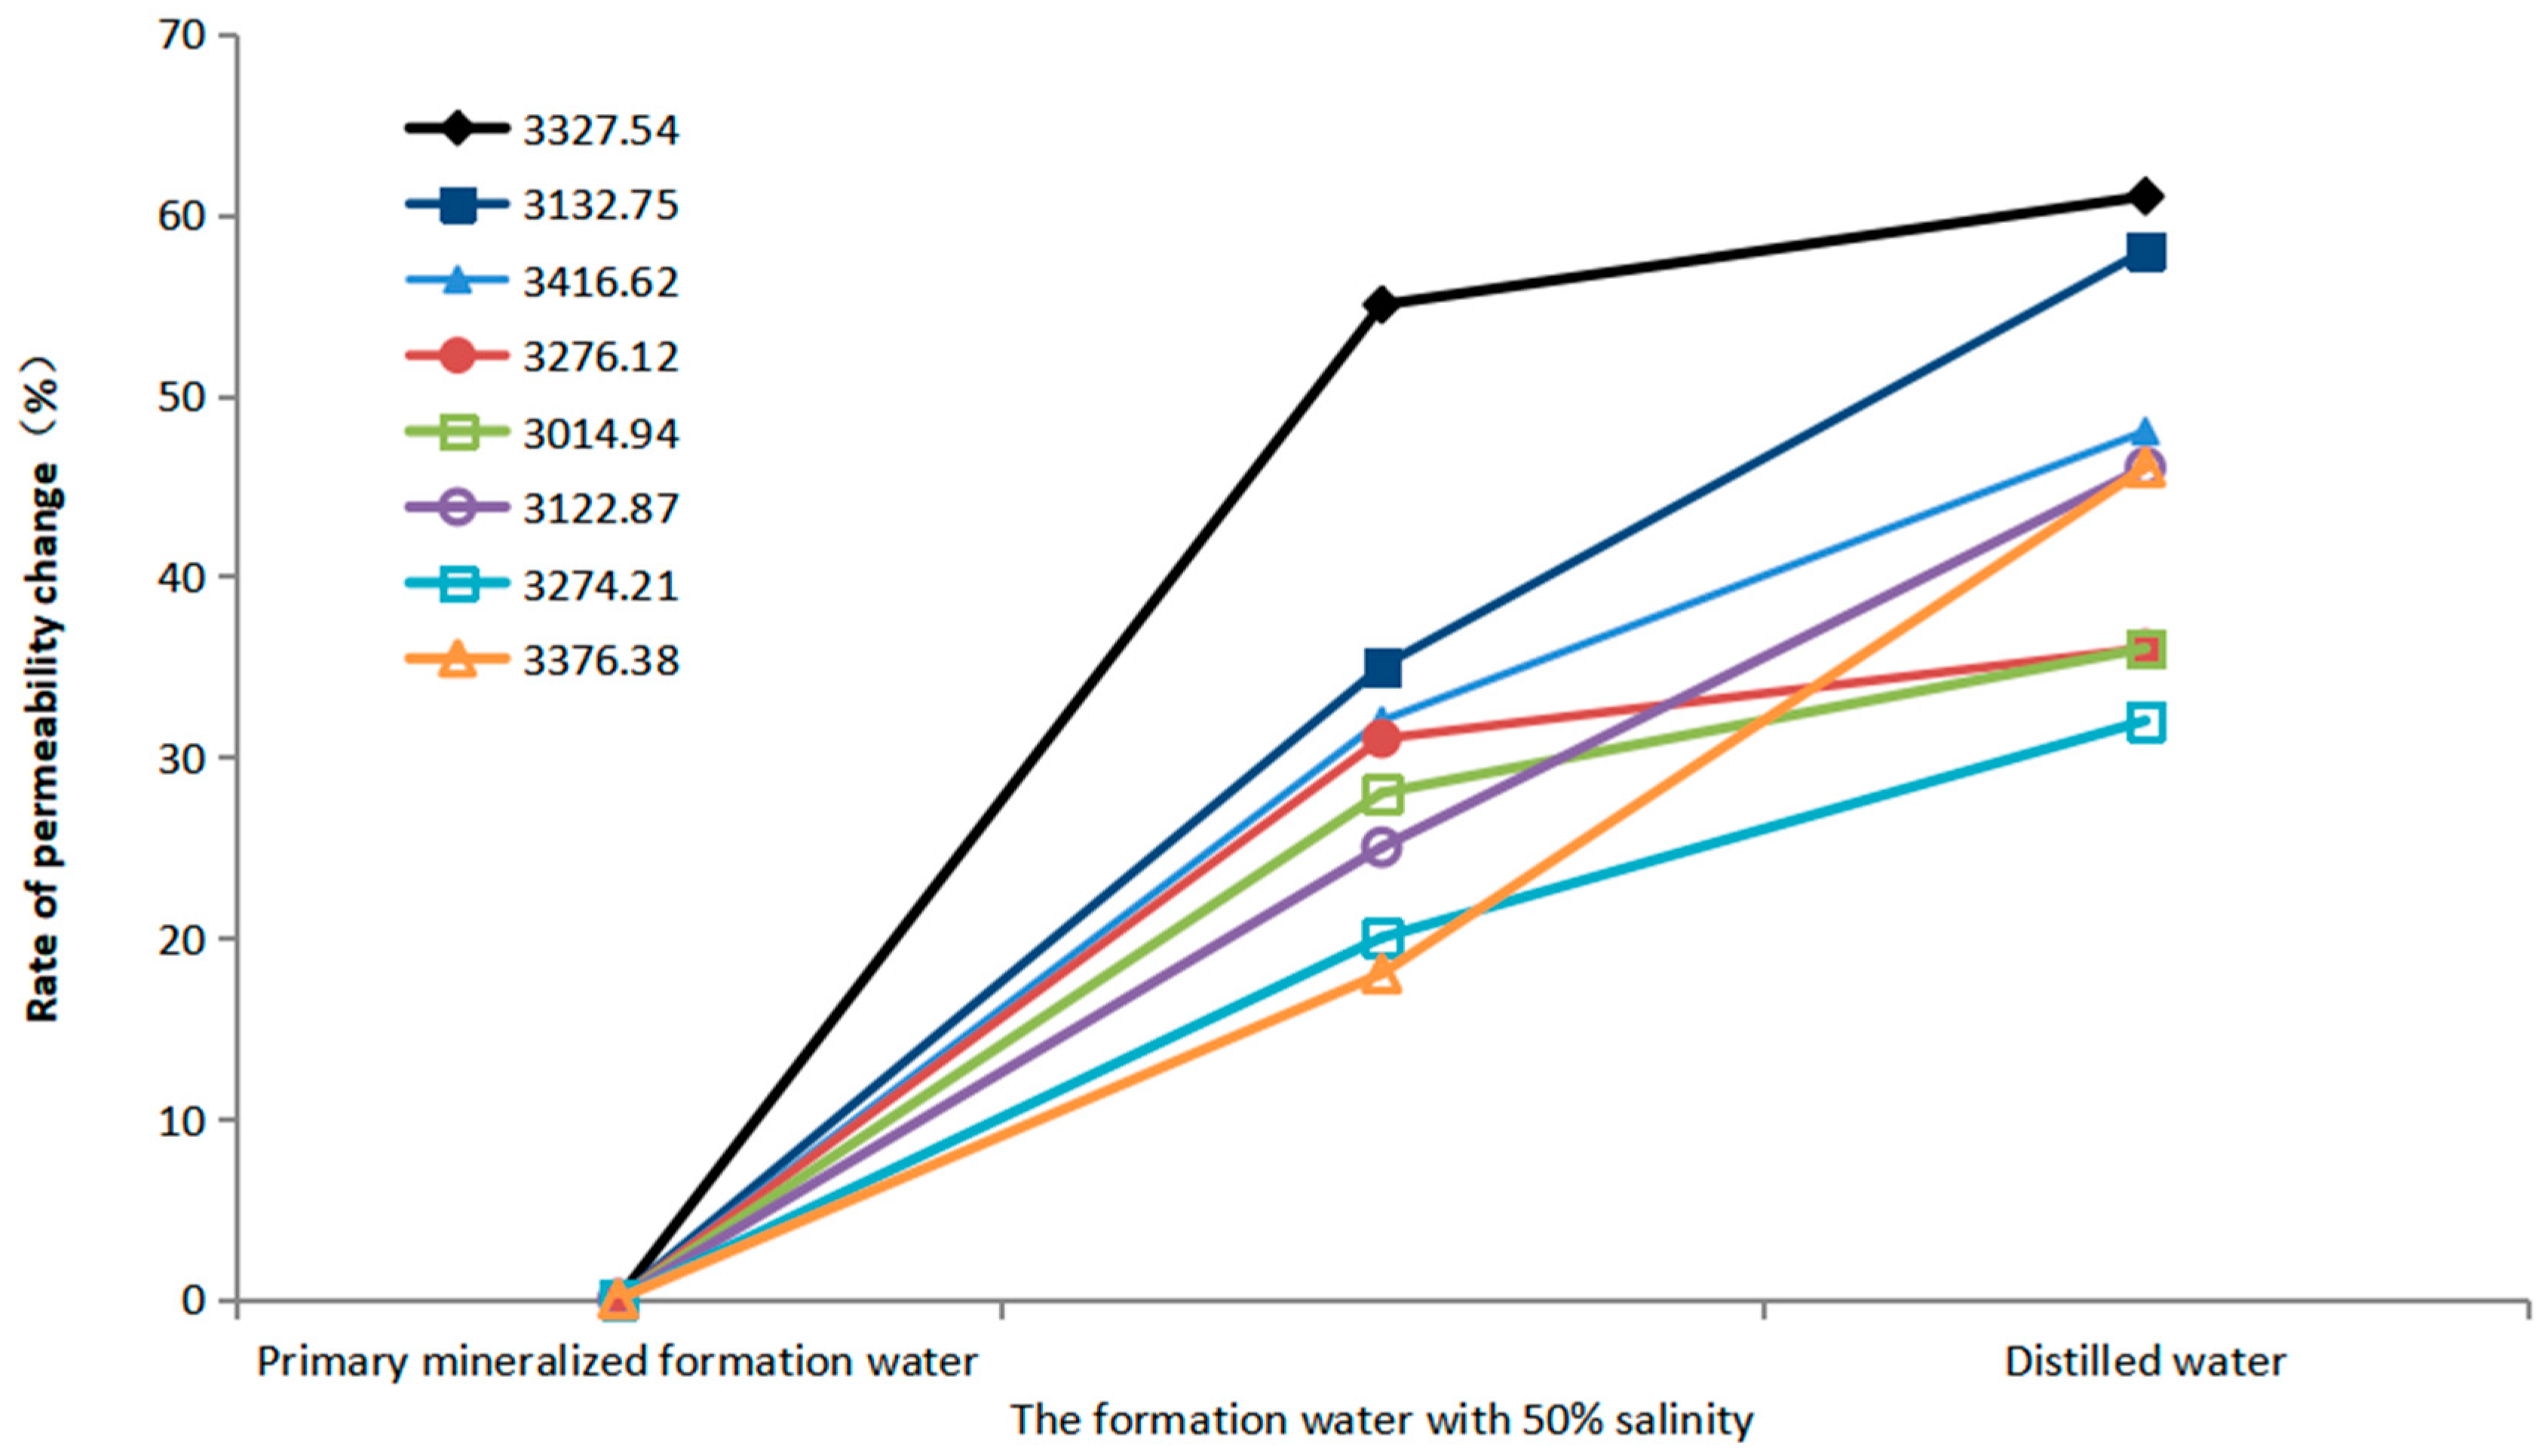
Water sensitivity test: Set the flow rate as the critical flow rate, conduct core displacement test with formation water with original salinity, formation water with salinity of 50% and distilled water, set the pore volume of the core to be 10 times, calculate the displacement time, and record the displacement pressure and environmental temperature of formation water with original salinity. Then, continue to fully carry out displacement experiments with formation water with salinity of 50%, and make the fluid fully react with rock minerals under the condition of constant confining pressure, and calculate the permeability of samples with different salinity and the water-sensitive damage rate. The core displacement test of distilled water is the same as that of formation water with 50% salinity.
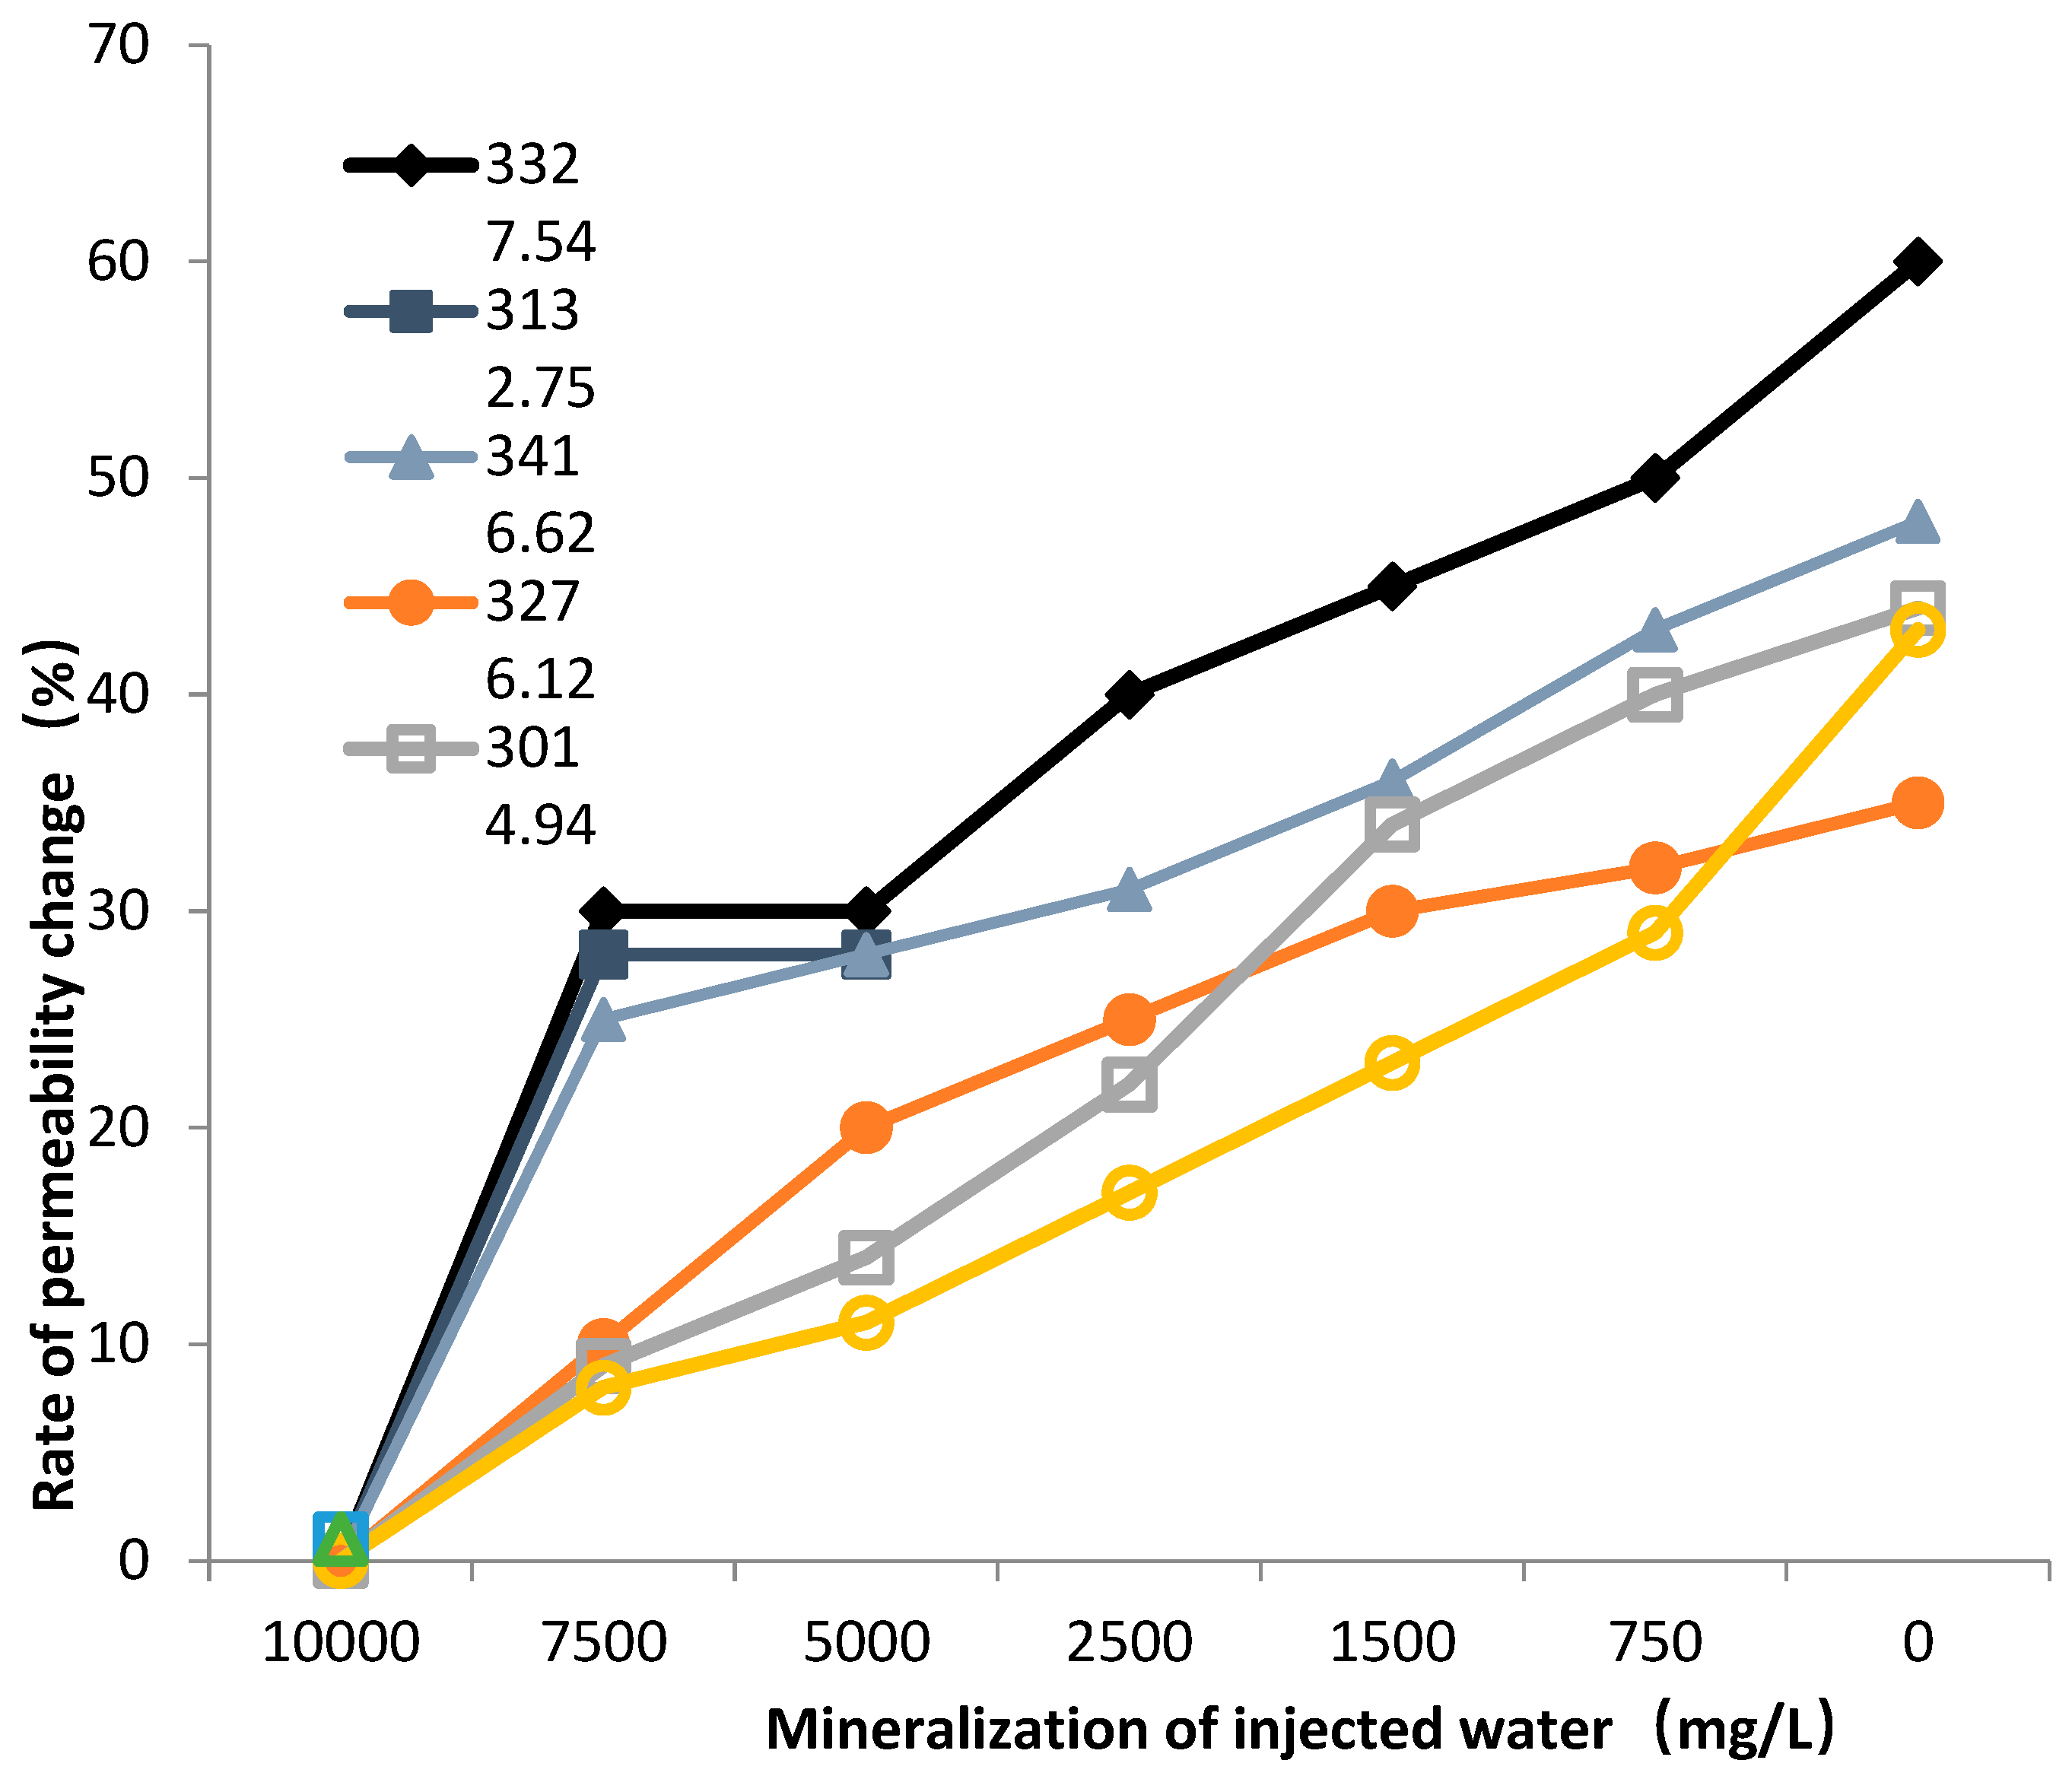
Salt sensitivity test: Set the flow rate as the critical flow rate, add formation water and distilled water with salinity levels of 10,000 mg/L, 7500 mg/L, 5000 mg/L, 2500 mg/L, 1500 mg/L and 750 mg/L, then conduct displacement test on the core, set the pore volume to 5, calculate the displacement time and record it. Continue to use formation water with salinity levels of 7500 mg/L to carry out displacement experiments on the core, and make the fluid fully react with rock minerals under the condition of constant confining pressure, and calculate the permeability of samples with different salinities to obtain the critical salinity. The displacement test of other mineralized formation water and distilled water are the same as those of formation water with salinity of 7500mg/L.
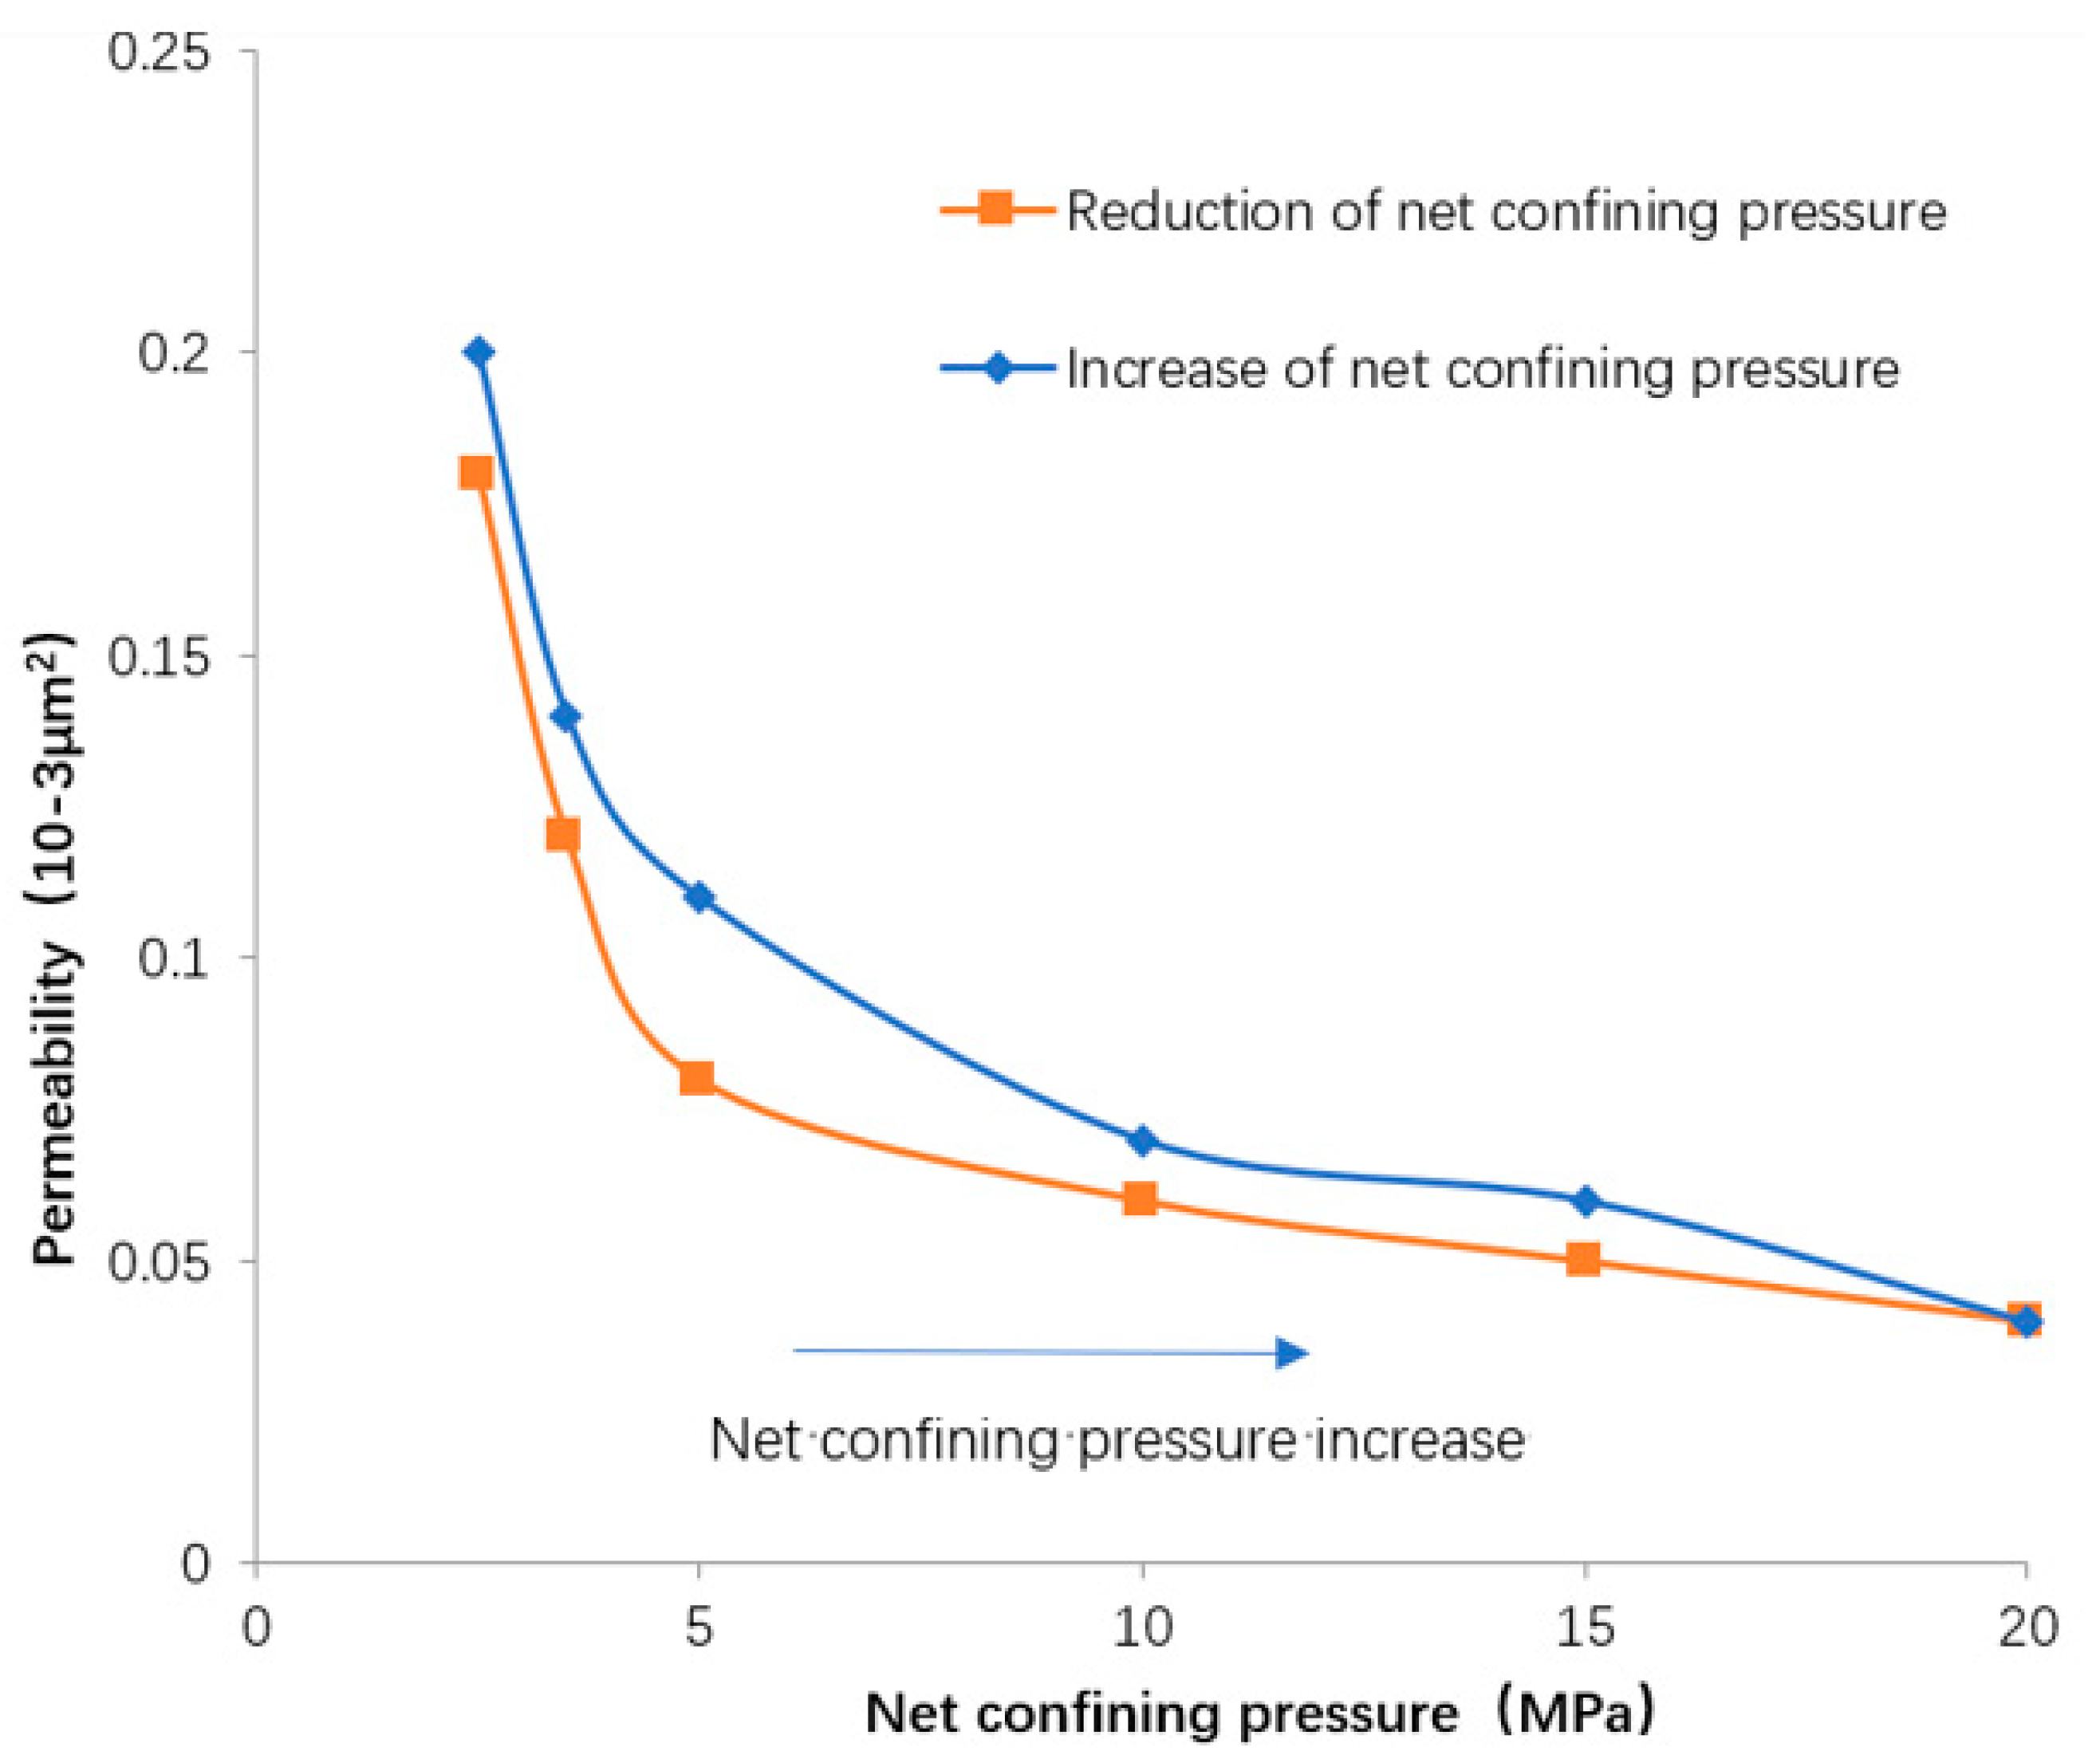
Stress sensitivity test: The flow rate is set as the critical flow rate, the initial net stress is set as 0 Mpa, and the net stress increases gradually according to 2.5 MPa, 3.5 MPa, 5.0 MPa, 10 MPa, 15 MPa and 20 MPa. According to the actual situation of the reservoir, the net stress interval is at least 5, and it increases to the maximum net stress continuously, and the displacement time of each pressure point is maintained for 0.5 h, and then it slowly decreases to the initial net stress. The displacement time of each pressure point is 1h, and the displacement pressure and environmental temperature during the change of net stress are recorded, and the permeability of samples under different stresses is calculated to determine the maximum permeability damage rate and irreversible permeability damage rate.

3. Research Results

3.1. Speed Sensitivity

Reservoir velocity sensitivity refers to the development of fine particles in different degrees in the reservoir, such as kaolinite, quartz, feldspar and other fine particles, which are distributed among grain particles in a cemented or loose form. When formation water or invasion liquid flows through the reservoir, these fine particles will migrate and gather in the pores, which will eventually lead to pore blockage and reservoir permeability decrease continuously.
Velocity sensitivity of reservoir is usually evaluated by velocity sensitivity damage rate V [17]. Table 3 gives the evaluation of reservoir velocity sensitivity index.
Table 4 shows the results of reservoir velocity sensitivity test. As can be seen from Table 4, the velocity-sensitive damage rate of the reservoir in the study area is between 4 and 46, and the reservoir is moderately weak. The velocity sensitivity of the reservoir is mainly related to the content of velocity-sensitive minerals, cementing strength and pore throat structure. The reservoir depth in the study area is more than 3500 m, and it has entered the stage of diagenesis. The reservoir rock mass has strong consolidation, and the reservoir particles are in close contact. Fine particles do not move with the flow of formation water. At the same time, minerals such as quartz and feldspar in the reservoir present large particles and rarely present single small crystals; thus, it is difficult to migrate with formation water. The kaolinite velocity-sensitive clay minerals in the reservoir are easy to migrate to the pore junction with the fluid under the action of fluid traction due to the weak intermolecular connectivity of crystals, blocking pore channels and reducing the permeability of the reservoir. The proportion of kaolinite clay in the reservoir reaches 18.3%. According to mercury injection test, the pore radius of the reservoir is 0.2~1.2 μm, with an average value of 0.56 μm, and the diameter of kaolinite crystal is 10~20 μm through core electron microscope scanning, and the pore diameter of the reservoir is smaller than that of speed-sensitive minerals. These speed-sensitive minerals will not fill the pore channels with fluid migration to form speed sensitivity; thus, the overall speed sensitivity of the reservoir is weak.

3.2. Water Sensitivity

Reservoir water sensitivity means that the fluid in the reservoir clay minerals and formation water with a certain salinity are in equilibrium. When the fluid with a salinity lower than that of the formation water enters the reservoir, it will lead to the expansion and migration of clay minerals, which will lead to the blockage of reservoir pores and the continuous reduction in reservoir permeability. W index evaluation of water sensitivity damage rate of reservoir water sensitivity [18]. Table 5 gives the evaluation of the reservoir water sensitivity index.
Table 6 shows the results of reservoir water sensitivity test, and Figure 4 shows the results of reservoir water sensitivity evaluation at different depths. As can be seen from Table 6 and Figure 4, the water sensitivity damage rate of the reservoirs in the study area is between 36 and 58; thus, the water sensitivity of the reservoirs belongs to moderately weak and moderately strong. The water sensitivity of the reservoir is related to the content of water-sensitive clay minerals in the reservoir. Under the diagenesis of compaction and recrystallization, the clay minerals in the reservoir in the study area are in close contact with each other, but under long-term fluid immersion, the cracks between minerals are hydrated and expanded by water molecules. The expansive energy of different clay minerals is very different. Montmorillonite has the strongest expansive power in Yimeng mixed layer, chlorite and illite are weak, and kaolinite has little expansive power [19]. The clay minerals in the Yimeng mixed layer have high hydration ability and expansibility, which means that they can cause rock volume expansion when adsorbing water or being expanded by water, which may lead to a decrease in porosity and permeability in the reservoir. These changes will directly affect the reservoir’s ability to store and flow oil and gas. The content of clay minerals in the Yimeng heavy mixed layer in the study area is high; thus, the reservoir water sensitivity is also strong. Therefore, the high mineral content in the Yimeng mixed layer of the reservoir in the study area is the main reason why the water sensitivity of the reservoir is moderately weak and moderately strong.

3.3. Salt Sensitivity

Salt sensitivity of reservoir refers to the hydration, expansion and migration of clay minerals after the fluid with low salinity enters the reservoir, which leads to a decrease in reservoir permeability. The salt sensitivity of reservoir mainly represents the fluid with the lowest acceptable salinity, which is generally expressed by the critical salinity s (mg/L) [20]. Table 7 gives the evaluation of the reservoir salt sensitivity index.
Figure 5 shows the salt sensitivity evaluation of reservoirs with different depths. As can be seen from Figure 5, the salt sensitivity of reservoirs with different depths varies greatly. The formation water balance between reservoir clay minerals and original salinity. When the salinity of external fluid is lower than that of the formation water, the clay minerals in the reservoir will hydrate and swell, which will lead to the blockage of reservoir pores and the continuous decrease in reservoir permeability. The reservoir in the study area contains Yimeng mixed-layer clay minerals that are easy to hydrate and expand. When the salinity of fluid decreases, the clay minerals expand. Because the clay mineral contents in different parts of the Yimeng mixed layer are different, the salt sensitivity at different depths is quite different.

3.4. Stress Sensitivity

Figure 6 gives the evaluation of stress sensitivity of reservoir. As can be seen from Figure 6, the studied reservoir undergoes plastic and elastic deformation with the increase and decrease in net confining pressure, which proves that the pore pressure gradually decreases and the seepage velocity of the reservoir gradually decreases in the process of oil well exploitation, which is irreversible to a certain extent. When the net confining pressure of the core is increased from the initial pressure to 20 MPa, the permeability loss rate reaches 80%, which is the maximum permeability damage rate. The damage rate of irreversible permeability is 20% and the stress sensitivity is weak [21]. Therefore, for the studied reservoir, when its permeability is destroyed, 20% permeability cannot be restored, which has a certain influence on oil and gas development. It is necessary to study the damage of stress sensitivity to productivity [22].

3.5. Sensitivity Analysis

The conversion of sensitivity values is closely related to the significance of actual oil and gas development and exploration, which can help decision makers better understand the response characteristics of reservoirs and formulate more effective development and exploration strategies. These sensitive characteristics can be translated into practical operations and engineering considerations through the following methods:
Development plan optimization: Based on sensitivity values, targeted development plans can be formulated for different sensitivity characteristics. For example, if the reservoir exhibits weak velocity sensitivity, a slow production plan can be considered to avoid causing reservoir fracture and pore blockage.
Water injection and fracturing strategy: For reservoirs with high water sensitivity and stress sensitivity, engineering measures such as water injection and fracturing can be considered to maintain reservoir stability. Water injection can reduce the impact of water sensitivity, while fracturing can improve reservoir deformation caused by stress sensitivity.
Production capacity prediction: Based on sensitivity values, the production capacity of reservoirs can be more accurately predicted. For reservoirs with different sensitivity characteristics, production capacity can be predicted through simulation and numerical models, providing a basis for reasonable production planning.
Risk assessment: Sensitivity values can be used to assess potential risks during the development process. High sensitivity values may mean that the reservoir is more sensitive to development activities and requires more careful engineering operations to avoid irreversible reservoir damage.
Reservoir protection: For reservoirs with high water sensitivity and permeability sensitivity, measures need to be taken to protect the integrity of the reservoir. Avoiding overexploitation and overfracturing can help alleviate the adverse effects caused by sensitivity.
In summary, the conversion of sensitivity values into operational and engineering considerations for actual oil and gas development and exploration can help formulate more reasonable development strategies, predict production capacity, assess risks, and protect reservoir integrity, thereby maximizing economic benefits and sustainable development.

4. Conclusions

The Triassic Baikouquan Formation in the slope area of Mahu sag is the largest glutenite reservoir with low porosity and permeability in Junggar Basin. Studying the sensitivity characteristics of reservoirs has an important guiding role for reservoir oil and gas exploitation and productivity design. This study takes the Triassic Baikouquan Formation reservoir in Mahu Sag, the Junggar Basin as the research object, innovatively combines X-ray diffraction and scanning electron microscope technology, and comprehensively and deeply studies the geological characteristics, pore structure characteristics and clay mineral characteristics of the reservoir. At the same time, through sensitivity flow experiments, the sensitivity characteristics of reservoirs were systematically analyzed, providing unprecedented theoretical data support for reservoir protection during oil and gas exploration, development, and construction processes, fully reflecting the innovation of this study. The main research results are as follows:
(1)
The studied reservoir structure is gentle. The lithology is mainly glutenite, with fine particle size and extremely low porosity, forming a variety of pore structures such as dissolution pores, cementation pores and intergranular spaces. The reservoir is mainly composed of illite-montmorillonite mixed clay minerals, followed by chlorite and kaolinite, with a small amount of illite. At the same time, under the action of depression structure and sedimentation, many structural zones and uneven topography were formed, which affected the reservoir physical properties, pore structure and connectivity.
(2)
By studying the reservoir sensitivity characteristics through reservoir sensitivity flow test, it is concluded that the velocity sensitivity damage rate of the reservoir in the study area is between 4 and 46, the reservoir is moderately weak, weak and poor in velocity sensitivity, the rock mass of the reservoir is strongly consolidated, the contact between the particles of the reservoir is close, the pore diameter of the reservoir is smaller than the diameter of the velocity sensitive minerals, and the reservoir velocity sensitivity is generally weak. The water sensitivity damage rate of the reservoirs in the study area is between 36 and 58, which belongs to the medium–weak and medium–strong water sensitivities. The clay mineral content of the heavy Yimeng mixed layer with strong expansibility in the study area is high, which leads to the water sensitivity of the reservoir being moderately weak and moderately strong. The reservoir in the study area contains Yimeng mixed-layer clay minerals that are easy to hydrate and expand. The salinity of the fluid decreases, the clay minerals swell, and the content of clay minerals in different parts of Yimeng mixed layer is different, resulting in great differences in salt sensitivity at different depths. With the increase and decrease in net confining pressure, the reservoir undergoes plastic and elastic deformation and cannot be recovered to its full extent. The maximum permeability damage rate is 80%, the irreversible permeability damage rate is 20%, and the stress sensitivity is weak.

Author Contributions

Formal analysis, M.H.; Writing—original draft, Z.H. All authors have read and agreed to the published version of the manuscript.

Funding

This research received no external funding.

Data Availability Statement

The figures and tables used to support the findings of this study are included in the article.

Acknowledgments

The authors would like to show sincere thanks to those techniques who have contributed to this research.

Conflicts of Interest

The authors declare no conflict of interest.

References

  1. Xiao, M.; Yuan, X.; Wu, S.; Cao, Z.; Tang, Y.; Xie, Z.; Wang, R. Conglomerate reservoir characteristics of and main controlling factors for the Baikouquan Formation, Mahu sag, Junggar Basin. Earth Sci. Front. 2019, 26, 212. [Google Scholar]
  2. Xiao, M.; Wu, S.; Yuan, X.; Cao, Z.; Xie, Z. Diagenesis effects on the conglomerate reservoir quality of the Baikouquan Formation, Junggar Basin, China. J. Pet. Sci. Eng. 2020, 195, 107599. [Google Scholar] [CrossRef]
  3. Yu, Z.; Wang, Z.; Jiang, Q.; Wang, J.; Feng, Y.; Zheng, J.; Baffour, B.A. Evaluation of low permeability conglomerate reservoirs based on petrophysical facies: A case study from the Triassic Baikouquan Formation, northern Mahu Sag, Junggar Basin, China. J. Pet. Sci. Eng. 2022, 219, 111082. [Google Scholar] [CrossRef]
  4. Yu, Z.; Wang, Z.; Adenutsi, C.D. Genesis of authigenic clay minerals and their impacts on reservoir quality in tight conglomerate reservoirs of the Triassic Baikouquan formation in the Mahu Sag, Junggar Basin, Western China. Mar. Pet. Geol. 2023, 148, 106041. [Google Scholar] [CrossRef]
  5. Yu, Z.; Wang, Z.; Wang, J.; Li, Z. Subtle reservoirs and implications for hydrocarbon exploration in terrestrial lacustrine fan-delta deposits: Insights from the Triassic Baikouquan Formation, Mahu Sag, Junggar Basin, western China. Mar. Pet. Geol. 2022, 142, 105730. [Google Scholar] [CrossRef]
  6. Wang, X. Study on reservoir sensitivity evaluation and key control factors of tight oil reservoirs. Spec. Oil Gas Reserv. 2021, 28, 103. [Google Scholar]
  7. Zhu, N.; Cao, Y.; Xi, K.; Wu, S.; Zhu, R.; Yan, M.; Ning, S. Multisourced CO2 injection in fan delta conglomerates and its influence on reservoir quality: Evidence from carbonate cements of the Baikouquan formation of Mahu Sag, Junggar basin, Northwestern China. J. Earth Sci. 2021, 32, 901–918. [Google Scholar] [CrossRef]
  8. Zhang, J.; He, Y.; Zhang, Y.; Li, W.; Zhang, J. Well-Logging-Based Lithology Classification Using Machine Learning Methods for High-Quality Reservoir Identification: A Case Study of Baikouquan Formation in Mahu Area of Junggar Basin, NW China. Energies 2022, 15, 3675. [Google Scholar] [CrossRef]
  9. Li, B.; Sun, L.; Liu, X.; Feng, C.; Zhang, Z.; Huo, X. Effects of Clay Mineral Content and Types on Pore-Throat Structure and Interface Properties of the Conglomerate Reservoir: A Case Study of Baikouquan Formation in the Junggar Basin. Minerals 2022, 13, 9. [Google Scholar] [CrossRef]
  10. Liu, B.; Yang, Y.; Li, J.; Chi, Y.; Li, J.; Fu, X. Stress sensitivity of tight reservoirs and its effect on oil saturation: A case study of Lower Cretaceous tight clastic reservoirs in the Hailar Basin, Northeast China. J. Pet. Sci. Eng. 2020, 184, 106484. [Google Scholar] [CrossRef]
  11. Pouraminian, M.; Pourbakhshian, S.; Noroozinejad Farsangi, E. Reliability assessment and sensitivity analysis of concrete gravity dams by considering uncertainty in reservoir water levels and dam body materials. Civ. Environ. Eng. Rep. 2020, 30, 1–17. [Google Scholar] [CrossRef]
  12. Zhang, J.; Wei, C.; Ju, W.; Yan, G.; Lu, G.; Hou, X.; Kai, Z. Stress sensitivity characterization and heterogeneous variation of the pore-fracture system in middle-high rank coals reservoir based on NMR experiments. Fuel 2019, 238, 331–344. [Google Scholar] [CrossRef]
  13. Han, X.; Shan, S.; Xu, G.; Han, Y.; Guo, Y.; Yang, B.; Zhang, J.; Yao, P.; Chu, X.; Zhang, P. Single-and Multifractal Dimension Variation of the Pore-Fracture System in Tight Sandstone by Using High-Pressure Mercury Intrusive Tests and Its Influence on Porosity–Permeability Variation. Energy Fuels 2023, 37, 11969–11981. [Google Scholar] [CrossRef]
  14. Wu, Z.; Cui, C.; Lv, G.; Bing, S.; Cao, G. A multi-linear transient pressure model for multistage fractured horizontal well in tight oil reservoirs with considering threshold pressure gradient and stress sensitivity. J. Pet. Sci. Eng. 2019, 172, 839–854. [Google Scholar] [CrossRef]
  15. Hashemi, L.; Blunt, M.; Hajibeygi, H. Pore-scale modelling and sensitivity analyses of hydrogen-brine multiphase flow in geological porous media. Sci. Rep. 2021, 11, 8348. [Google Scholar] [CrossRef] [PubMed]
  16. Xie, Y.; He, Y.; Hu, Y.; Jiang, Y. Study on Productivity Prediction of Multi-Stage Fractured Horizontal Well in Low-Permeability Reservoir Based on Finite Element Method. Transp. Porous Media 2022, 141, 629–648. [Google Scholar] [CrossRef]
  17. Gao, G.; Jiang, Y.W.; Jia, H.R.; Wu, F.G. Near-infrared light-controllable on-demand antibiotics release using thermo-sensitive hydrogel-based drug reservoir for combating bacterial infection. Biomaterials 2019, 188, 83–95. [Google Scholar] [CrossRef]
  18. Li, S.; Bing, Z.; Jin, G. Spatially explicit mapping of soil conservation service in monetary units due to land use/cover change for the Three Gorges Reservoir Area, China. Remote Sens. 2019, 11, 468. [Google Scholar] [CrossRef]
  19. Lei, Z.; Zhang, Y.; Zhang, S.; Fu, L.; Hu, Z.; Yu, Z.; Li, L.; Zhou, J. Electricity generation from a three-horizontal-well enhanced geothermal system in the Qiabuqia geothermal field, China: Slickwater fracturing treatments for different reservoir scenarios. Renew. Energy 2020, 145, 65–83. [Google Scholar] [CrossRef]
  20. Chen, W.; Yang, L.; Zha, B.; Zhang, M.; Chen, Y. Deep learning reservoir porosity prediction based on multilayer long short-term memory network. Geophysics 2020, 85, WA213–WA225. [Google Scholar] [CrossRef]
  21. Yao, W.; Li, C.; Zuo, Q.; Zhan, H.; Criss, R.E. Spatiotemporal deformation characteristics and triggering factors of Baijiabao landslide in Three Gorges Reservoir region, China. Geomorphology 2019, 343, 34–47. [Google Scholar] [CrossRef]
  22. Qin, P.; Xu, H.; Liu, M.; Du, L.; Xiao, C.; Liu, L.; Tarroja, B. Climate change impacts on Three Gorges Reservoir impoundment and hydropower generation. J. Hydrol. 2020, 580, 123922. [Google Scholar] [CrossRef]
Figure 1. Microstructure of reservoir clay minerals.
Processes 11 03142 g001
Figure 2. Photo of core.
Processes 11 03142 g002
Figure 3. Sensitive flow test chart.
Processes 11 03142 g003
Figure 4. Water sensitivity evaluation of reservoirs with different depths.
Processes 11 03142 g004
Figure 5. Salt sensitivity evaluation of reservoirs with different depths.
Processes 11 03142 g005
Figure 6. Stress sensitivity evaluation of reservoir.
Processes 11 03142 g006
Table 1. Composition of reservoir glutenite.
ConstituentTuffMetamorphic MudstoneGraniteAndesiteRhyoliteQuartzFeldspar
Proportion (%)52.222.58.55.54.84.32.2
Table 2. Composition of clay minerals in reservoir.
ConstituentYimeng Mixed LayerChloriteKaoliniteGlimmerton
Proportion (%)40.228.718.39.3
Table 3. Evaluation of reservoir velocity sensitivity index.
Evaluation Index ValueV ≤ 55 < V ≤ 3030 < V ≤ 5050 < V ≤ 70V > 70
Speed sensitivity evaluationwithoutweakmoderately weakmoderately strongstrong
Table 4. Test results of reservoir velocity sensitivity.
Pound SignDepth (m)Porosity (%)Speed-Sensitive Damage RateSpeed Sensitivity Evaluation
#133172.459.3217.2weak
#1323232.765.6745.7moderately weak
#1343106.2612.6315.1weak
#1363267.187.214.2without
#1383164.4712.9535.7moderately weak
#1393165.7811.1528.3weak
#143074.126.8344.2moderately weak
#153136.838.355.6weak
Table 5. Evaluation of reservoir water sensitivity index.
Evaluation Index ValueW ≤ 55 < W ≤ 3030 < W ≤ 5050 < W ≤ 7070 < W ≤ 90W > 90
Water sensitivity evaluationwithoutweakmoderately weakmoderately strongstrongpole-strength
Table 6. Test results of reservoir water sensitivity.
Pound SignDepth (m)Porosity (%)Water Sensitivity Damage RateWater Sensitivity Evaluation
#1333327.548.3257.4moderately strong
#1343132.752.6547.3moderately weak
#1343416.624.3656.3moderately strong
#1363276.128.3236.3moderately weak
#1363014.947.5441.3moderately weak
#1383122.879.3248.5moderately weak
#1383274.2110.4650.6moderately strong
#1393376.388.5343.2moderately weak
Table 7. Evaluation of salt sensitivity index of reservoir.
Evaluation Index ValueS ≤ 55 < S ≤ 3030 < S ≤ 5050 < S ≤ 7070 < S ≤ 90S > 90
Salt sensitivity evaluationwithoutweakmoderately weakmoderately strongstrongpole-strength
Disclaimer/Publisher’s Note: The statements, opinions and data contained in all publications are solely those of the individual author(s) and contributor(s) and not of MDPI and/or the editor(s). MDPI and/or the editor(s) disclaim responsibility for any injury to people or property resulting from any ideas, methods, instructions or products referred to in the content.

