
Tensile Test Optimization Using the Design of Experiment and Soft Computing


 , ,
, ,
Abstract
:1. Introduction
1.1. Tensile Test
1.2. Taguchi Application
1.3. Soft Computing
2. Methodology
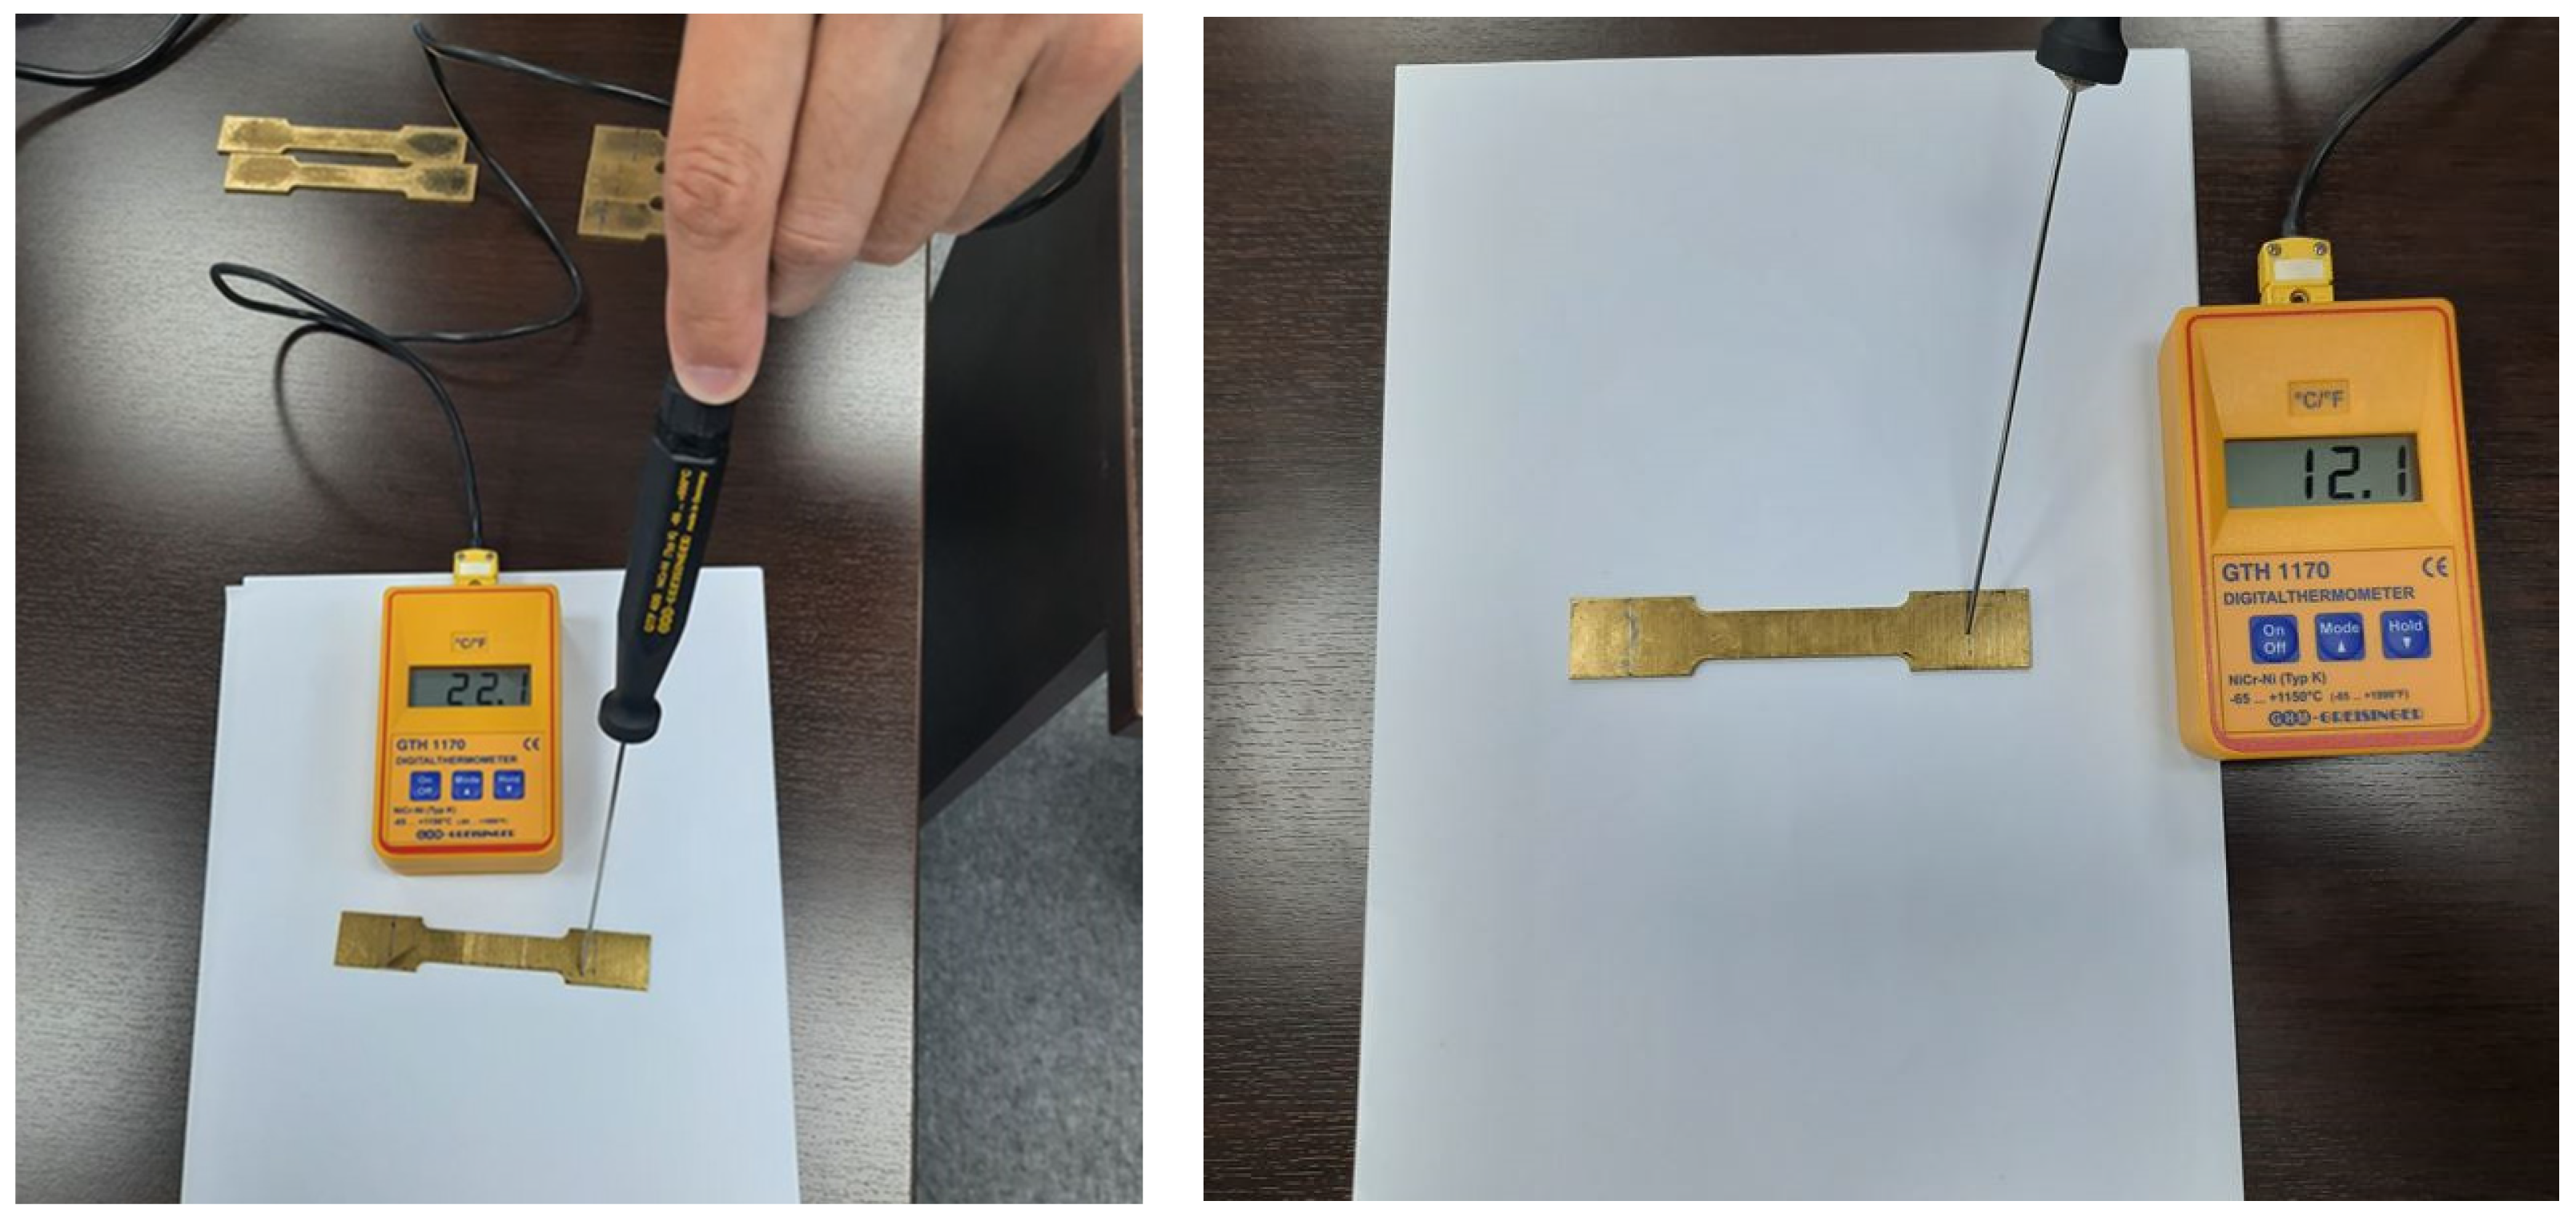
2.1. Material Selection and Setup
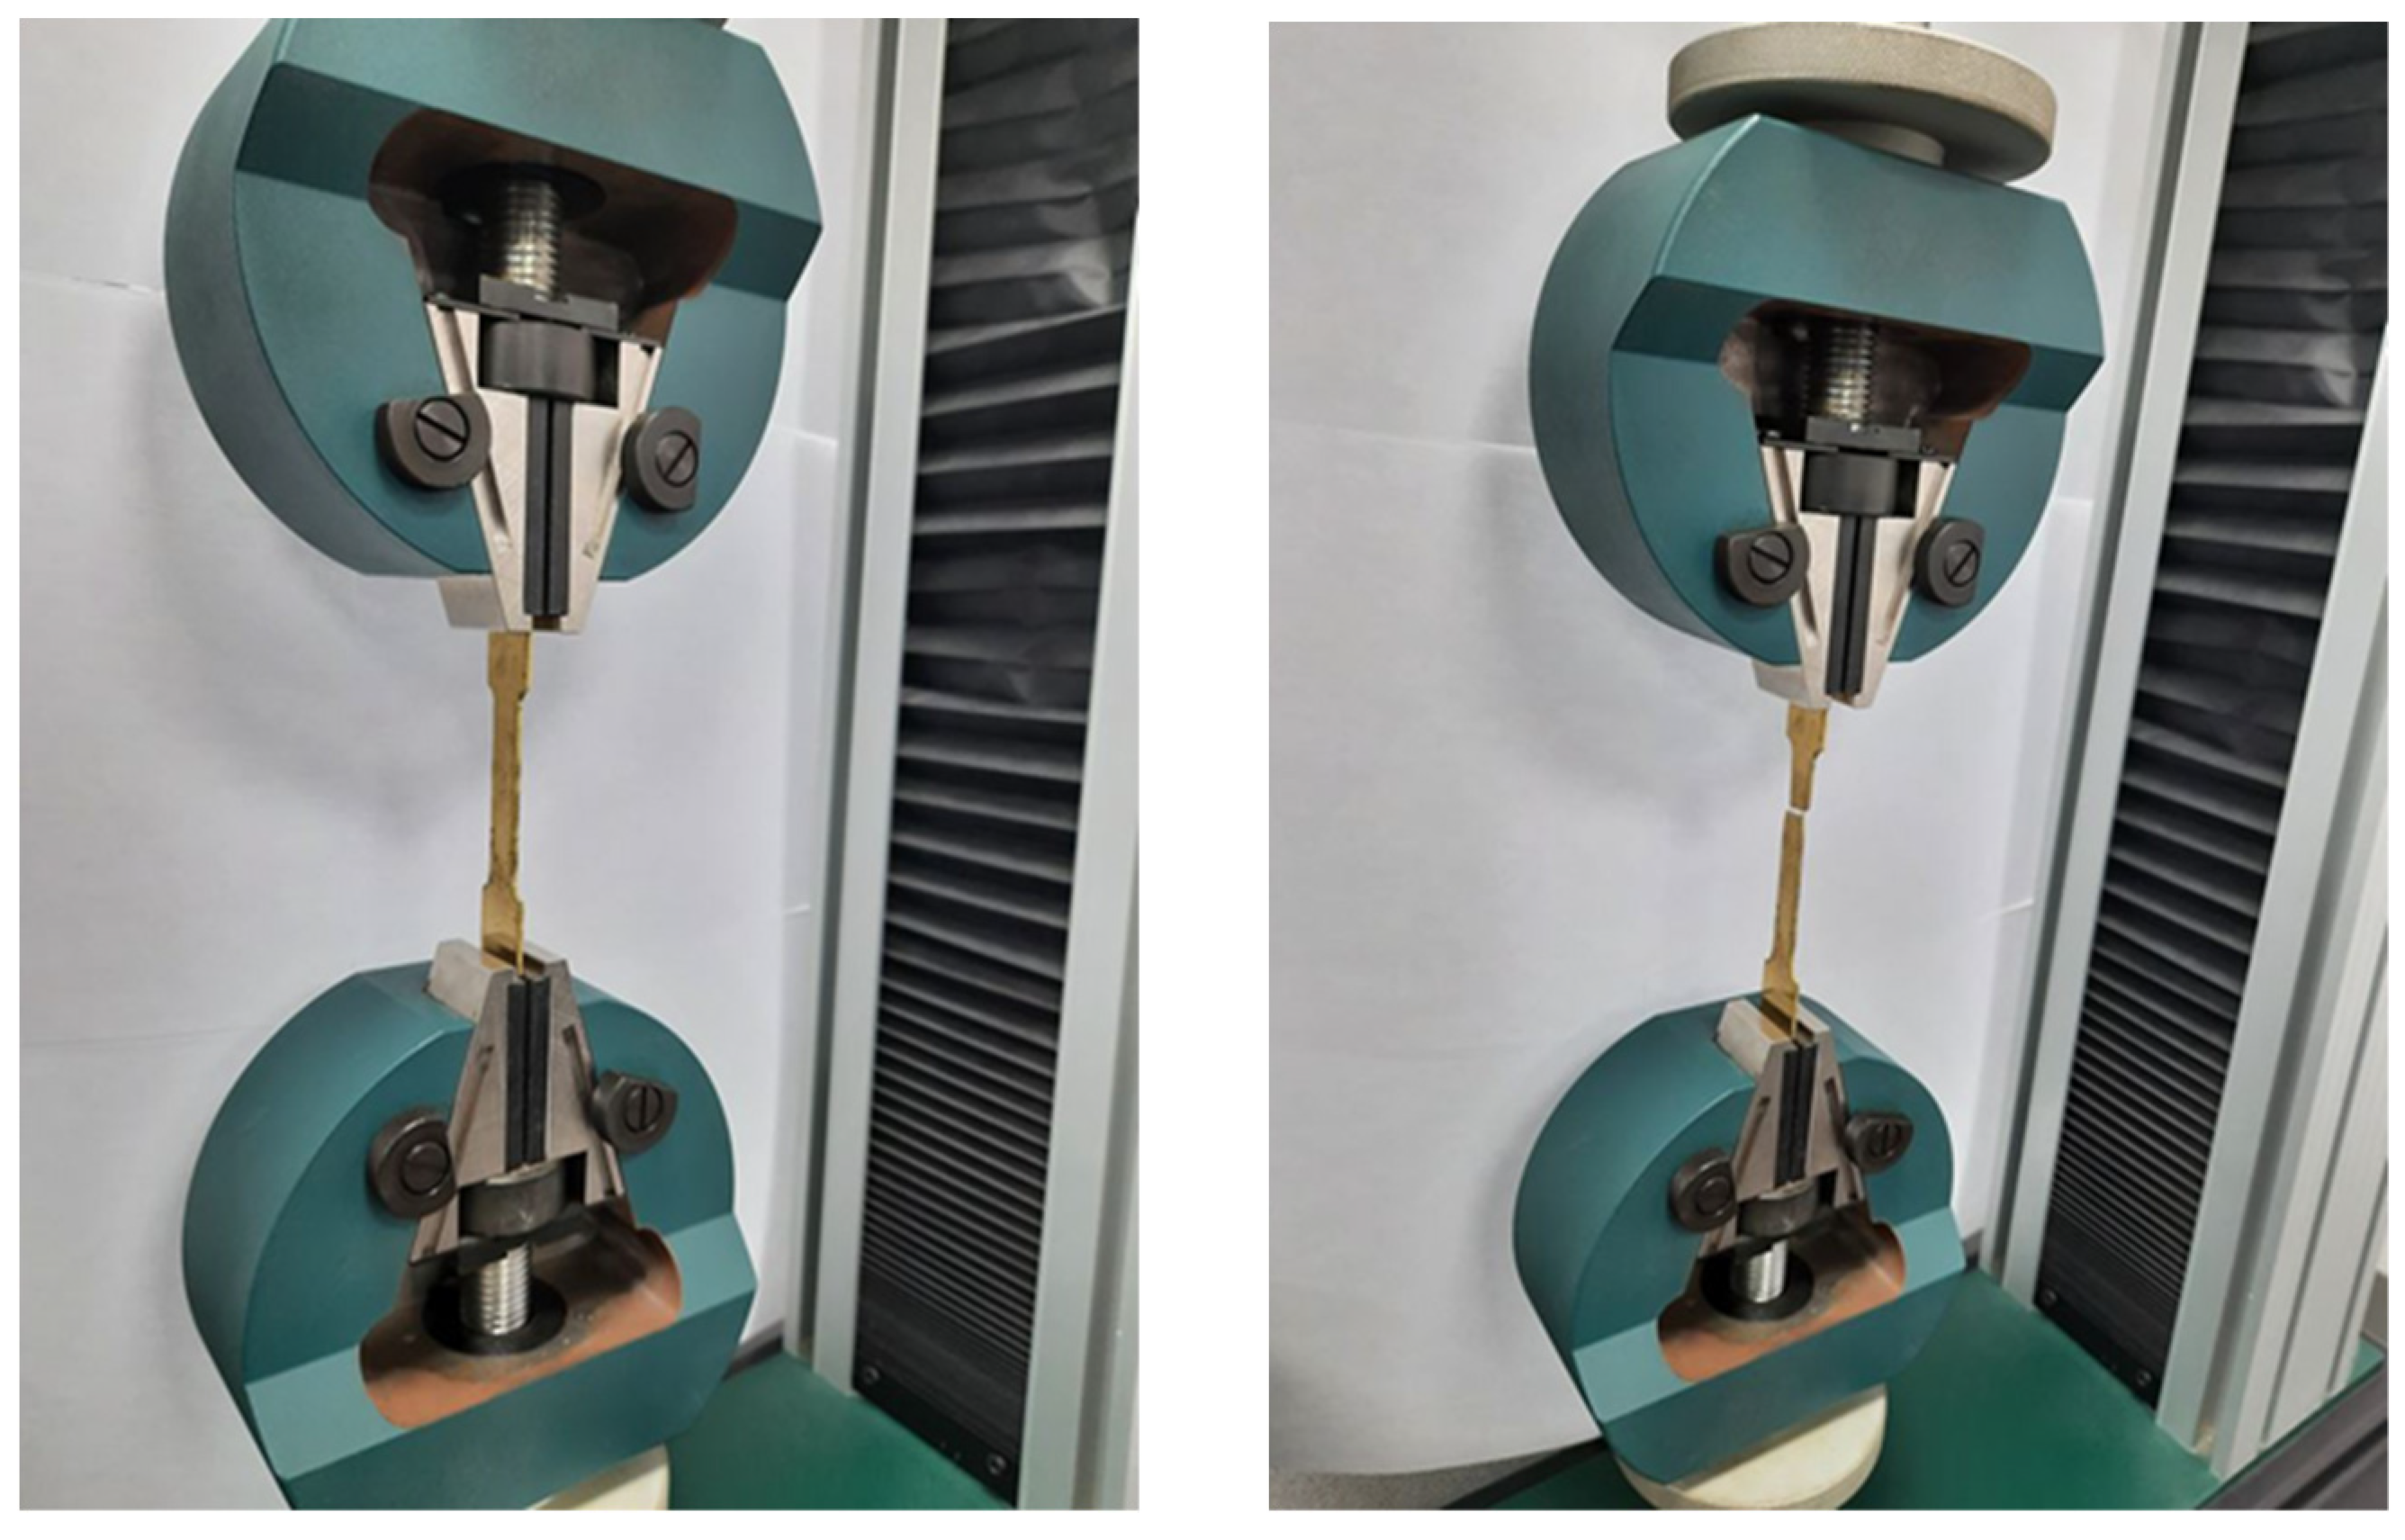
2.2. Experimental Setup
S/N Ratio Approach
2.3. Soft Computing
ANFIS
3. Results and Discussions
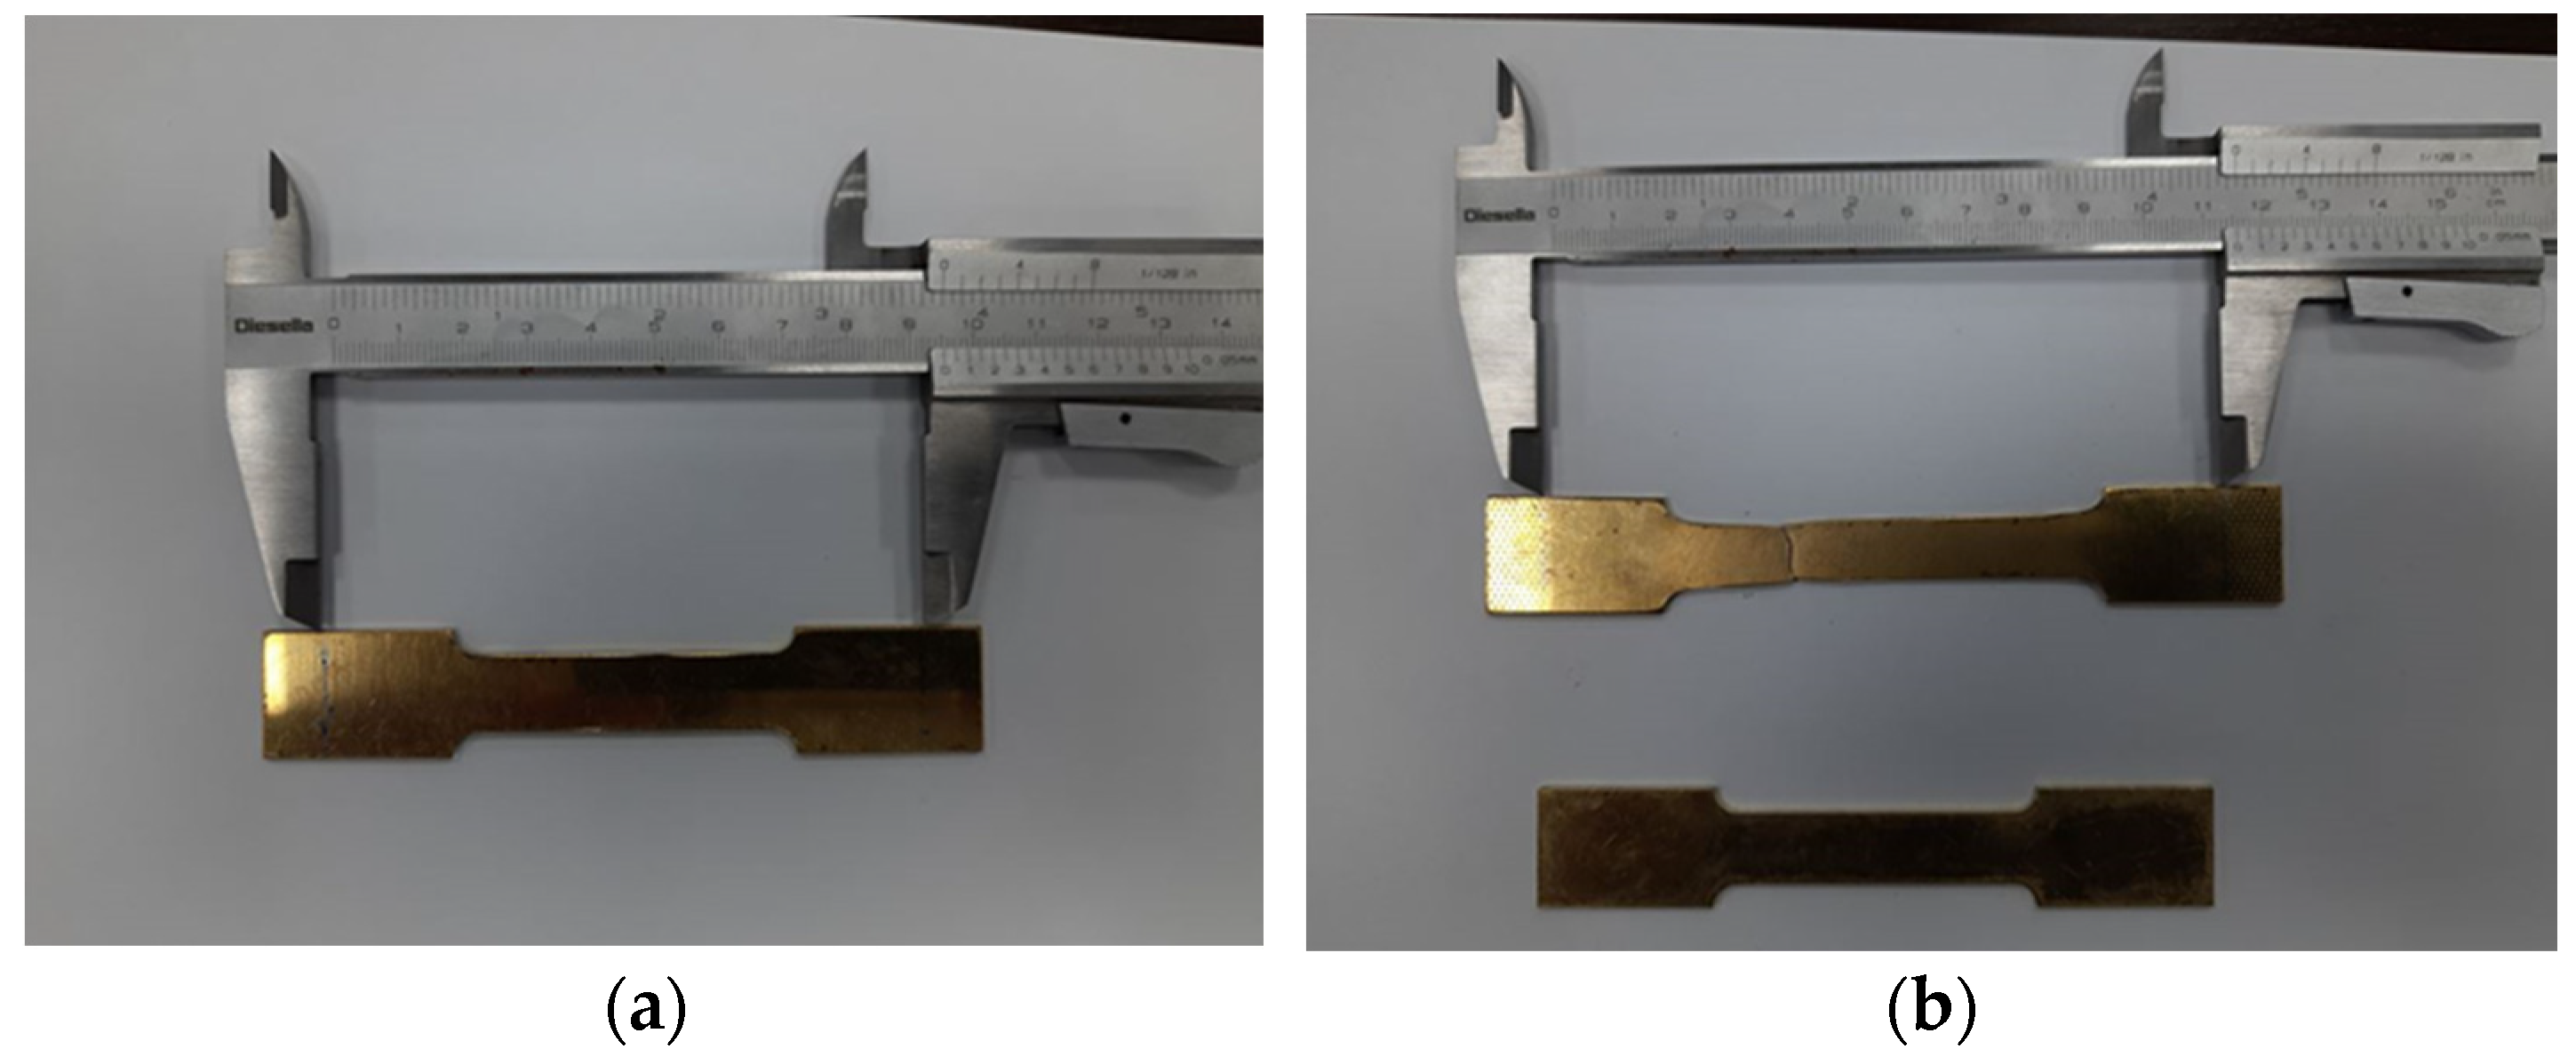
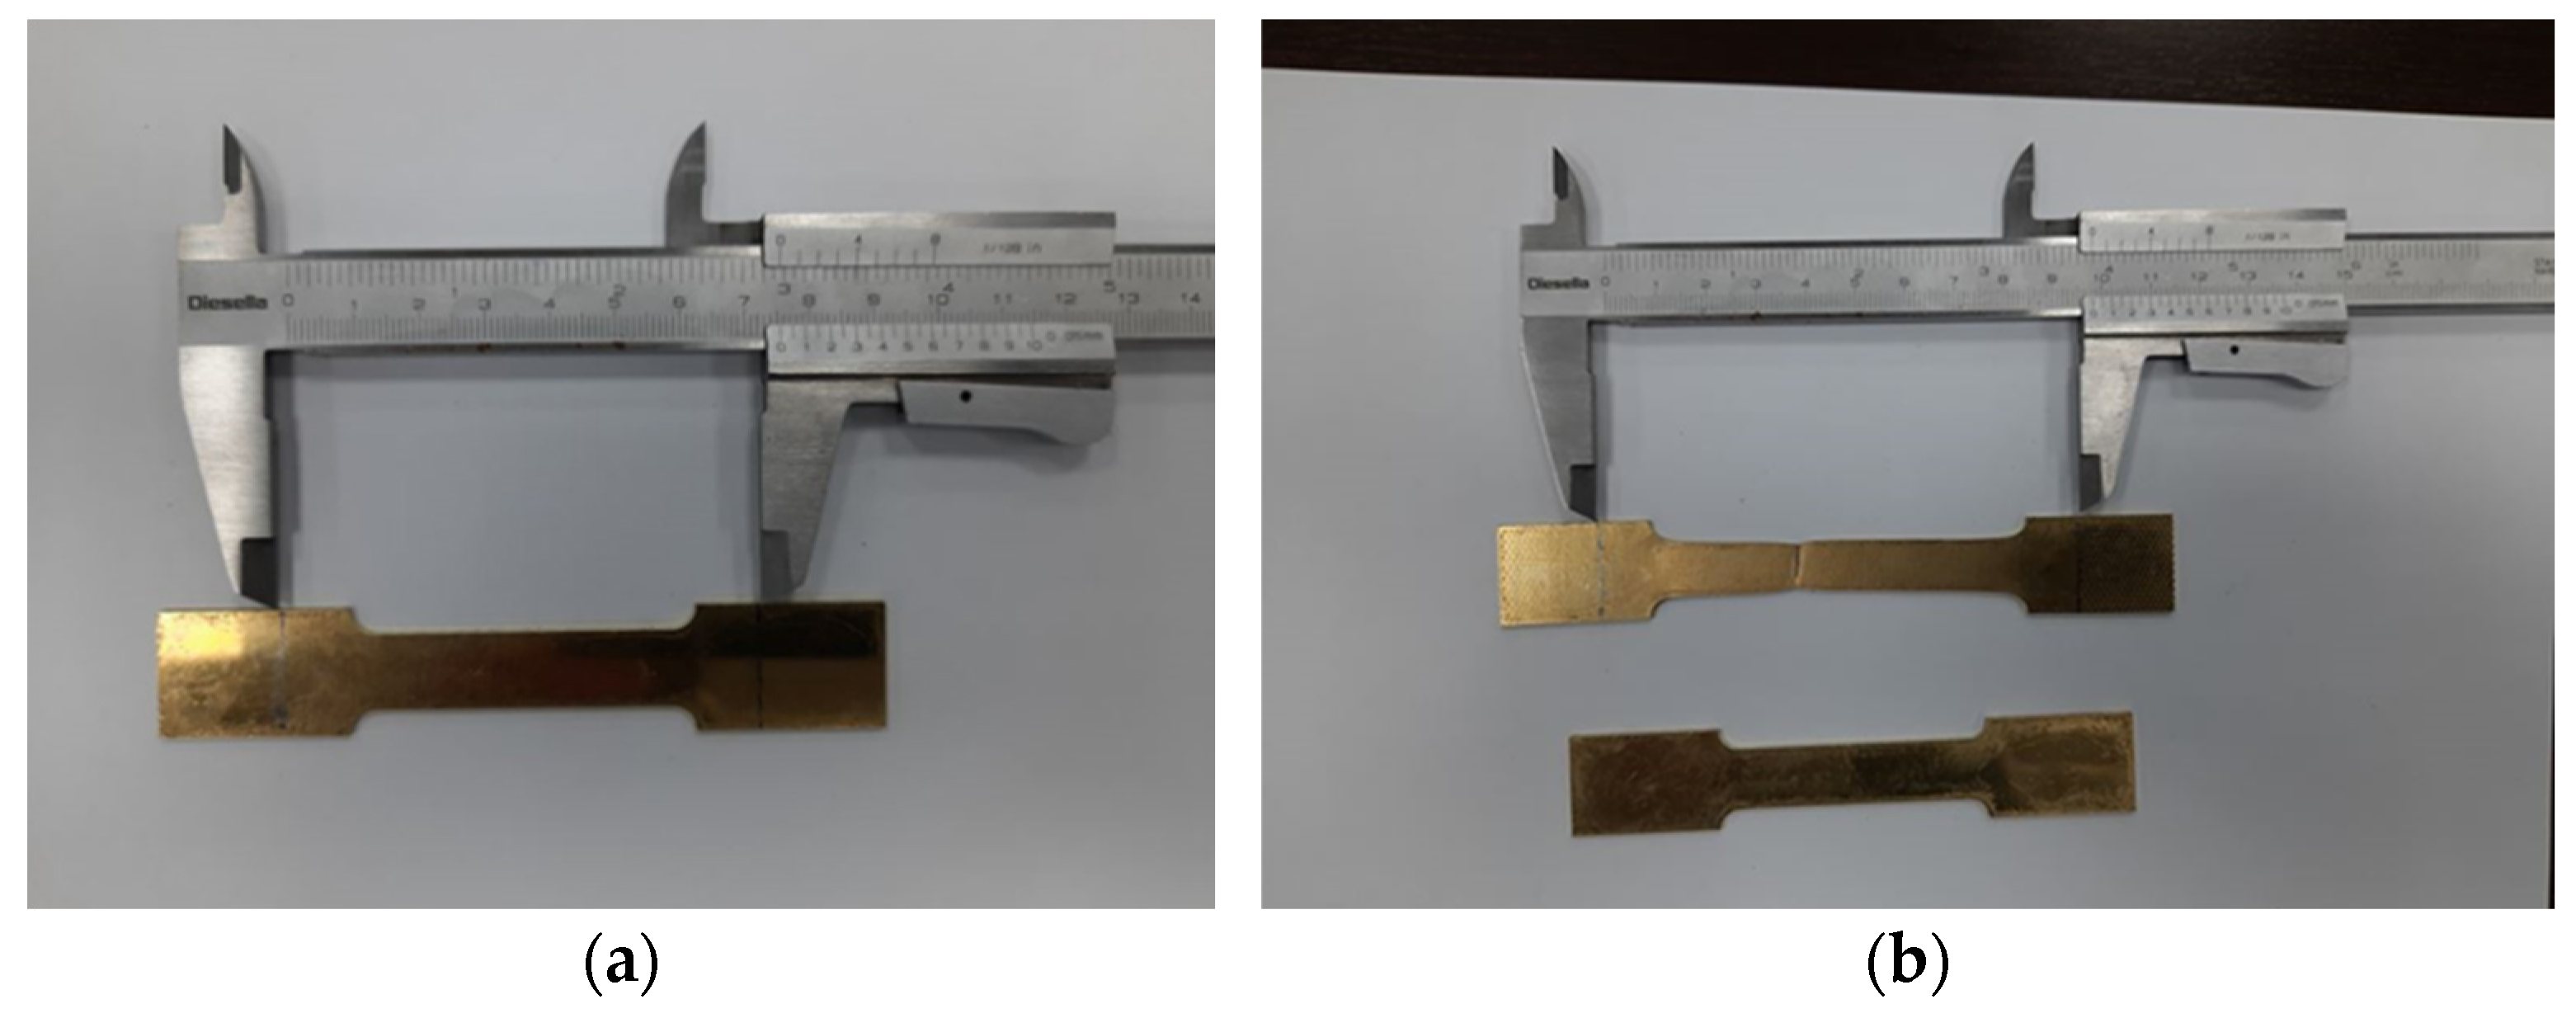
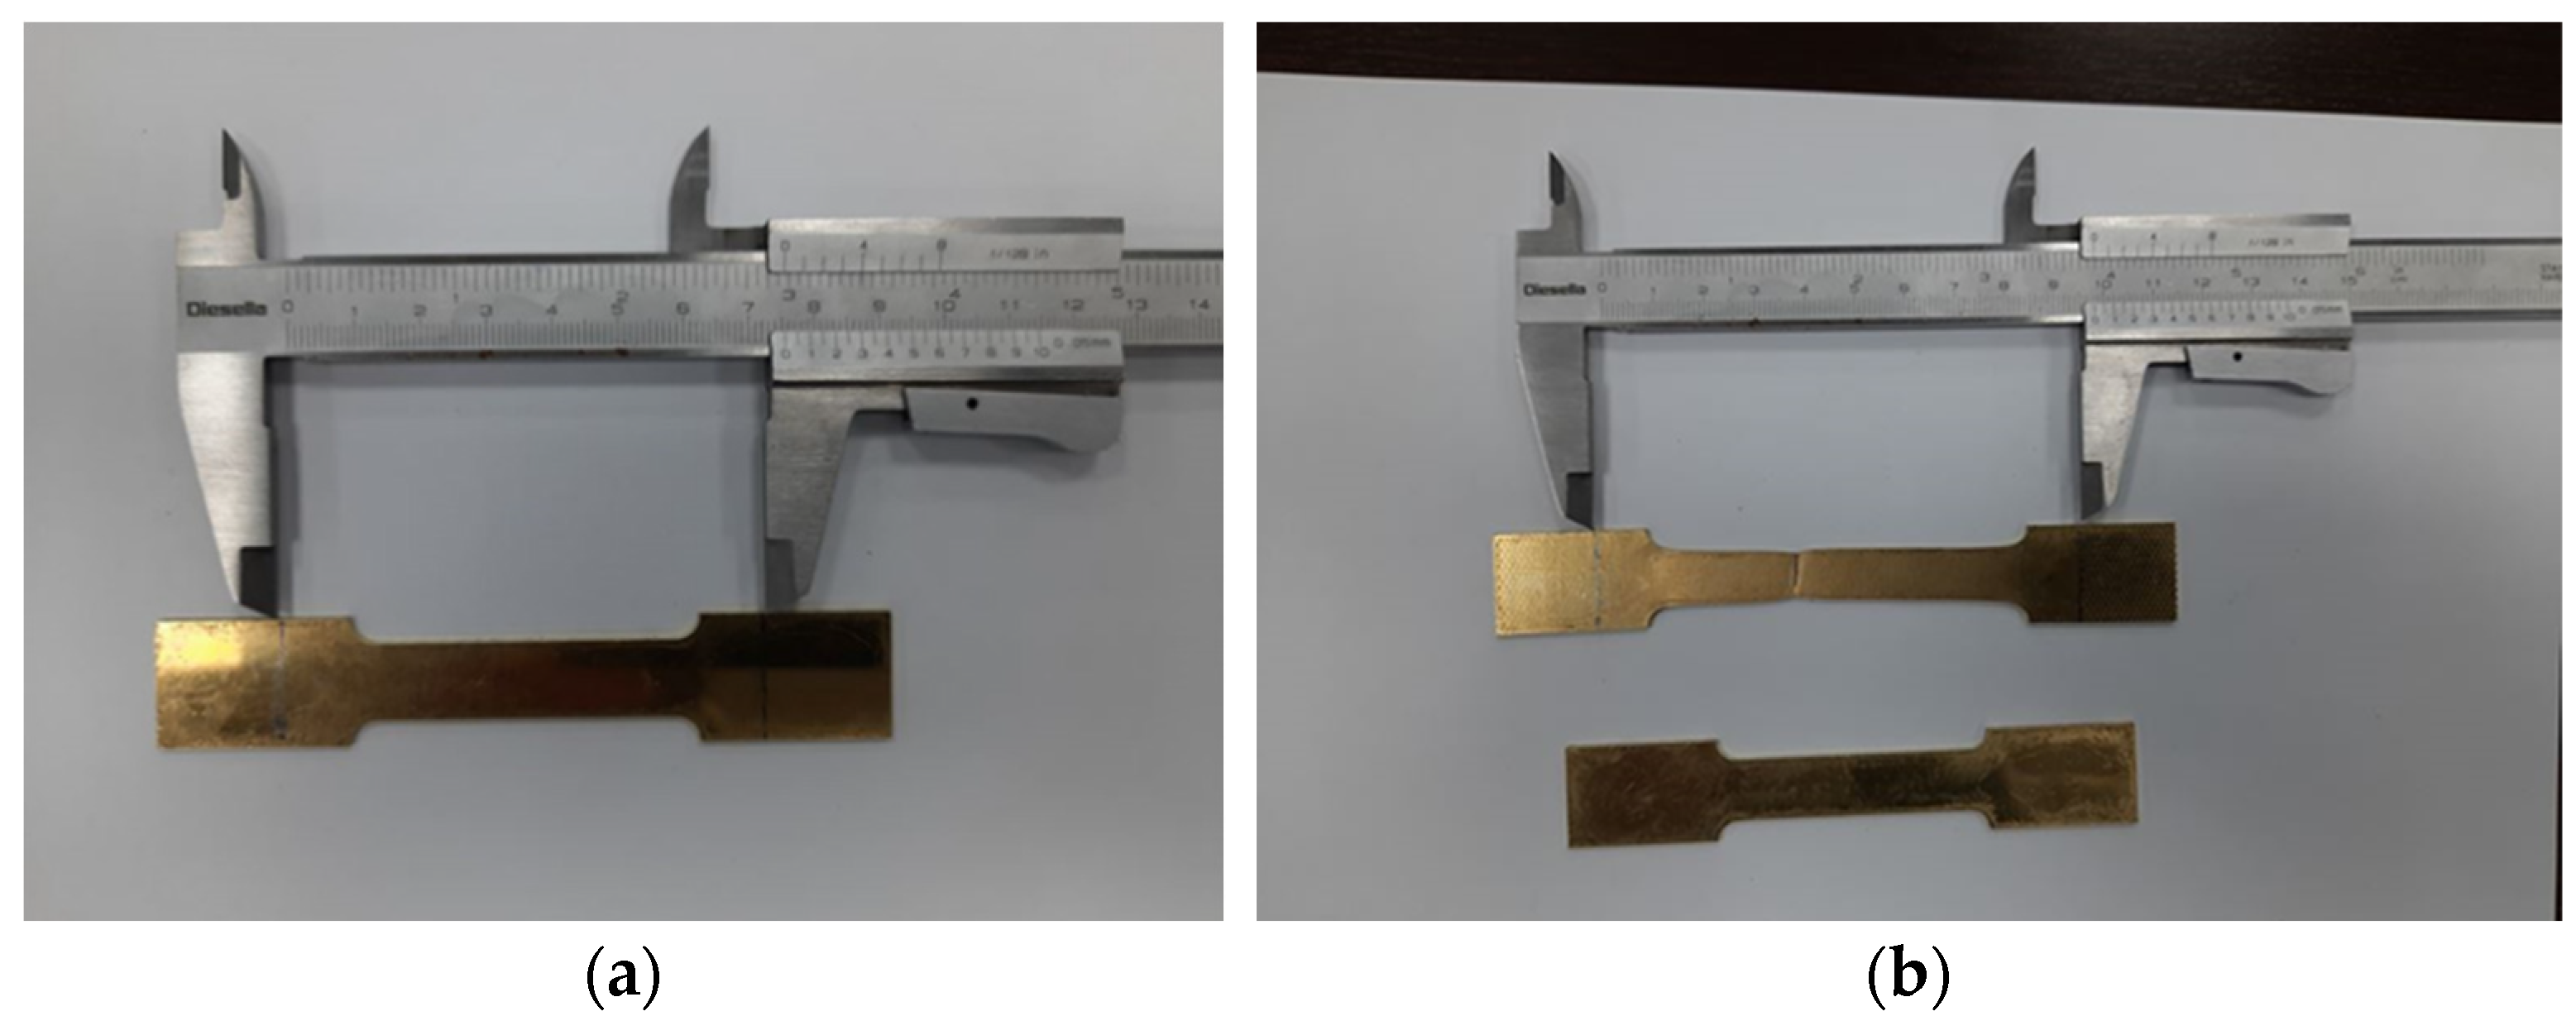
3.1. Measurement of Specimen Length and Grip Size
3.2. Measurement of Broken Specimens
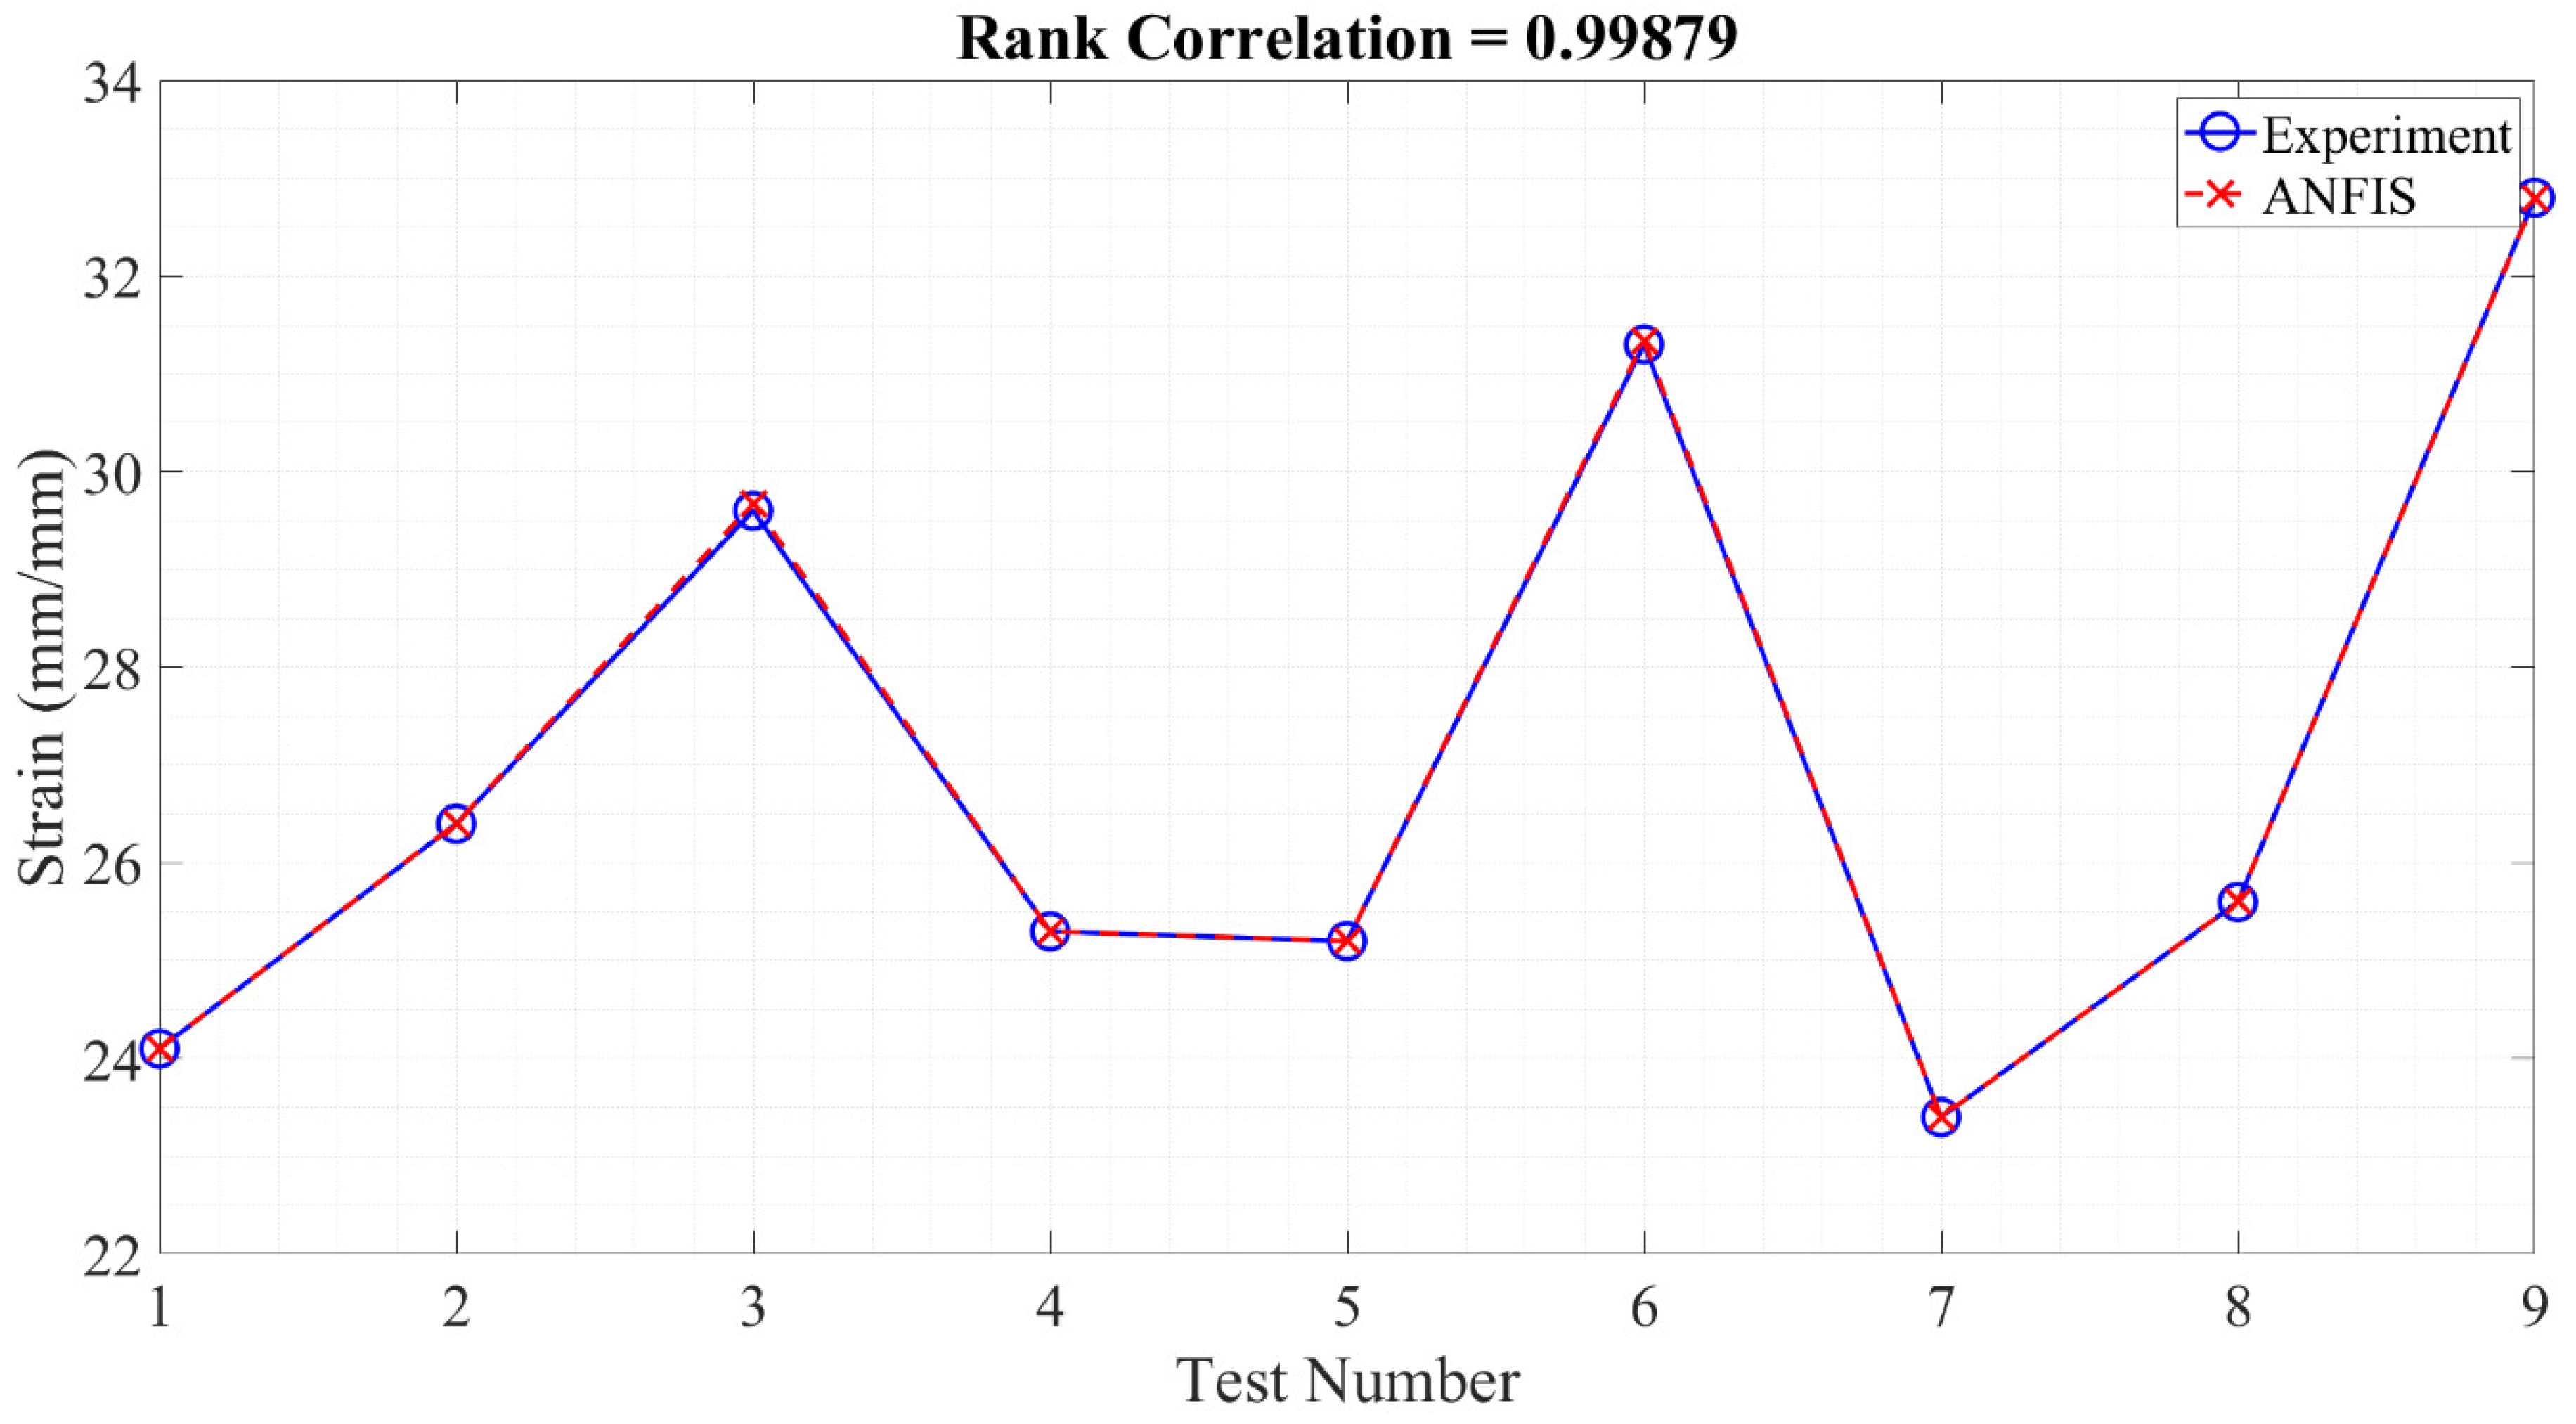
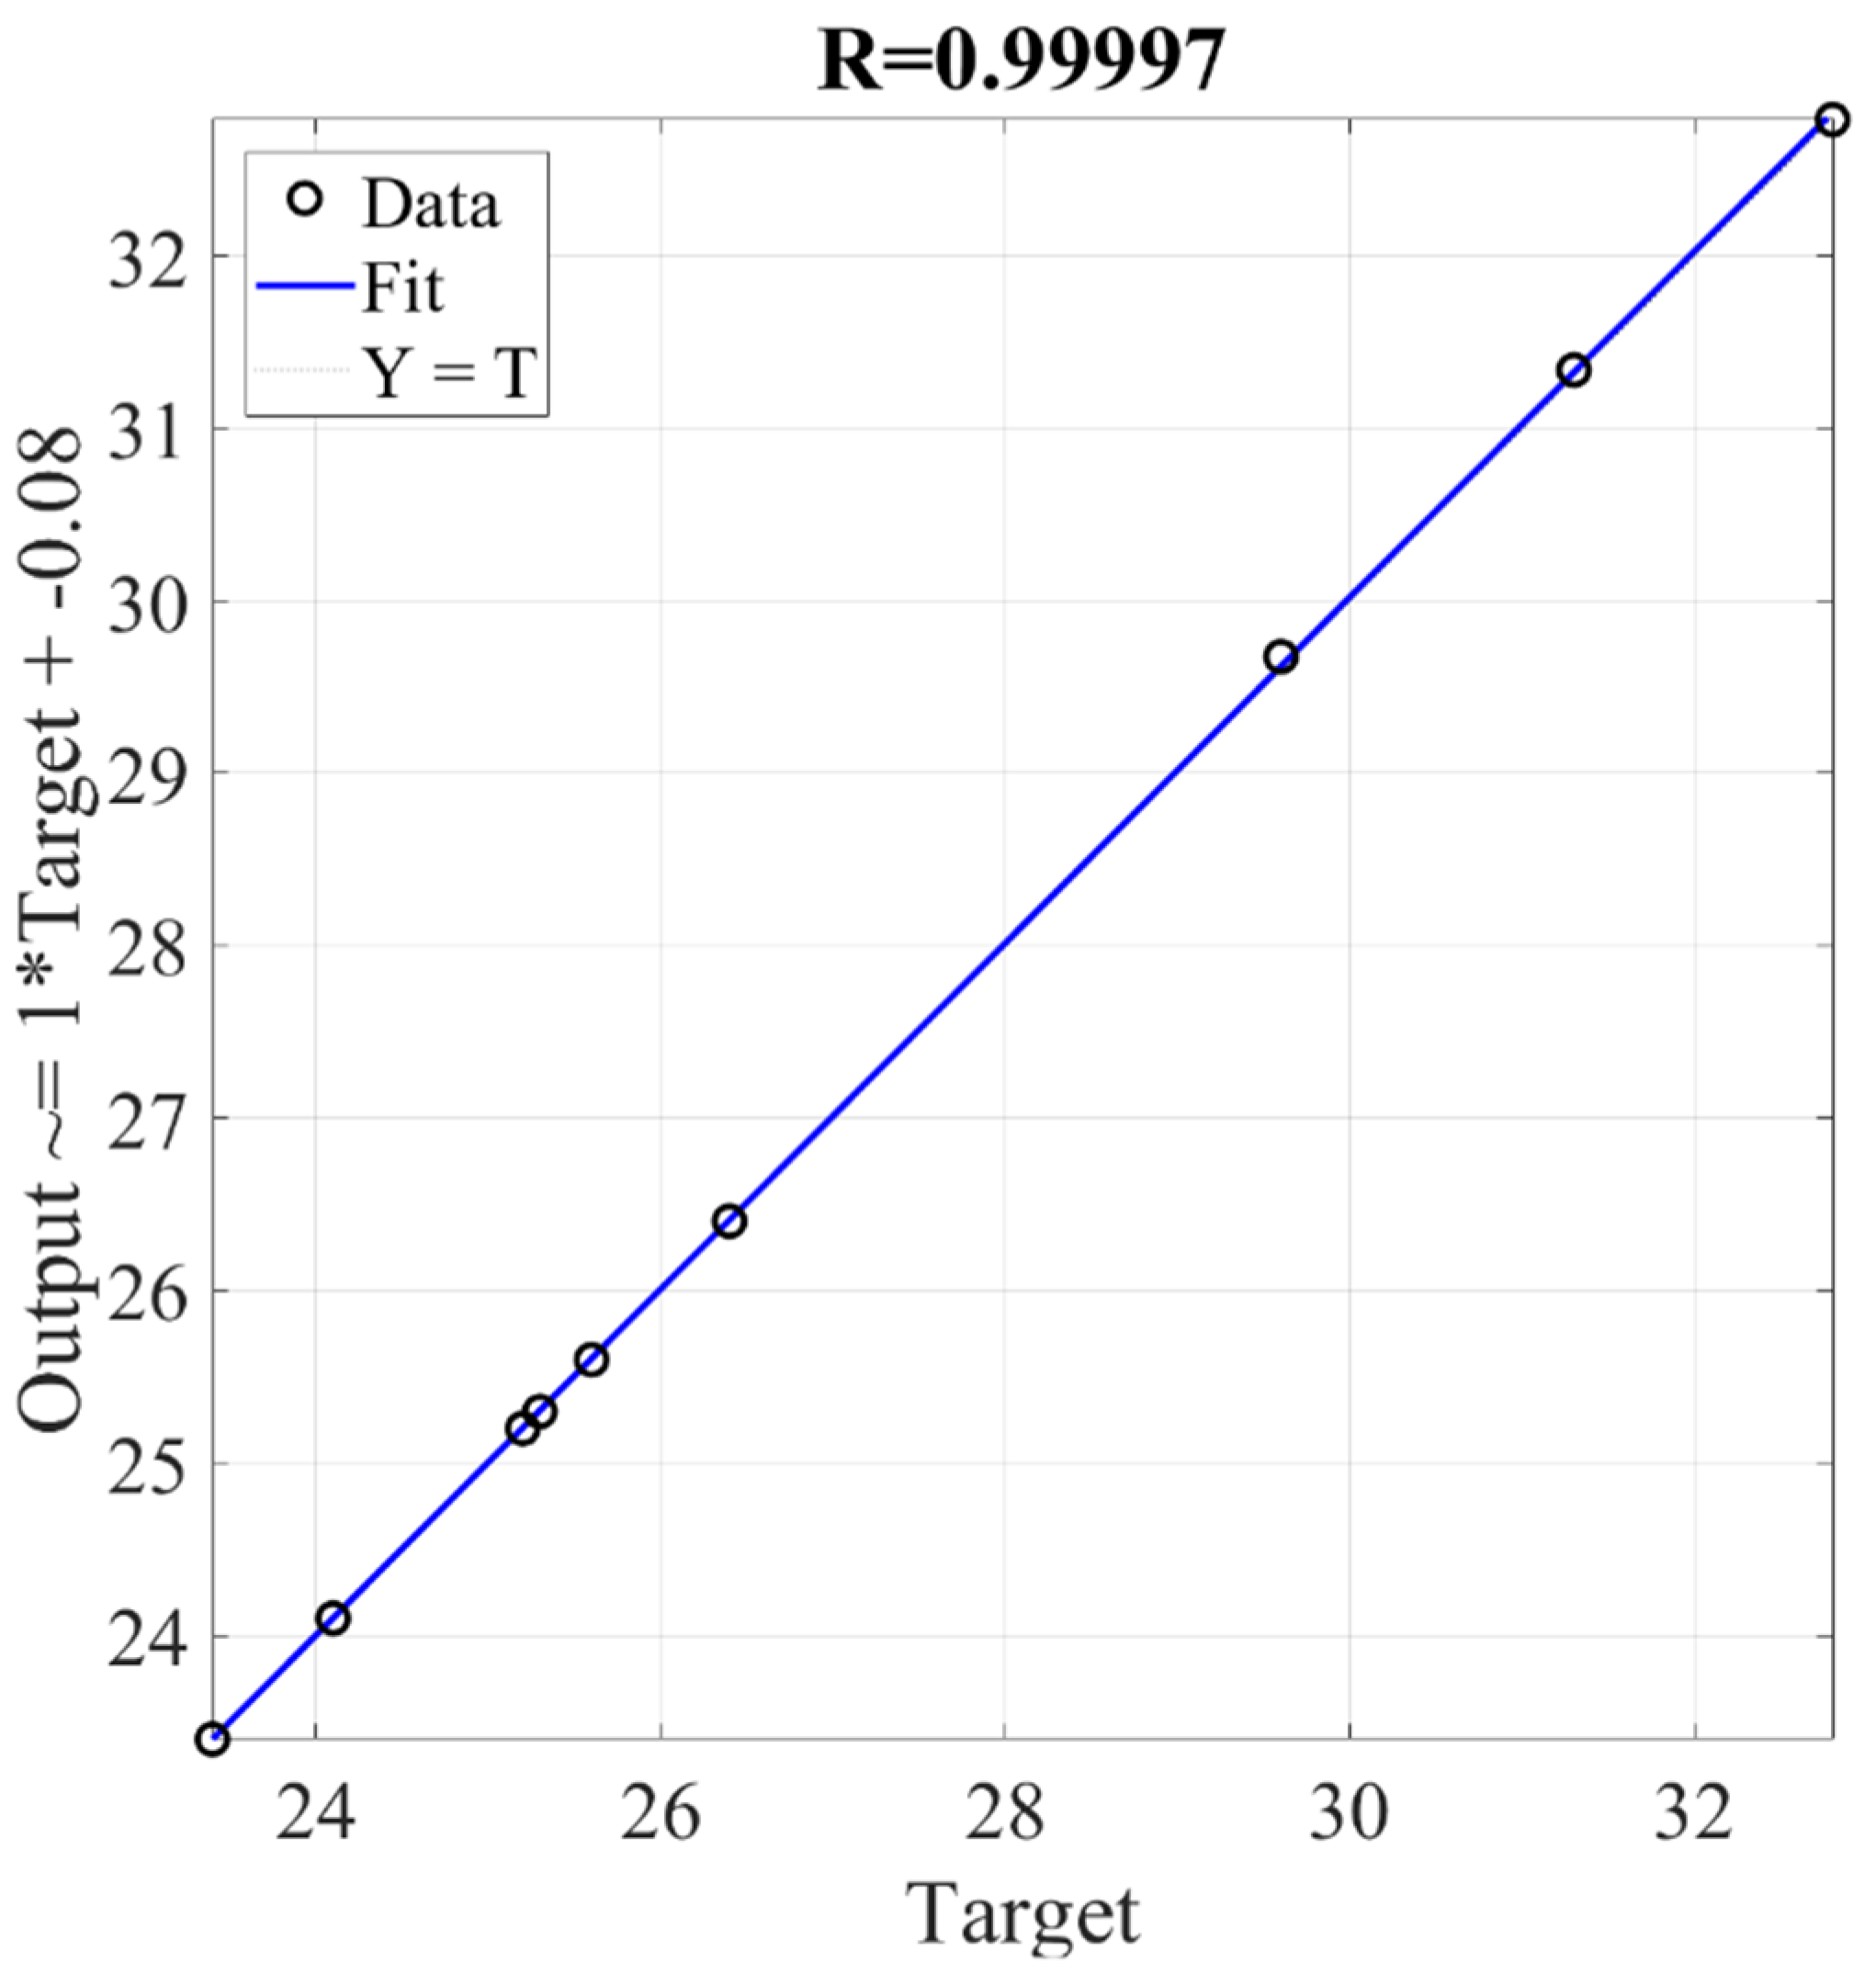
3.3. Soft Computing Method
4. Conclusions
Author Contributions
Funding
Data Availability Statement
Conflicts of Interest
References
- Callister, W.D.; Rethwisch, D.G. Materials Science and Engineering: An Introduction; John Wiley & Sons: New York, NY, USA, 2007; Volume 7, pp. 665–715. [Google Scholar]
- ISO 6892-1:2009; Metallic Materials—Tensile Testing—Part 1: Method of Test at Room Temperature. ISO: Geneva, Switzerland, 2009.
- Sert, E.; Hitzler, L.; Hafenstein, S.; Merkel, M.; Werner, E.; Öchsner, A. Tensile and Compressive Behaviour of Additively Manufactured AlSi10Mg Samples. Prog. Addit. Manuf. 2020, 5, 305–313. [Google Scholar] [CrossRef]
- Soric, Z.; Galic, J.; Rukavina, T. Determination of Tensile Strength of Glass Fiber Straps. Mater. Struct. 2008, 41, 879–890. [Google Scholar] [CrossRef]
- ASTM D638-22; ASTM Subcommittee D20.10 on Mechanical Properties. Standard Test Method for Tensile Properties of Thin Plastic Sheeting. American Society for Testing and Materials: West Conshohocken, PA, USA, 1995.
- ISO 527-5:2009; Plastics—Determination of Tensile Properties—Part 5: Test Conditions for Unidirectional Fibre-Reinforced Plastic Composites. ISO: Geneva, Switzerland, 2009.
- Dong, Y.; Milentis, J.; Pramanik, A. Additive Manufacturing of Mechanical Testing Samples Based on Virgin Poly (lactic acid) (PLA) and PLA/Wood Fibre Composites. Adv. Manuf. 2018, 6, 71–82. [Google Scholar] [CrossRef]
- Hikmat, M.; Rostam, S.; Ahmed, Y.M. Investigation of Tensile Property-Based Taguchi Method of PLA Parts Fabricated by FDM 3D Printing Technology. Results Eng. 2021, 11, 100264. [Google Scholar] [CrossRef]
- Yawas, D.S.; Sumaila, M.; Sarki, J.; Samuel, B.O. Manufacturing and Optimization of the Mechanical Properties (Tensile Strength, Flexural Strength, and Impact Energy) of a Chicken Feather/Egg Shell/Kaolin Hybrid Reinforced Epoxy Composite Using the Taguchi Technique. Int. J. Adv. Manuf. Technol. 2023, 127, 2211–2226. [Google Scholar] [CrossRef]
- Wang, H.; Bouchard, R.; Eagleson, R.; Martin, P.; Tyson, W.R. Ring Hoop Tension Test (RHTT): A Test for Transverse Tensile Properties of Tubular Materials. J. Test. Eval. 2002, 30, 382–391. [Google Scholar] [CrossRef]
- Rathmayr, G.; Bachmaier, A.; Pippan, R. Development of a New Testing Procedure for Performing Tensile Tests on Specimens with Sub-Millimetre Dimensions. J. Test. Eval. 2013, 41, 635–646. [Google Scholar] [CrossRef]
- Wen, H.; Bhusal, S. A Laboratory Study to Predict the Rutting and Fatigue Behavior of Asphalt Concrete Using the Indirect Tensile Test. J. Test. Eval. 2013, 41, 299–304. [Google Scholar] [CrossRef]
- Herrera, R.; Landes, J.D. A Direct Curve Analysis of Fracture Toughness Tests. J. Test. Eval. 1988, 16, 427–449. [Google Scholar] [CrossRef]
- Dehnad, K. Quality Control, Robust Design and the Taguchi Method, 5th ed.; Wadsworth & Brooks/Cole Advanced Books & Software: Pacific Grove, CA, USA, 1990. [Google Scholar]
- Moayyedian, M.; Mohajer, A.; Kazemian, M.G.; Mamedov, A.; Derakhshandeh, J.F. Surface Roughness Analysis in Milling Machining Using Design of Experiment. SN Appl. Sci. 2020, 2, 1698. [Google Scholar] [CrossRef]
- Moayyedian, M.; Dinc, A.; Mamedov, A. Optimization of Injection-Molding Process for Thin-Walled Polypropylene Part Using Artificial Neural Network and Taguchi Techniques. Polymers 2021, 13, 4158. [Google Scholar] [CrossRef]
- Mader, D.P. Design for Six Sigma. Qual. Prog. 2002, 35, 82–86. [Google Scholar]
- Moayyedian, M.; Derakhshandeh, J.F.; Lee, S.H. Optimization of Strain Measurement Procedure Based on Fuzzy Quality Evaluation and Taguchi Experimental Design. SN Appl. Sci. 2019, 1, 1392. [Google Scholar] [CrossRef]
- Gibson, S.J.; Rogers, T.J.; Cross, E.J. Distributions of Fatigue Damage from Data-Driven Strain Prediction Using Gaussian Process Regression. Struct. Health Monit. 2023, 22, 3065–3307. [Google Scholar] [CrossRef]
- Tanhadoust, A.; Yang, T.Y.; Dabbaghi, F.; Chai, H.K.; Mohseni, M.; Emadi, S.B.; Nasrollahpour, S. Predicting Stress-Strain Behavior of Normal Weight and Lightweight Aggregate Concrete Exposed to High Temperature Using LSTM Recurrent Neural Network. Constr. Build. Mater. 2023, 362, 129703. [Google Scholar] [CrossRef]
- Hiew, S.Y.; Teoh, K.B.; Raman, S.N.; Kong, D.; Hafezolghorani, M. Prediction of Ultimate Conditions and Stress–Strain Behaviour of Steel-Confined Ultra-High-Performance Concrete Using Sequential Deep Feed-Forward Neural Network Modelling Strategy. Eng. Struct. 2023, 277, 115447. [Google Scholar] [CrossRef]
- Milad, A.; Hussein, S.H.; Khekan, A.R.; Rashid, M.; Al-Msari, H.; Tran, T.H. Development of Ensemble Machine Learning Approaches for Designing Fiber-Reinforced Polymer Composite Strain Prediction Model. Eng. Comput. 2022, 38, 3625–3637. [Google Scholar] [CrossRef]
- Iravanian, A.; Kassem, Y.; Gökçekuş, H. Stress–Strain Behavior of Modified Expansive Clay Soil: Experimental Measurements and Prediction Models. Environ. Earth Sci. 2022, 81, 107. [Google Scholar] [CrossRef]
- Yang, K.; El-Haik, B.S. Design for Six Sigma: A Roadmap for Product Development; McGraw-Hill Companies: New York, NY, USA, 2009. [Google Scholar]
- Mitchell, M. An Introduction to Genetic Algorithms; MIT Press: Cambridge, MA, USA, 1998. [Google Scholar]


| Parameters | Level 1 | Level 2 | Level 3 |
|---|---|---|---|
| Temperature (°C), C | 12 | 22 | 32 |
| Specimen length (grip surface) (mm²) B | 75 | 85 | 95 |
| Operator, A | 1 | 2 | 3 |
| Trials | A | B | C |
|---|---|---|---|
| 1 | 1 | 1 | 1 |
| 2 | 1 | 2 | 2 |
| 3 | 1 | 3 | 3 |
| 4 | 2 | 1 | 2 |
| 5 | 2 | 2 | 3 |
| 6 | 2 | 3 | 1 |
| 7 | 3 | 1 | 3 |
| 8 | 3 | 2 | 1 |
| 9 | 3 | 3 | 2 |
| Hyperparameter | Value |
|---|---|
| Epoch Number | 200 |
| Membership functions for each input variable | 3 |
| Step-size decrease rate | 0.5128 |
| Step-size increase rate | 1.0033 |
| Initial training step size | 0.0985 |
| Trial | P1 | P2 (mm²) | P3 (°C) | Strain | MSD | S/N |
|---|---|---|---|---|---|---|
| 1 | Operator 1 | 400 | 12 | 24.1 | 0.0017 | 27.64 |
| 2 | Operator 1 | 600 | 22 | 26.4 | 0.0014 | 28.43 |
| 3 | Operator 1 | 800 | 32 | 29.6 | 0.0011 | 29.43 |
| 4 | Operator 2 | 400 | 22 | 25.3 | 0.0021 | 26.73 |
| 5 | Operator 2 | 600 | 32 | 25.2 | 0.0016 | 28.03 |
| 6 | Operator 2 | 800 | 12 | 31.3 | 0.0012 | 29.19 |
| 7 | Operator 1 and 2 | 400 | 32 | 23.4 | 0.0018 | 27.38 |
| 8 | Operator 1 and 2 | 600 | 12 | 25.6 | 0.0015 | 28.16 |
| 9 | Operator 1 and 2 | 800 | 22 | 32.8 | 0.0011 | 29.77 |
| P1 | P2 | P3 | |
|---|---|---|---|
| L1 | 28.49 | 27.69 | 28.57 |
| L2 | 29.91 | 28.20 | 28.93 |
| L3 | 28.62 | 29.88 | 28.27 |
| |ΔT| | 1.28 | 2.18 | 0.29 |
| Rate | 2 | 1 | 3 |
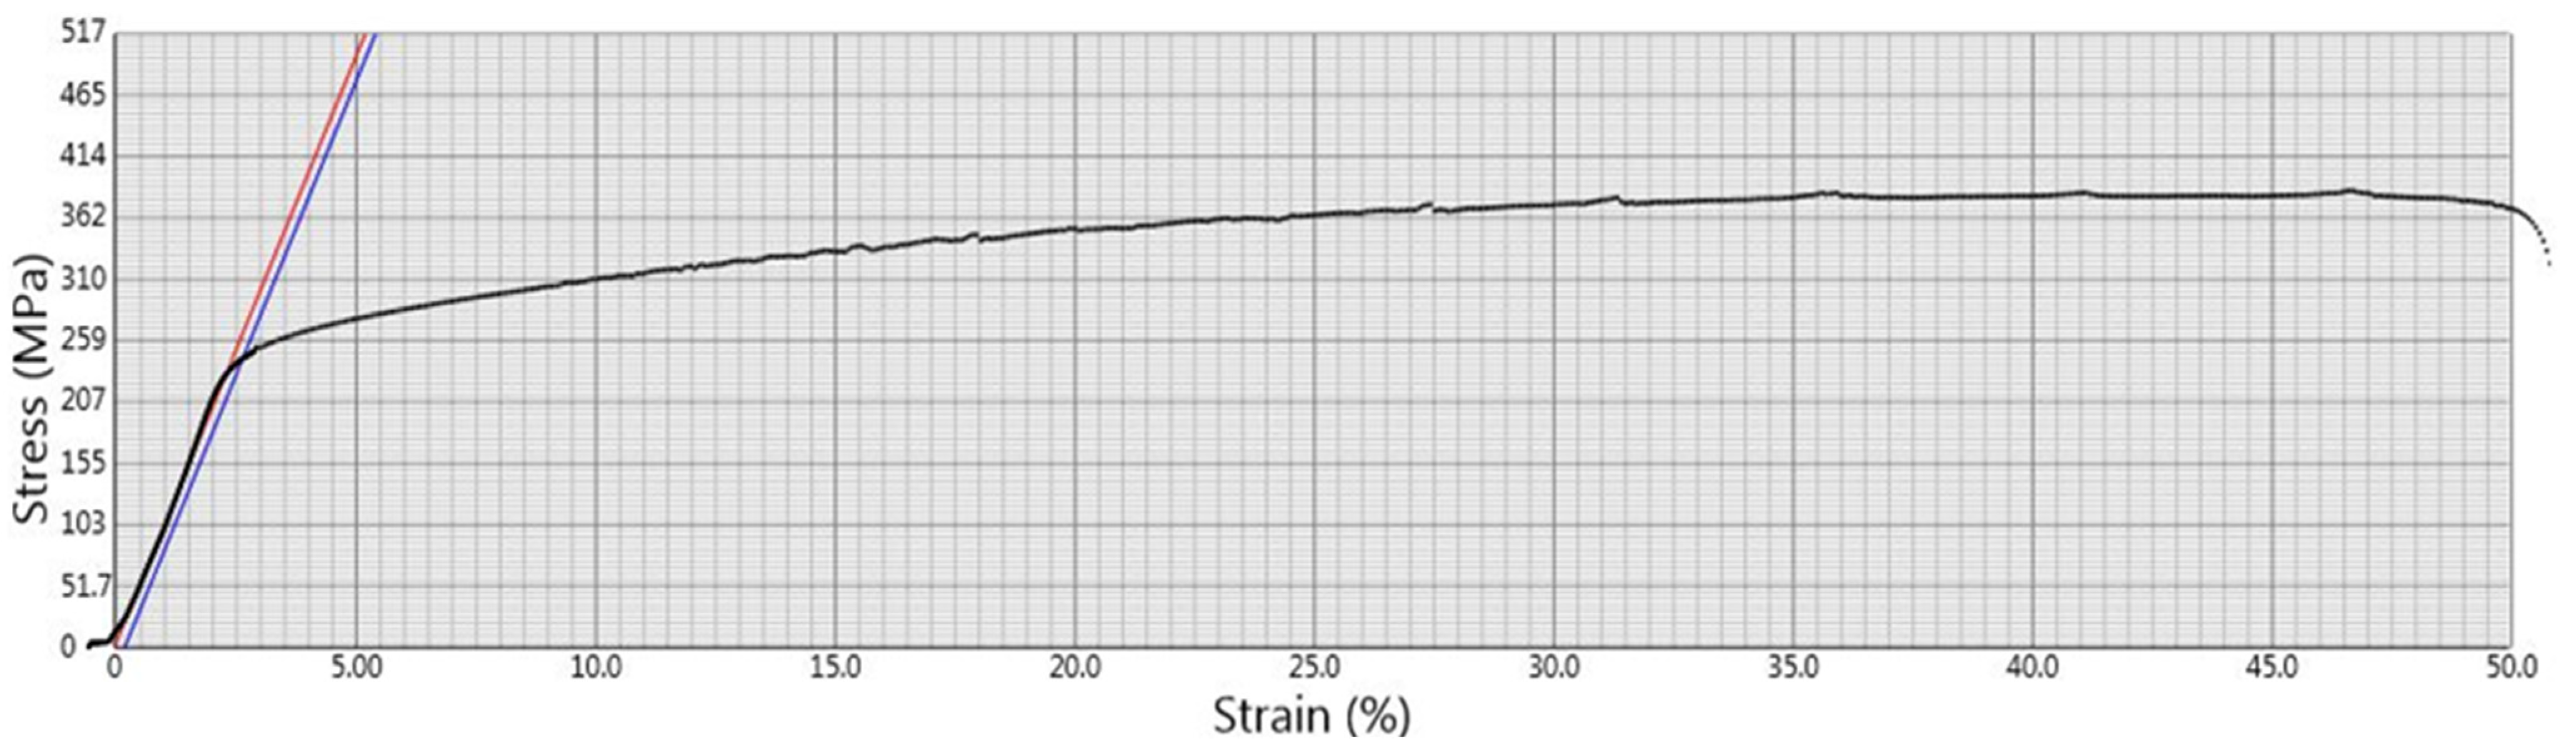
| Trial | Temperature | Gripping Area | Operator | Modulus [MPa] | Ultimate Force [N] | Ultimate Stress [MPa] | Elongation [%] |
|---|---|---|---|---|---|---|---|
| 1 | 22 °C | (800 mm2) | Operator 2 | 9870 | 7040 | 385 | 33.5 |
Disclaimer/Publisher’s Note: The statements, opinions and data contained in all publications are solely those of the individual author(s) and contributor(s) and not of MDPI and/or the editor(s). MDPI and/or the editor(s) disclaim responsibility for any injury to people or property resulting from any ideas, methods, instructions or products referred to in the content. |
© 2023 by the authors. Licensee MDPI, Basel, Switzerland. This article is an open access article distributed under the terms and conditions of the Creative Commons Attribution (CC BY) license (https://creativecommons.org/licenses/by/4.0/).
Share and Cite
Moayyedian, M.; Qazani, M.R.C.; Cvorovic, V.; Asi, F.; Mussin, A.; Hedayati-Dezfooli, M.; Dinc, A. Tensile Test Optimization Using the Design of Experiment and Soft Computing. Processes 2023, 11, 3106. https://doi.org/10.3390/pr11113106
Moayyedian M, Qazani MRC, Cvorovic V, Asi F, Mussin A, Hedayati-Dezfooli M, Dinc A. Tensile Test Optimization Using the Design of Experiment and Soft Computing. Processes. 2023; 11(11):3106. https://doi.org/10.3390/pr11113106
Chicago/Turabian StyleMoayyedian, Mehdi, Mohammad Reza Chalak Qazani, Vuk Cvorovic, Fahad Asi, Askhat Mussin, Mohsen Hedayati-Dezfooli, and Ali Dinc. 2023. "Tensile Test Optimization Using the Design of Experiment and Soft Computing" Processes 11, no. 11: 3106. https://doi.org/10.3390/pr11113106
APA StyleMoayyedian, M., Qazani, M. R. C., Cvorovic, V., Asi, F., Mussin, A., Hedayati-Dezfooli, M., & Dinc, A. (2023). Tensile Test Optimization Using the Design of Experiment and Soft Computing. Processes, 11(11), 3106. https://doi.org/10.3390/pr11113106