

Fluid Identification Method of Nuclear Magnetic Resonance and Array Acoustic Logging for Complex Oil and Water Layers in Tight Sandstone Reservoir


Abstract
:1. Introduction
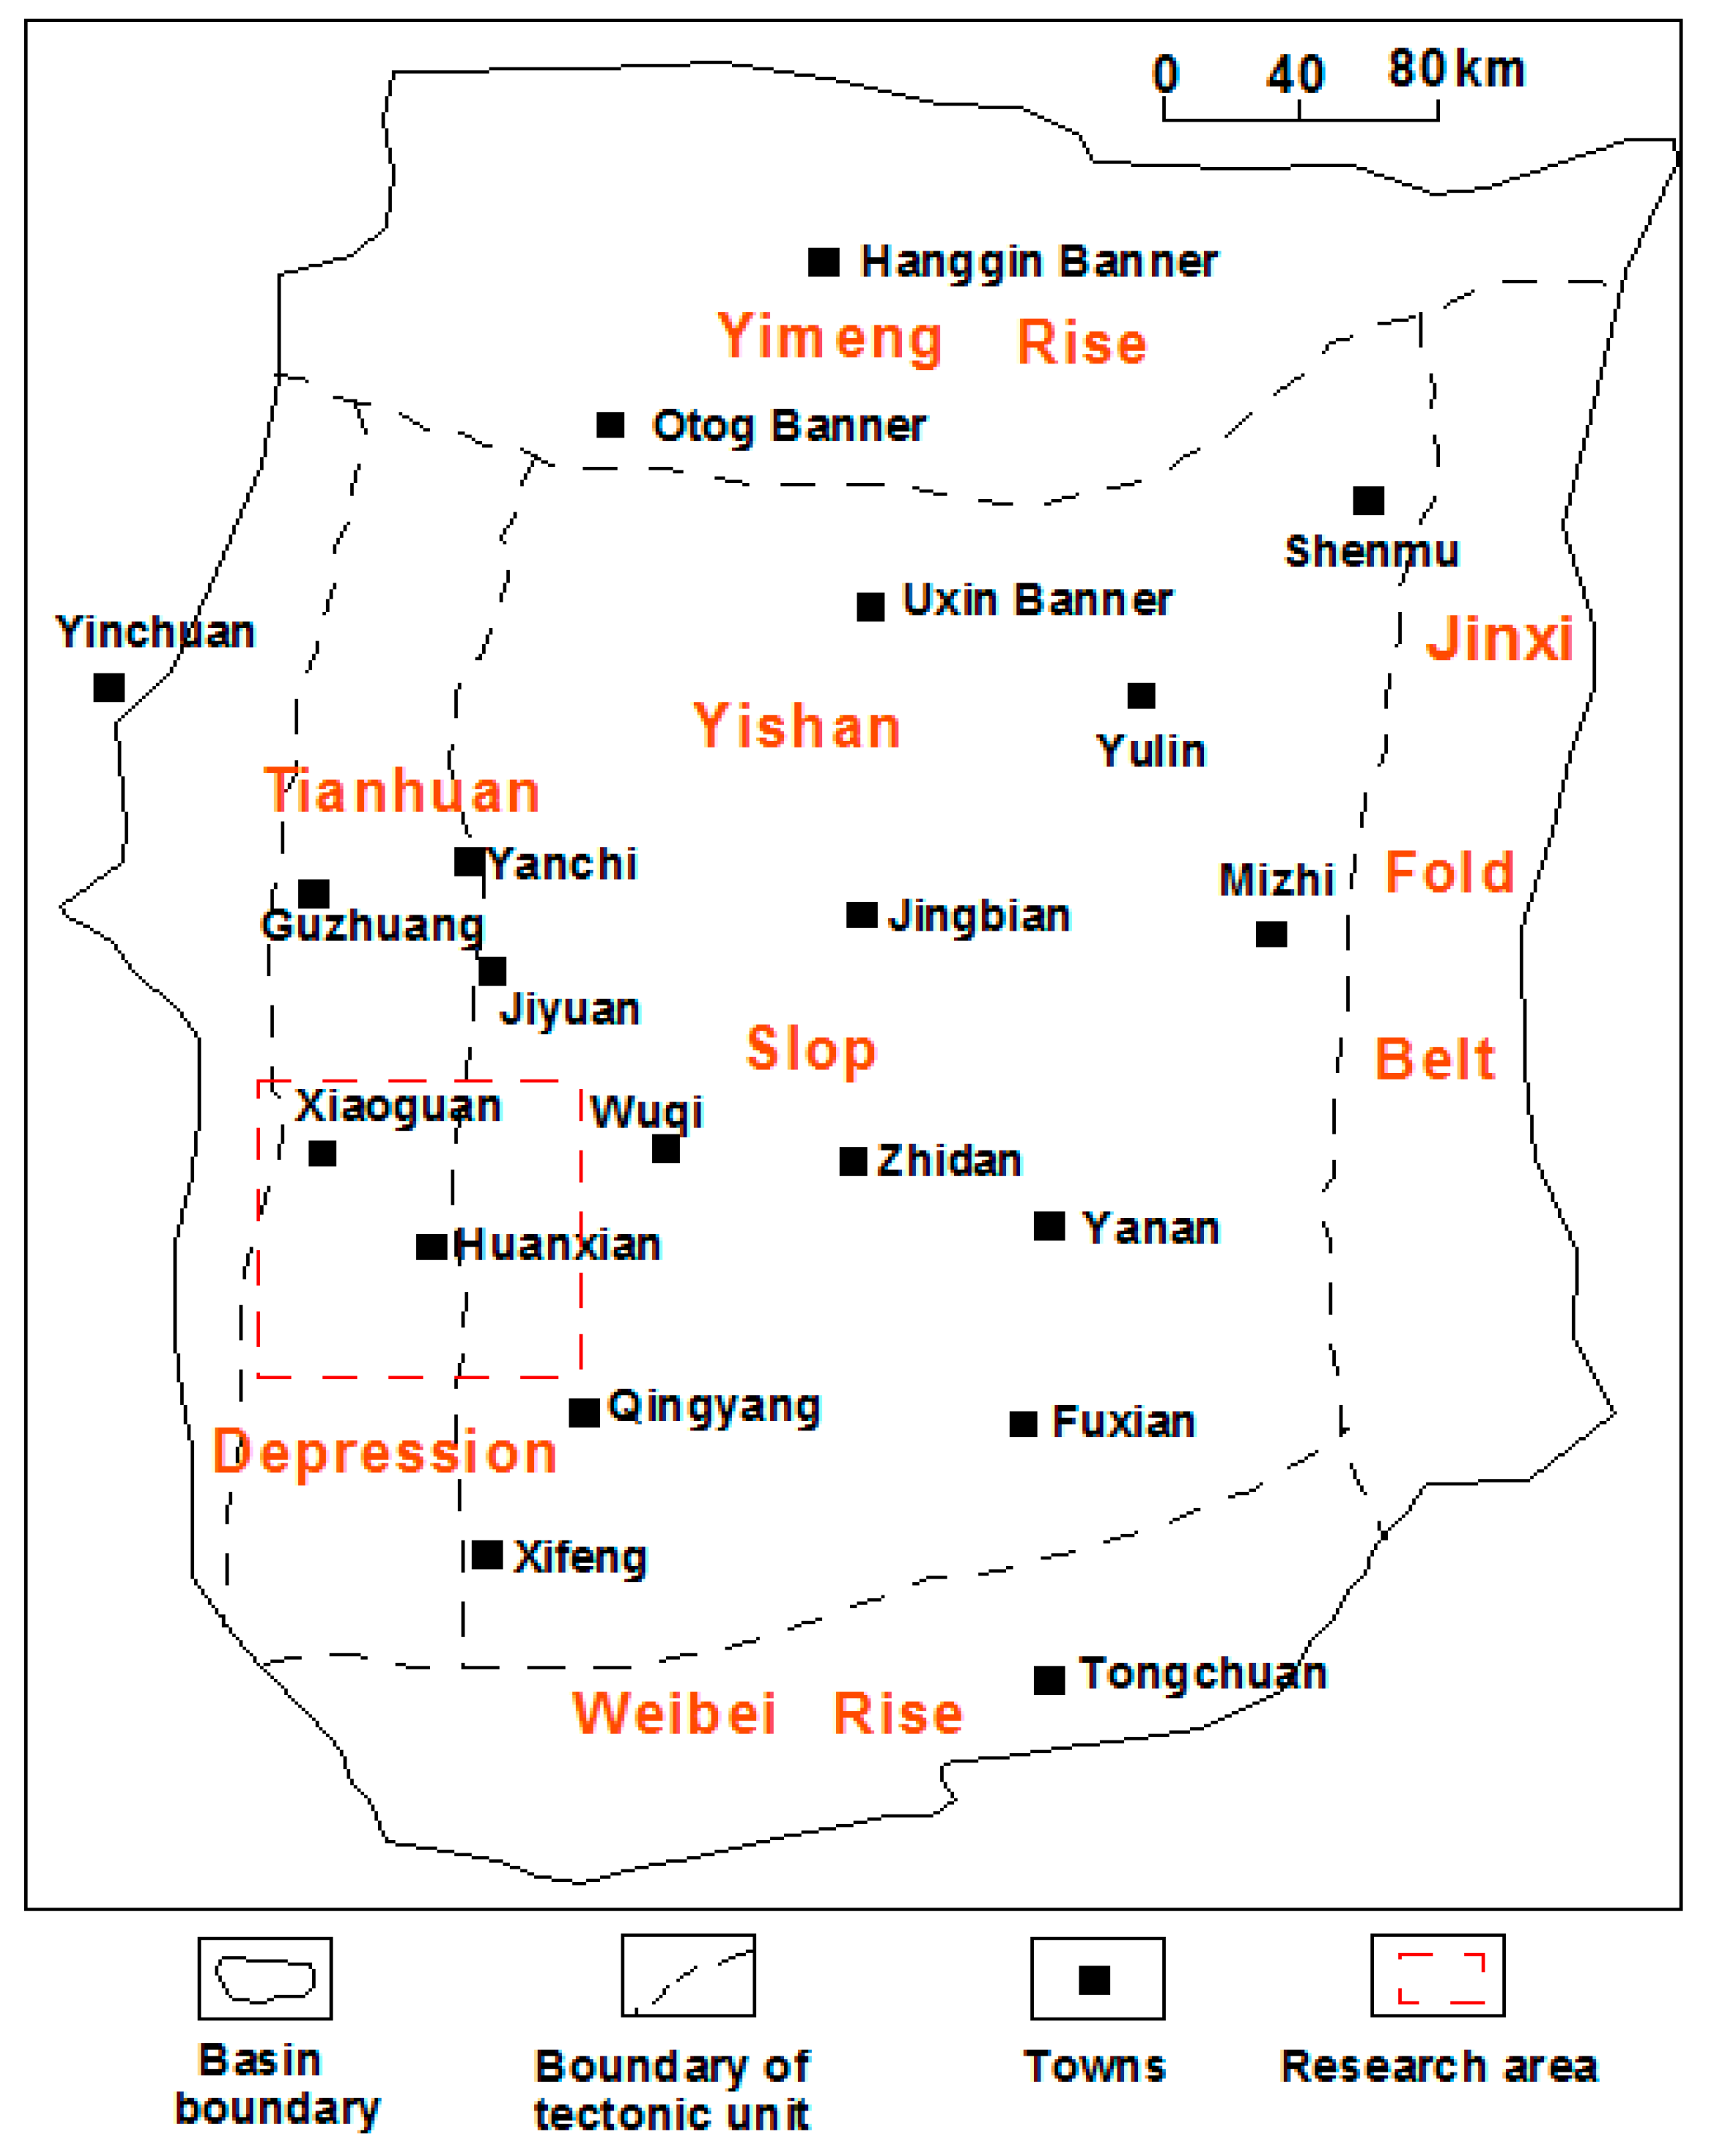
2. Geologic Setting of the Study Area
3. Data and Methods
3.1. NMR Logging
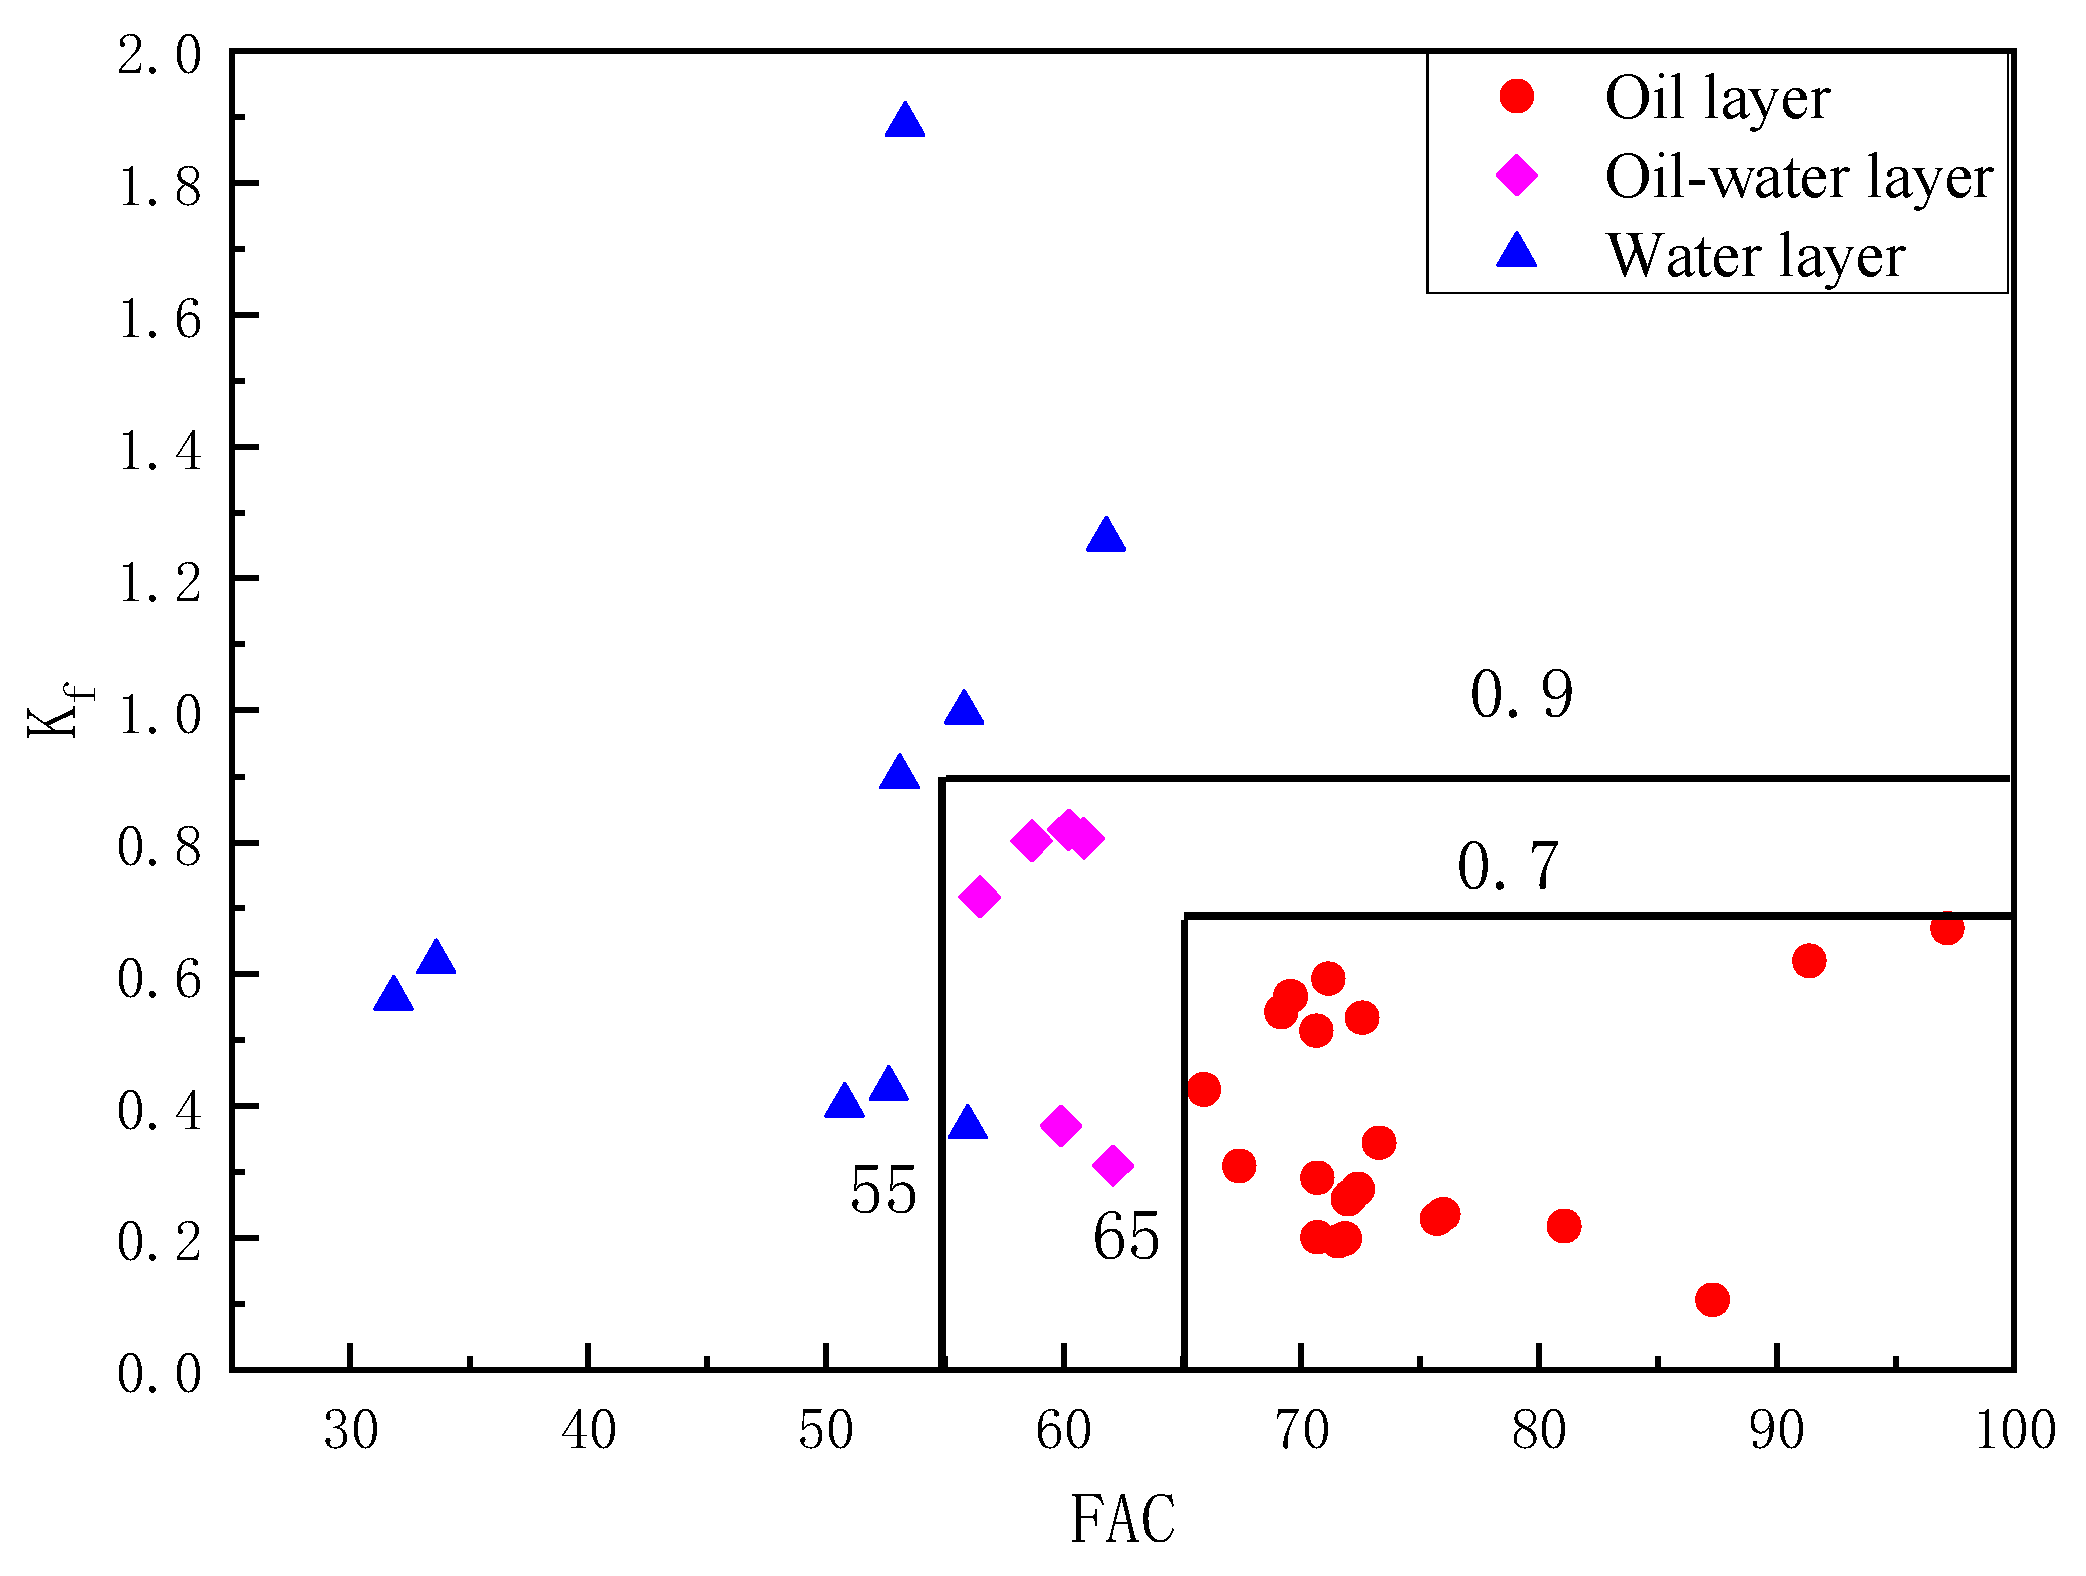
3.2. Array Acoustic Logging
4. Application Results Analysis
5. Discussion
6. Conclusions
Author Contributions
Funding
Data Availability Statement
Conflicts of Interest
References
- Gao, J.X.; Sun, W.J.; Wu, P.; Duan, C. Accumulation characteristics of Upper Paleozoic tight sandstone in Shenfu block, northeastern margin of Ordos Basin. Lithol. Reserv. 2021, 33, 121–130. [Google Scholar]
- Zhou, L.H.; Chen, C.W.; Han, G.M.; Yang, F. Difference characteristics between continental shale and tight oil and exploration practice: A case from Huanghua Depression, Bohai Bay Basin. Earth Sci. 2021, 46, 555–571. [Google Scholar]
- Lu, C.; Li, M.; Guo, J.C.; Zhao, L.; Xu, S.; Chen, B.; Zhou, Y.; Yuan, H.; Tang, Z. Fracture parameters optimization and field application in low-permeability sandstone reservoirs under fracturing flooding conditions. Processes 2023, 11, 285. [Google Scholar] [CrossRef]
- Wen, B.; Zhou, Y. Study on fluid identification of low porosity and low permeability reservoir. Petrochem. Ind. Technol. 2017, 24, 126. [Google Scholar]
- Huang, X.H.; Tang, J.R.; Liu, Q.; Ma, Y. Multi-index fusion logging evaluation system for low porosity and low permeability reservoirs. China Energy Environ. Prot. 2021, 43, 96–102. [Google Scholar]
- Gao, F.M.; Xiao, L.; Zhang, W.; Cui, W.; Zhang, Z.; Yang, E. Low permeability gas-bearing sandstone reservoirs characterization from geophysical well logging data: A case study of Pinghu formation in KQT region, East China Sea. Processes 2023, 11, 1030. [Google Scholar] [CrossRef]
- Chen, J.; Xie, R.C.; Liu, C.C.; Duan, Y.; Li, H.; Xiang, Y. Logging fluid identification and quantitative evaluation of Jurassic tight sandstone gas reservoir in Zhongjiang gas field. Nat. Gas Ind. 2019, 39, 136–141. [Google Scholar]
- Li, C.X.; Liu, M.; Guo, B.C. Classfication of tight sandstone reservoir based on NMR logging. Appl. Geophys. 2019, 16, 549–558. [Google Scholar] [CrossRef]
- Wu, P.; Shang, C.H.; Chen, G.H.; Sun, Z.; Jiang, L. Application of EMI in Tight Sandstone Reservoirs of Linxing-Shenfu Block on the Eastern Margin of Ordos. Well Logging Technol. 2020, 44, 251–255. [Google Scholar]
- Zhang, X.X.; Zhu, L.F.; Wang, T.J.; Shi, X.; Han, B.; Shen, J.; Gao, H. Fluid property identification of the Lower Cretaceous reservoirs with complex oil-water contacts in Deseo Basin, Chad. Energy Geosci. 2023, 5, 100219. [Google Scholar] [CrossRef]
- Zhang, T.; Zhang, X.G.; Lin, C.Y. Evaluation of pore structure in low permeability reservoirs based on common well logs. J. Chengdu Univ. Technol.Sci. Technol. Ed. 2014, 4, 413–421. [Google Scholar]
- Shen, D.; Zhao, J.L. Research and application of logging interpretation method for low resistivity reservoir in Banqiao Oilfield. Petrochem. Ind. Technol. 2020, 27, 150–151. [Google Scholar]
- Mahmoud, L.; Andrea, M.; Branimir, S.; Ruffell, A. Depositional facies controls on the diagenesis and reservoir quality of the Messinian Qawasim and Abu Madi formations, onshore Nile Delta, Egypt. Geol. J. 2019, 54, 1797–1813. [Google Scholar]
- Mahmoud, L.; Andrea, M.; Dustin, E.S.; Branimir, S. Diagenetic signatures in the deltaic and fluvial-estuarine Messinian sandstone reservoirs in the Nile Delta as a tool for high-resolution stratigraphic correlations. Int. J. Sedim. Res. 2023, 38, 754–768. [Google Scholar]
- Zhang, H.T.; Fang, Y.Y.; Li, G.R.; Tan, M.; Wang, X. Nuclear magnetic resonance relaxation mechanism and fluid identification in oil wet tight sandstone reservoirs. Geophys. Prospect. Pet. 2020, 59, 422–429. [Google Scholar]
- Lai, F.Q.; Liu, Y.J.; Kou, X.P.; Huang, Z.; Chen, Z.; Liu, Y.; Jiang, G.; Zang, Y.; Wang, M.; Wang, R. Fluid identification based on NMR apparent free water porosity inversion: A case study of Paleozoic tight sandstone gas reservoirs in Western Ordos. Geofluids 2022, 2022, 2–16. [Google Scholar] [CrossRef]
- Hu, F.L.; Zhou, C.C.; Li, C.L.; Xu, H.J.; Zhou, F.M.; Si, Z.W. Water spectrum method of NMR logging for identifying fluids. Pet. Explor. Dev. 2016, 43, 244–251. [Google Scholar] [CrossRef]
- Zhong, J.B.; Yan, R.H.; Zhang, H.T.; Feng, Y.; Li, N.; Liu, X. A decomposition method of nuclear magnetic resonance T2 spectrum for identifying fluid properties. Pet. Explor. Dev. 2020, 47, 691–702. [Google Scholar] [CrossRef]
- Hamada, N.M.; Al-Blehed, A.S.; Al-Awad, M.N.; Al-Saddique, M.A. Petrophysical evaluation of low-resistivity sandstone reservoir with nuclear magnetic resonance log. J. Pet. Sci. Eng. 2001, 39, 129–138. [Google Scholar] [CrossRef]
- Li, B.; Tan, M.J.; Zhang, H.T. Interpretation method of nuclear magnetic resonance dual-TW logging in oil-wet tight sandstone reservoirs. Appl. Geophys. 2020, 5, 796–808. [Google Scholar] [CrossRef]
- Hu, F.L.; Zhou, C.C.; Li, C.L.; Xu, H.; Zhou, F.; Si, Z. Fluid identification method based on 2D diffusion-relaxation nuclear magnetic resonance (NMR). Pet. Explor. Dev. 2012, 39, 552–558. [Google Scholar] [CrossRef]
- Han, C.; Li, G.; Bie, K.; Yu, D.; Chen, W.; Wu, F. Application of Innovative T1-T2 Fluid Typing Method in Complex Carbonate Reservoir of Fengxi Block. Well Logging Technol. 2021, 1, 56–61. [Google Scholar]
- Wang, T.; Zhang, D.D.; Wang, X.; Wang, Z.; Zhang, W.; Sun, W.; Ma, M. Characterization of Movable Fluid Distribution in Tight Oil Reservoirs by NMR and Centrifugation. Geofluids 2023, 2023, 1668663. [Google Scholar] [CrossRef]
- Shi, W.R.; Wang, X.Z.; Shi, Y.H.; Feng, A.G.; Zou, Y.; Young, S. Application of dipole array acoustic logging in the evaluation of shale gas reservoirs. Energies 2019, 12, 3882. [Google Scholar] [CrossRef]
- Wang, W.W. Research on Gas Zone Identification in Tight Sand Based on the Fluid Substitution Theory. Offshore Oil 2020, 20, 57–60. [Google Scholar]
- Xing, D.H.; Fan, Y.R.; Lu, H.F.; Lu, C.; Zhang, P.; Li, H.; Ding, Y. A combined method for gas-bearing layer identification in a complex sandstone reservoir. Front. Earth Sci. 2022, 10, 942895. [Google Scholar] [CrossRef]
- Zhang, L.H.; Pan, B.Z.; Shan, G.Y. Qualitative Identification of Volcanic Reservoir Fluid Property with the Logging Fluid Factor Method. World Well Logging Technol. 2015, 5, 22–24. [Google Scholar]
- Zhang, P.; Yang, Q.Y.; Fan, Y.R.; Zhang, Y.; Zhang, H. Gas-bearing property evaluation of tight sandstone reservoir based on Xu-White model. Lithol. Reserv. 2020, 32, 138–145. [Google Scholar]
- Li, J.C.; He, X.; Zhao, A.S.; Jiang, C. Joint inversion of formation radial shear-velocity profiles by dipole acoustic logging while drilling. Geophysics 2023, 88, 295–305. [Google Scholar] [CrossRef]
- Wang, C.Y.; Dan, W.D.; Fang, Y.B. The Features and Geological Significance of Shallow Water Delta of Chang 8 Formation in Ordos Basin. J. Oil Gas Technol. 2013, 35, 12–15. [Google Scholar]
- Cui, J.W.; Zhu, R.K.; Luo, Z.; Li, S. Sedimentary and geochemical characteristics of the Triassic Chang 7 member shale in the Southeastern Ordos Basin, Central China. Pet. Sci. 2019, 16, 285–297. [Google Scholar] [CrossRef]
- Mahmoud, E.; Abubakar, I.; Moaz, H.; Amjed, H.; Karem, A.G.; Mahmoud, M.; El-Husseiny, A.; Radwan, A.E. A review on the applications of nuclear magnetic resonance(NMR) in the oil and gas industry: Laboratory and field-scale measurements. J. Pet. Explor. Prod. Technol. 2022, 12, 2747–2784. [Google Scholar]
- Keys, R.G.; Xu, S. An approximation for the Xu-White velocity model. Geophysics 2022, 39, 587–618. [Google Scholar]
- Sun, J.M.; Wei, X.H.; Chen, X.L. Fluid identification in tight sandstone reservoirs based on a new rock physics model. J. Geophys. Eng. 2016, 13, 526–535. [Google Scholar] [CrossRef]
- Gu, Y.J. Application of new logging technology in oil-water reservoir evaluation in Lishuao area. Pet. Geol. Eng. 2014, 28, 44–47. [Google Scholar]


| Num. of Cores | Porosity (%) | Swb (%) | Swf (%) | T2 Cut-Off Value (ms) | Num. of Cores | Porosity (%) | Swb (%) | Swf (%) | T2 Cut-Off Value (ms) |
|---|---|---|---|---|---|---|---|---|---|
| B4-4 | 5.41 | 92.29 | 7.71 | 33 | M159-4 | 8.17 | 68.12 | 31.88 | 4.05 |
| B4-8 | 13.37 | 85.25 | 14.75 | 4.08 | Z488-1 | 7.56 | 74.29 | 25.71 | 2.96 |
| M131-4 | 6.55 | 95.26 | 4.74 | 15.13 | L296-1 | 2.55 | 94.05 | 5.95 | 8.432 |
| M165-3 | 7.08 | 93.05 | 6.95 | 33 | L296-3 | 11.54 | 92.65 | 7.35 | 2.05 |
| M165-7 | 13.91 | 86.48 | 13.52 | 12.34 | C30-3 | 4.19 | 53.39 | 46.61 | 20.21 |
| M165-8 | 14.19 | 85.53 | 14.47 | 6.57 | B20-4 | 5.4 | 66.96 | 33.04 | 4.47 |
| M45-7 | 11.36 | 89.71 | 10.29 | 2.15 | H82-6 | 7.13 | 78.74 | 21.26 | 3.39 |
| H12-2 | 4.84 | 94.04 | 5.96 | 9.61 | Z491-2 | 8.86 | 79.02 | 20.98 | 3.03 |
| H12-3 | 13.89 | 92.52 | 7.48 | 4.07 | Z491-3 | 11.6 | 60.23 | 39.77 | 2.79 |
| H12-6 | 4.82 | 93.09 | 6.91 | 33 | L129-2 | 9.83 | 69.86 | 30.14 | 2.48 |
| M116-2 | 13.16 | 84.03 | 15.97 | 3.85 | H11-1 | 11.99 | 83.43 | 16.57 | 33 |
| M116-5 | 11.15 | 91.86 | 8.14 | 3.2 | L339-3 | 5.87 | 63.7 | 36.3 | 6.64 |
| M116-6 | 10.49 | 81.86 | 18.14 | 17.59 | L339-1 | 14.01 | 64.09 | 35.91 | 11.82 |
| M132-6 | 15.24 | 73.15 | 26.85 | 5.2 | L144-2 | 1.23 | 89.75 | 10.25 | 6.25 |
| M132-7 | 8.19 | 75.7 | 24.3 | 9.27 | L144-3 | 8.59 | 90.31 | 9.69 | 3.68 |
| Z318-2 | 12.5 | 84.46 | 15.54 | 2.7 | L215-1 | 8.1 | 84.32 | 15.68 | 2.18 |
| L253-6 | 5 | 80.11 | 19.89 | 21.31 | Z278-2 | 8.52 | 80.71 | 19.29 | 4.78 |
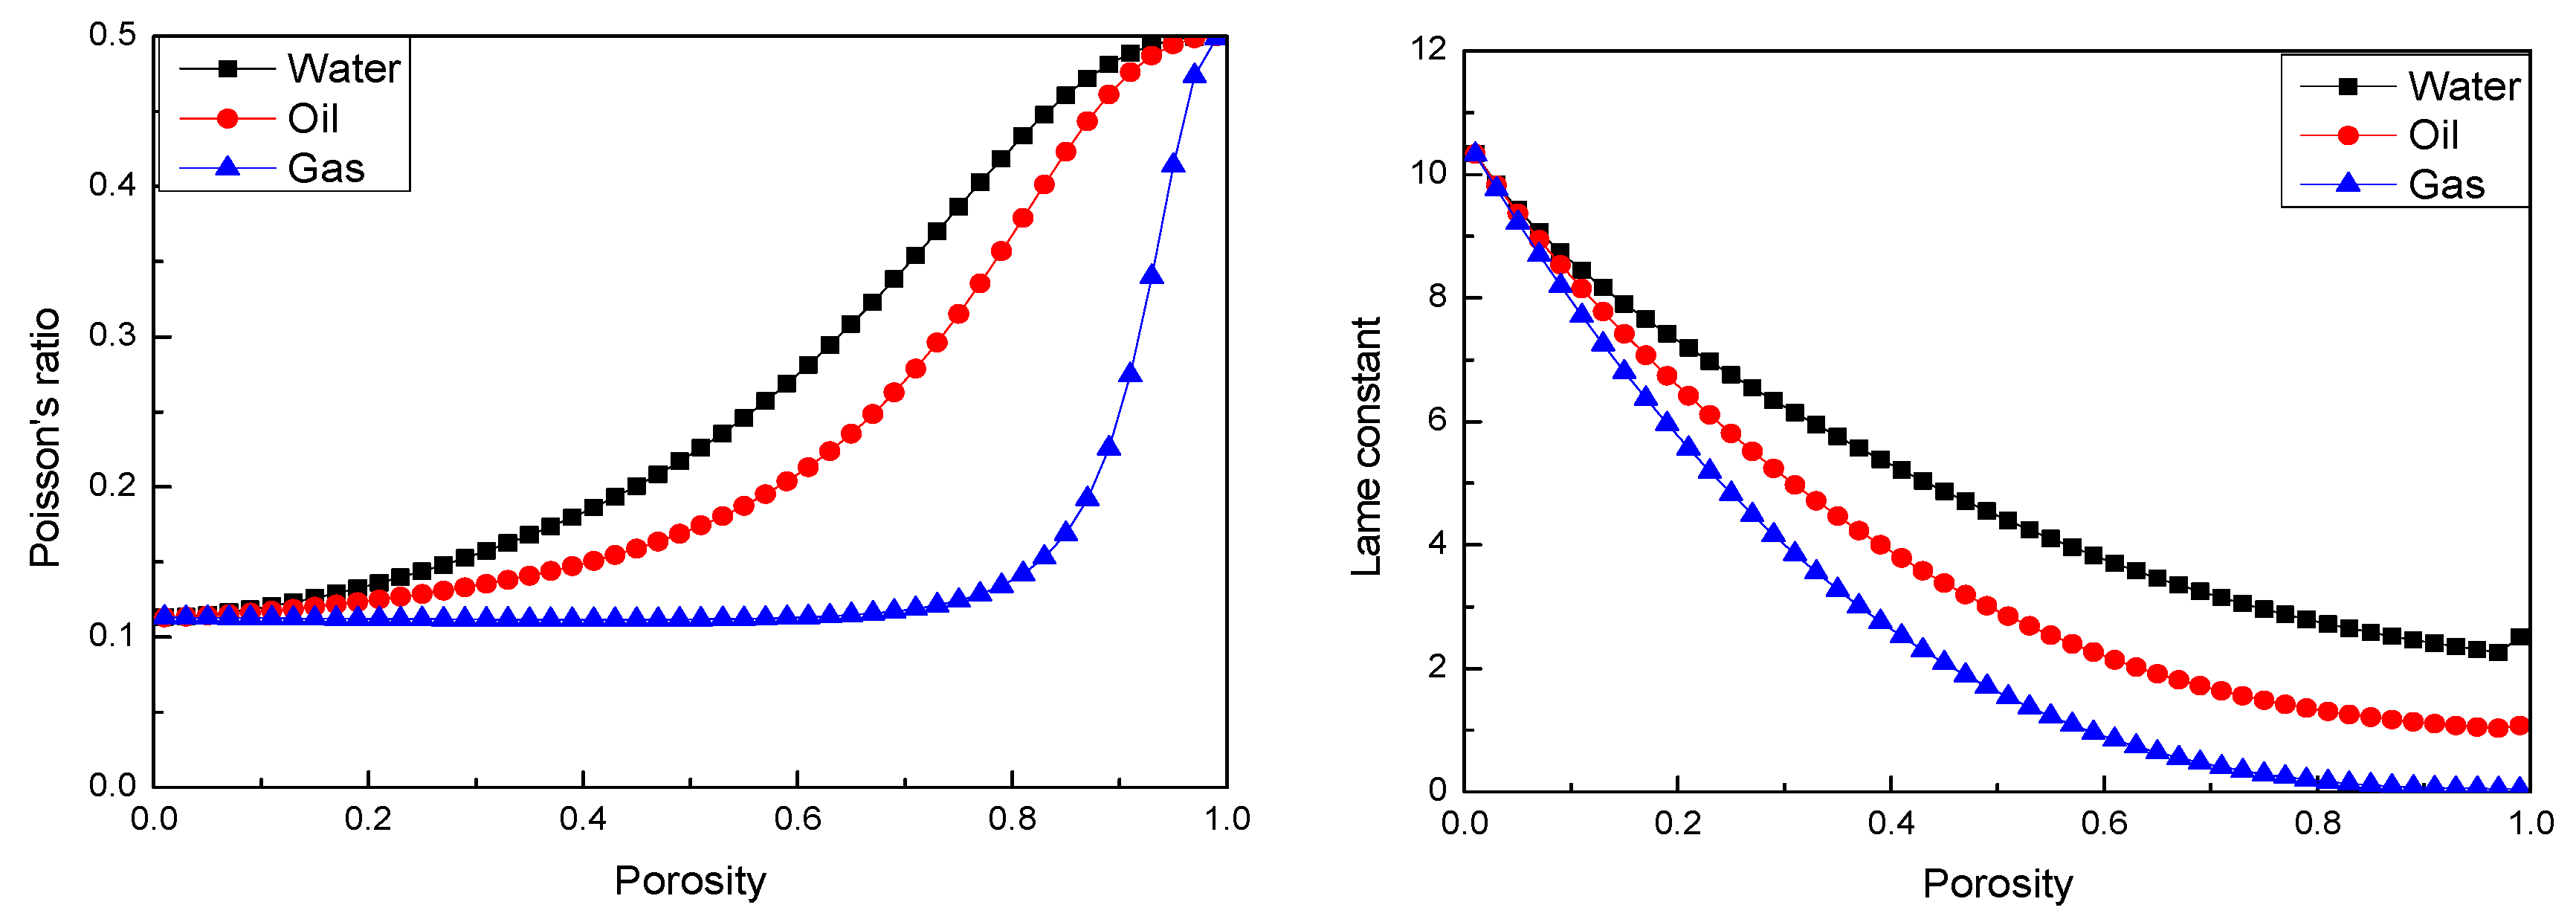
| Rock Components | Bulk Modulus (GPa) | Shear Modulus (GPa) | Pore Aspect Ratio |
|---|---|---|---|
| Shale | 27.3 | 17.6 | 0.013 |
| Sand | 37.0 | 44.0 | 0.14 |
| Salt water | 2.2 | 0 | / |
| Oil | 1.0 | 0 | / |
| Gas | 0.05 | 0 | / |
| Method | Well | Interpretation Interval (m) | Resistivity (Ω·m) | Density (g/cm3) | X-Axis Fluid Identification Factor | Y-Axis Fluid Identification Factor | Interpretation Results | Testing Results | |
|---|---|---|---|---|---|---|---|---|---|
| Oil (t/d) | Water (m3/d) | ||||||||
| Array acoustic logging | L351 | 2531–2534 | 15.34 | 2.41 | 72.098 | 0.274 | Oil | 6.46 | 0 |
| L350 | 2672–2678 | 7.89 | 2.38 | 73.271 | 0.344 | Oil | 31.28 | 0 | |
| L252 | 2360–2368 | 33.67 | 2.39 | 77.770 | 0.309 | Oil | 15.3 | 0 | |
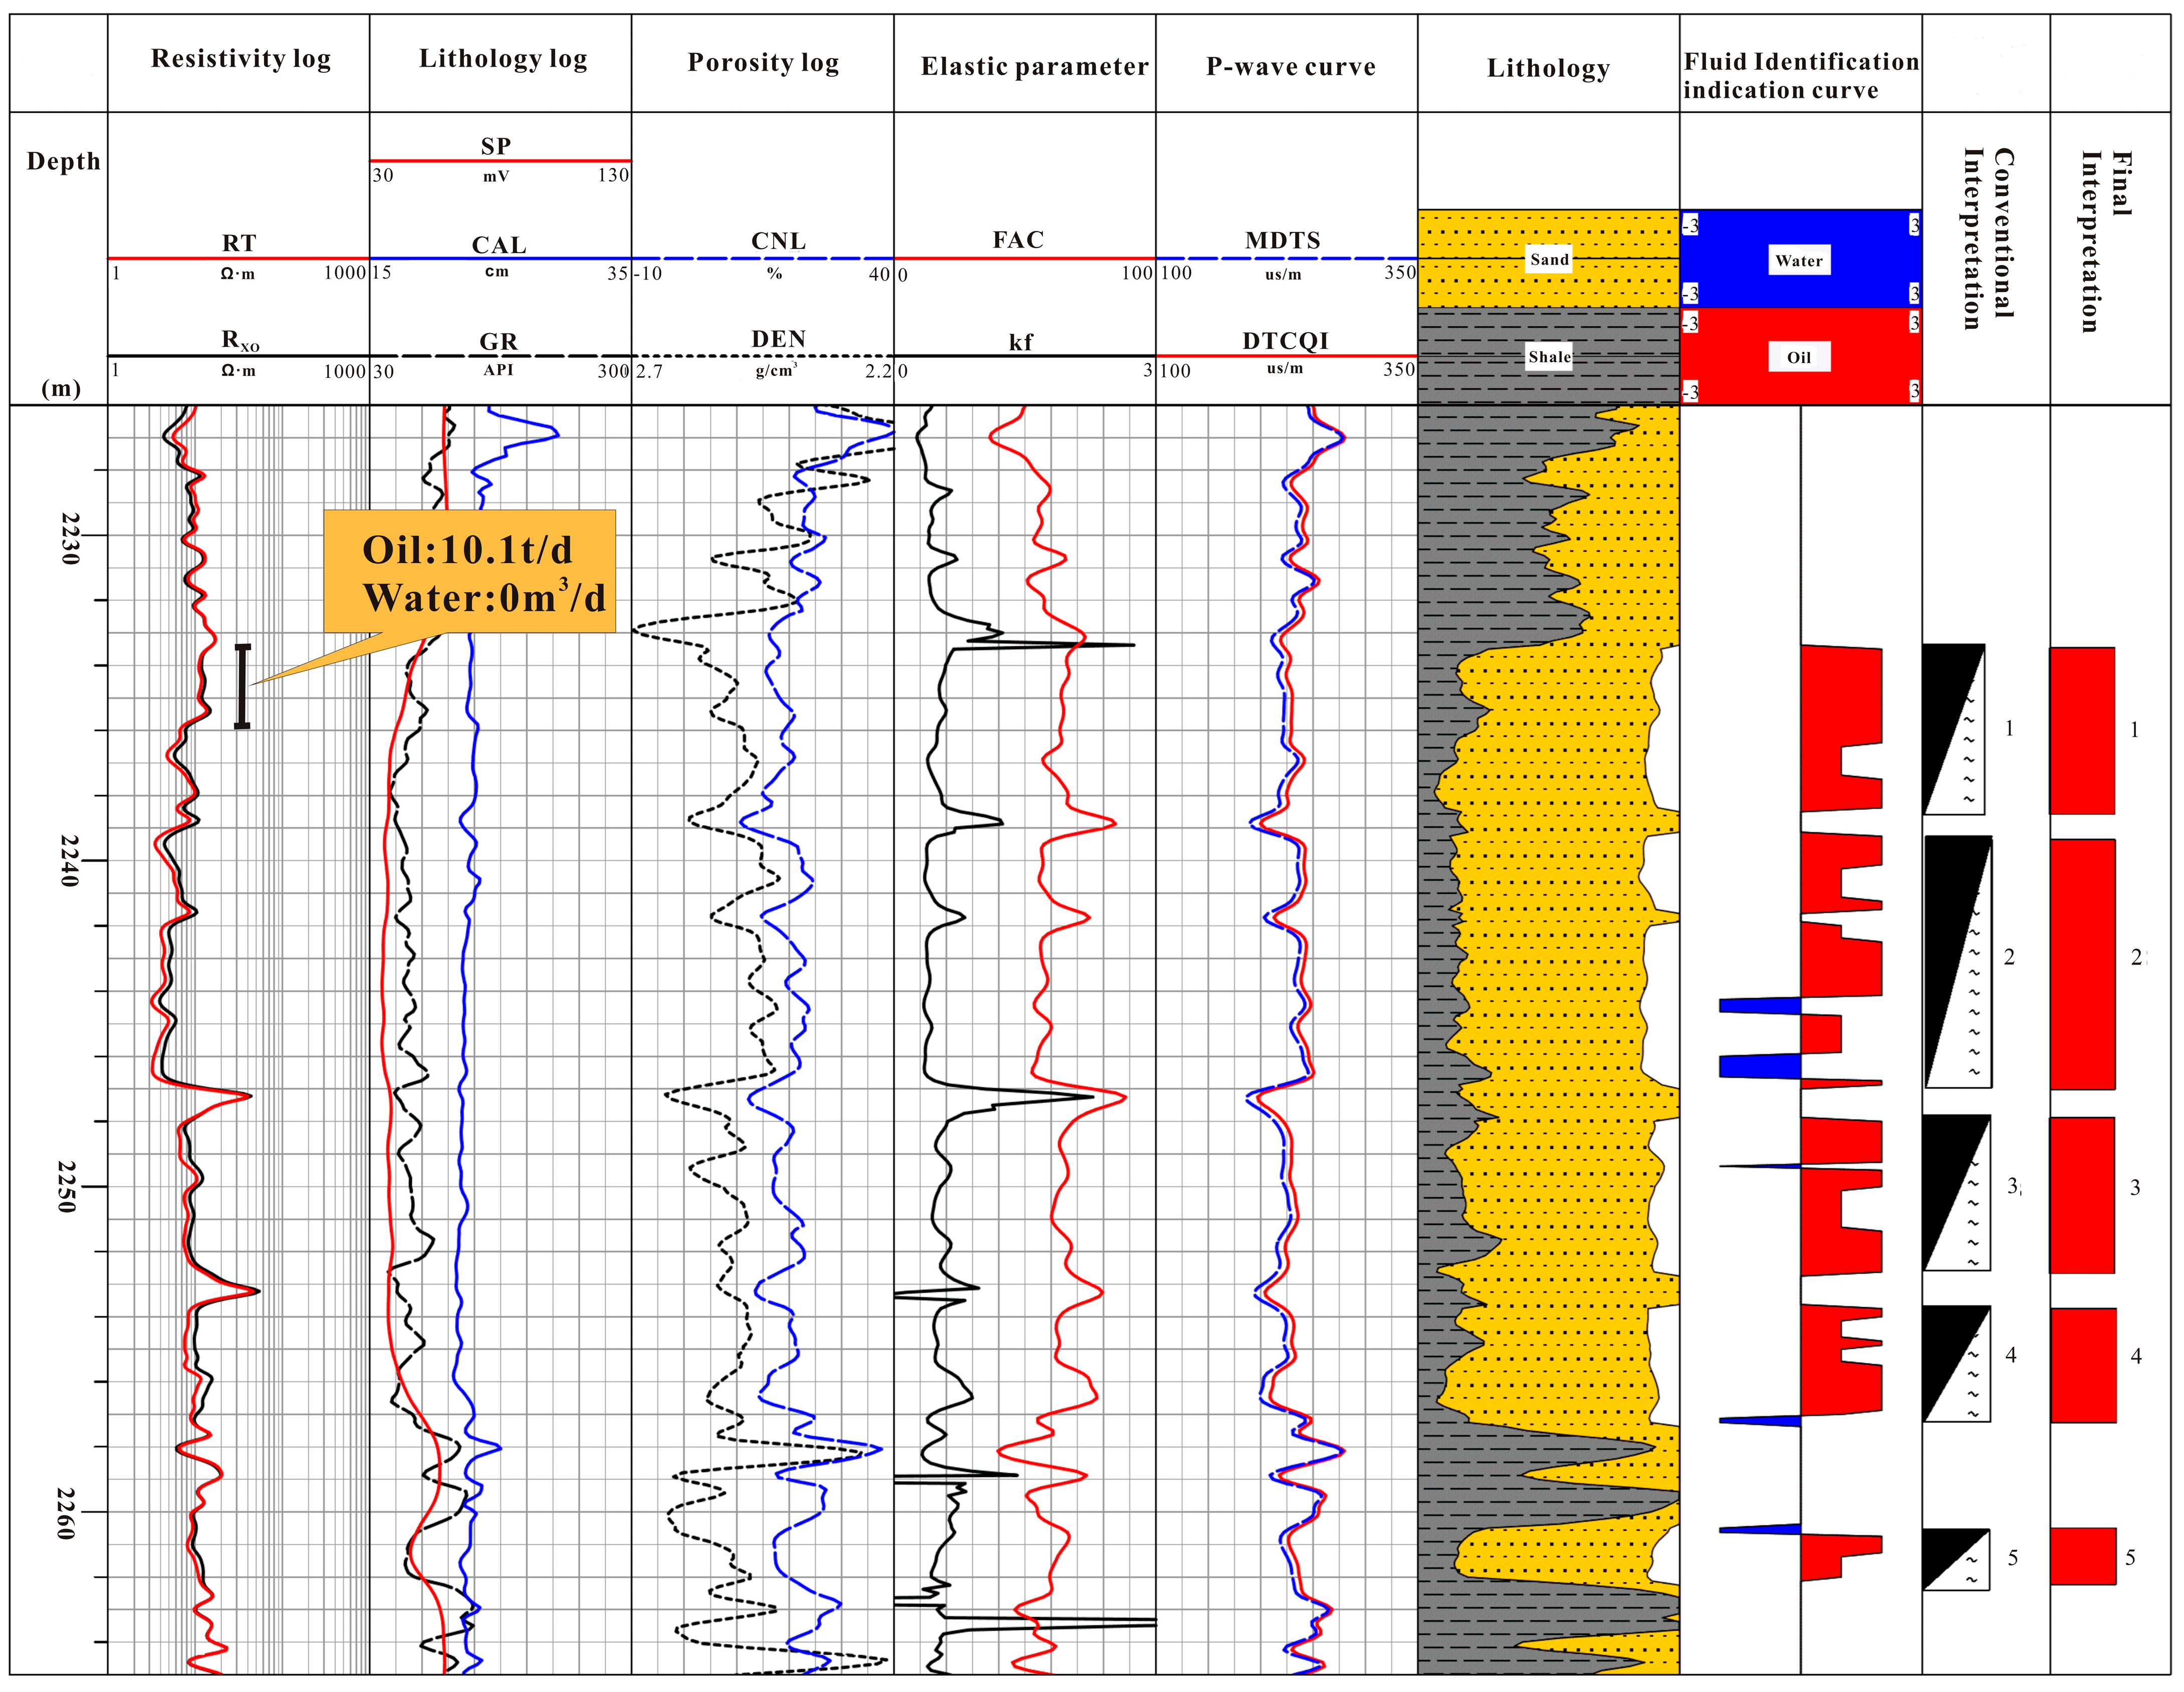
| L184 | 2233–2238 | 10.98 | 2.42 | 68.796 | 0.581 | Oil | 10.1 | 0 | |
| M87 | 2652–2659 | 17.62 | 2.40 | 59.876 | 0.371 | Oil–water | 4.42 | 13.1 | |
| M132 | 2647–2655 | 15.54 | 2.49 | 56.564 | 0.717 | Oil–water | 0 | 19.7 | |
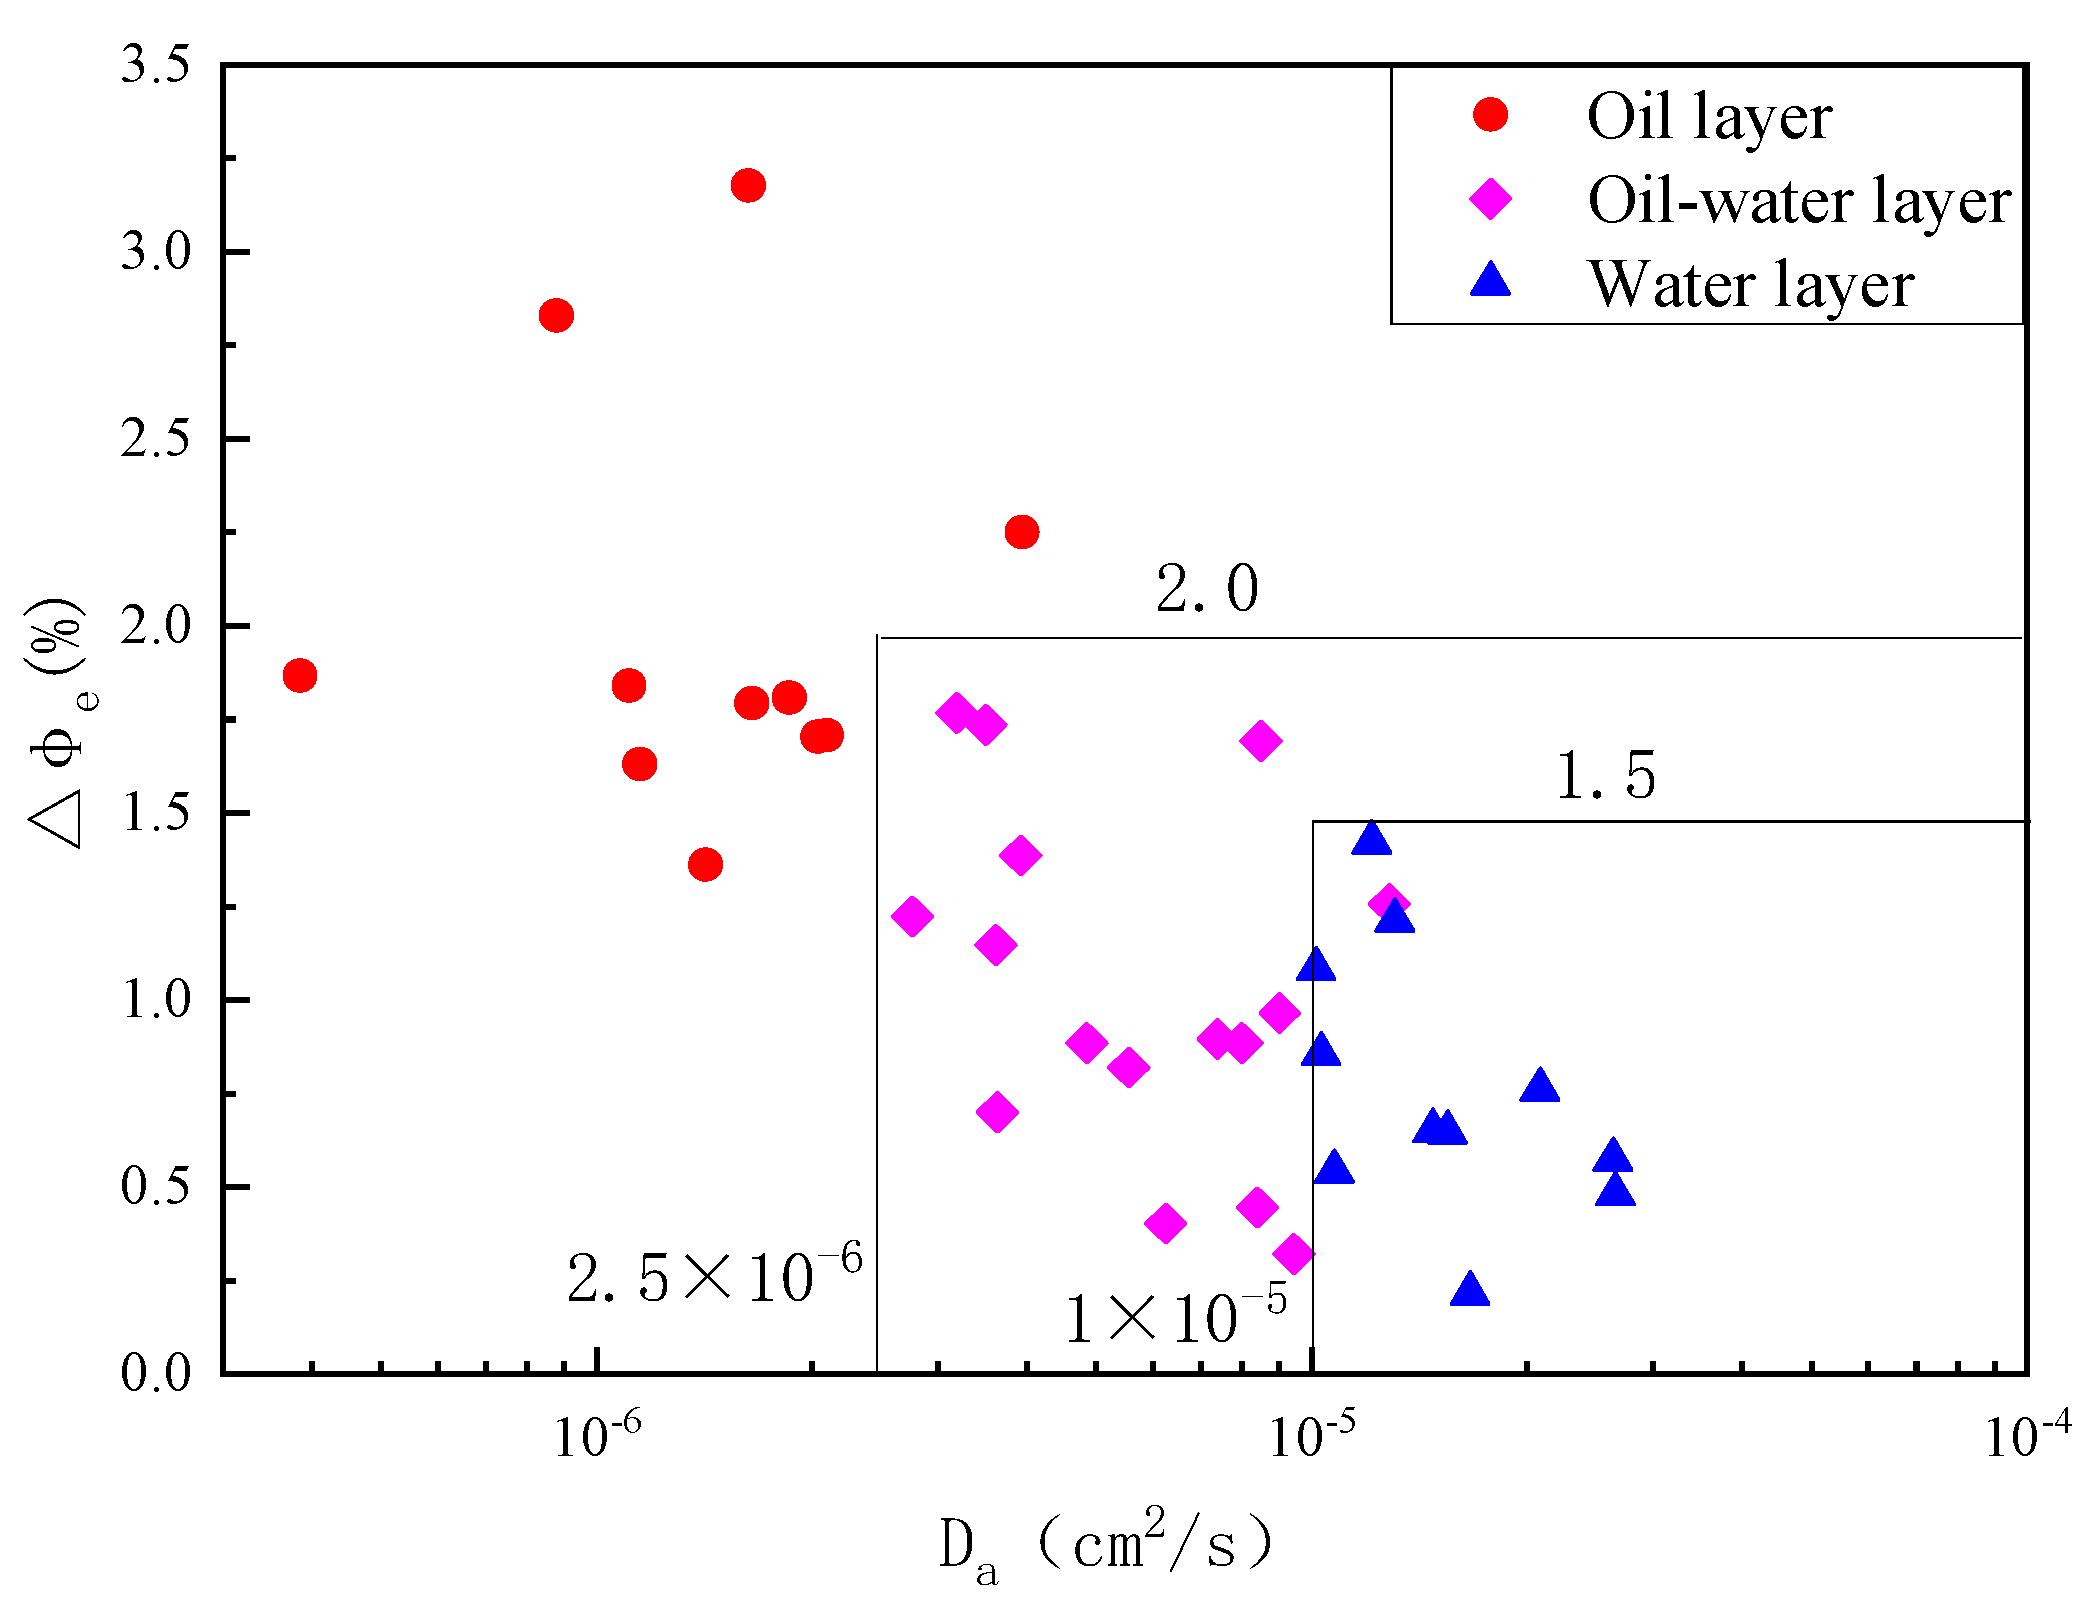
| NMR logging | L89 | 1967–1971 | 11.08 | 2.43 | 1.11 × 10⁻⁶ | 1.839 | Oil | 21.25 | 0 |
| B236 | 2582–2591 | 21.16 | 2.45 | 2.04 × 10⁻⁶ | 1.701 | Oil | 9.35 | 7.8 | |
| Y111 | 2688–2694 | 14.96 | 2.48 | 1.28 × 10⁻⁵ | 0.694 | Water | 0 | 6.9 | |
| L100 | 2503–2506 | 17.59 | 2.49 | 1.31 × 10⁻⁵ | 1.452 | Water | 0 | 12.5 | |
| B286 | 2679–2690 | 7.25 | 2.44 | 2.66 × 10⁻⁵ | 0.472 | Water | 0 | 9.8 | |
Disclaimer/Publisher’s Note: The statements, opinions and data contained in all publications are solely those of the individual author(s) and contributor(s) and not of MDPI and/or the editor(s). MDPI and/or the editor(s) disclaim responsibility for any injury to people or property resulting from any ideas, methods, instructions or products referred to in the content. |
© 2023 by the authors. Licensee MDPI, Basel, Switzerland. This article is an open access article distributed under the terms and conditions of the Creative Commons Attribution (CC BY) license (https://creativecommons.org/licenses/by/4.0/).
Share and Cite
Bai, Z.; Tan, M.; Li, B.; Shi, Y.; Zhang, H.; Li, G. Fluid Identification Method of Nuclear Magnetic Resonance and Array Acoustic Logging for Complex Oil and Water Layers in Tight Sandstone Reservoir. Processes 2023, 11, 3051. https://doi.org/10.3390/pr11113051
Bai Z, Tan M, Li B, Shi Y, Zhang H, Li G. Fluid Identification Method of Nuclear Magnetic Resonance and Array Acoustic Logging for Complex Oil and Water Layers in Tight Sandstone Reservoir. Processes. 2023; 11(11):3051. https://doi.org/10.3390/pr11113051
Chicago/Turabian StyleBai, Ze, Maojin Tan, Bo Li, Yujiang Shi, Haitao Zhang, and Gaoren Li. 2023. "Fluid Identification Method of Nuclear Magnetic Resonance and Array Acoustic Logging for Complex Oil and Water Layers in Tight Sandstone Reservoir" Processes 11, no. 11: 3051. https://doi.org/10.3390/pr11113051
APA StyleBai, Z., Tan, M., Li, B., Shi, Y., Zhang, H., & Li, G. (2023). Fluid Identification Method of Nuclear Magnetic Resonance and Array Acoustic Logging for Complex Oil and Water Layers in Tight Sandstone Reservoir. Processes, 11(11), 3051. https://doi.org/10.3390/pr11113051