Article

Effect of Tip Clearance on the Cavitation Performance of High-Speed Pump-Jet Propeller

1
Xi’an Precision Machinery Research Institute, Xi’an 710075, China
2
National Pump and System Engineering Technology Research Center, Jiangsu University, Zhenjiang 212013, China
*
Author to whom correspondence should be addressed.
Processes 2023, 11(11), 3050; https://doi.org/10.3390/pr11113050
Submission received: 26 September 2023 / Revised: 16 October 2023 / Accepted: 23 October 2023 / Published: 24 October 2023

Abstract

:
To investigate the impact of tip clearance variation on the cavitation performance of a high-speed pump-jet propeller, Fluent software was employed for simulation calculations. The study utilized the RNG k-ε turbulence model and ZGB cavitation, conducting three-dimensional numerical simulations under both steady and transient conditions. A pump-jet propeller with a rated speed of 20,000 r/min was used to set three kinds of clearance for simulation, and the simulation proved to be reliable by comparison with the experiment. Initially, the analysis examined the effect of tip clearance on cavitation characteristics and cavitation volume under steady-state conditions, while also studying the distribution patterns of cavitation. Subsequently, the radial force and pressure pulsation of the jet propeller are analyzed by FFT processing, aiming at the influence of tip clearance on the structural strength of the pump-jet propeller. Under the design conditions, the smaller tip clearance shows better performance, while the larger tip clearance shows stronger anti-cavitation ability than the smaller clearance. In addition, the greater the tip clearance, the greater the radial force and pressure pulsation, which will adversely affect the pump-jet structure. The research results provide some references for further research on the effect of high-speed pump-jet propeller structures on performance.

1. Introduction

The pump-jet propeller is composed of three main components: the rotor system, stator system, and conduit structure. It offers several advantages, including low noise, excellent acoustic concealment, high propulsion efficiency, and a high preset speed, making it the preferred choice for high-speed underwater vehicles. However, cavitation inevitably occurs and impacts the performance of pump-jet propulsion as the working conditions change. Specifically, the flow of the medium the rotor blade tip, and the inner wall of the conduit results in a gap flow, which significantly influences cavitation. Therefore, it is essential to investigate the tip clearance on the performance of pump-jet propulsion and its ability to reduce cavitation.
The main structure of a pump-jet propeller has two kinds of axial flow pump and mixed flow pump. These two types of flow-type pump-jet propellers generally use the same design optimization method, and basically the same design optimization process as the pump. So, some references can be received from the pump research article. In 1963, McCormick [1] conducted a study on the design of pump-jet propellers and introduced an experimental concept to investigate their cavitation performance. Suryanarayana [2] developed a cavitation apparatus and simulation calculation method for pump-jet propellers. Their research indicated that at high advance ratios, cavitation starts to occur on the tip side of the rotor, and as the rotational speed increases, cavitation shifts to the suction side. Stefano Gaggero [3] also analyzed the pros and cons associated with the front-to-back placement of the vanes based on their design.
With the advancement of computer technology, the use of computational fluid dynamics (CFD) has become increasingly popular, leading to significant progress in simulating rotary machinery similar to pump-jet propellers. Das [4] proposed a design method for pump-jet pro based on rotating machinery design principles used in pumps. They also validated the capability of CFD analysis for pump-jet propellers. Motallebi-Nejad [5] and colleagues employed a research approach for pumps that presented numerical calculations for thrust, torque, and hydrodynamic efficiency under different propulsion coefficients. They also analyzed and discussed the velocity and pressure distribution on the propulsive pump blade. Peng [6] demonstrated that increasing the inflow angle at the guide vane enhances propulsion efficiency. Zhu [7] discovered a close relationship between the reduction of cavitation performance of propeller blades and cavitation around the propeller. Ji [8] and colleagues employed the CFD method and observed periodic cavitation development processes, cavitation generation, growth, and shrinkage near the tip of the propeller blade. They also noted significant pressure fluctuations near the blade’s edge during operation.
Through the above research, it is found that the flow near the tip of the blade has a great influence on the rotating machinery. Zhang [9] et al. used PIV equipment to conduct experiments on the medium flow state during the operation of pump-jet propellers. It is concluded that the backflow at the tip of the blade is mainly concentrated at the front edge of the flange, and the influence of blade load and operating conditions on the vortex structure is related to the distribution of internal static pressure, turbulent kinetic energy, and vortex. Xi [10] also confirmed this result in the article and indicated that the pressure change at the blade tip gap is also related to cavitation here. Xi [11] subsequently clarified that the generation of tip leakage vortex dominates the energy loss in the PJP rotor domain and wake flow field. However, Li [12] adds that tip clearance leakage flow has little influence on pipeline outlets.
Since then, significant research has been conducted on the study of tip clearance in low-speed pump-jet propellers. Donyavizadeh [13] observed that, under the same propulsion coefficient, increasing the tip clearance resulted in a decrease in thrust coefficient and torque coefficient by approximately 10% and 8%, respectively. Jiang [14] also that smaller tip clearances led to better hydrodynamic performance in ducted propellers. Lu [15,16,17] and others focused on the fluid flow at the tip clearance and discovered that the clearance flow had a significant impact on the mainstream. They also noted that the increase in clearance flow directly affected blade performance. Qin [18] numerically simulated the flow in pump-jet propellers with different tip clearances and found that as the tip clearance increased, the open water efficiency decreased gradually. This decrease in efficiency was mainly attributed to the loss of tip flow. Li [19] conducted an in-depth study on the hydrodynamic characteristics of non-cavitating and cavitating pump-jet propellers with a tip clearance of 1 mm. They found that cavitation caused the expansion of the tip leakage vortex in a circumferential direction, which reduced the strength of the tip separation vortex in the entire tip clearance region the tip leakage vortex strength in the cavitation region, and it enhanced the tip leakage vortex strength in the downstream non-cavitating region. Under oblique flow conditions, Qiu [20] observed that the bubble fraction decreased with the increase of tip clearance, while the axial velocity increased. Ahn [21] designed a ring at the tip clearance to reduce cavitation caused by the flow. Experiments and simulations showed the addition of the tip ring helped reduce the intensity of the tip vortex, which helped inhibit the formation of water vapor. Moreover, the addition of the ring resulted in a reduction in the cavitation performance of the working of the moving blade due to the decrease in axial velocity caused by the reduction in channel area. However, the addition of the ring also reduced the blade load of the pump-jet while maintaining efficiency.
Nonetheless, there is still a limited amount of research focusing on the impact of tip clearance size variations on the cavitation performance of pump-jet propellers operating at high rotational speeds. Hence, it is vital to conduct design research on the tip clearance of pump-jet propellers at high rotational speeds and address the issue of selecting an appropriate tip clearance value. These considerations are crucial for enhancing hydrodynamic performance and minimizing the adverse effects of cavitation. Therefore, the CFD simulation of a high-speed pump-jet propeller is carried out in this paper, and the influence of tip clearance on cavitation is emphatically studied. On the basis of cavitation, the radial force is analyzed, and the pressure pulsation data is processed and analyzed by the FFT technique.

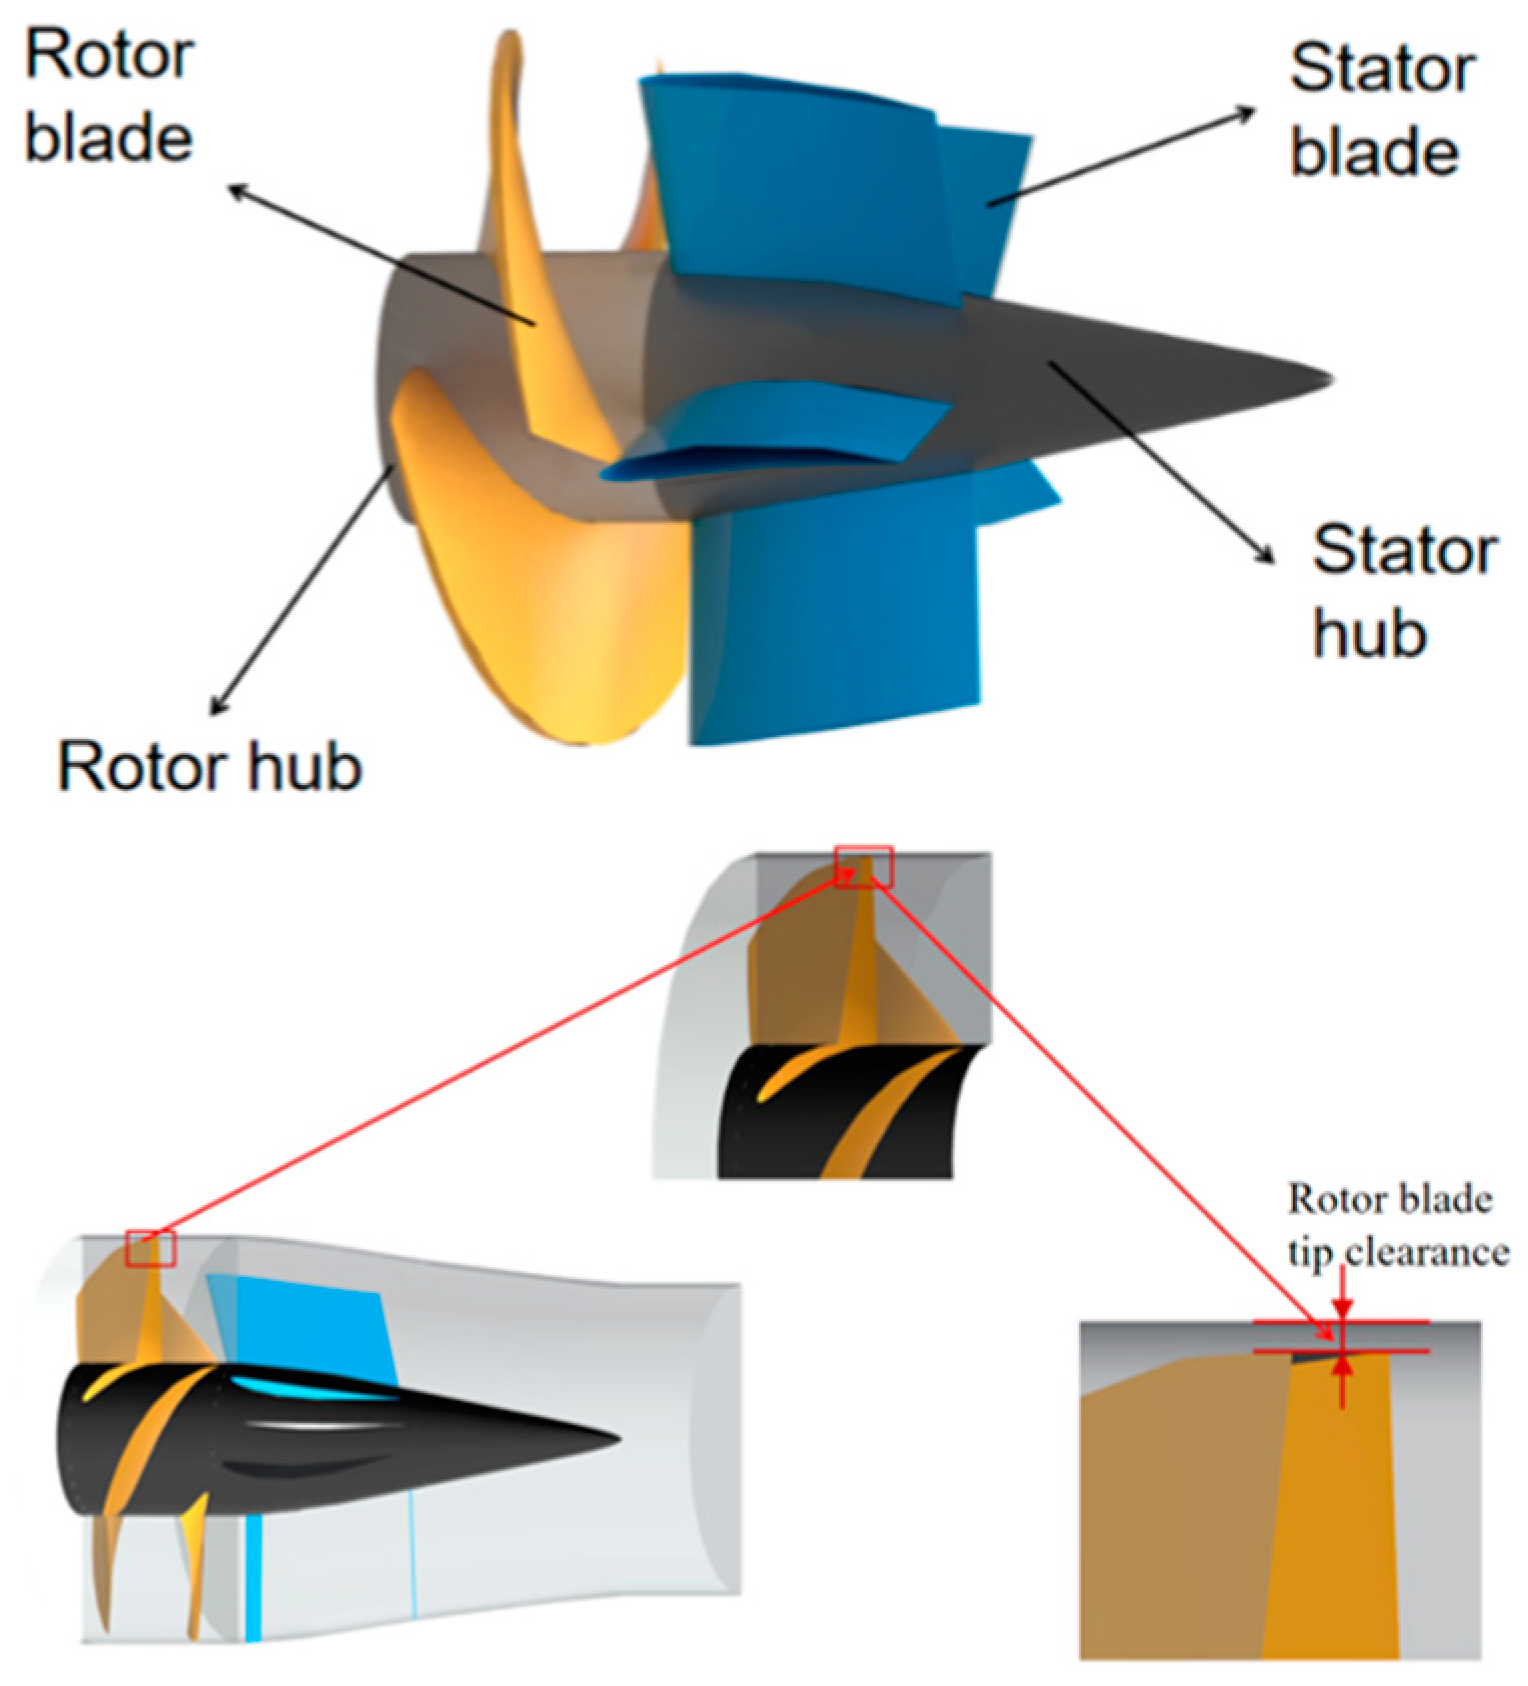
2. Research Principle and Physical Model of Pump-Jet Propulsion

This study focuses on a specific pump-jet propeller operating at a rated speed of n = 20,000 r/min. The propeller is divided into four sections: the inlet pipe section, rotor, stator, and outlet pipe. Part of the design data are shown in Table 1. Figure 1 illustrates the internal geometric of the pump-jet propeller.
The change of tip clearance will have a great influence on the head and efficiency of ordinary pumps, and the propulsive pump needs better efficiency to ensure thrust. Therefore, after determining the main size and airfoil profile of the propulsion pump, it is necessary to study the influence of tip clearance. In order to modify the tip clearance, modeling software UG NX2212 was employed to cut the physical prototype of the pump. This process involved extending the gap length towards the axis at the blade’s edge, creating a hollow cylinder. Subsequently, the blades were cut, and the hollow cylinder was removed, resulting in the modified blades. Fillet treatment was then applied to the edges of the blades to achieve the model.
Based on engineering experience, the typical tip of the impeller is around 1% of the impeller’s outer diameter, with a minimum of 0.1 mm. For the specific test pump in this study, the actual tip size is determined to be 0.2 mm. In this research, the tip clearance was chosen to be 5% of the rotor’s outer diameter, corresponding to a clearance of 0.8 mm. Additionally, an intermediate value of 0.5 mm was selected between the 0.2 mm and 0.8 mm clearances. The blade shape remained unaltered, resulting in models with clearances of 0.2 mm, 0.5 mm, and 0.8 mm at the edges of the three rotor blades. The configuration of the rotor’s tip clearance is illustrated in Figure 2.

3. Numerical Simulation

In this paper, it is assumed that the multiphase fluid caused by cavitation in the process of cavitation flow is uniformly distributed in the flow field. Therefore, the homogeneous flow model is adopted for the homogeneously distributed multiphase fluid in the flow field, and there is no velocity slip between the homogeneously distributed multiphase fluids.
The continuity equations are:
ρ t + ρ u i x i = 0
The momentum equation is:
( ρ u ) t + d i v ( ρ u u ) = p x + τ x x x + τ y x y + τ z x z + F x
( ρ v ) t + d i v ( ρ v u ) = p y + τ x y x + τ y y y + τ z y z + F y
( ρ ω ) t + d i v ( ρ ω u ) = p z + τ x z x + τ y z y + τ z z z + F z
The energy equation is:
( ρ T ) t + T ρ u j x j = λ C p T 2 x i x j + S T
where u, v, and ω are velocity, unit m/s; λ is the heat transfer coefficient; ST is the source term, which is related to the dissipation of turbulence. T is the temperature. Fx, Fy, and Fz are forces on the element, Pa.

3.1. Turbulence Model

The calculation is based on the standard RNG k-ε turbulence model, which is a high Reynolds number model, and RNG theory provides an analytical formula to consider the viscosity of flow at low Reynolds number. The RNG k-ε turbulence model has further modified the turbulent viscosity and added the mean strain rate term to the ε equation, so that the RNG k-ε turbulence model can better deal with the flow patterns with large channel changes and more curvature, and has higher calculation accuracy [22]. The effect of these formulas depends on the correct treatment of the near-wall region. RNG k-ε turbulence model. The turbulence model is as follows:
( ρ k ) t + ( ρ k u i ) x i = x j α k μ e f f k x j + G k + ρ ε
( ρ ε ) t + ( ρ ε u i ) x i = x j α ε μ e f f ε x j + C 1 ε k G k + C 2 ε ρ ε 2 k
μ e f f = μ l + μ ;   μ l = ρ C μ k 2 ε , C μ = 0.0845 ,   α k = α ε = 1.39
C 1 ε = C 1 ε η 1 η η 0 1 + β η 3 , C 1 ε = 1.42 , C 2 ε = 1.68
η = ( 2 E i j · E j i ) 1 2 k ε ;   E i j = 1 2 u i x j + u j x i , η 0 = 4.377 , β = 0.012
In the formula, u is the absolute velocity in the direction of x; μ is the viscosity coefficient of fluid. δij is the Kronecker function.

3.2. Cavitation Model

For the cavitation numerical model, the ZGB (Zwart-Gerbera-Belamri) cavitation model based on the transport equation is adopted [23]. The model is derived based on the Rayleigh bubble transport equation, and its governing equation is shown in the equation below:
( ρ V α V ) t + ( ρ V α V u i ) x i = m + + m
In the formula, subscript V represents water vapor, density is 0.02558 kg/m3, m+ is the source term, and m is the sink term,u is the absolute velocity:
m + = F vap 3 α nuc ( 1 α V ) ρ V R B 2 ( p p V ) 3 ρ l ,   p < p V
m = F cond 3 α V ρ V R B 2 ( p p V ) 3 ρ l ,   p > p V
where αnuc is the volume fraction of gas nuclei in water, αnuc = 5 × 10⁻⁴; RB is the bubble radius; Fvap and Fcond are the evaporation coefficient and condensation coefficient, Fvap = 50 and Fcond = 0.01, respectively. The pv is the saturated vapor pressure at 25 °C, and 3169 Pa is taken; ρ is the fluid density, ρ = 1030 kg/m3.

3.3. Computing Domains and Grids

In order to accurately investigate the influence of tip clearance on the overall flow field, this study utilizes the simulation method for the entire flow channel. The computational domain of the pump includes the inlet region, rotor region, stator region, and three-stage outlet region. To ensure more precise simulations, a structured grid is employed. During the pre-simulation process, simulations of the head were performed using five different mesh sizes at a consistent flow. The results of these simulations are presented in Table 2. Based on the findings, it is determined that the total number of grids required for the pump-jet propeller under various clearances is approximately 12 million.
The inlet boundary of the computing domain is set as the pressure inlet, the outlet boundary is set as the mass flow outlet, and 5 interfaces are set at 6 structural interfaces. The rotor water is set to the rotation domain. Part of the rotor blade and the hub wall are arranged as the rotating wall. The convergence accuracy is set to 1 × 10⁻⁵. When the transient convergence curve presents stable periodic fluctuations, it can also be considered to be useful. Considering the effect of seawater and gravity on the efficiency and head of pump-jet propeller, the negative gravity acceleration of the Y-axis, seawater density, viscosity, and other parameters were set to obtain more realistic simulation results. The density of seawater ρ = 1030 kg/m3, and the viscosity of seawater μs = 0.8949 × 10⁻³ Pa·s. The value of turbulent viscosity in the simulation is 1, and the specific dissipation rate is 0.8.
Figure 3 is the grid diagram of the propeller, and Figure 4 is the enlarged grid diagram of the junction of the rotor blade, the hub, and the tip. In Figure 4, there are more detailed meshes in the tip clearance, with a number of approximately 350,000. Figure 5 shows the y+ of the grid.

4. Experiment and External Characteristics

4.1. Introduction to the Test Device

In order to compare the numerical simulation and verify the reliability of the numerical simulation, a series of tests were carried out on the prototype pump-jet propeller with an actual clearance of 0.2 mm. The test device is composed of four parts: drive motor, pump-jet propeller, pipeline, and rectifier tank. The test instrument includes an inlet and outlet pressure measuring tube, speed sensor, and high-precision electromagnetic flowmeter. The final assembly diagram of the experimental platform is shown in Figure 6. The working fluid temperature in this experiment and simulation is determined to be constant temperature 25 °C, moderate 100%. The name parameters of the main instruments are shown in Table 3.
The testing procedure begins by initiating the booster pump to pressurize the system after water injection, bringing it to a pressure of 2.5 MPa. Following this, the motor is started to adjust the speed of the jet propeller to the rated speed. Once the system achieves stable operation, the TPA (an instrument for monitoring experimental signals) tester is activated to record various tests such as flow, pressure, and speed. Simultaneously, the PC starts calculating and recording the data of the 2.5 MPa working point until a stable value is obtained. The next step is to reduce the pressure in the pipe. The head data is obtained by changing the pressure difference of the flow path by controlling the valve equally. The aforementioned steps are repeated until the pressure difference of the total pressure at the inlet and outlet decreases by 3%. Typically, this indicates that a stable cavitation condition has been reached. At this point, the cavitation test results under different system pressures can be obtained, and the collection of the cavitation test and external characteristic data can be completed.

4.2. Comparison and Verification of External Features

Based on the experimental data and numerical calculation, the curve diagram of the comparative external characteristics can be obtained in Figure 7. At this time, the average flow state is simulated, and there is no time-related fluctuation in the flow process of the fluid. The experimental data is selected as the data recorded in the experiment without cavitation, and the simulated parameters are set as consistent as possible with the experiment. The curves show that the variation rules and values of external characteristics under 0.2 mm blade tip clearance are consistent with the experiment, and the flow and efficiency curves of the experimental pump under different blade tip clearance are consistent with the experimental values and variation rules, which can confirm the relative authenticity of the simulation results. In the Figure, QS is the rated flow (m3/s), Q is the actual flow (m3/s), H is the head (m) (which is the height of the jet of water from the propeller), and Eff is the pump efficiency (%), τ is the symbol of the gap size (mm). The head is selected as the spatial average and the inlet pressure is monitored at the pressure inlet in Figure 3, and the outlet pressure is monitored at the flow outlet.
As can be seen from the above Figures, in the absence of cavitation, the head and efficiency of the pump-jet propeller decrease with the increase of tip clearance at the rotor. Its data is roughly that for every 0.3 mm increase in clearance, the head decreases by about 15%. The efficiency even decreases by 25% for every 0.3 mm gap increase.

5. Influence of Tip Clearance Coefficient on Cavitation Performance of Pump-Jet Propeller

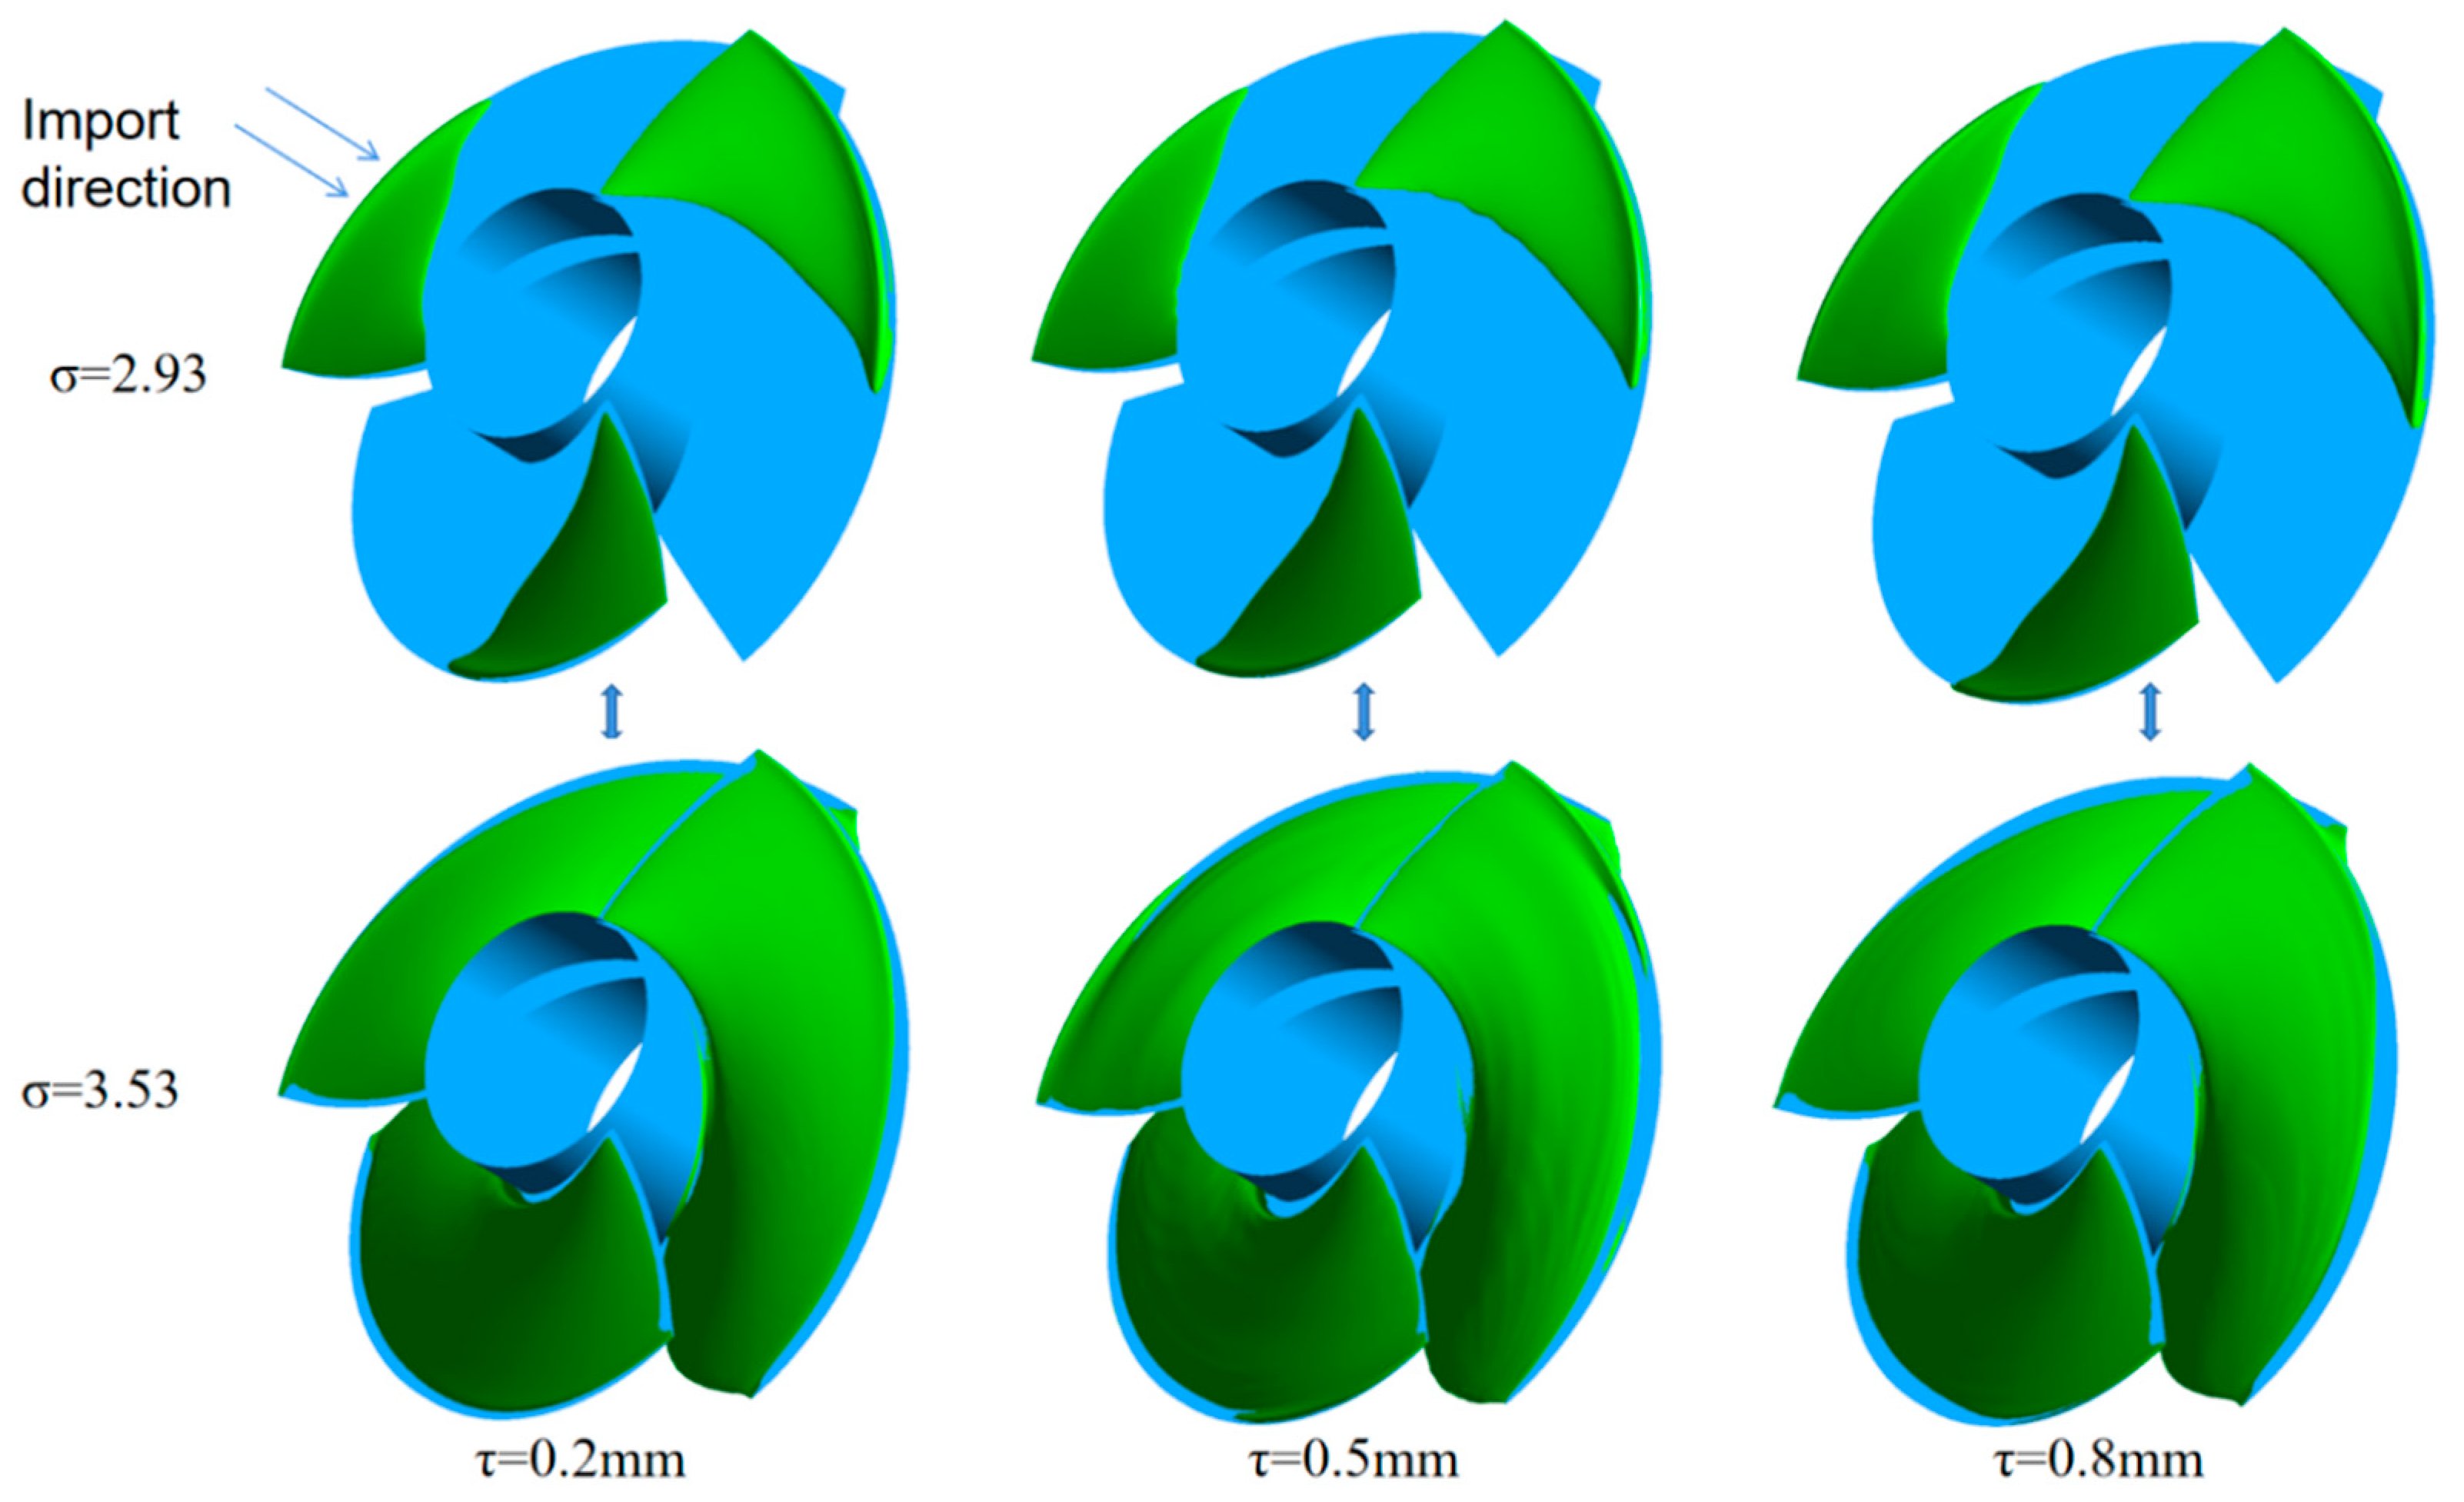
5.1. Comparison of Cavitation Characteristics

The pump cavitation test is to determine the cavitation point of the high-speed pump-jet propeller and test the performance trend of the pump-jet propeller with the change of cavitation degree. The test design was carried out on a closed test bench. The test design was carried out on a closed test bench. At the beginning of the experiment, the water storage tank was pressurized until 2.5 MPa, and then the air was gradually discharged to reduce the pressure in the pipeline until the head dropped to 97% of the non-cavitation state. The rotor speed remained unchanged during the test. At this time, it is judged that the pump-jet propeller has entered the critical cavitation point, and several experiments are conducted near this point to increase reliability and confirm that cavitation has occurred. After this, the inlet and outlet pressure differences continued to increase to test the change of head under different cavitation conditions.
The tip clearance of the simulation calculation is set as 0.2 mm, 0.5 mm, and 0.8 mm respectively, and cavitation simulation calculation is carried out under the design working conditions to realize a comparative study on the cavitation performance of the axial flow pump under different clearance. Here, the change of cavitation number σ is used to show the change of the performance of the pump-jet propeller with the change of the cavitation condition. The expression of σ is:
σ = P P V 0.5 ρ U 2
In the expression, P is the incoming pressure, PV is the saturated vapor pressure of seawater, and U is the incoming velocity.
The resulting cavitation characteristic curve is shown in Figure 8. The number of blades of the pump-jet propeller is small, and there is always a high-pressure part, so the performance curve in the whole range with the decrease of the cavitation number leads to the performance decline, and the pump performance is seriously weakened when it reaches a serious empty phase. As can be seen from the Figure, the trend performance of cavitation characteristics obtained by the experiment is basically consistent with that at 0.2 mm gap, but there are differences in numerical values due to experimental errors and different working media. At the same time, according to the numerical simulation, the trend is the same in different gaps, but the values are different. As can be seen from the Figure, with the increase of tip clearance at the rotor of the pump-jet propeller operating at high speed, the anti-cavitation performance of large clearance is still better than that of small clearance.

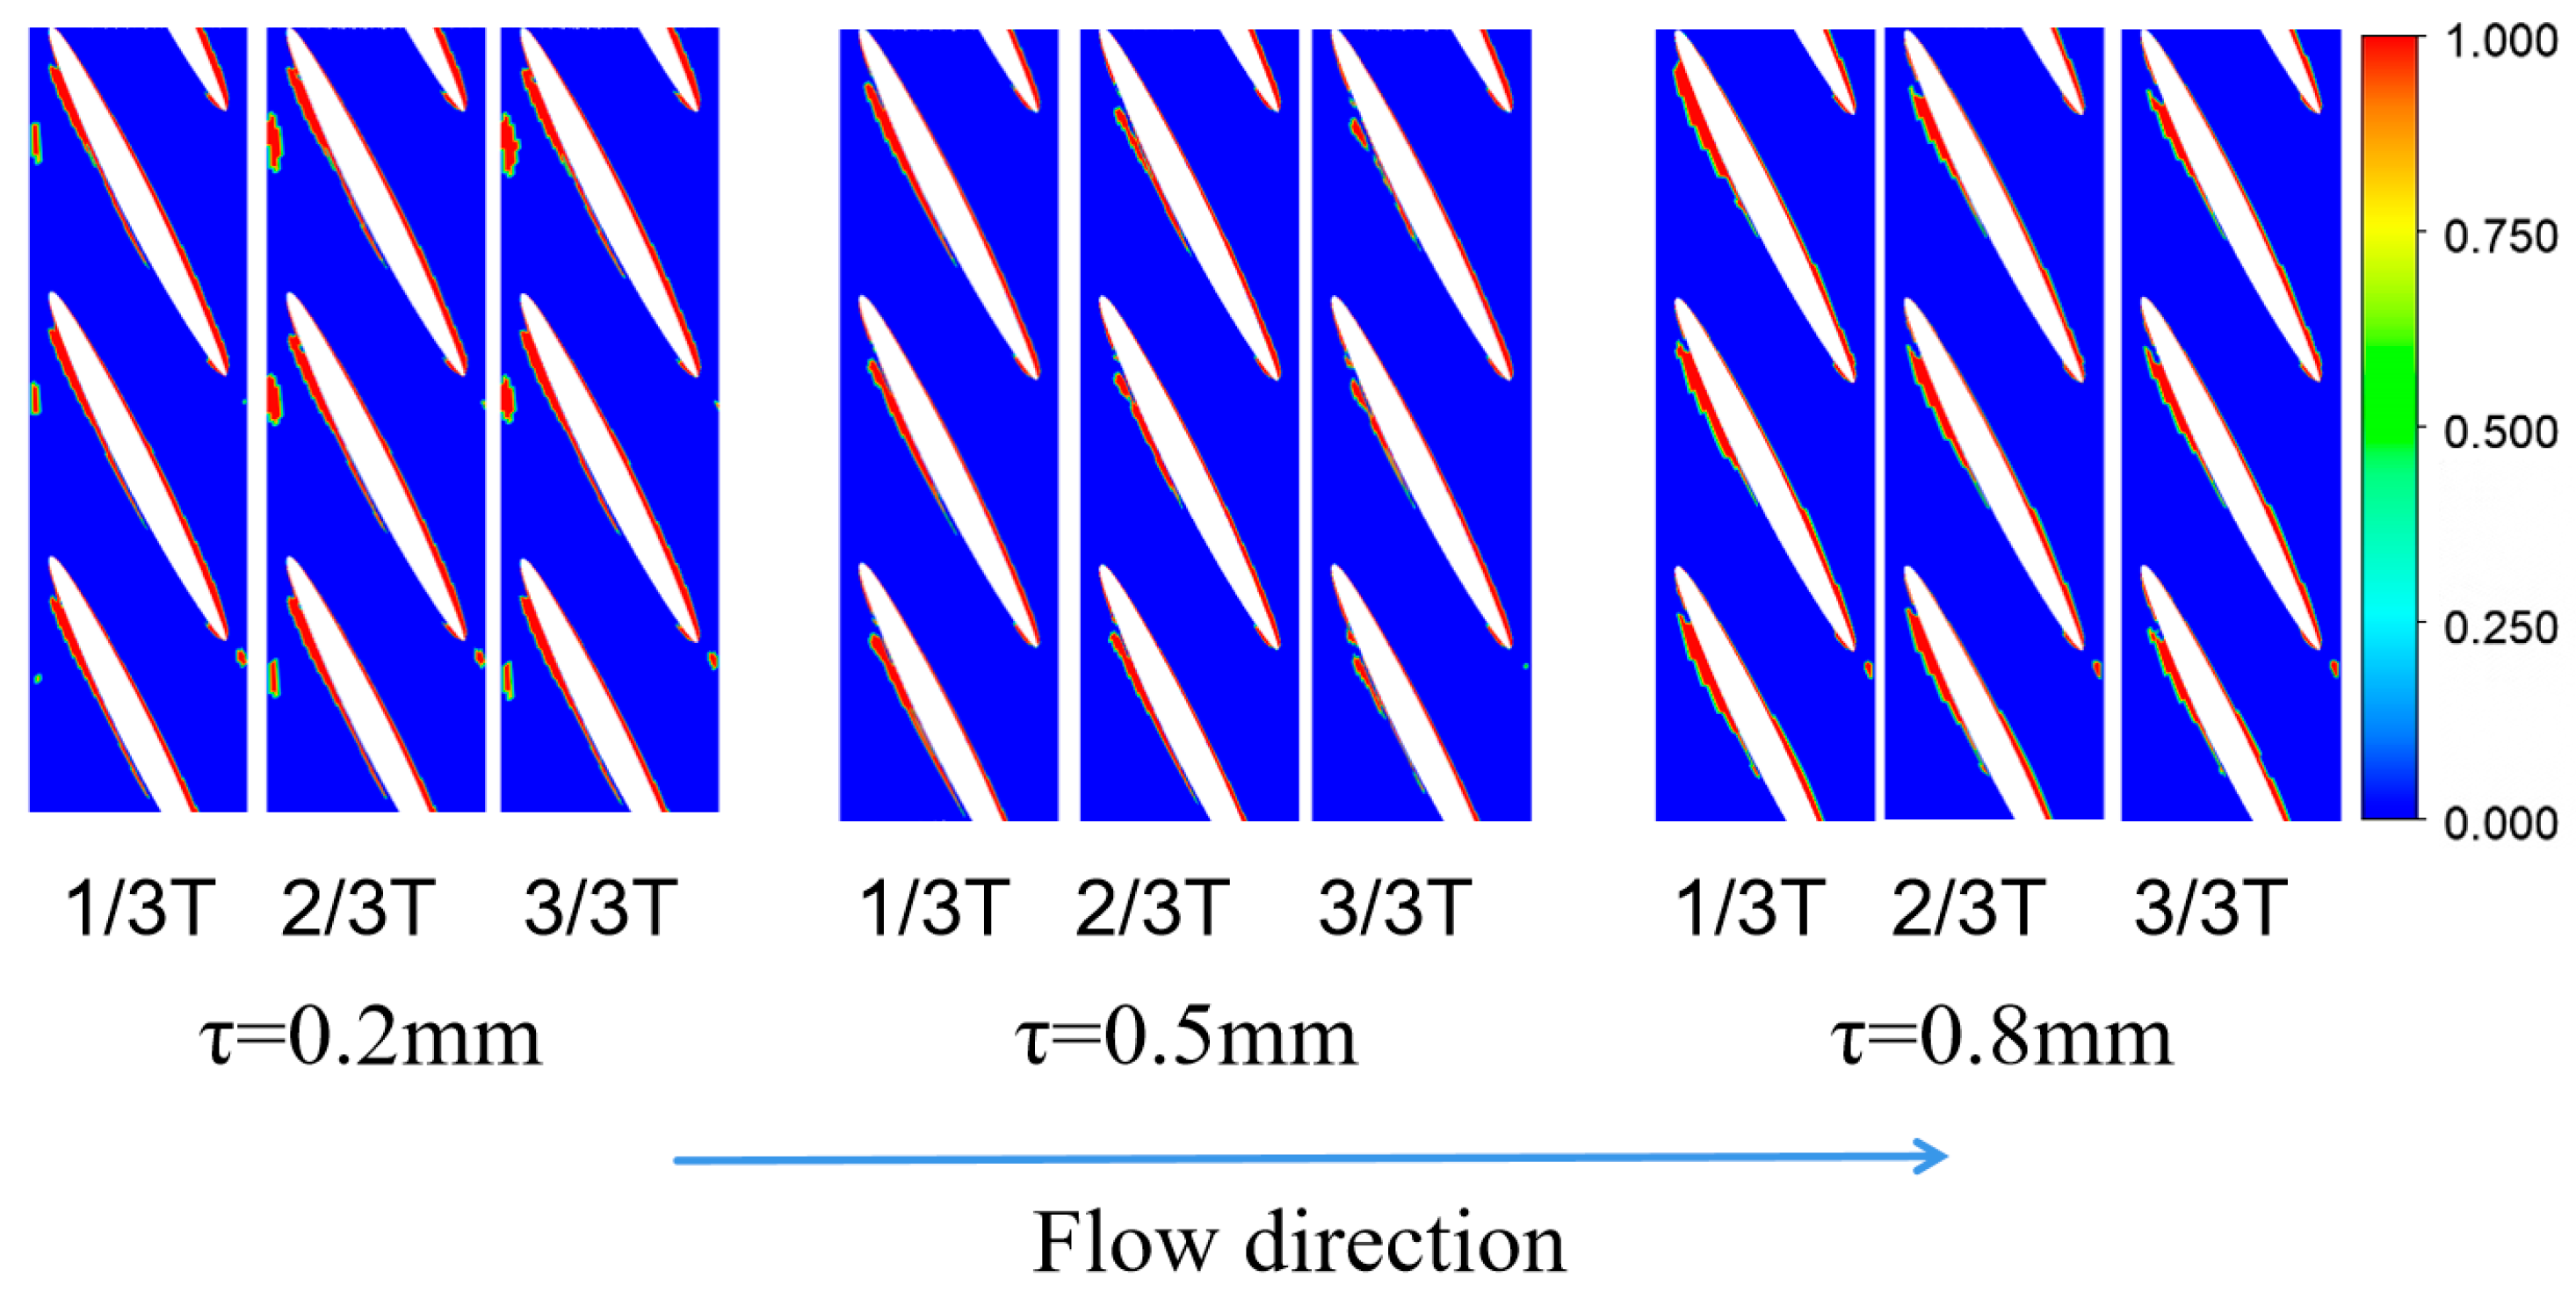
5.2. Distribution of Void Volume Fraction at Different Gaps

The influence of different tip clearance on the void volume fraction on the back of the blade under the same flow rate and different cavitation processes was compared and analyzed, as shown in Figure 9 and Figure 10. Figure 9 shows the change of cavitation volume fraction on the back of the blade with the change of cavitation number. Green represents the area where cavitation occurs, and blue is the surface color of the blades and hubs. Figure 10 shows the change of cavitation due to clearance under the same cavitation number.
As shown in Figure 9, with the development of the cavitation process, cavitation gradually develops from the leading-edge end of the blade and the leading-edge end of the clearance to the rear end of the entire blade. However, it can be seen that cavitation still does not occur in the clearance at the rear end of the blade. It can be concluded that cavitation is more likely to occur at the leading-edge end of the blade than at the back end. The reason for this is mainly affected by the structure. The inlet rim side contacts the incoming flow more first than the hub side, and the outside side is more affected by the incoming flow. At the same time, it is affected by the setting angle, resulting in lower pressure in the area of the leading-edge end of the rim and the inlet edge, so the cavitation appears here first. With the occurrence of the cavitation process, the low pressure brought by the mainstream occupies the mainstream position of the entire flow field, but the pressure difference between the front and back at the clearance and the blade inlet becomes smaller, resulting in the gradual weakening of cavitation here and the development of the inner and trailing-edge of the blade surface.
By examining Figure 10, the changes in each clearance under low cavitation number conditions can be observed. Firstly, it is apparent that as the clearance increases, the occurrence of blade cavitation at the connection between the blade trailing-edge and the hub is minimized at a clearance of 0.8 mm, while it is most severe at a clearance of 0.2 mm. Moreover, the cavitation in the gap at the leading end of the blade reveals that a clearance of 0.8 mm performs significantly better than the other clearances. The percentage of cavitation in the rotor area is shown in Table 4.
These observations indicate that a larger clearance exhibits superior anti-cavitation capability compared to a smaller clearance. It can be inferred that the flow and leakage vortex caused by the clearance at the rim disrupt the flow field structure and consume energy. Consequently, the pressure on the working surface of adjacent blades decreases, diminishing the pressure difference between the surface and the working surface of the adjacent blades. This, in turn, affects the cavitation at the inlet edge airfoil, ultimately leading to better cavitation performance.
The change in the vortex resulting from the alteration in clearance can be observed in Figure 11. In this paper, the results of vorticity are all represented by Q-criterion. In the figure, green is the original color of the blade, and other colors from red to blue represent the changing trend of the vortex. It can be seen that with the increase of the clearance, the vortex originally accumulated on the clearance gradually disappears and adheres to the blade surface. The vortex out of the wheel hub also increases gradually with the increase of the gap. The vortex originally generated at the front and rear ends of the blades also decreases with the increase of the clearance.
Therefore, properly increasing the tip clearance at high speed can protect and maintain the stability of the pump-jet propeller working in harsh conditions.

6. Transient Study on the Influence of Tip Clearance Coefficient on the Characteristics of Pump-Jet Propeller

Different tip clearances may have varying impacts on the operational performance of a high-speed pump-jet propeller under cavitation conditions. To investigate the influences of different tip clearances on the radial force and pressure within the rotor as time progresses, transient calculations are conducted on three types of tip clearances for the pump-jet propellers. The steady-state calculation results in a cavitation number of σ = 2.93 used as the initial for the transient calculations. Each 1° rotation of the impeller is regarded as a time step, with a time step duration of 8.3 × 10⁻⁶ s required for each step. The total rotational time of the rotor is 0.003 s. Here, the data of the second rotation of the rotor under stable state is selected for analysis, that is, the data between 0.3 s and 0.6 s. In the figure, it is represented by the second cycle starting from 0 s to the end of a rotation.

6.1. Unsteady Analysis of Rotor Blade Radial Force with Different Tip Clearance Coefficients

By analyzing the data of the second cycle of three different gaps in the x direction, it is found that the radial force changes in a certain period. The data and changes are shown in Figure 12. When the gap is 0.2 mm, the peak change is basically maintained within the range of ±580 N, and when the gap is obviously enlarged, the radial force also increases.
The analysis focuses on the fluctuation of the rotor’s radial force. When the tip clearance is 0.8 mm, the maximum peak value of the radial force is 384 N, with a minimum absolute value of 453 N. With a tip clearance of 0.5 mm, the maximum peak value is 323 N, while the absolute value of the minimum peak value is 388 N. A tip clearance of 0.2 mm results in a maximum radial force peak value of 285 N, and the absolute value of the minimum peak value is 302 N. The peak value of the radial force occurs when the rotor rotates to one-third of a circle for tip clearance of 0.2 mm. This is because the blade’s top has the largest radius and the highest power capacity at that specific circular angle As the blade surface approaches the measurement point during rotation the measured force reaches its maximum value. However, smaller clearances result in a reduced overall fluctuation range of the radial force, minimizing the burden on the rotor during operation. Therefore, it is recommended to select a smaller tip clearance when considering the working stability of the high-speed pump-jet propeller.

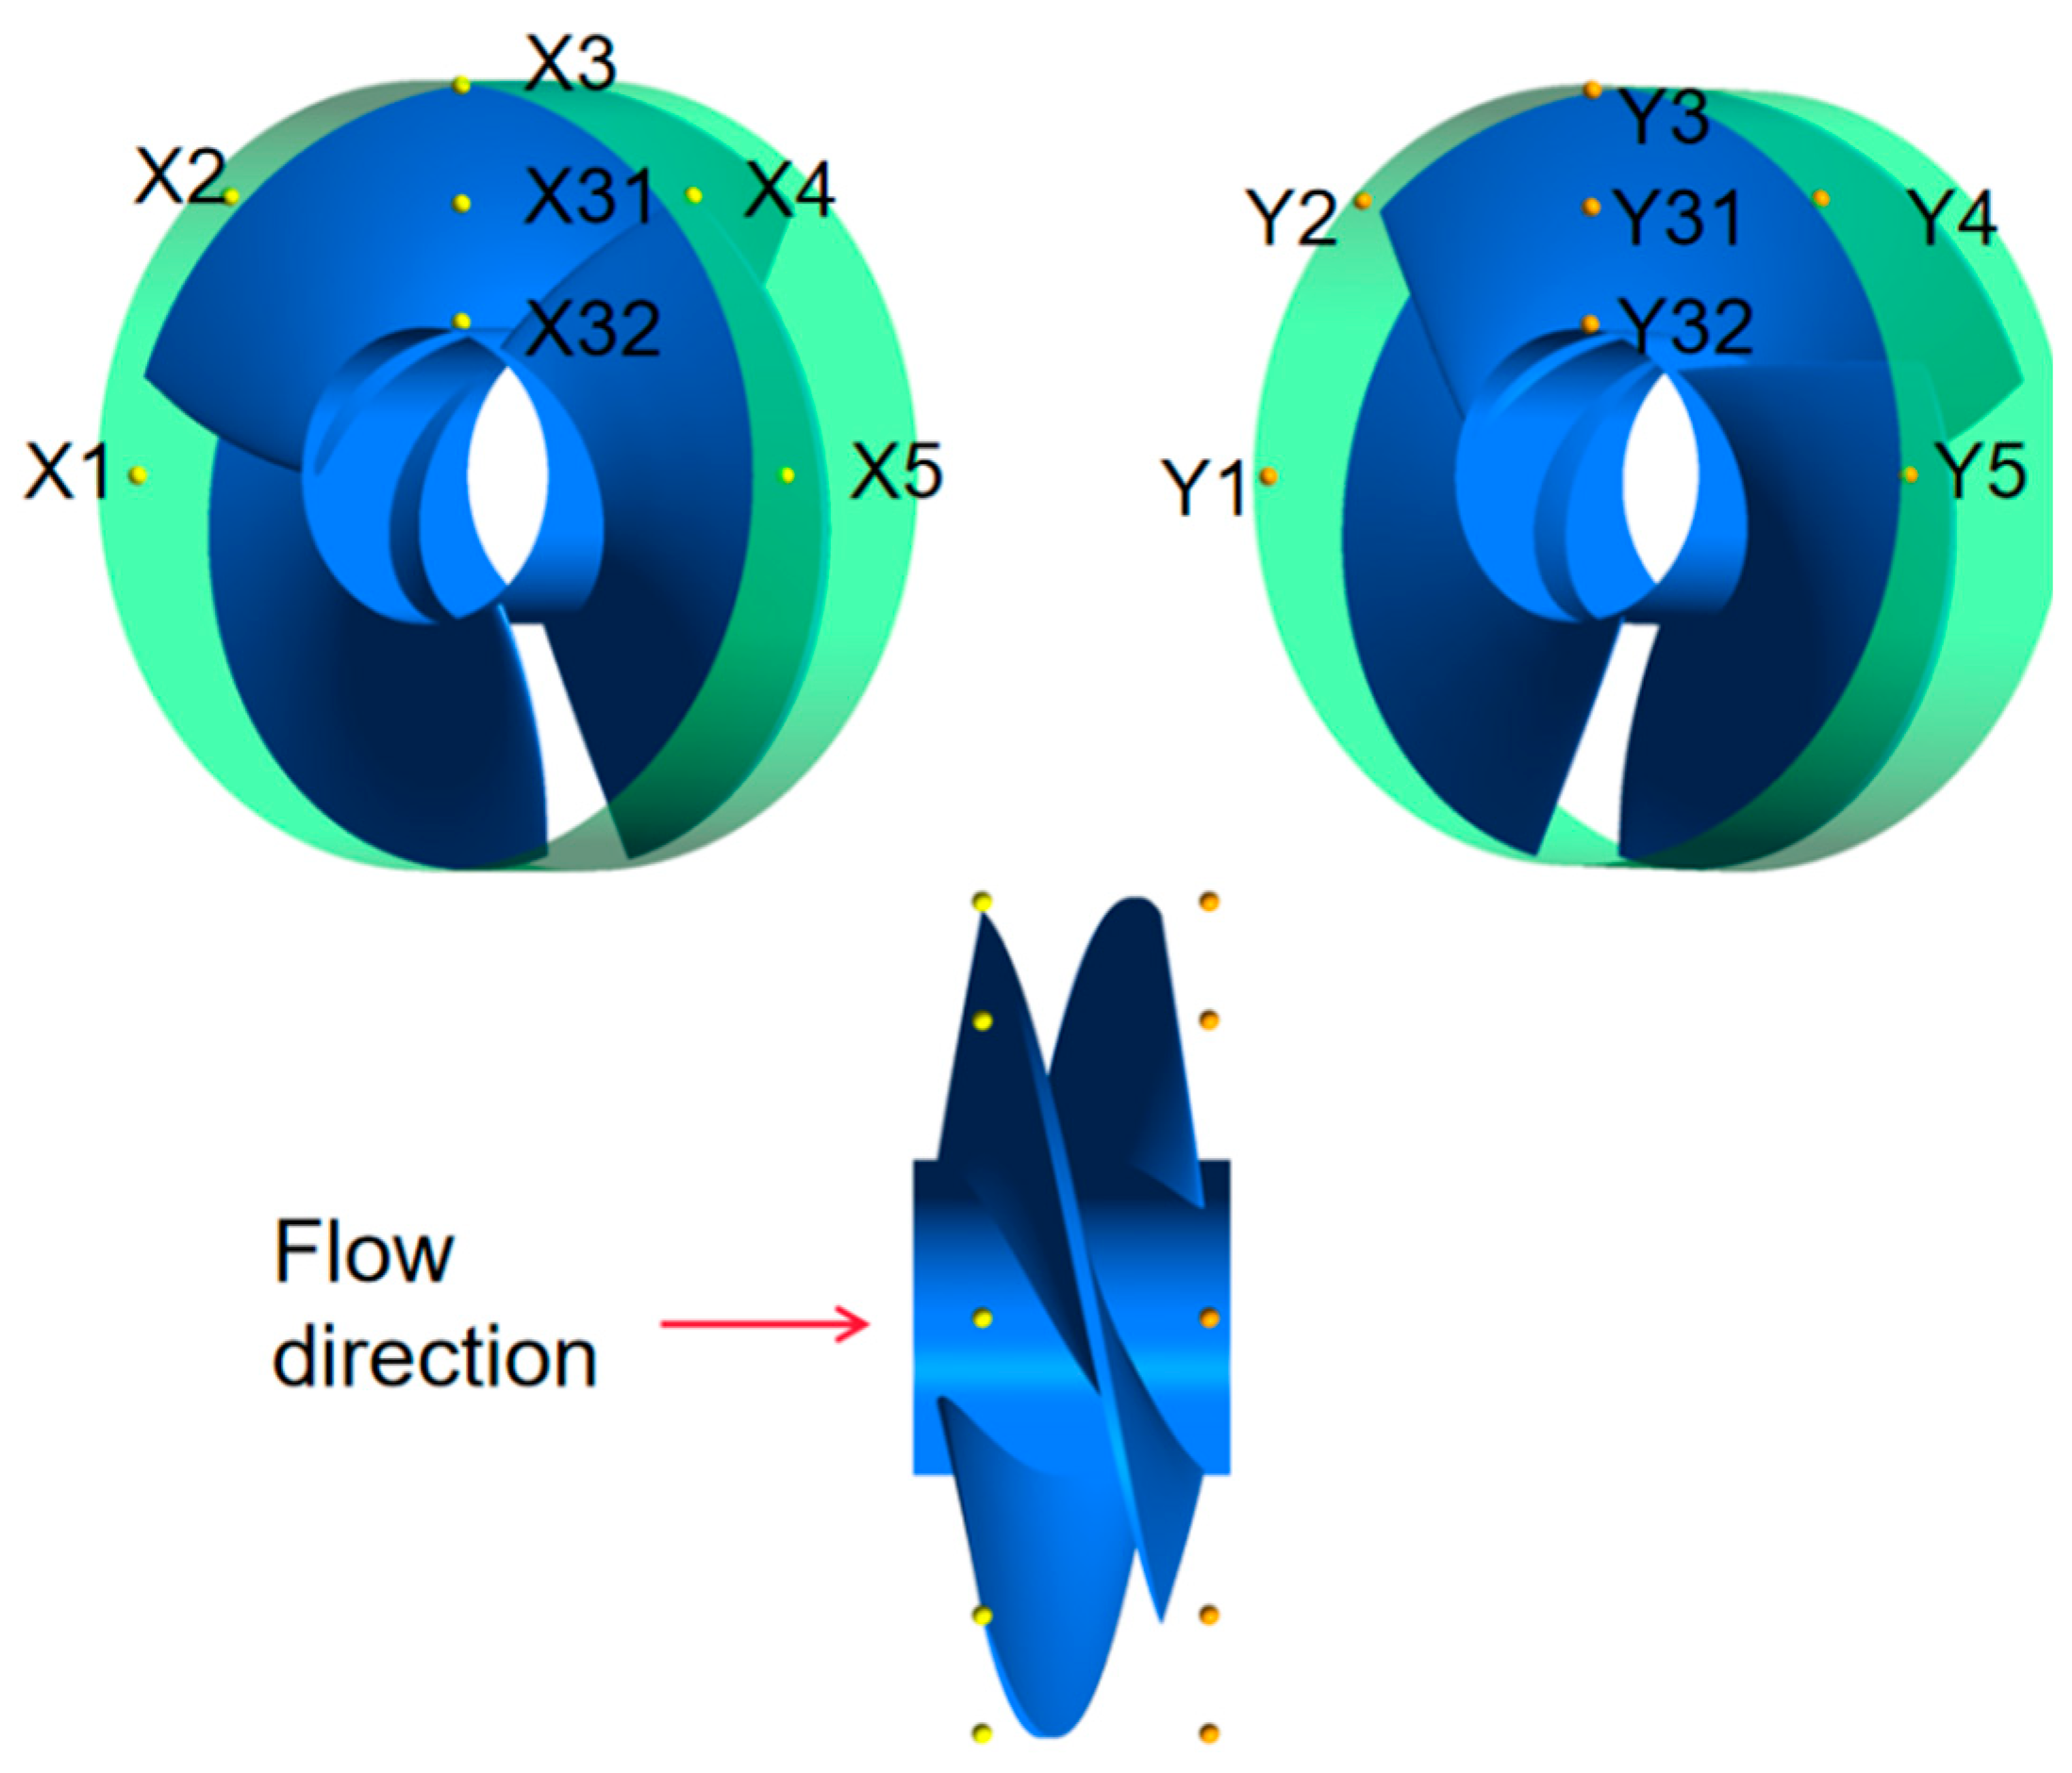
6.2. Pressure Pulsation Analysis under Different Tip Clearance

The change of structure makes it easy to change the medium flow in the rotating machinery and leads to the change of pressure pulsation, and the change of the middle tip clearance also affects the pressure pulsation [24]. When the rotor of the pump-jet propeller is in rotation, the tip clearance region exhibits the presence of a tip leakage vortex structure, which can induce unstable pressure pulsations. To analyze the pressure pulsations, monitoring points were placed in six different blade tip clearance coefficient schemes. These monitoring points were positioned at the edge of the suction surface of the propeller rotor blade (X1, X2, X3, X4, X5), the edge of the pressure surface (Y1, Y2, Y3, Y4, Y5), and the blade surface (X31, X32, Y31, Y32). The specific location of each detection point can be observed in Figure 13. The monitoring points of the X series are positioned at the inlet edge of the blade, while the monitoring points of the Y series are located at the outlet edge of the blade. The primary objective of the pressure pulsation analysis is to understand the fluid pressure changes induced by the high-speed rotation of the and determine whether these pressure changes can have an impact on the propeller structure. At this time, the data of the second cycle is analyzed, and a total of 360 data are Fourier transformed with each degree as one data point.
The main analysis methods of pressure pulsation are: (1) time domain method and (2) the frequency domain method.
(1) Time domain waveform diagram: In the time domain waveform diagram, the time is set as the horizontal coordinate and the pressure coefficient is set as the longitudinal coordinate, and the fluctuation range of instantaneous pressure at the monitoring point with the average pressure of the monitoring point in the rotation period as the center is expressed by the pressure fluctuation coefficient Cp. Therefore, the pressure signal of each monitoring point is expressed by Cp.
C p = p p ¯ 0.5 ρ u 2 2
where: p monitoring point instantaneous pressure (Pa), monitoring point period average pressure, u2 impeller outlet circumference velocity.
(2) Frequency domain waterfall diagram: Using the fast Fourier transform, X(nΔt) is a long sequence of finite length, length M, X(f) is the spectrum, and the discrete value Xm forms a corresponding relationship (where m = 0,1,2, ···, m − 1).
X m = X ( m Δ f ) = 1 M n = 0 M 1 x ( n Δ t ) exp ( j 2 π n m M )
where: f is the frequency, M is the number of sampling points, and is the sampling interval.
The rotation speed of the rotor is 20,000 r/min, and the number of rotor blades Z is 3, so the rotation frequency of the propeller fn = 20,000/60 = 333.33 Hz, and the impeller blade frequency fy = Z∙fn = 999.99 Hz. The frequency domain diagram is the result of the dual action of rotation frequency and cavity collapse. Cavitation shedding will change the main frequency from blade frequency to other frequencies and produce other sub-frequencies. The following results and analyses are based on the average value at the gap and the individual reduced measurement points at the blade surface.
Figure 14 demonstrates that the peak value of the pressure pulsation coefficient increases with the rise in clearance on the suction surface, with the most significant change observed in the amplitude. However, when the peak value of each measuring point deviates from the gap in one cycle, it is likely due to the shedding of the cavity caused by blade rotation. Moving on to Figure 15, changes in the frequency domain diagram reveal a relatively straightforward pattern. There is an extremely high amplitude followed by a smooth oscillation. The second peak occurs at twice the frequency, and the value gradually decreases at 20 times the frequency. Even when the gap is 0.8 mm, the peak amplitude remains the highest among the three clearances.
Upon examining Figure 16 and Figure 17, it becomes evident that the wave crests of the first group in the time-domain diagram are notably higher at each point compared to the latter two groups. Furthermore, the peak value of the 0.8 mm gap is slightly higher than that of the 0.5 mm and 0.2 mm gaps. At 0.8 mm, the amplitude of the frequency domain is also slightly higher than that of the other two and shows a decreasing trend as the gap decreases. This occurrence can be attributed to the larger clearance flow at the pressure surface clearance compared to the smaller clearance. Additionally, pressure surface clearance stabilizes after 8 times the blade frequency. There is a noticeable difference between the maximum peak value of the pressure surface and the suction surface. This discrepancy may be due to more severe cavitation at the front end of the blade than at the rear end, resulting in a comparatively easier pressure situation in this area.
The two sets of pictures in Figure 18 and Figure 19 show the variation trend of pressure pulsation at the monitoring points on the back and the blade surface of the working face. Because the X31 and X32 detection points were crossed by the blade surface for a short time, the pressure pulsation peak remained unchanged for part of the time. It can be seen that whether the working face or the back, the more the pressure pulsation develops to the hub, the lower the peak value, and the more stable the change. Compared with the pressure surface of the blade and the suction surface, the peak gap still exists, but the drop of the pressure surface from the middle end of the blade to the hub is much larger than that of the suction surface, and the peak value of the suction surface is almost unchanged. The peak values at the hub of the suction surface and the pressure surface are very close to each other, which is closely related to the cavitation condition, indicating that the influences of cavitation and vortex on the pressure pulsation are very great.
Due to the change in pressure pulsation, the pictures of vortex evolution and cavitation evolution are attached here for analysis. As can be seen from Figure 20, when the tip clearance is 0.8 mm, the vortex structure on the blade surface is significantly larger than the small clearance. The processing of vortexes here is also based on the Q criterion and adopts blade-to-blade display mode. The vorticity increases gradually with the increase of tip clearance. Secondly, it can be seen that when there is a small gap a vortex is generated not far from the leading-edge of the blade. This situation may be caused by too small clearance and poor flow.
It can be seen from Figure 21 that when the tip clearance is 0.8 mm, the cavitation condition is significantly smaller than that at the smaller clearance. The cavitation changes with blade rotation were observed. It can be found that with the passage of time, cavitation occurs from the blade near the leading edge, and then increases significantly and moves to the trailing edge.
In general, increasing the clearance leads to greater pressure pulsation changes across the entire rotor blade, which requires higher structural strength and results in more energy loss. Although the opposite trend may occur in the small gap near the hub, the peak value of pressure pulsation in these cases is generally lower than that of the larger gaps. Therefore, when considering strength requirements, small tip clearance should be preferred. Additionally, pressure pulsation is closely linked to the evolution of vortex and cavitation. Further research should be conducted, especially if significant cavitation still exists in the high-speed pump-jet propeller system.

7. Conclusions

According to the experiment and simulation, the following conclusions are obtained:
(1)
The head and efficiency of the pump-jet propeller decrease as the tip clearance at the rotor increases, when the clearance increases by 0.3 mm, the head decreases by about 15%, and the efficiency decreases by 15–25%.This can be attributed to stronger backflow caused by larger tip clearance compared to smaller tip clearance.
(2)
Cavitation initially occurs at the leading-edge end of the blade and then progresses towards the hub and trailing-edge of the rotor. In this process, it is observed larger clearances exhibit better anti-cavitation performance than smaller clearances. This can be attributed to the interference of clearance flow and leakage vortex at the rim, which affects the flow field structure, consumes energy, and reduces the pressure difference between the back surface and the working surface of adjacent blades.
(3)
The peak values of pressure pulsation in the hub with small gaps are lower compared to larger gaps. The reason is mostly the effect of the vortex. Because as the gap increases. More vortices are attached to the blade surface, resulting in increased vibration Therefore, when considering strength requirements, smaller gaps should be considered.
Although the influence of cavitation on the performance of high-speed pump-jet thruster is analyzed in this paper, there is not too much design for the study of gap flow and the influence brought by the evolution of vortices, which is also missing in this paper. At the same time, we think that the optimization of airfoil structure may bring some optimization of performance, which is not considered in this paper.

Author Contributions

Resources, R.Z.; Writing—original draft, Y.D.; Writing—review & editing, W.S.; Supervision, J.Y.; Project administration, Q.F.; Funding acquisition, G.G. All authors have read and agreed to the published version of the manuscript.

Funding

This research received no external funding or This research was funded by [National Natural Science Foundation of China] grant number [U20A20292]. And The APC was funded by [U20A20292].

Data Availability Statement

If the reader needs, we can provide the funder with the application for disclosure of the corresponding data. And if approved by the sponsor, we can provide the data and model samples of the studies involved in this paper.

Conflicts of Interest

The authors declare no conflict of interest.

Nomenclature

CFDComputational Fluid dynamics
FFTFast Fourier Transformation
u, v, ωVelocity of fluid, m/s
QFlow rate, m3/s
TTemperature, K
Fx, Fy, FzForces on the element, Pa
ρDensity, kg/m3
μViscosity, Pa∙s
Z Number of blades
fFrequency, Hz
σCavitation number
PPressure, Pa
HHead, m
EffEfficiency
ΤTip-clearance size, mm
CpThe pressure fluctuation coefficient
αnucVolume fraction of gas nuclei in water
RBBubble radius
FvapEvaporation coefficient
FcondCondensation coefficient
μs Viscosity of seawater, Pa∙s
UIncoming velocity, m/s

References

  1. McCormick, B.W.; Elsenhuth, J.J. Design and performance of propellers and pumpjets for underwater propulsion. AIAA J. 1963, 1, 2348–2354. [Google Scholar] [CrossRef]
  2. Suryanarayana, C.; Satyanarayana, B.; Ramji, K.; Rao, M.N. Cavitation studies on axi-symmetric underwater body with pumpjet propulsor in cavitation tunnel. Int. J. Nav. Archit. Ocean Eng. 2010, 2, 185–194. [Google Scholar] [CrossRef]
  3. Gaggero, S.; Martinelli, M. Design and analysis of pumpjet propulsors using CFD-based optimization. Ocean Eng. 2023, 277, 114304. [Google Scholar] [CrossRef]
  4. Das, H.N.; Jayakumar, P.; Saji, V.F.; Yerram, R. CFD examination of interaction of flow on high-speed submerged body with pumpjet propulsor. In Proceedings of the 5th International Conference on High-Performance Marine Vehicles, Launceston, Australia, 8–10 November 2006. [Google Scholar] [CrossRef]
  5. Motallebi-Nejad, M.; Bakhtiari, M.; Ghassemi, H.; Fadavie, M. Numerical analysis of ducted propeller and pumpjet propulsion system using periodic computational domain. J. Mar. Sci. Technol. 2017, 22, 559–573. [Google Scholar] [CrossRef]
  6. Peng, H.; Guo, J.; Sun, Y.; Wang, G.; Qu, L. Numerical analysis of hydrodynamic force of front-and rear-stator pump-jet propulsion systems behind a submarine under oblique sailing. Ocean Eng. 2022, 266, 112565. [Google Scholar] [CrossRef]
  7. Zhu, Z.-F.; Fang, S.-L. Numerical investigation of cavitation performance of ship propellers. J. Hydrodyn. 2012, 24, 347–353. [Google Scholar] [CrossRef]
  8. Ji, B.; Luo, X.W.; Wu, Y.L.; Liu, S.H.; Xu, H.Y.; Oshima, A. Numerical investigation of unsteady cavitating turbulent flow around a full scale marine propeller. J. Hydrodyn. Ser. B 2010, 22, 747–752. [Google Scholar] [CrossRef]
  9. Zhang, D.; Shi, W.; Van Esch, B.B.; Shi, L.; Dubuisson, M. Numerical and experimental investigation of tip leakage vortex trajectory and dynamics in an axial flow pump. Comput. Fluids 2015, 112, 61–71. [Google Scholar] [CrossRef]
  10. Shen, X.; Zhang, D.; Xu, B.; Shi, W.; van Esch, B. Experimental and numerical investigation on the effect of tip leakage vortex induced cavitating flow on pressure fluctuation in an axial flow pump. Renew. Energy 2021, 163, 1195–1209. [Google Scholar] [CrossRef]
  11. Shen, X.; Zhao, X.; Xu, B.; Zhang, D.; Yang, G.; Shi, W.; van Esch, B. Unsteady characteristics of tip leakage vortex structure and dynamics in an axial flow pump. Ocean Eng. 2022, 266, 112850. [Google Scholar] [CrossRef]
  12. Li, H.; Huang, Q.; Pan, G.; Dong, X. The scale effects on the open water performance of a pump-jet propulsor. J. Mar. Sci. Technol. 2021, 27, 348–367. [Google Scholar] [CrossRef]
  13. Donyavizadeh, N.; Ghadimi, P. Numerical investigation of the effect of tip clearance on hydrodynamic performance of the linear jet propulsion system and vortex generation behind the rotor. Proc. Inst. Mech. Eng. Part C J. Mech. Eng. Sci. 2021, 235, 2395–2407. [Google Scholar] [CrossRef]
  14. Jiang, J.-W.; Wang, W.-Q.; Chen, K.; Huang, W.-X. Large-eddy simulation of three-dimensional aerofoil tip-gap flow. Ocean Eng. 2022, 243, 110315. [Google Scholar] [CrossRef]
  15. Lu, L.; Gao, Y.; Li, Q.; Du, L. Numerical investigations of tip clearance flow characteristics of a pumpjet propulsor. Int. J. Nav. Archit. Ocean Eng. 2018, 10, 307–317. [Google Scholar] [CrossRef]
  16. Lu, L.; Pan, G.; Wei, J.; Pan, Y. Numerical simulation of tip clearance impact on a pumpjet propulsor. Int. J. Nav. Archit. Ocean Eng. 2016, 8, 219–227. [Google Scholar] [CrossRef]
  17. Lu, L.; Pan, G.; Sahoo, P.K. Sahoo. CFD prediction and simulation of a pumpjet propulsor. Int. J. Nav. Archit. Ocean Eng. 2016, 8, 110–116. [Google Scholar] [CrossRef]
  18. Qin, D.; Pan, G.; Huang, Q.; Zhang, Z.; Ke, J. Numerical investigation of different tip clearances effect on the hydrodynamic performance of pumpjet propulsor. Int. J. Comput. Methods 2018, 15, 1850037. [Google Scholar] [CrossRef]
  19. Li, H.; Pan, G.; Huang, Q.; Shi, Y. Numerical prediction of the pumpjet propulsor tip clearance vortex cavitation in uniform flow. J. Shanghai Jiaotong Univ. (Sci.) 2020, 25, 352–364. [Google Scholar] [CrossRef]
  20. Qiu, C.; Pan, G.; Huang, Q.; Shi, Y. Numerical analysis of unsteady hydrodynamic performance of pump-jet propulsor in oblique flow. Int. J. Nav. Archit. Ocean Eng. 2020, 12, 102–115. [Google Scholar] [CrossRef]
  21. Ahn, S.J.; Kwon, O.J. Numerical investigation of a pump-jet with ring rotor using an unstructured mesh technique. J. Mech. Sci. Technol. 2015, 29, 2897–2904. [Google Scholar] [CrossRef]
  22. Yang, X.L.; Long, X.P. Numerical investigation on the jet pump performance based on different turbulence models. IOP Conf. Ser. Earth Environ. Sci. 2012, 15, 052019. [Google Scholar] [CrossRef]
  23. Zwart, P.J.; Gerber, A.G.; Belamri, T. A two-phase flow model for predicting cavitation dynamics. In Proceedings of the Fifth International Conference on Multiphase Flow, Yokohama, Japan, 30 May–3 June 2004; Volume 152. [Google Scholar]
  24. Kim, H.H.; Rakibuzzaman, M.; Kim, K.; Suh, S.H. Flow and fast fourier transform analyses for tip clearance effect in an operating Kaplan turbine. Energies 2019, 12, 264. [Google Scholar] [CrossRef]
Figure 1. Research roadmap diagram.
Processes 11 03050 g001
Figure 2. Schematic diagram of rotor structure and rotor tip clearance.
Processes 11 03050 g002
Figure 3. Grid diagram.
Processes 11 03050 g003
Figure 4. Hub local grid and gap local grid.
Processes 11 03050 g004
Figure 5. Grid y+ presentation.
Processes 11 03050 g005
Figure 6. Experimental equipment schematic and part of the site display.
Processes 11 03050 g006
Figure 7. Comparison of external characteristic curves of tip clearance.
Processes 11 03050 g007
Figure 8. Cavitation characteristic curve.
Processes 11 03050 g008
Figure 9. Variation of void volume fraction distribution on the back of the blade.
Processes 11 03050 g009
Figure 10. σ = 3.53 space-time gas bubble volume fraction distribution and local magnification.
Processes 11 03050 g010
Figure 11. Vortex distribution under each gap.
Processes 11 03050 g011
Figure 12. Time distribution of radial force.
Processes 11 03050 g012
Figure 13. Pressure pulsation monitoring points.
Processes 11 03050 g013
Figure 14. Time domain of pressure pulsation at a back gap.
Processes 11 03050 g014
Figure 15. Frequency domain of pressure pulsation at the back gap.
Processes 11 03050 g015
Figure 16. Time domain of pressure pulsation at the clearance of the working face.
Processes 11 03050 g016
Figure 17. Frequency domain of pressure pulsation at the clearance of working face.
Processes 11 03050 g017
Figure 18. Time domain of pressure pulsation at blade surface.
Processes 11 03050 g018
Figure 19. Frequency domain of pressure pulsation at blade surface.
Processes 11 03050 g019
Figure 20. Vortex evolution in different tip-clearances.
Processes 11 03050 g020
Figure 21. Cavitation evolution under different gaps.
Processes 11 03050 g021
Table 1. Pump-jet propeller design parameters.
ItemIndex
Rim diameter D1170 mm
hub diameter D260 mm
Design mass flow531 kg/s
Number of rotor blades Z13
Number of stator blades Z25
Table 2. Grid independence verification.
SchemeGrid TotalHead/mMinimum Volume/m3
16,054,01597.744.1179 × 10−15
28,831,03099.323.5661 × 10−15
39,875,584100.473.2632 × 10−15
411,001,471101.152.9335 × 10−15
512,849,631101.172.7423 × 10−15
613,426,552101.182.5366 × 10−15
713,952,137101.172.4520 × 10−15
Table 3. Instrument parameter.
InstrumentRangePrecision
DN125 Electromagnetic flowmeter0–9999 m3/h±5%
Permanent magnet synchronous high-speed servo motor20,000 r/min;
110 kW;
52.5 N·m
±5%
Vibration test bench and TPA0.1–10,000 Hz±3‰
Table 4. Cavitation number display.
Tip-ClearancesSum of Gas PhaseSum of Water PhasePercentage
0.2157,6961.36245 × 10611.57%
0.5193,5931.72536 × 10611.22%
0.8157,6961.32126 × 1069.37%
Disclaimer/Publisher’s Note: The statements, opinions and data contained in all publications are solely those of the individual author(s) and contributor(s) and not of MDPI and/or the editor(s). MDPI and/or the editor(s) disclaim responsibility for any injury to people or property resulting from any ideas, methods, instructions or products referred to in the content.

