Abstract
The introduction of systems for ensuring quality and safe drinking water and risk management is the World Health Organization (WHO) good practice introduced as a legislative requirement for all water supply organizations (Directive EU 2020/2184) on the quality of water intended for human consumption. A specific object of this research is the implemented risk assessment and management system, part of the drinking water safety plan for Sofia city. The water supply system from the water source to the end user, operated by Sofiyska voda JSC and part of Veolia, was analyzed. The hazards and risk events were reviewed for each component of the system—the catchment, water source, supply water pipes, drinking water treatment plants (DWTPs) and distribution water network. The results of the risk evaluation show that the risk of an algal bloom falls from medium risk, with a value of 36 in 2018. This risk was new for the Iskar Dam—the main water source for Sofia city. The purpose of the current study is to analyze the risk of blue-green algae blooming and the potential release of toxins in the Iskar Dam. A data analysis of phytoplankton counts, temperature of the water in the dam, precipitation, algal diversity and quantity of microcystins for a period of three years shows that there is a low probability of algae blooming. The concentration of microcystin LR was below 0.6 µg/L and of microcystin YR was below 0.1 µg/L. The highest phytoplankton count was 70,000 cells/mL in 2018, and it decreased to 30,000 cells/mL in 2020. The impact of the risk of “blue-green algae blooms in the Iskar Dam” is assessed as moderate (3) and that has not changed between 2018 and 2022. The likelihood of occurrence of this risk decreased from possible (3) to unlikely (2) after risk reassessment, and the current control effectiveness changed from weakly controlled (4) in 2018 to well controlled (2) in 2022, because more risk management actions were included in Sofiyska voda JSC. The results of the risk evaluation show that the risk of an algal bloom falls into the low-risk category with a value of 12, after measures were considered and a reassessment. As a preventive measure for better management and risk minimization, it is necessary to continue monitoring the phytoplankton count, species composition, concentration of algae toxins (microcystin LR) and nutrients in raw water from the Iskar Dam. This research has added value to the global database for surface water sources intended for human consumption and is focuses on a potential problem, valid for agricultural as well as for urban territories rich in diffused sources of pollution. The specific risk evaluation and management steps could be used and adapted by other water supply companies.
1. Introduction
Ecosystems, society and the economy need clean fresh water in sufficient quantities to exist and develop on the one hand. On the other hand, the continuous production of goods and products, overconsumption, climate change, diminishing natural resources and loss of biodiversity lead to increasing pressure on water resources [1].
An additional factor in the deterioration of the quality of surface water bodies, used for the drinking-domestic water supply, is the occurrence of algal toxic blooms. Their appearance is determined by several factors such as the concentrations of organic matter, nitrogen and phosphorus [2,3,4], the light [5] and the temperature. Uncontrolled agricultural practices, enriching the soil with nutrients and global warming predispose freshwater bodies to increasingly frequent toxic algal blooms [6,7]. Given that in many countries, including Bulgaria [8,9], water sources are also water receivers for wastewater, this leads to additional risks for the quality of the drinking water from the point of view of the presence of nitrogen, phosphorus, opportunistic pathogens and pathogens. For example, the Iskar River flows into the main water source for the city of Sofia, the Iskar Dam, along which water is discharged from wastewater treatment plants, including from the tourist complex Borovets, from the town of Samokov, etc. In some cases, these waters have increased concentrations of nitrates and phosphates [10], which favor the growth of algae. The toxins produced by the bloom, on the one hand, are included in the food chain, which leads to negative health effects, and on the other hand, the blooms themselves in the dark part of the day lead to hypoxia in the aquatic ecosystem, to the death of some of the organisms, a change in the dominant species and an overall change in biodiversity in the long term [11]. In this context, the topic of providing safe drinking water to consumers in populated areas is particularly relevant.
In order to use natural waters for a domestic drinking water supply, the water sources have to meet certain quality parameters laid down in the local legislation of the EU member states. The use of natural water for drinking and domestic needs in Bulgaria is established in the Water Act [12], as well as in the accompanying legislation [13,14], and the criteria for the quality of drinking water are listed in Ordinance 9 on the quality of water intended for drinking and domestic water supply [15].
In 2004, general guidelines for the development of water safety plans were published by the World Health Organization (WHO) [16], due to the need to introduce a unified approach (benchmark) for the assessment and management of risks for water used for drinking and household needs. The methodology is widely adopted, both in countries in the European region and in other countries—Iceland, Australia, Colombia, etc. [17,18,19]. In addition, in 2013, the standard EN 15975-2:2013 Security of drinking water supply—Guidelines for risk and crisis management—Part 2: Risk management [20] was introduced, which is valid for all members of the CEN (European Committee for Standardization) including Bulgaria, without changes.
The introduction of the risk assessment and management approach for drinking water in Bulgaria took place in 2018, with the update of Ordinance 9 [15]. The development of a water safety plan (WSP) [16] is based on good practices available for risk assessment and management [16,20]. The WSP Manual [15] was used in the identification of the dangers for the watershed of the Iskar Dam, which is the object of research in this article. The main sources of risks for the water and the dangers they hide are presented in Table 1 below. The sources of risks are divided into categories depending on what sphere they could arise in—changes in climate, geological, agricultural, industrial, wildlife, transport infrastructure, etc. As is visible from the Table 1, the danger of algal blooms and the production of toxins are at the level of the water source and water storage in large dams, but as mentioned above, the indirect sources that emit nutrients (nitrogen and phosphorus) can be agriculture, wastewater treatment plants, septic tanks, etc., which are point sources of pollution, etc.

Table 1.
Typical hazards affecting watersheds [16] and used by Sofiyska voda JSC for risk identification.
This study investigates the risk assessment of the largest water and sanitation company in Bulgaria, Sofiyska voda JSC, which supplies drinking water to over 1.5 million people. In 2019, the company completed the introduction of the risk assessment requirement [15] by preparing and agreeing with the regional health authorities of Sofia “Risk Assessment”.
A lack of sufficient and systematized public information about the risk of algal blooms and the release of algae toxins in the Iskar Dam in a long-term aspect is ascertained after reviewing the available information on surface water quality [21,22] in the reports of the responsible institutions, scientific reports and publications [23,24,25], and after applying the WHO risk assessment methodology [16] and EN 15975-2 [20]. This fact necessitates further study of the relevant risk in order to assess the objectivity of the assessment.
Figure 1 presents information on the seasonal succession of algal populations and the differences between oligotrophic and eutrophic lakes [26]. It also shows that diatom blooms in oligotrophic and eutrophic lakes have two annual peaks, early spring and late autumn, with the autumn peak being of a lesser intensity. The autumn peak in oligotrophic lakes is of a more pronounced duration and greater intensity compared to the same one in eutrophic lakes, and with a shorter period compared to the diatom peak in eutrophic lakes. Unlike diatoms, blue-green algae have a single peak in the summer in both oligotrophic and eutrophic lakes, with the intensity of the peak being pronounced in eutrophic lakes.
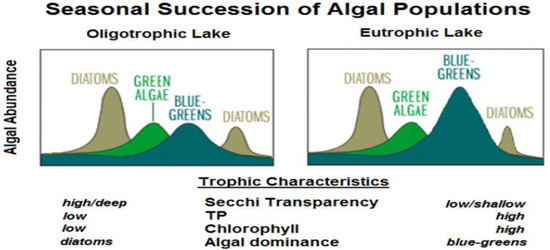
Figure 1.
Differences between seasonal algal succession in oligotrophic and eutrophic lakes including trophic characteristics [26].
The purpose of this study is to assess a specific risk “Blooming of blue-green algae and toxin formation” in the Iskar Dam. The specific risk assessment can be considered as a risk model for which scarce historical data are available; reports on similar realized risks in other countries [27,28,29] and publications [25,30] on changes in communities in the Iskar Dam water source and displacement of the dominant zooplankton complex are available.
No such analysis of water quality and safety risks for Bulgaria has been performed prior to 2018. The novelty in this study is the holistic approach and complexity of risks evaluated. A comprehensive risk management system has been created by Sofiyska voda JSC, which is partially presented in this article. For example, the observation of the biological risk “algal bloom” started with a “lack of information”, and through the years, the information was gradually gathered with real data from the site. As a result of the new data available, the top management of the company was able to make informed decisions about the water supply. The specific risk evaluation and management steps could be used and adapted by other water supply companies.
2. Materials and Methods
2.1. The Study Area—The Main Component in the Risk Assessment Is the Iskar Dam, the Main Water Source of the City of Sofia, the Capital of Bulgaria with a Population of 1.2 Million Inhabitants, Which Provides about 80% of the Drinking Water for the Residents of the Capital
The Iskar Dam (Figure 2) is the largest dam in Bulgaria, located in the upper reaches of the Iskar River at 850 m above sea level with a volume of 655,300,000 m3. It was built in 1954 along the Iskar River. The middle streams of the Iskar River and the Palakaria River, which supply water from the slopes of Rila and Vitosha mountains, flow into it. The useful volume of the dam is 580 million m3, its greatest depth is −75 m and the aquifer from which water is taken for drinking and domestic purposes is −35 m. It is 13.5 km long and has a water area of 30 km2. The dam is fed by high mountain rivers, originating from Rila mountain, from over 2500 m above sea level.
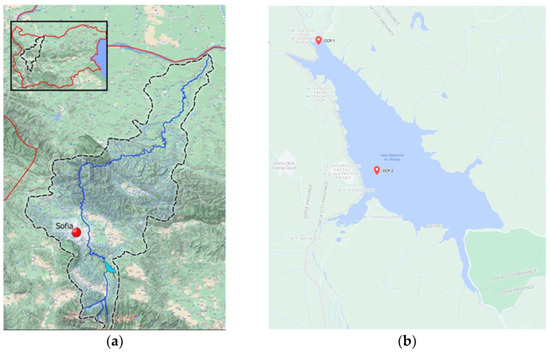
Figure 2.
Location of the watershed of the Iskar River on the map of Bulgaria (black box) and closer view of river watershed with the capital of Bulgaria (Sofia) pointed and Iskar Dam on river course (a) [31] and of the Iskar Dam, with CCP1 and CCP2 locations in the Iskar Dam (b) [32].
The main characteristics of the water used for drinking and domestic purposes from the Iskar Dam, which make it extremely suitable for daily use, are its hardness and pH. The water in the Iskar Dam is defined as soft, with a very low level of calcium and magnesium ions, therefore it does not cause scale formation. The concentrations of calcium and magnesium are 10 to12 times lower than the norms for drinking water, with an average values for the indicator “Total hardness” of <0.75 mgeq/L or about 2 dH (German degrees), which categorizes it as “soft water”. The pH indicator, which determines the perception of water consumed by the body, has a value of approximately pH = 7.5—the water has a neutral pH.
The scheme of a whole water supply system from the water source to the end user (consumer) is presented in Figure 3. In order for the drinking water supplied to the capital city to meet the modern sanitary and hygienic requirements, the raw water from the Iskar Dam is treated in 3 drinking water treatment plants (DWTPs) with a classic treatment scheme—chemical water treatment (pre-oxidation, flocculation, filtration and decontamination or disinfection).
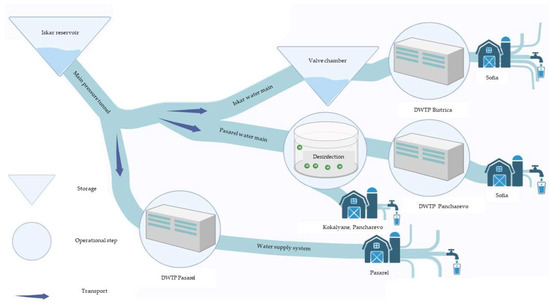
Figure 3.
Scope of the evaluated water supply system fed by Iskar Dam. The scheme presents the main parts of the system—water source (Iskar Dam), water main trunks (water pressure main; Iskar water main; and Pasarel water main), DWTPs (Pasarel, Bistritsa and Pancharevo) and urban water supply system.
The drinking water supply service is provided by the water supply operator Sofiyska voda JSC (SV), which is a joint-stock company founded on the basis of a Concession Agreement concluded with the Municipality of Sofia. In the field of water supply, the company’s activity is related to the operation and maintenance of 5 DWTPs; 59 tanks for drinking water; 14 chlorination stations working with chlorine gas and 19 chlorination points; and 695 km of water supply network.
2.2. Context and Methodology of Risk Assessment
2.2.1. Context of Risk Analysis and WSP
Since 2018, an integrated quality, safety and health at work and environment management system (EMS) has been effectively implemented in Sofiyska voda JSC according to the requirements of ISO 9001 [33], ISO 14001 [34] and EMAS [35]. The drinking water safety and quality management system is part of the company’s integrated quality management system. The quality of drinking water is ensured using a number of procedures, registers, data management systems, technological process diagrams, process diagrams and equipment, which are specified in the document.
In its pursuit of continuous improvement, the company has now upgraded this requirement by preparing a WSP.
2.2.2. Methodology of the Risk Assessment
The structure of the WSP prepared by Sofiyska voda JSC team, follows the drinking water quality management framework specified in the WHO guidelines [16] and EN 15975-2 [20]. The hazards and risk events were reviewed for each component of the system—catchment, water source, supply water pipes, DWTPs and distribution water network. The risk evaluation matrix is presented in Figure 4. This matrix is used by Sofiyska voda JSC to assess the risks identified, taking into account 5-grade scales as follows: (i) impact (from low to serious); (ii) probability (from very unlikely to very likely) and (iii) effectiveness of risk mitigating measures (from noncontrolled to strong controlled).
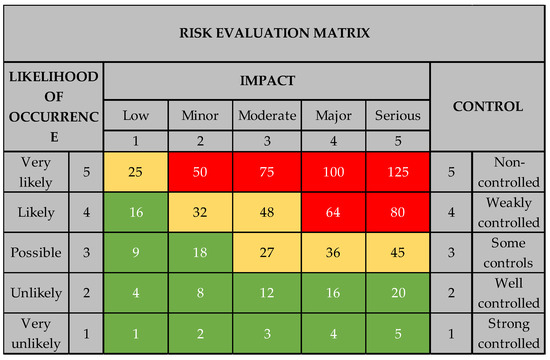
Figure 4.
Risk evaluation matrix implemented by Sofiyska voda JSC for water quality and safety risk assessment. The red color shows high risks, the yellow color shows medium risks and the green color shows low risks.
The analyzed risks are categorized according to their nature, which in turn lead to the deterioration of the quality of raw water according to the physical-chemical, microbiological or radiological parameters of the water. All risks, their impact and available control measures are summarized in a risk assessment ‘matrix’ (Table 2). Potential hazards and hazardous events for the quality and safety of drinking water are classified by origin—anthropogenic, biological, climatic, metrological, geological, etc.
Table 2.
Three examples for risk assessment in the Iskar Dam watershed with an example for risk assessment of blue-green algae blooms in the Iskar Dam.
The matrix used for the assessment of the risk for the safety and quality of drinking water was developed according to the methodology of an internal document for assessing the business risk of Sofiyska voda JSC. The risk score is a result of the product of the impact score, the risk probability score and the effectiveness score of the current controls. Scores in the matrix (Figure 4) range from low with green color (≤24) through medium with yellow color (≥25 and ≤49) and high with red color (≥50 and ≤125). The risks are assessed according to the available control measures and management plans. The probability score reflects the possibility of an occurrence. It can be determined on the basis of historical information in order to identify events or situations that have already occurred in the past. In this way, it is possible to extrapolate the possible frequency of occurrence of the risk in the future or to make an approximate estimate of the percentage probability of occurrence of the risk. Another possible approach in assessing the probability of occurrence, when there are no historical data available for a specific event in the company, is the use of data from other plumbing companies and expert opinions on the relevant issues. This approach relies on systematized information that is based on experience, research and conclusions resulting from the application of scientific methods or analytical techniques. In order to ensure the relevance of risks, their periodic assessment and effective management, Sofiyska voda JSC has established a Water Safety Team (WST), which meets monthly. Its members include experts from various units with knowledge and experience of processes, equipment and water hazards at every stage of water collection, treatment, and distribution through the water network to the end user. The main task of WST is to discuss with all interested parties the investment projects for improvement of water quality and the operational events concerning the quality of drinking water, as well as to perform risk assessment and management.
According to the in-house methodology, the impact, the probability of risk manifestation and the effectiveness of current controls have a 5-point rating, where the lowest rating 1 is given to the least impact, the lowest probability of manifestation and the most strictly controlled. The highest rated are the risks that have the greatest impact on the business process, have already materialized (or are highly likely to materialize) and are uncontrolled.
On the scale of Sofiyska voda JSC, from the point of view of ensuring the safety of drinking water and the health of consumers, the impact assessment is as follows:
- 5—Public health crisis. Multiple (e.g., >100) deaths among service users.
- 4—Serious risk to public health. Waterborne epidemic and some deaths among service users.
- 3—Wide range of public health risks. Waterborne diseases affecting 10–50 people.
- 2—Moderate risk to public health. Waterborne diseases affecting < 10 people.
- 1—Localized risk to public health. The nature of the problem is more aesthetic than a real health risk.
2.3. Monitoring of the Risk of Algal Blooms in the Main Water Source Iskar Dam
2.3.1. Critical Control Points and Analyzed Indicators
The amount of phytoplankton and its relationship with atmospheric conditions (water temperature and precipitation) were analyzed in the current study. Phytoplankton results are presented as number of phytoplankton cells per milliliter (cell/mL) of raw water from the Iskar Dam for a 3-year period from 2018 to 2020.
The qualitative composition of the phytoplankton and the concentration of algae toxins were investigated in August 2019 and August 2020 at two critical control points (CCP) in the Iskar Dam (Figure 2b). CCP1 was the water tower intake of the Iskar Dam with GPS coordinates 42.512220, 23.535021 and CCP 2 was near the touristic place “Stork nest” with GPS coordinates 42.462089, 23.564949. CCP 1 represents the quality of raw water at the inlet of DWTP Bistritsa (water from water intake horizon—minus 25 m in the Iskar Dam), and CCP 2 represents surface water from the dam at the place where the Iskar River inflows with an organic load, after a few villages without a wastewater treatment plant and agricultural use. Additionally, CCP2 has a potential risk of household-fecal pollution from the nearby tourist sites at the side.
The phytoplankton count was analyzed using 216 samples from CCP1 during different seasons. Single samples for toxin producing species and concentration of microcystins were investigated in 2019 and 2020 at CCP1 and CCP2.
The water temperature and the monthly amount of precipitation data are available from the meteorological station on-site at the Iskar Dam.
2.3.2. Methods
The samples for phytoplankton and microcystins were taken according to the requirements of ISO 5667-4:2016 Water quality—Sampling—Part 4: Guidance on sampling from lakes, natural and man-made [36]. Samples for the phytoplankton count were analyzed according to the internal methodology [37] of the Laboratory testing complex (LTC) of Sofiyska voda JSC. The method is based on fixation and sedimentation of the plankton cells present in a liter sample, with subsequent enumeration using a Sedgewick-Rafter counting chamber.
Taking into account the accumulated data and the extremely high number of phytoplankton registered in May 2018, a study was undertaken of the qualitative composition by Sofia University Biological faculty [38,39] and the presence of microcystin LR, RR and YR by the National Center of Public Health and Analyses (NCPHA, Sofia, Bulgaria) using the ELISA method [38,39]. The species composition of phytoplankton, and more precisely, the number of species, varieties and forms in certain taxonomic groups, is the basis for the calculation of several standard indices used to assess the state of water bodies using the content of nutrients in the water or their so-called trophic state. They do not take into account the quantitative presence of the phytoplankton [38].
3. Results and Discussion
3.1. Watershed Risk Assessment Matrix for Iskar Dam
A representative example of the biological and some anthropogenic risks in the assessed water source, the Iskar Dam, from the Risk Assessment is presented in Table 2 below.
Table 2 shows that the matrix contains information about the following components:
Assessed component of the system—all types of water sources operated by the water supply company are described in this cell. A drop-down list has been defined from which the specific type of water source can be selected—surface (dam, river) and/or underground (captured springs). Data only for the Iskar Dam are presented in the example in Table 2.
Water main—description of the corresponding supply pipelines from the specific water source, taking into account their technical characteristics—presence of hydroelectric power plants in the system, possibility of duplication of water supply, etc.
Nature of the risk—risks classification according to their nature—anthropogenic, emergency, biological, geological, meteorological situation, etc.
Source of the risk—root causes of the occurrence of the risk—for example, agriculture, transport, wildlife, earthquake, fire, industry, etc.
Risk description—additional information is described about the consequences of the realization of the risk. In almost all cases, it concerns a deterioration of the water quality in terms of physico-chemical and microbiological parameters.
Additional information—if necessary, additional information that would be useful in the description of the risk. For example, the presence of expected specific pollutants in the particular previously evaluated components of the system. Another example is in the case of anthropogenic pollution of the Iskar Dam from households and objects near the dam basin that use unregulated septic tanks, we would expect microbiological (fecal) pollution.
Control measure available/Risk Management Plan—measures taken to mitigate the relevant risk. For example, in the case of deterioration of the microbiological parameters of water quality as a result of the vital activity of plants and animals (wildlife biological risk), and an increase in the number of viruses, bacteria, parasites, biological agents, etc., the relevant measures to mitigate this risk are water abstraction from a multiannual regulating dam; water intake horizon—minus 35 m; treatment and disinfection—DWTP “Pasarel”, DWTP “Bistritsa” and DWTP “Pancharevo”; daily monitoring of the quality of raw water entering the WWTP; and emergency business continuity plan.
Proposal for additional measures—if applicable, this indicates additional measures that can be taken in addition to the existing risk management plans. For example, in the case of a realized anthropogenic risk.
Risk update date—risks are reviewed periodically or after a change in circumstances (a change in the process, an emergency situation in the company or in another water supply, etc.), taking into account the effectiveness of the control measures taken.
Impact, probability, effectiveness of current control and general assessment—this is a real risk assessment, which is described in more detail in item 2.2. The risk assessment provides an understanding of the risk, the causes of its occurrence, the consequences and the probability of its occurrence.
Deadline for implementation of the risk management plan (month and year)—the period for which the implementation of the specific management measure is planned is indicated. It can be an “ongoing” control of established practices as well as indicating the terms of planned projects to improve management and performance.
Risk Management Plan Performance Report to Major Update April 2022—all implemented measures introduced good practices for the past period.
3.2. Biological Hazard
The evaluation of the risk of “Blue-green algae blooms and toxin formation in Iskar” can be considered as a model for a risk for which scarce historical data are available; for similar models, real risks in other countries [17,18,19] and publications for changes in communities in the dam and displacement of the dominant zooplankton complex [25,30] are available.
One of the potential biological risks identified in Sofiiska Voda JSC is the possibility of algae blooms, and in particular blue-green algae, with the risk of releasing toxins, such as microcystin LR, etc., in the main water source for the capital of Bulgaria—the Iskar Dam. The risk is identified on a weekly analysis of the number of algae in the raw water (representative of −25 m from the water tower) from the Iskar Dam.
3.2.1. Phytoplankton Quantity
Figure 5, Figure 6 and Figure 7 present the number of phytoplankton, cells/mL, the water temperature and the total monthly amount of precipitation in the period 2018–2020. From the data presented in Figure 5, the gradual increase in the amount of phytoplankton since the beginning of March 2018 is clearly visible, with a sharp increase recorded in May 2018, reaching nearly 70,000 cells/mL of raw water.
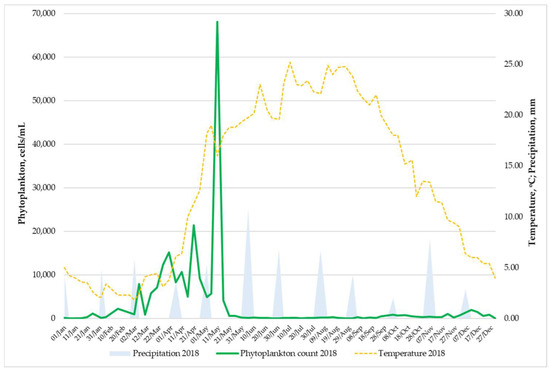
Figure 5.
Relationship among phytoplankton count, temperature of the water and monthly precipitation in 2018.
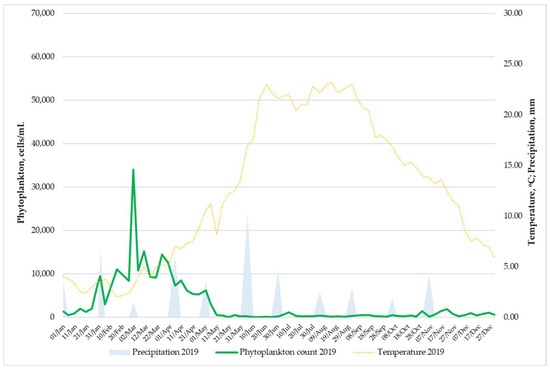
Figure 6.
Relationship among phytoplankton count, temperature of the water and monthly precipitation in 2019.
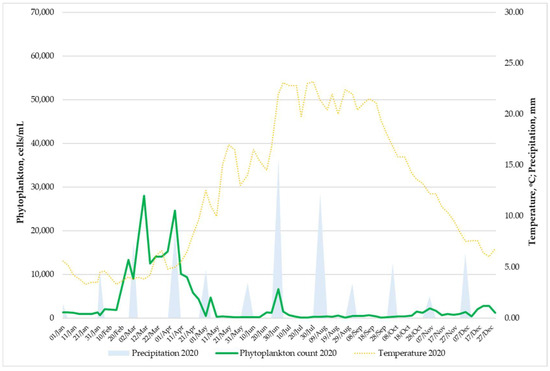
Figure 7.
Relationship among phytoplankton count, temperature of the water and monthly precipitation in 2020.
These data also led to the need of further analyses and an assessment of the possibility of the development of algal blooms. Unlike in 2018 (Figure 5), however, in the following years 2019 and 2020, no other large peaks were identified, as can be seen from the data in Figure 6 and Figure 7. At the beginning of March 2019, with nearly 34 thousand phytoplankter cells, the annual peak of the algal bloom was noted (Figure 6). In 2020, at the beginning of March and April, two similar peaks of nearly 28,000 and 24,000 cells/mL were registered.
Comparing the results of 2018 with those of 2019 and 2020, the divergence of the algae bloom peak is clearly visible. In 2018, blooming started in early March, with peaks in early and mid-April, but the highest peak was recorded in the first half of May. In 2019 and 2020, blooming began in the second half of January. In the three analyzed years, the end of the peak occurs around 10th May. It is also interesting that in 2018 and 2019, there were stable low water temperatures, below 5 °C, until the beginning of March and there were clearly visible spring peaks. In 2020, when the water temperature during the winter period varied and at times exceeded 5 °C, a blooming peak was observed in the middle of June (about 1300 cells/mL), which is higher when compared to the June peaks during the previous years, 2018 (190 cells/mL) and 2019 (270 cells/mL). In long-term studies, it would be possible to look for a relationship between the average monthly water temperatures and the quantity of phytoplankton. The charts also clearly show some weak summer peaks in July 2019 and 2020, with all three years compared showing much lower autumn–winter peaks starting at the end of October. The charts are close to the classical graph of seasonal succession of algal populations in oligotrophic lakes, which was presented and described in Figure 1 [26] and is close to the conditions in the dam.
The data from the analysis of chemical oxygen demand (COD), performed by LTC of Sofiyska voda JCS, show that the water in the dam is characterized by a low concentration of organics. The average concentration of organics, measured as COD, was below 9 mgO2/L. The temperature optimum determines the seasonal change of the species composition. During the winter, the amount of phytoplankton decreases due to the lack of solar radiation. The phytoplankton vegetation cycle begins in March–April, when solar radiation is sufficient for photosynthesis in algae, even in the surface layer. At that time, there are a number of cold water genera of diatoms—Melosira sp. (Diatoma) and others. During the first phase of the summer season, when the water temperature ranges from +10 °C to +15 °C, the species composition of the plankton still includes numerous diatoms, but other genera characteristic of moderately warm water such as Asterionella sp. and Tabellaria sp. are also present. At the same time, the productivity of green and blue-green algae increases.
Comparing the two indicators of water temperature and the number of algae, it is noticeable that the more distinct peaks of phytoplankton are at temperatures in the range of 5–8 °C, respectively, in the period from February to April. These peaks coincide with the preferences of the diatoms as well, which occur at temperatures up to about 10 °C [10]. The obtained data are also confirmed by other sources [26,40], according to which the number of diatoms has a high peak in early spring (March–April) and later in the autumn months of October–December. The highest peak in May 2018 was registered at temperatures of around 18 °C, which also suggests a shift in the dominant groups of algae, but no information is available on the qualitative composition of the phytoplankton. When comparing the data on precipitation and the quantity of phytoplankton, no clear relationship was found.
3.2.2. Phytoplankton Species Composition
According to data from LTC of Sofiyska voda JCS, the predominant phytoplankton organisms in raw water from DWTP Bistritsa are Melosira sp. (Figure 8) from the Class Diatomophyceae/Bacillariophyceae and Fragilaria sp. and Asterionella sp. (Figure 9) from the Class Fragilariophyceae.
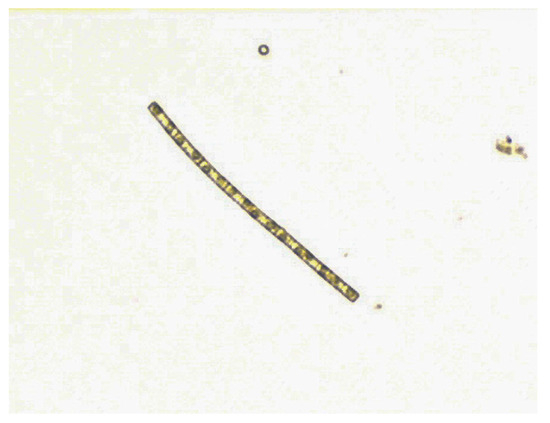
Figure 8.
Meliosira sp. from Iskar Dam, photo LTC.
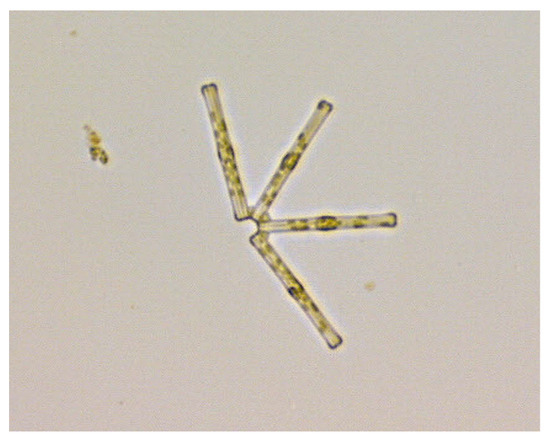
Figure 9.
Asterionella sp. from Iskar Dam, photo LTC.
The representatives of Melosira sp. and Fragilaria sp. have the highest numbers in the raw water treatment at the Bistritsa DWTP. These genera represent the majority of the total number of phytoplankton in the Iskar Dam. Less common are the representatives of Tabellaria sp., Synedra sp. and Staurastrum sp. from the Class Zygnematophyceae.
The data from the research reports from 2019 [38] and 2020/2021 [39] on samples provided by Sofiyska voda JSC are presented in a summarized form in Figure 10. In addition, the analyses made with respect to the qualitative composition of the phytoplankton in 2019 and 2020/2021 revealed that one of the predominant groups in the total amount of algae in the studied samples is the diatoms (Ochrophyta) [39]. A total of 22 algal taxa were identified as of August 2019. With the largest share (38%) in August 2019 among the phytoplankters are the diatoms (diatoms), ochrophyte algae, followed by blue-green algae (24%), as seen in Figure 10a.
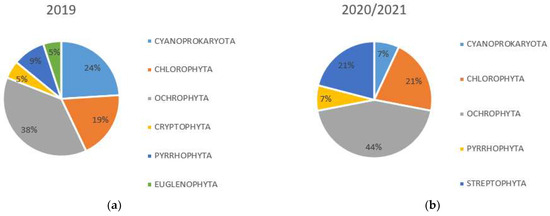
Figure 10.
Qualitative composition of the phytoplankton of the Iskar Dam in (a) August 2019 [38] and (b) March 2020–March 2021 [39].
As a result of the study of the quantitative and qualitative composition of phytoplankton in August 2019 (a) and 2020 (b), it was identified that the biomass of phytoplankton is formed mainly ofsiliceous ochrophyte algae, and among them representatives of the genus Aulacoseira play a dominant role [39].
The results obtained for the analyses of phytoplankton samples carried out in August 2019 and August 2020 show that the water of the Iskar Dam in the studied points are generally in a very good condition according to the criteria of Ordinance H4 [41]. As a result of the analysis of phytoplankton abundance [38] performed, it can be argued that at the time of sampling, there were no blooms of potentially toxic Cyanoprokaryota species in the phytoplankton during both sampling campaigns in August 2019 and August 2020.
Attention should be paid to the fact that single colonies of the toxigenic Microcystis aeruginosa (in 2019) and the potentially toxic species Woronichinia compacta (in 2020) were found in the samples, with the presence of 0.57 µg/L microcystin LR in August 2019, as well as 0.1 µg/L microcystin LR and microcystin YR in the surface sample from CCP 2 (Stork nest) [39], suggesting a probable phytoplankton bloom earlier in the year, Figure 11.
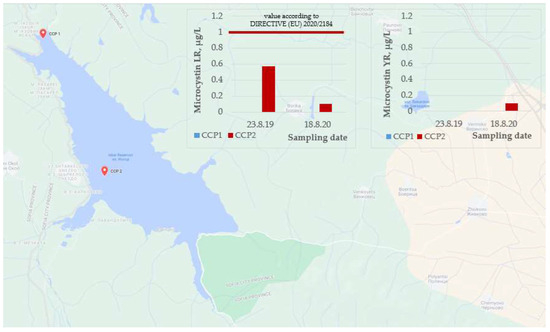
Figure 11.
Quantitative analysis of microcystins (LR and YR) in the period 2019–2020 [38,39] in the Iskar Dam. The red line shows the requirements according to Directive (EU) 2020/2184 [42] for concentration of microcystin LR.
At CCP 1, where the raw water is representative of an inlet of a DWTP, there were no traces of microcystins (the concentrations were below the minimum detectable concentration of the used method—0.1 µg/L). At CCP 2, where the surface water is representative of “organically loaded” water, and where there are suitable conditions for algae blooming, the concentration of microcystin LR is presented for both sampling dates. The concentrations of microcystins in the samples were significantly lower than the recommended concentrations of the World Health Organization [43], which are 1 µg/L for constant exposure to the action of the toxin in drinking water [41] and 12 µg/L for temporary exposure of the action of the toxin in recreational water [43].
3.3. Reassessment of the Risk of Blue-Green Algae Blooms in the Iskar Dam
Table 3 below represents a comparison between the initial risk assessment of blue-green algae blooms in the Iskar Dam made in 2018 and the re-assessment made in 2022. It is visible that due to lack of information about the risk and correspondingly adequate mitigating measures, the overall risk assessment in 2018 was average with 36 points. Measures planned by the company are visible in Table 3 in rows “Control measure available/Risk Management Plan” and “Proposal for additional measures”, respectively. As a result of the measures defined in 2018, progress is observed in 2022, which reflects the evaluations in “Probability” and “Current control effectiveness” and the total score of the risk decrease to 12.
Table 3.
Comparison between the risk assessment “Blue-green algae bloom” in Iskar Dam in 2018 and risk reassessment in 2022.
In 2018, when the risk assessment process was launched, there were prerequisites for the assessment of “medium” risk because of the application of the “worst case scenario” rule due to the lack of information and adequate measures for the risk management. The undertaken measures such as monitoring the presence of microcystins in the raw water from the Iskar Dam and the species composition of the phytoplankton in the Iskar Dam, as well as the assessment of potential for algal blooms in the Dam, described in 2018, have been implemented.
After the development of an action plan and implementing the proposed additional implementation measures for 2018, in Table 3, it is visible that the risk assessment has decreased from “medium” (with an overall score of 36) in 2018 to “low” (with an overall score of 12) in 2022.
Currently, measures are being undertaken to monitor and follow-up the plan for monitoring the raw and treated water from the Iskar Dam for the presence of toxin-forming species of algae and the production of the toxin, microcystin LR, as a result of a developed risk management plan. After performing the initial monitoring [38] in 2019, an action plan described in the risk assessment matrix was developed. According to it, Sofiyska voda JSC continues to follow the probability of a phytoplankton bloom through a floating buoy with on-line sensors installed near the water intake tower of the Iskar Dam. Chlorophyll, phycocyanin, water temperature and dissolved oxygen are the monitored parameters.
Through the monitoring of the Iskar Dam through satellite technologies, establishing phytoplankton blooms on the surface of the dam is also planned. Measures have been taken for simulating an emergency situation “Massive bloom of phytoplankton in the Iskar Dam”, modeling and analyzing the results of the simulation, as well as updating the emergency action plan for DWTP Bistritsa.
4. Conclusions
The results of the risk evaluation show that the risk of an algal bloom falls from “medium” with a value of 36 into the “low” risk category with a value of 12. Obtained results of the screening of the content and quantity of the phytoplankton, as well as the minimal existence of microcystin LR, show that the raw water from the Iskar watershed has a high quality, and the risk of a mass algal bloom is minimal. In the presence of the appropriate conditions (increased average temperature and high concentrations of nitrogen and phosphorus), an established single toxin-producing species could lead to significantly increased blooming. The data analysis shows that as a preventive measure for better management and risk minimization, it is necessary to continue monitoring both the species composition of phytoplankton and the concentration of algae toxins (microcystin LR) and nutrients in raw water from the Iskar Dam.
Author Contributions
Conceptualization, M.A.; Methodology, S.V.; Validation, I.S.; Resources, S.V.; Writing—original draft, M.A.; Writing—review & editing, I.S.; Visualization, M.A. and E.P. All authors have read and agreed to the published version of the manuscript.
Funding
This research was supported by the Sofiyska voda JSC and Grant № BG05M2OP001-1.002-0019: “Clean Technologies for Sustainable Environment—Water, Waste, Energy for a Circular Economy” financed by the Science and Education for Smart Growth Operational Program (2014–2020) co-financed by the EU through the ESIF.
Data Availability Statement
The data presented in this study are available from the corresponding author on request.
Conflicts of Interest
The authors declare no conflict of interest.
References
- Guterres, A. The Sustainable Development Goals Report 2020; United Nations: New York, NY, USA; p. 48.
- Wan, L.; Wang, X.H.; Peirson, W. Impacts of Climate Change and Non-Point-Source Pollution on Water Quality and Algal Blooms in the Shoalhaven River Estuary, NSW, Australia. Water 2022, 14, 1914. [Google Scholar] [CrossRef]
- Ferencz, B.; Toporowska, M.; Dawidek, J. Role of Hydrology in Cyanobacterial Blooms in the Floodplain Lakes. Water 2023, 15, 1547. [Google Scholar] [CrossRef]
- Chidiac, S.; El Najjar, P.; Ouaini, N.; El Rayess, Y.; El Azzi, D. A comprehensive review of water quality indices (WQIs) history, models, attempts and perspectives. Rev. Environ. Sci. Biotechnol. 2023, 22, 349–395. [Google Scholar] [CrossRef] [PubMed]
- O’Sullivan, P.E.; Reynolds, C.S. The Lakes Handbook Vol. 1 Limnology and Limnetic Ecology; Blackwell Publishing Company: Hoboken, NJ, USA, 2004; p. 167. [Google Scholar]
- Jetoo, S.; Krantzberg, G. The Toledo Drinking Water Advisory: Suggested Application of the Water Safety Planning Approach. Sustainability 2015, 7, 9787–9808. [Google Scholar] [CrossRef]
- Li, J.; Zheng, Z.; Liu, G.; Chen, N.; Lei, S.; Du, C.; Xu, J.; Li, Y.; Zhang, R.; Huang, C. Estimating Effects of Natural and Anthropogenic Activities on Trophic Level of Inland Water: Analysis of Poyang Lake Basin, China, with Landsat-8 Observations. Remote Sens. 2023, 15, 1618. [Google Scholar] [CrossRef]
- Stoyneva-Gärtner, M.; Stefanova, K.; Descy, J.-P.; Uzunov, B.; Radkova, M.; Pavlova, V.; Mitreva, M.; Gärtner, G. Microcystis aeruginosa and M. wesenbergii Were the Primary Planktonic Microcystin Producers in Several Bulgarian Waterbodies (August 2019). Appl. Sci. 2020, 11, 357. [Google Scholar] [CrossRef]
- Stoyneva-Gärtner, M.P.; Descy, J.-P.; Uzunov, B.A.; Miladinov, P.; Stefanova, K.; Radkova, M.; Gärtner, G. Diversity of the Summer Phytoplankton of 43 Waterbodies in Bulgaria and Its Potential for Water Quality Assessment. Diversity 2023, 15, 472. [Google Scholar] [CrossRef]
- Dochin, K. Seasonal Dynamics and Species Composition of Phytoplankton in the “Kardzhali” and “Dospat” Dams. Ph.D. Thesis, Sofia University St. Kliment Ohridski, Sofia, Bulgaria, 2015. [Google Scholar]
- Zhang, Y.; Whalen, J.K.; Cai, C.; Shan, K.; Zhou, H. Harmful cyanobacteria-diatom/dinoflagellate blooms and their cyanotoxins in freshwaters: A nonnegligible chronic health and ecological hazard. Water Res. 2023, 233, 119807. [Google Scholar] [CrossRef] [PubMed]
- Bulgarian National Legislation. Water Act, Promulgated State Gazette on 28/01/2000; Bulgarian National Legislation: Sofia, Bulgaria, 2000. [Google Scholar]
- Bulgarian National Legislation. Regulation No. 12 on the Quality Requirements for Surface Water Intended for Drinking and Domestic Water Supply; Issued by the Minister of Environment and Water, the Minister of Health and the Minister of Regional Development and Public Works Promulgated State Gazette on 18/06/2002; Bulgarian National Legislation: Sofia, Bulgaria, 2002. [Google Scholar]
- Bulgarian National Legislation. Regulation No. 1 on Groundwater Survey, Use and Protection; Issued by the Minister of Environment and Water Promulgated State Gazette on 10/10/2007; Bulgarian National Legislation: Sofia, Bulgaria, 2007. [Google Scholar]
- Bulgarian National Legislation. Regulation No. 9 on the Quality of Water Intended for Drinking and Domestic Purposes; Issued by the Minister of Health, the Minister of Regional Development and Public Works, and the Minister of Environment and Water Promulgated State Gazette on 16.03.2001; Bulgarian National Legislation: Sofia, Bulgaria, 2001. [Google Scholar]
- WHO Team. Water Safety Plan Manual, Step by Step Risk Management for Drinking-Water Suppliers; WHO Team: Geneva, Switzerland, 2004. [Google Scholar]
- Gunnarsdottir, M.J.; Gardarsson, S.M.; Elliott, M.; Sigmundsdottir, G.; Bartram, J. Benefits of Water Safety Plans: Microbiology, Compliance, and Public Health. Environ. Sci. Technol. 2012, 46, 7782–7789. [Google Scholar] [CrossRef] [PubMed]
- Australian National Legislation. National Water Quality Management Strategy: Australian Drinking Water Guidelines 6 2004; Endorsed by NHMRC 10–11 April 2003; Australian Government, National Health and Medical Research Council: Canberra, Australia, 2004. [Google Scholar]
- Pérez-Vidala, A.; Escobar-Riverab, J.C.; Torres-Lozadac, P. Development and implementation of a water-safety plan for drinking-water supply system of Cali, Colombia. Int. J. Hyg. Environ. Health 2020, 224, 113422. [Google Scholar] [CrossRef] [PubMed]
- EN 15975-2:2013; Security of Drinking Water Supply—Guidelines for Risk and Crisis Management—Part 2: Risk Management. European Committee for Standardization (CEN): Brussels, Belgium, 2013.
- River Basin Management Plan (RBMP) Danube Region 2016–2021, Danube Region Basin Directorate (BDDR), Pleven. Available online: https://www.bd-dunav.bg/content/upravlenie-na-vodite/plan-za-upravlenie-na-rechniia-baseyn/aktualizaciia-na-purb/ (accessed on 15 August 2023).
- Regional Report on the State of the Environment in 2018, Regional Inspectorate Environment and Water (RIEW), Sofia. Available online: https://www.riew-sofia.org/files/AFPD/2019/Chl2al2/Doklad_2018.pdf (accessed on 15 August 2023).
- Stoyneva, M.; Pavlova, V. Cyanoprokaryotes (Cyanobacteria) and cyanotoxins in some Bulgarian dams. J. Balk. Ecol. 2013, 16, 257–260. [Google Scholar]
- Testera, P.A.; Litakerb, R.W.; Berdaletc, E. Climate change and harmful benthic microalgae. Our ability to predict how climate change will affect toxicity is limited for several reasons. Chief among these is the lack of key physiological and/or toxicity data. Water 2022, 14, 1914. [Google Scholar] [CrossRef]
- Stefanova, M.; Kozuharov, D.; Stanchkova, M.; Andreev, S.; Rajkova-Petrova, G. Zooplankton Community Response to the Ageing of Iskar Dam (Bulgaria); Bulgarian Academy of Science: Sofia, Bulgaria, 2020; Comptes rendus de l’Academie Bulgare des Sciences, Tome 73, No. 6. [Google Scholar]
- Dennis, J.; Bacon, L. Division of Environmental Assessment, Maine DEP, Highland Lake Summary, September 2017. Available online: https://www.windhammaine.us/DocumentCenter/View/3912/packet-special-mtg-2018-0130?bidId= (accessed on 20 July 2023).
- Michalak, A.M.; Anderson, E.J.; Beletsky, D.; Boland, S.; Bosch, N.S.; Bridgeman, T.B.; Chaffin, J.D.; Cho, K.; Confesor, R.; Daloglu, I.; et al. Record-setting algal bloom in Lake Erie caused by agricultural and meteorological trends consistent with expected future conditions. Proc. Natl. Acad. Sci. USA 2013, 110, 6448–6452. [Google Scholar] [CrossRef] [PubMed]
- Qin, B.; Zhu, G.; Gao, G.; Zhang, Y.; Li, W.; Paerl, H.W.; Carmichael, W.W. A Drinking Water Crisis in Lake Taihu, China: Linkage to Climatic Variability and Lake Management. Environ. Manag. 2010, 45, 105–112. [Google Scholar] [CrossRef] [PubMed]
- Nakache, F.; Mainguy, J.-M.; Wirth, J.; Greneche, C. Cyanobacteria: Example of a blooming phenomenon in a normandie dam —Crisis management. In Proceedings of the Water Quality Technical Conference, Salt Lake City, UT, USA, 15–19 November 2015; American Water Works Association: Washington, DC, USA, 2015. [Google Scholar]
- Stanachkova, M.; Stefanova, M.; Kozuharov, D.; Raikova-Petrova, G.; Fikovska, E. Community structure of zooplankton as key factor for self-purification capacity of Iskar dam. Ecol. Eng. Environ. Prot. 2017, IX, 39–46. [Google Scholar]
- WWF Bulgaria. Analysis of the Water Related Risks in the Iskar River Basin, Summary, Opportunities for Collective Action; WWF Bulgaria: Sofia, Bulgaria, 2023; Available online: https://wwfeu.awsassets.panda.org/downloads/coke_bridge_iskar_risk_analysis.pdf (accessed on 10 July 2023).
- National Bulgarian Legislation. Order No. RD—410/09.06.2015; Annex No. 3; Ministry of Environment and Water (MOEW): Sofia, Bulgaria, 2015. [Google Scholar]
- ISO 9001:2015; Quality Management Systems—Requirements. International Organization for Standardization: London, UK, 2015.
- ISO 14001:2015; Environmental Management Systems—Requirements with Guidance for Use. International Organization for Standardization: London, UK, 2015.
- European Commission. Eco-Management and Audit Scheme EMAS, Regulation (EC) No 1221/2009 of the European Parliament and of the Council of 25 November 2009 on the voluntary participation by organisations in a Community eco-management and audit scheme (EMAS), repealing Regulation (EC) No 761/2001 and Commission Decisions 2001/681/EC and 2006/193/EC. Off. J. Eur. Union 2009, 342, 1–45. [Google Scholar]
- ISO 5667-4:2016; Water Quality—Sampling—Part 4: Guidance on Sampling from Lakes, Natural and Man-Made. International Organization for Standardization: London, UK, 2016.
- Sofiyska Voda JSC. Internal Laboratory Methodology (ILM) No. PW-21/13.05.2008 from the Laboratory Testing Complex (LTC); Internal Documentation of Sofiyska Voda JSC; Sofiyska Voda JSC: Sofia, Bulgaria, 2008. [Google Scholar]
- Stoineva-Gertner, M.; Uzunov, B. Report on the Phytoplankton Study of the Iskar Dam (23.08.2019); Sofia University St. Kliment Ohridski, Biological Faculty: Sofia, Bulgaria, 2019. [Google Scholar]
- Stoineva-Gertner, M.; Uzunov, B.; Pavlova, V.; Mitreva, M. Report on the Status and Potential of Microcystin LR Production by Phytoplankton in Raw and Drinking Water from Iskar Dam; Internal Documentation of Sofiyska Voda JSC 2020; Sofiyska Voda: Sofia, Bulgaria, 2020. [Google Scholar]
- Sommer, U. Seasonal succession in plankton, Figure 8.19 Graphic presentation of the PEG model of seasonal succession. In Limnoecology, 2nd ed.; Oxford University Press: Oxford, UK, 2007. [Google Scholar]
- Bulgarian National Legislation. Regulation No. 4 of 14 September 2012 on the Characterization of Surface Waters; Official Gazette of the Republic of Bulgaria 22/2013 and 79/2014; Ministry of Environment and Water: Sofia, Bulgaria, 2012. [Google Scholar]
- European Union. Directive (EU) 2020/2184 of the European Parliament and of the Council of 16 December 2020 on the quality of water intended for human consumption. Off. J. Eur. Union 2020, 435, 1–62. [Google Scholar]
- World Health Organization. 2020 (WHO/HEP/ECH/WSH/2020.6), Cyanobacterial Toxins: Microcystins. Background Document for Development of WHO Guidelines for Drinking-Water Quality and Guidelines for Safe Recreational Water Environments; World Health Organization: Geneva, Switzerland, 2020. [Google Scholar]
Disclaimer/Publisher’s Note: The statements, opinions and data contained in all publications are solely those of the individual author(s) and contributor(s) and not of MDPI and/or the editor(s). MDPI and/or the editor(s) disclaim responsibility for any injury to people or property resulting from any ideas, methods, instructions or products referred to in the content. |
© 2023 by the authors. Licensee MDPI, Basel, Switzerland. This article is an open access article distributed under the terms and conditions of the Creative Commons Attribution (CC BY) license (https://creativecommons.org/licenses/by/4.0/).