Article

The Influence of Draft Tubes on the Mass Transfer and Mixing Performance of a Pilot-Scale Internal-Loop Airlift Reactor

State Key Laboratory of Chemical Engineering, East China University of Science and Technology, Shanghai 200237, China
*
Author to whom correspondence should be addressed.
Processes 2023, 11(10), 2866; https://doi.org/10.3390/pr11102866
Submission received: 3 September 2023 / Revised: 25 September 2023 / Accepted: 27 September 2023 / Published: 29 September 2023

Abstract

:
The hydrodynamic characteristics, mass transfer, and mixing performance of three different reactors, a bubble column reactor (BCR), a single-stage internal-loop airlift reactor (SSALR), and a four-stage internal-loop airlift reactor (FSALR), were investigated systematically through cold model experiments to explore the influence of draft tube configurations on the pilot-scale internal-loop airlift reactor (ILAR). The findings indicated that the BCR yielded a higher gas holdup and mass transfer coefficient due to its longer bubble residence time. Segmenting the draft tube improved the gas holdup in both the riser and downcomer, and the overall gas holdup in the downcomer increased by 9%. Compared with the SSALR, the mass transfer coefficient of the FSALR in the riser and downcomer increased by 10.2% and 9.3% on average, respectively. In addition, a higher liquid circulating velocity was obtained with the ILARs due to a higher gas holdup difference between the riser and the downcomer. Specifically, the liquid circulating velocity of the FSALR was 134.1% higher than that of the BCR and 15.8% higher than that of the SSALR. The mixing time of the ILARs was reduced due to more intense overall circulation. The mixing effect of the FSALR was the best. The mixing time was reduced by 70.2% and 51.3% compared with the BCR and SSALR for UG ranging from 4.0 cm/s to 9.1 cm/s, respectively. Empirical correlations were proposed for the gas holdup, liquid circulating velocity, mass transfer coefficient, and mixing time on the superficial gas velocity, and agreement with experimental data was satisfactory.

1. Introduction

The internal-loop airlift reactor (ILAR) is a type of multiphase reactor developed from the bubble column reactor (BCR), which combines the advantages of BCRs and stirred tank reactors and has characteristics such as a simple structure, no rotating parts, low energy consumption, low and uniform shear force, large liquid holding capacity, and excellent mass transfer and mixing performance [1,2,3]. Since the development of ILARs in the last century, it has been intensively used in chemical engineering, bioengineering and environmental protection [4], Fischer–Tropsch synthesis [5], coal liquefaction [6], fermentation [7], cell culture [3], desulfurization [8], wastewater treatment [9], and volatile organic compound removal [10].
Despite their unique advantages, ILARs also have some drawbacks that need to be addressed, such as poor mixing efficiency in high-viscosity systems and low gas holdup in the downcomer region, which can lead to a decrease in overall reactor efficiency. This poses certain challenges to the design, development, and scale-up of ILARs. To improve the low gas holdup in the descending zone of the single-stage internal-loop airlift reactor (SSALR) and further enhance mass transfer and mixing, the draft tube can be segmented to form a multistage ILAR [11].
Compared with the SSALR, the multistage ILAR has many advantages, such as higher gas holdup and mass transfer coefficient, and it has received extensive attention in recent years [12,13]. Ramonet et al. [14] used CFD to simulate the fluid flow of ILARs with different geometric structures, including single- and two-stage draft tubes. It was found that, among the three geometric structures (squared, cylindrical, and cylindrical with coned bottom), the squared structure had higher liquid velocity, higher turbulent kinetic energy, and shorter loop circulation time. In terms of the single- and two-stage structures, the upper turbulent kinetic energy of the two-stage structure was higher. Additionally, Ramonet et al. [13] also used CFD simulation to optimize the structure of a two-stage ILAR, studying the effects of ten different geometric structures (including draft tube placement, liquid height, interstage height, and draft tube diameters) on hydrodynamic performance. It was found that the placement of the draft tube had a significant effect on the hydrodynamic behavior. For the two-stage ILAR with a coned bottom, the liquid velocity increased with the decrease in the interstage height. The fluid flow in the reactor was simulated using CFD to correctly predict the hydrodynamic characteristics, which is a trend in reactor design and development. This study provided valuable insights for optimizing the structure of two-stage ILAR through CFD simulation, which is helpful in developing more efficient bioreactors. To inhibit liquid back mixing between the stages of a two-stage ILAR, Shi et al. [15] proposed a contraction–expansion guide vane. CFD simulation and experimental results showed that the internals generated local circulation flows at each stage rather than overall circulation flow, which increased the overall gas holdup by 1.98 times. Tao et al. [11] investigated gas–liquid–solid three-phase hydrodynamics and mass transfer in a pilot-scale multistage ILAR. It was found that increasing the superficial gas velocity can improve the gas holdup, liquid circulating velocity, and mass transfer coefficient, and shorten the mixing time in the gas–liquid flow, while the addition of solid particles has the opposite effect. Li et al. [12] investigated the local hydrodynamics and bubble characteristics of gas–liquid–solid three-phase in a two-stage ILAR. The results showed that increasing solid holdup and superficial gas velocity can promote the transition of the bubble circulation regime in the second stage (upper), and the gas holdup in the second stage is higher. In view of the relatively few studies on the local hydrodynamic characteristics of multistage ILAR in three-phase systems, this work is helpful for obtaining a deeper understanding of multistage ILAR. Zhang et al. [16] experimentally studied the influence of screen internals on hydrodynamics and mass transfer of a two-stage ILAR. The results indicated that the screen can effectively break bubbles up and make the radial bubble velocity distribution more uniform. Appropriate screens can improve the gas holdup and mass transfer coefficient. Li et al. [17] measured the radial distribution of bubble characteristics in each stage of the three-stage ILAR using dual electrical resistivity probes. The results showed that the bubble frequency, bubble size, gas holdup, and bubble velocity in each stage increased, and the distributions became wider with increasing the superficial gas velocity. Moreover, the bubble size and gas holdup in the second and third stages were almost radially uniform at low superficial gas velocity. Li et al. [18] also measured the local hydrodynamics in a three-stage ILAR using dual electrical resistivity probes and conductivity cells. The Zuber and Findlay drift flux model [19] was used to express the correlation of slip velocity with the total gas–liquid velocity, and it fitted the experimental data very well. Compared with the SSALR, the fluid flow in the multistage ILAR is more complex. A detailed study of the local hydrodynamic characteristics in each stage, such as bubble size and liquid circulating velocity, can help us better understand the multistage ILAR. The work of Li et al. [17,18] provided valuable insight for related research. Behin [20] investigated the mixing performance of a modified airlift loop reactor with a double-draft tube using the classical tracer response technique. The experimental results showed that, compared with a conventional concentric-tube airlift reactor, the mixing time and circulation time of the reactor were reduced by 48.3% and 35.5% in the homogeneous flow regime, respectively.
Yu et al. [21] proposed a novel interstage internal, which can inhibit the liquid back mixing and provide for a homogeneous suspension of solid particles in the multistage ILAR. In a related research study, the effect of two types of interstage internals (perforated plate and perforated plate with three long tubes) on liquid back-mixing was investigated, and the results suggested that the perforated plate with tubes could provide a more uniform distribution of solid particles in different stages [21]. Other studies investigated three bubble circulation regimes [22], the influences of the opening ratio of the internal on the gas and liquid channels and the effect of superficial gas velocity on the height of the gas layer below the internal [23], and the experimental and theoretical analyses of the different types of operations (concurrent, countercurrent, and batch) [24]. Mohanty et al. [25,26] proposed a novel multistage external-loop airlift reactor. It was found that the gas holdup of the multistage structure was 45% higher than that of the single-stage structure, and the mass transfer performance was better. Sarkar et al. [27] established a mathematical model that can predict the hydrodynamics of the three-stage external-loop airlift reactor, and the predicted values agreed well with the experimental data. Liu et al. [28] used a bubble column reactor and a two-stage ILAR to culture aerobic granules. It found that the two-stage ILAR had the characteristic of long-term stable operation compared with the bubble column reactor.
Until now, there have been relatively few research reports on the fluid flow behavior in multistage ILARs, and most of them only investigate a single reactor structure. Therefore, in order to better explore the substantive effect of multistage structure, comparative analysis and further research should be conducted on different reactor configurations, such as multistage, single-stage, and bubble columns. Additionally, some internals were designed and developed to enhance the performance of multistage ILARs [15,24]. However, their more complex geometric structures may lead to energy consumption, as well as installation and operational difficulties in industrial applications. In this case, the simple multistage structure has much broader application. Finally, most experimental setups reported in the literature only involve bench-scale testing, using reactors with diameters less than 0.2 m.. However, the experimental data from bench-scale reactors can hardly satisfy the demands of the scale-up design of industrial reactors due to insufficient consideration of scale-up effects. Therefore, there is an urgent need for a systematic investigation of the hydrodynamics, mass transfer, and mixing performance of pilot-scale multistage ILARs.
In this work, the effects of three reactor structures, namely a BCR, an SSALR, and a four-stage internal-loop airlift reactor (FSALR), on mass transfer and mixing performance were systematically investigated in a pilot-scale transparent cylindrical column. The aim of this study was to provide a quantitative basis and theoretical support for the development and design of multistage ILARs. The axial liquid velocity was measured using a modified Pavlov tube technique, the volumetric mass transfer coefficient was calculated based on dynamic dissolved oxygen curve measurements, and the mixing time was determined using tracer response techniques.

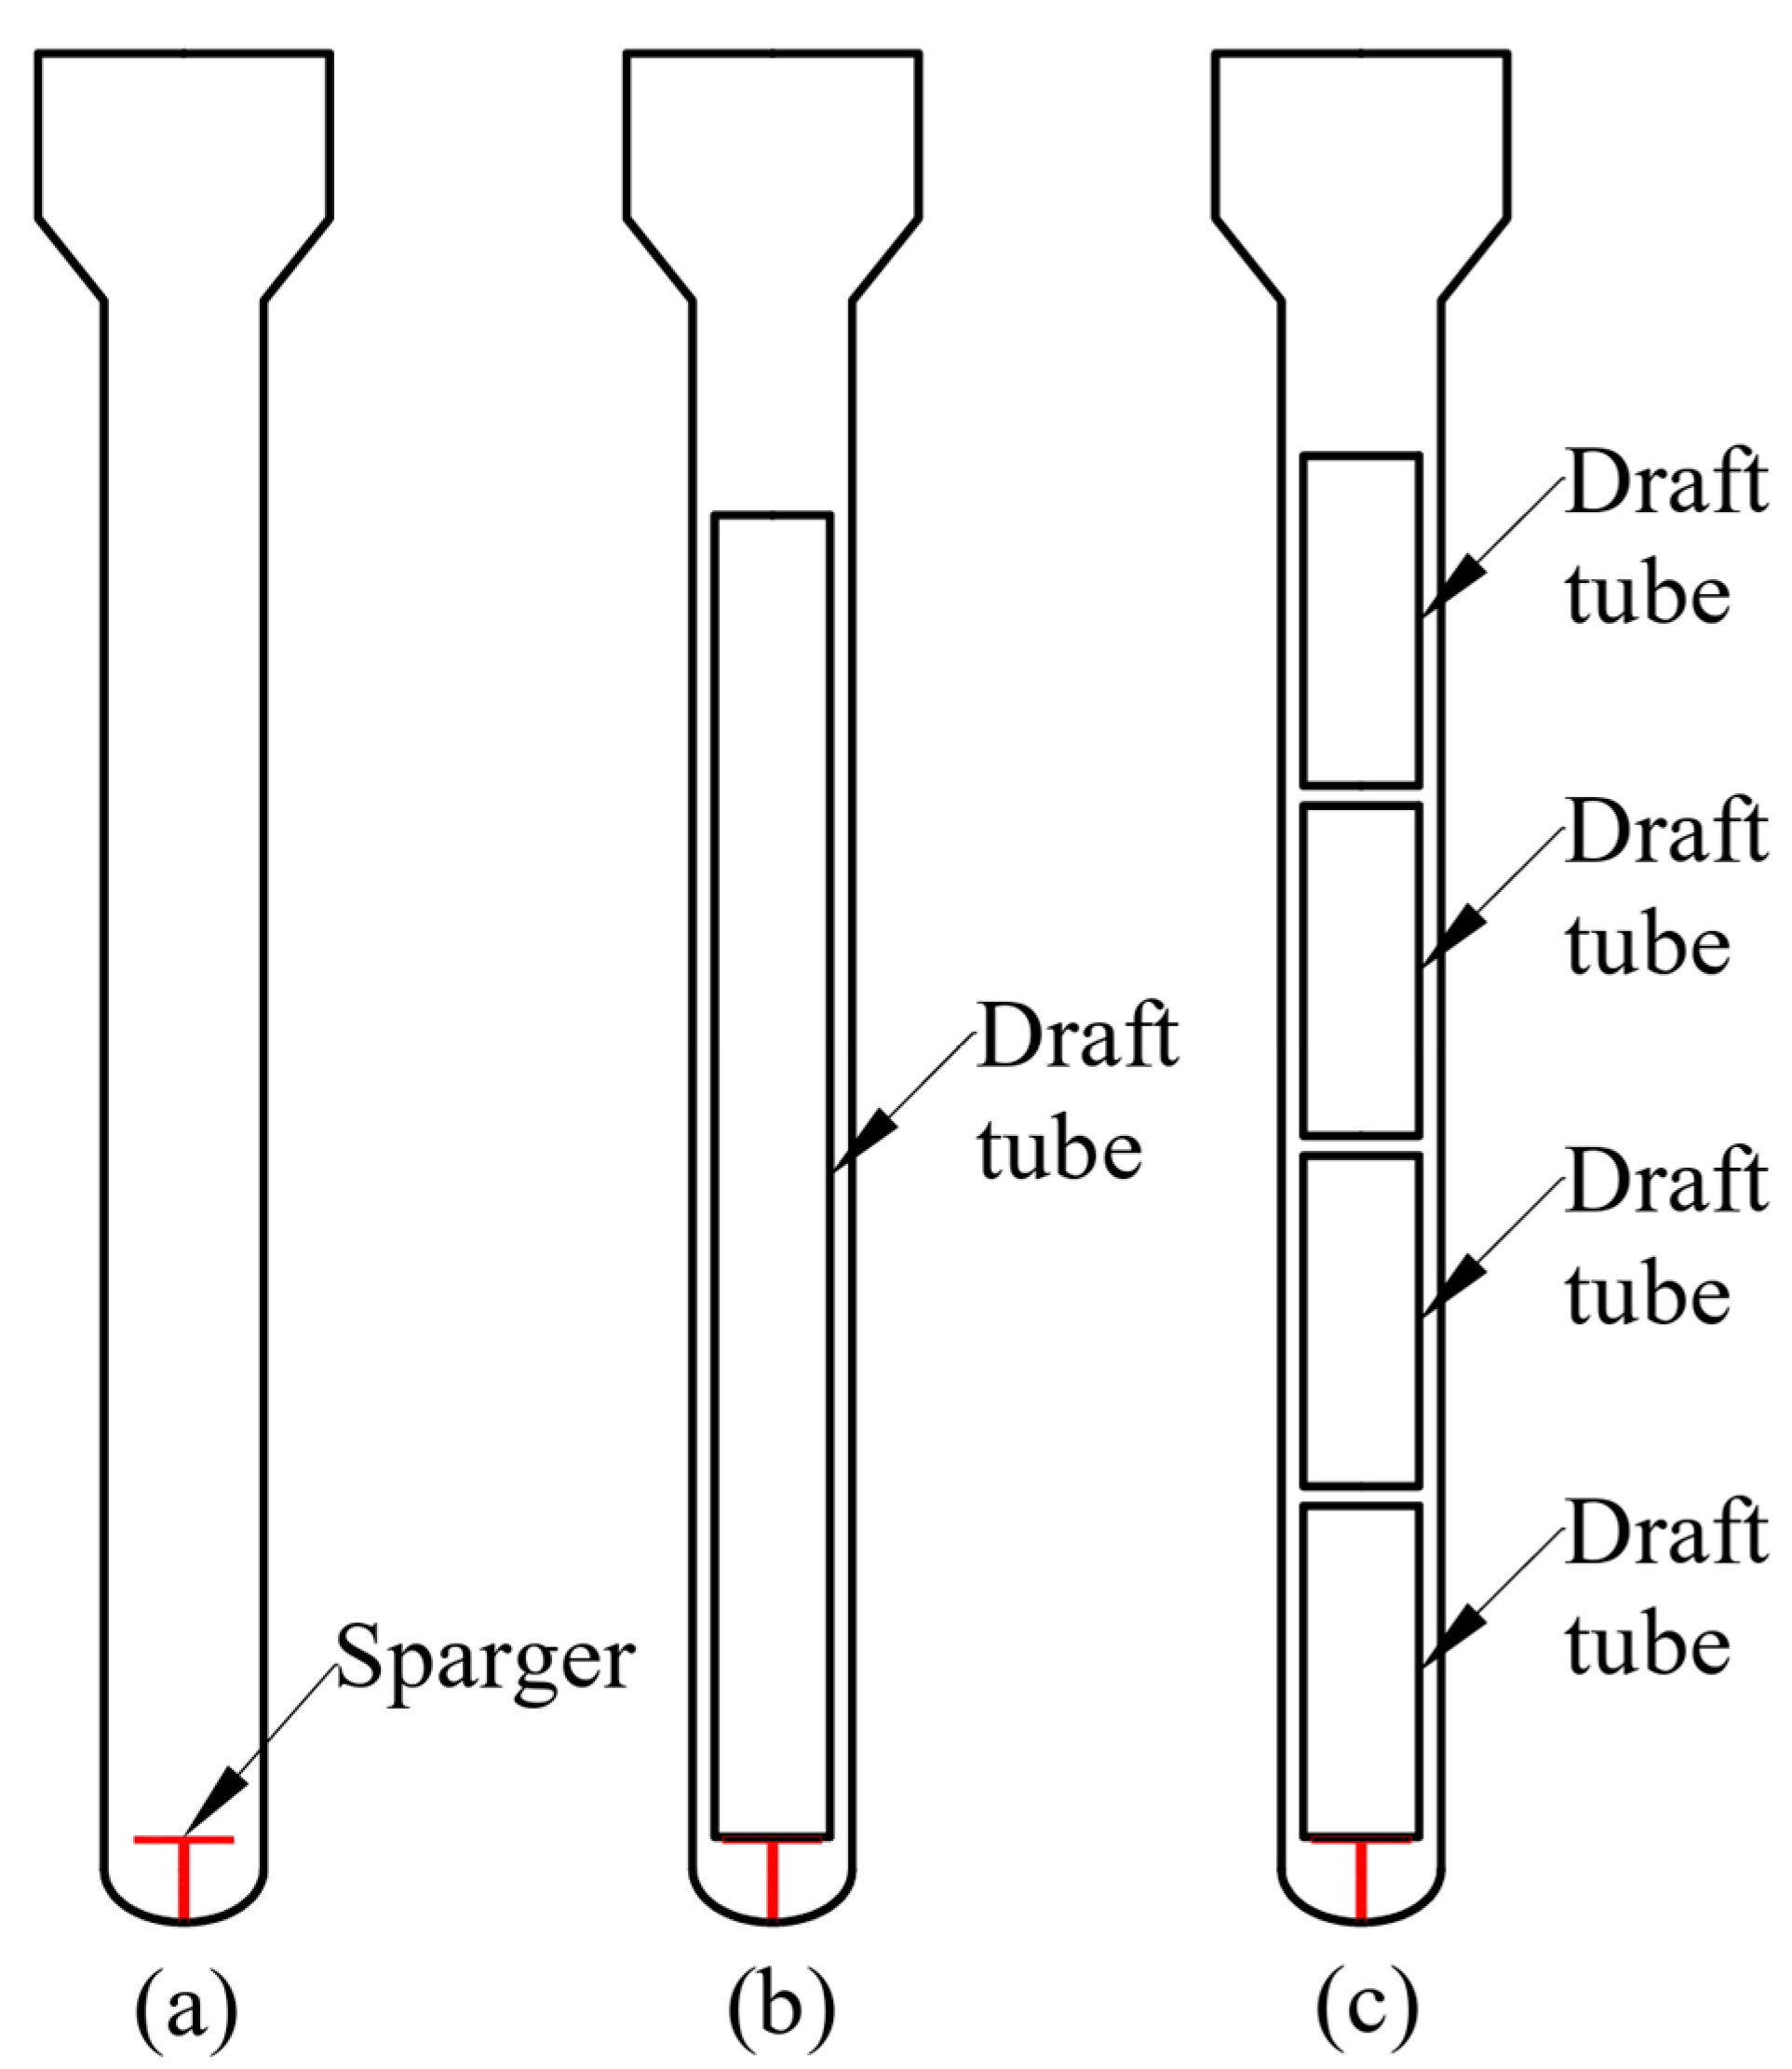
2. Experimental Work

The experimental apparatus is shown in Figure 1. The structures of the three reactors are displayed in Figure 2. The ILAR was constructed from transparent Plexiglas, with an inner diameter of 0.484 m and a height of 5.5 m. The outer diameter of the draft tube of the SSALR was 0.35 m, with a wall thickness of 5 mm and a length of 4 m. An FSALR was built by dividing the draft tube into four equal parts, with each segment length of 1 m and segment spacing of 6 cm. The same ladder distributor with an opening diameter of 1 mm was employed for all three reactor structures. Air and tap water were used as experimental media, and all experiments were carried out in a semi-batch operation, with continuous gas phase and intermittent liquid phase. Before each experiment, tap water in a water tank was injected into the reactor through a centrifugal pump, with the liquid level controlled at a height of 4.5 m. The air was compressed using a screw air compressor, and the flow rate was regulated with a rotameter. It was redistributed through the sparger at the bottom of the reactor and then entered the draft tube. All experiments were conducted at room temperature and atmospheric pressure. The superficial gas velocity is defined as the ratio of gas flow to the cross-sectional area of the reactor, that is, the linear velocity of gas. In order to comprehensively investigate the hydrodynamic characteristics in different flow regimes, the superficial gas velocity range was from 0.9 to 9.1 cm/s.
The overall gas holdup was measured using the differential pressure method. Ignoring the pressure difference caused by gas density, the overall gas holdup has the following relationship with the pressure difference between the two ends of the measuring point [29]:
ε = Δ P ρ L g H
where ε, ΔP, ρL, g, and H are the gas holdup, the pressure difference between two measuring points, the liquid density, the gravitational acceleration, and the height difference between the two measurement points, respectively.
The pressure difference was measured using high-precision pressure sensors and collected online through supporting software. The data collection frequency was 13 Hz, and the collection time was 2 min.
Local liquid velocity was measured using a modified Pavlov tube [30]. The measured pressure difference can be transformed into local liquid velocity according to the Bernoulli equation:
U L = ( i = 1 n 1 2 Δ P i ρ L i = n 1 + 1 n 2 ( Δ P i ) ρ L ) / n
where UL, n, and n1 represent local liquid velocity, the total number of data, and the number of positive values, respectively.
The volumetric mass transfer coefficient (kLa) was determined using the dissolved oxygen dynamic response curve method. In order to comprehensively investigate the mass transfer situation inside the reactor, two equally dissolved oxygen electrodes were used to measure kLa at different positions, with axial positions of 1.5 m and 3.5 m, respectively, i.e., H/D = 3.1 and H/D = 7.2. The radial positions were at the center and sidewall inside the reactor. The detailed experimental steps can be obtained from our previous research work [31]. Since temperature also has a significant impact on kLa, when the ambient temperature changes, correction can be performed using the following equation [32,33,34]:
k L a ( 20   ° C ) = k L a ( T ) 1.024 T 20
The mixing performance in ILARs is usually determined by mixing time. The mixing time is defined as the time required to reach a specific degree of homogeneity after a small amount of tracer is injected into the reactor. The definition of the degree of homogeneity (η) is as follows [35]:
1 η = | ( C C t ) / ( C C 0 ) |
where C0, C, and Ct represent the initial concentration of the tracer, the concentration after being completely mixed, and the instantaneous concentration, respectively.
The η parameter was 95% in this study. The mixing time was measured using the conductivity method. Considering the fact that the mixing time may change significantly with the detection position, four conductivity probes were arranged at different axial heights (H/D = 1.9, 4.5, 6.8, and 8.9) on the inner sidewall of the reactor to detect liquid conductivity. Figure 3 shows the results after the calibration of the four conductivity electrodes. It can be seen that there is a good linear relationship between conductivity and electrolyte concentration within the range of the experimental conditions, so it can indirectly represent the concentration of the tracer. When the two-phase gas–liquid flow reached a steady state in the reactor, a KCl solution was instantly injected into the top of the reactor, and the conductivity curve of the mixing process was recorded using the conductivity meters. The typical tracer concentration variation curve is depicted in Figure 4. Then, the mixing time was obtained using Equation (4).

3. Results and Discussion
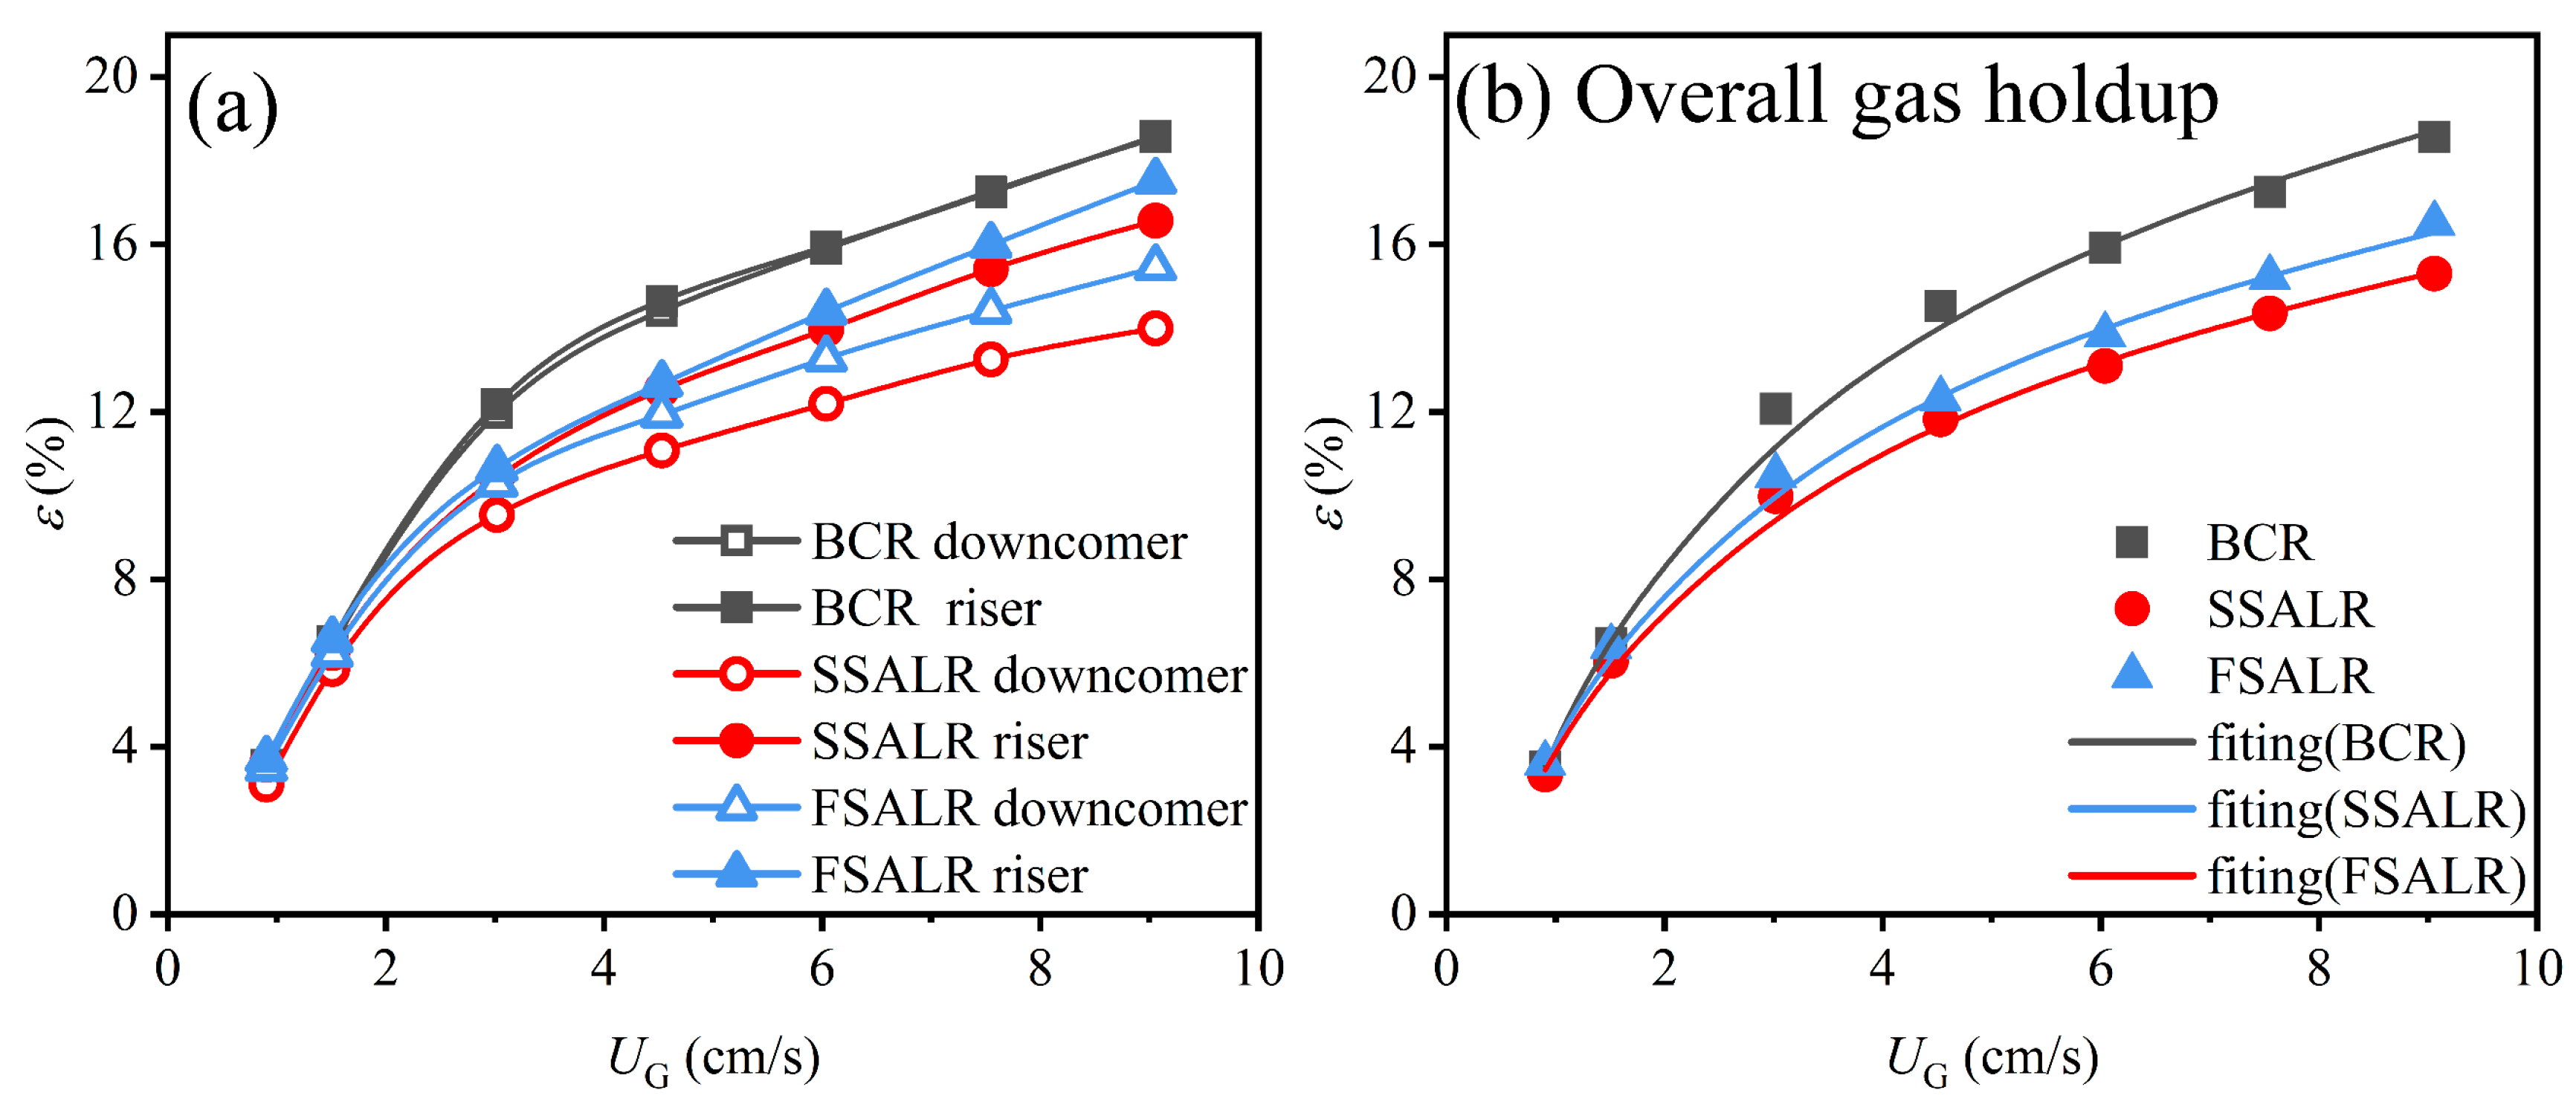
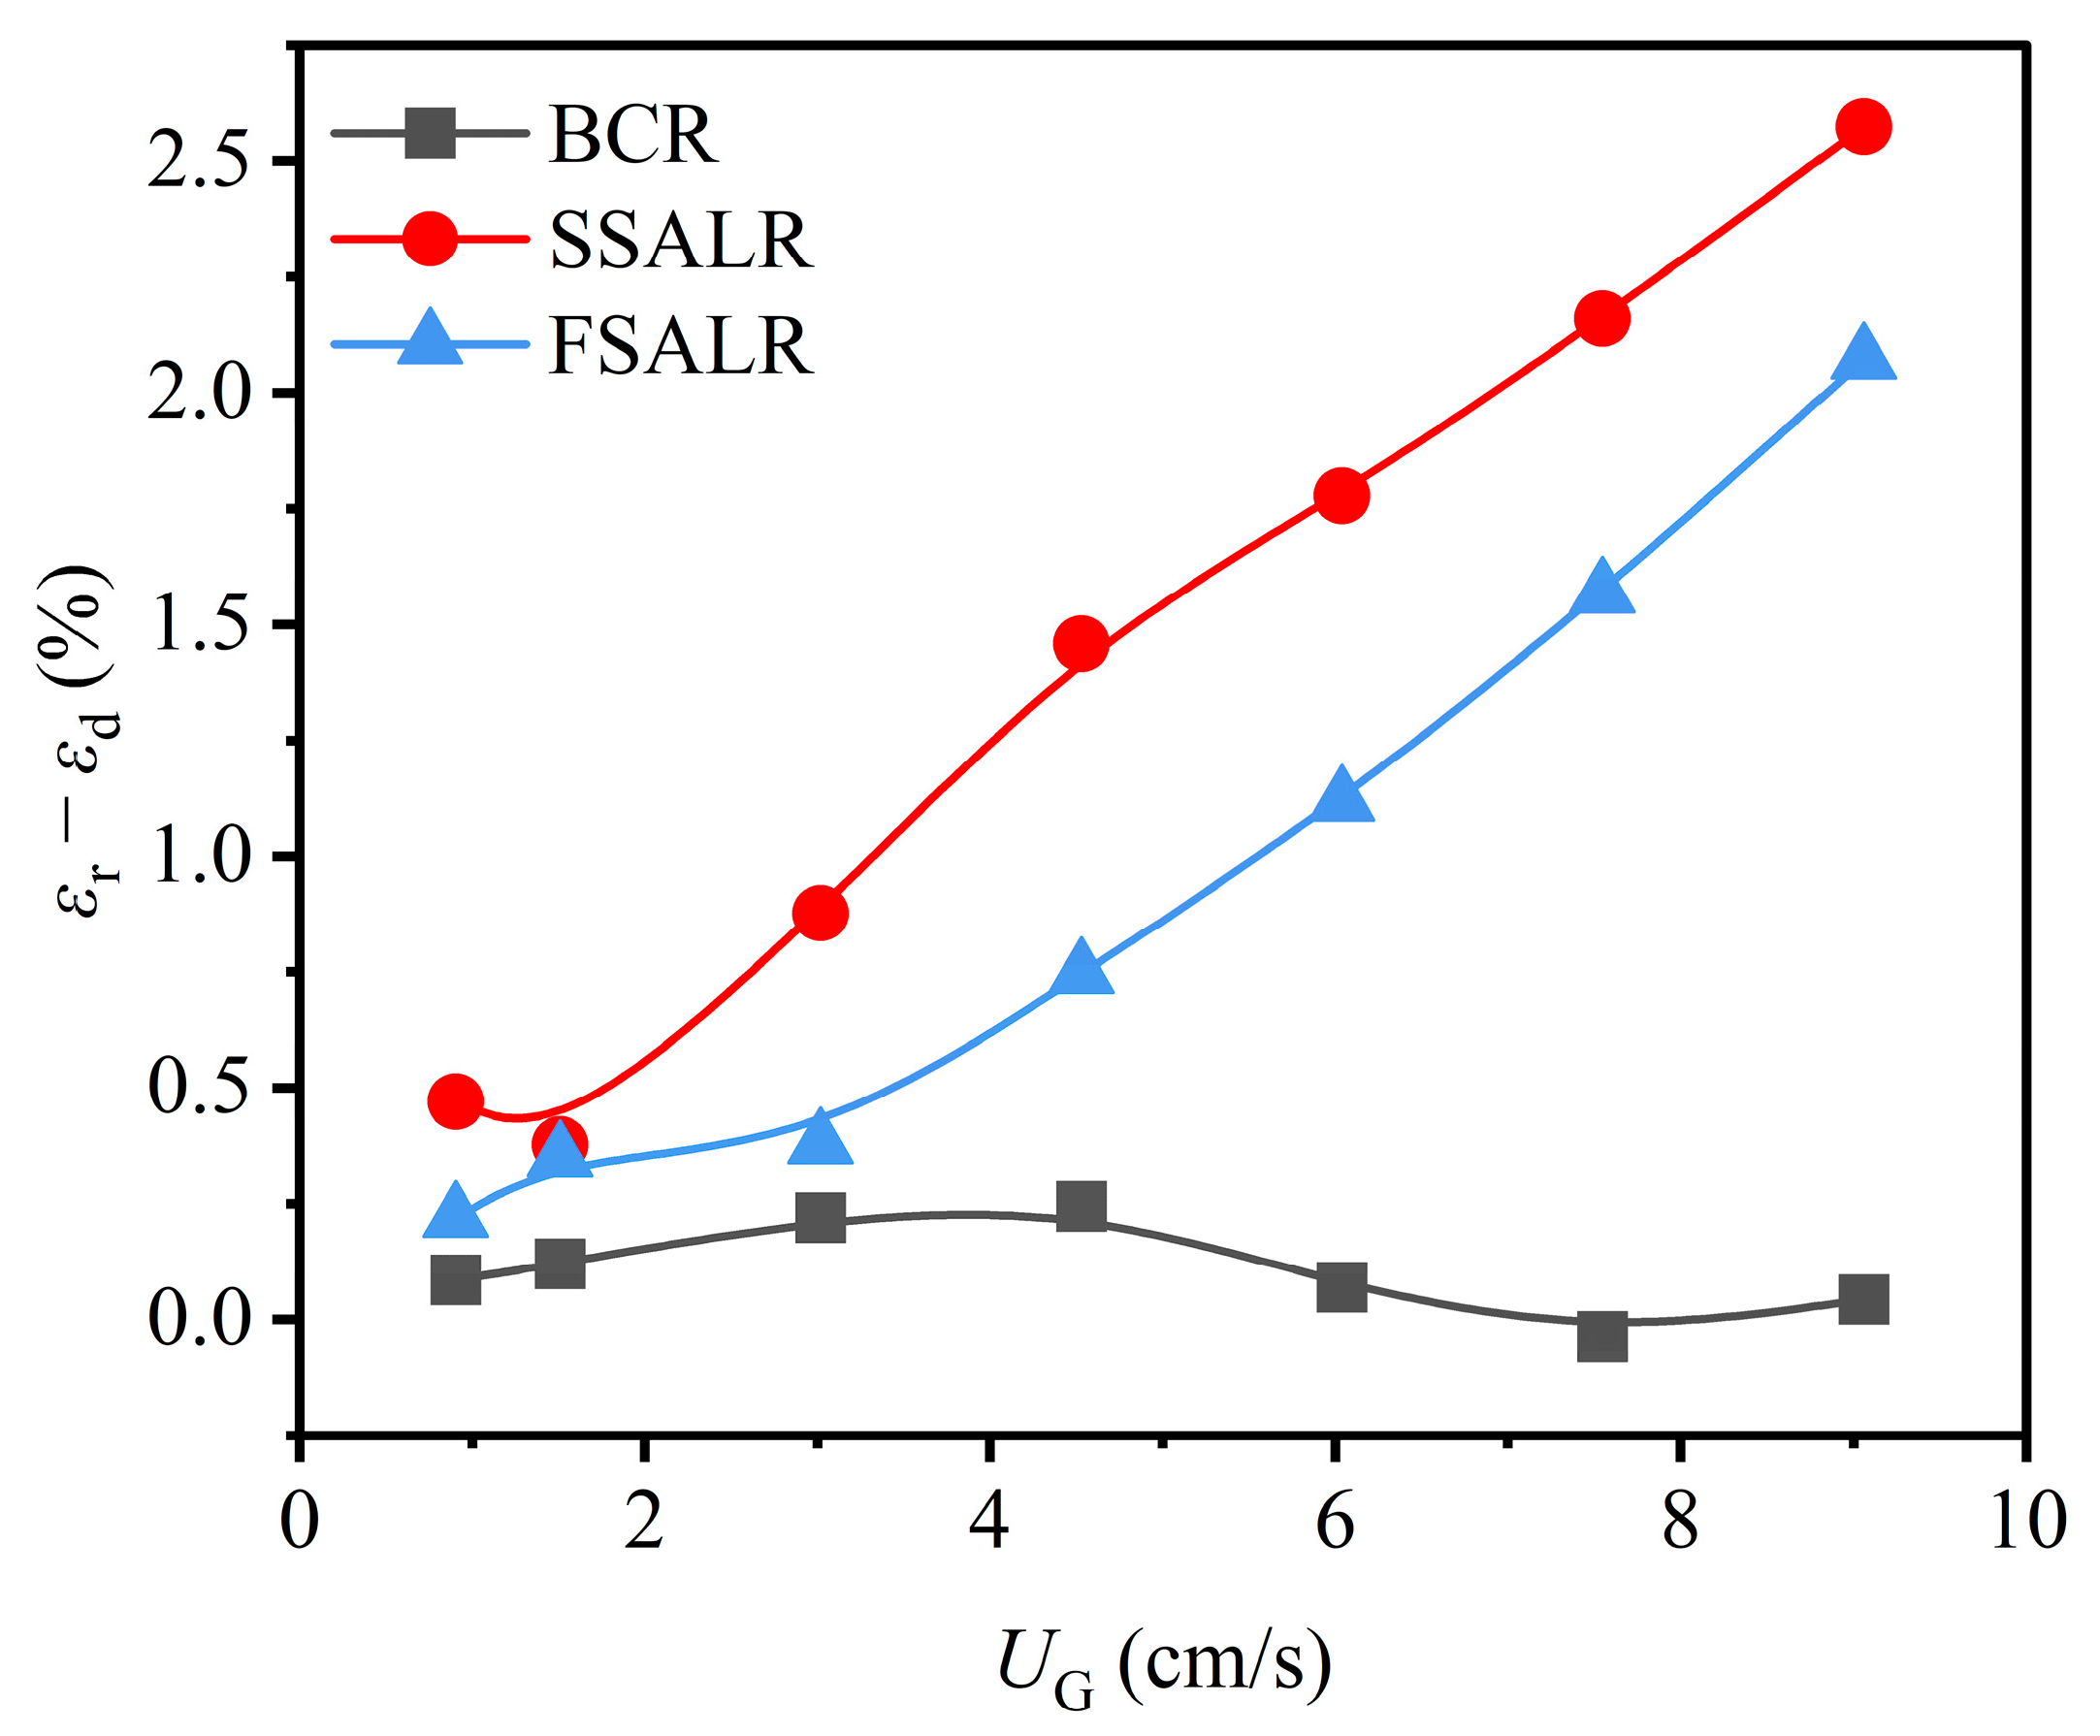
3.1. Gas Holdup

The gas holdup in the riser and downcomer of the three reactors is shown in Figure 5a. The change in the slope of the gas holdup curve can be used to determine the regime transition, which has been widely recognized [36]. It can be clearly seen from Figure 5a that the slope of the gas holdup curve changes significantly near UG = 4.0 cm/s. This indicates that, for the three reactors, the regime transition point may be at around UG = 4.0 cm/s. At low superficial gas velocities (i.e., flow in the homogeneous regime.), there is no signifi-cant difference in gas holdup among the three reactors. When the superficial gas velocity increased to 3.0 cm/s, the gas holdup difference began to become prominent, and as the gas velocity further increased, the difference became more significant. Whether in the riser or the downcomer, the degree of difference in gas holdup is ranked as follows: BCR > FS > SSALR. The introduction of a draft tube decreased the gas holdup inside the BCR, while in the multistage structure, the gas holdup increased in the riser and downcomer compared with the SSALR. In the heterogeneous regime (UG > 4.0 cm/s), the overall gas holdup in the riser of the FSALR increased by an average of 3.4% compared with the SSALR, while the overall gas holdup in the downcomer increased by an average of 9.0%. Segmenting the draft tube could significantly increase the gas holdup in the downcomer. This conclusion is also consistent with relevant research [15].
The overall gas holdup of the whole reactor was obtained using the weighted average of the gas holdup of each section, as depicted in Figure 5b. At lower superficial gas velocities (UG < 3.0 cm/s), slight differences were observed in the gas holdup among the three reactors, and the influence of internals was not significant. At higher superficial gas velocities (UG > 3.0 cm/s), the gas holdup of the BCR was on average about 14.8% higher than that of the FSALR and about 21.6% higher than that of the SSALR. The gas holdup of the FSALR was on average about 6.1% higher than that of the SSALR, with the largest increase reaching 7.8% when UG = 9.1 cm/s. This indicates that the influence of the multistage structure becomes more prominent with a further increase in gas velocity. The empirical correlations regarding the overall gas holdup of the reactors were developed, as detailed in Table 1.
Considering the fact that the liquid circulating velocity of the ILAR is mainly determined by the gas holdup difference, further analysis was conducted on the gas holdup differences between the riser and downcomer of the three reactors, as depicted in Figure 6.
The comparison revealed that the SSALR had the largest gas holdup difference, followed by the FSALR, and the BCR had the smallest difference in gas holdup. It is worth noting that the gas holdup differences among the three reactors in the homogeneous regime slowly increased with the superficial gas velocity. However, in the heterogeneous regime (UG > 4.0 cm/s), the gas holdup differences between the two airlift reactors increased approximately linearly with the superficial gas velocity. A larger difference in the gas holdup is beneficial for providing a larger driving force for liquid circulation, and it also indicates that regime transition has a significant impact on the gas holdup difference.

3.2. Liquid Circulating Velocity

The liquid circulating velocity of the whole reactor was obtained via integral processing using the axial liquid velocities at three axial heights and different radial positions, as depicted in Figure 7. It can be seen that in all superficial gas velocity ranges (0.9 cm/s < UG < 9.1 cm/s), the liquid circulating velocity of the three reactors increased with the increase in superficial gas velocity. The FSALR had the highest liquid circulating velocity, followed by the SSALR, and the BCR had the lowest. It is worth mentioning that, at lower superficial gas velocities, the two airlift reactors had faster liquid circulating velocities than the BCR. In practical industrial applications, such as wastewater treatment and fermentation, a higher liquid circulating velocity is conducive to the complete suspension of solid particles in the reactor, which raises the upper limit on acceptable solid holdup. Thereby, compared with a bubble column reactor and SSALR, a multistage ILAR may be a better choice in the three-phase system. The improvement effect of ILAR on liquid circulating velocity is evident in the results presented in Table 2. Within the superficial gas velocity range (0.9 cm/s < UG < 9.1 cm/s), the liquid circulating velocity of the FSALR increased by an average of 134.1% compared with the BCR and 15.8% compared with the SSALR. This fully demonstrates that the multistage structure intensified the internal circulation in the reactor, resulting in a higher liquid circulation flow rate and a flow state closer to CSTR.
It can also be seen from Figure 7 that the flow regime transition has a significant impact on the liquid circulating velocity. As the superficial gas velocity increased, the slope of the liquid circulating velocity curve changed significantly at UG = 4 cm/s. This phenomenon is consistent with the change in the slope of the gas holdup curve (Figure 5). Under a heterogeneous regime, as the superficial gas velocity increased, the gas holdup in both the riser and downcomer increased. However, due to the influence of the separator and the relatively small amount of gas entering the downcomer, the gas holdup differences increased, as shown in Figure 6. The driving force of the liquid circulating increased, and the liquid circulating velocity increased accordingly. As the liquid velocity continued to increase, more bubbles were entrained into the downcomer, causing an increase in liquid flow resistance and ultimately leading to a decrease in the slope of the liquid circulating velocity curve.
Interestingly, it can be observed from Figure 6 that the gas holdup difference of the FSALR is smaller than that of the SSALR, while the FSALR has a faster liquid circulating velocity. This may be related to the lower flow resistance of the FSALR. Relevant studies have indicated that, for industrial-scale loop airlift reactors, the liquid circulating velocity is mainly controlled with flow resistance [37]. Compared with the SSALR, the fluid flow in the FSALR is more complex, as it involves the overall circulation coupled with the internal circulation within each stage. This allows the fluid to achieve circulation within each stage without having to overcome more resistance. The empirical correlations regarding the liquid circulating velocity were proposed by fitting experimental data, as listed in Table 3.

3.3. Volumetric Mass Transfer Coefficient
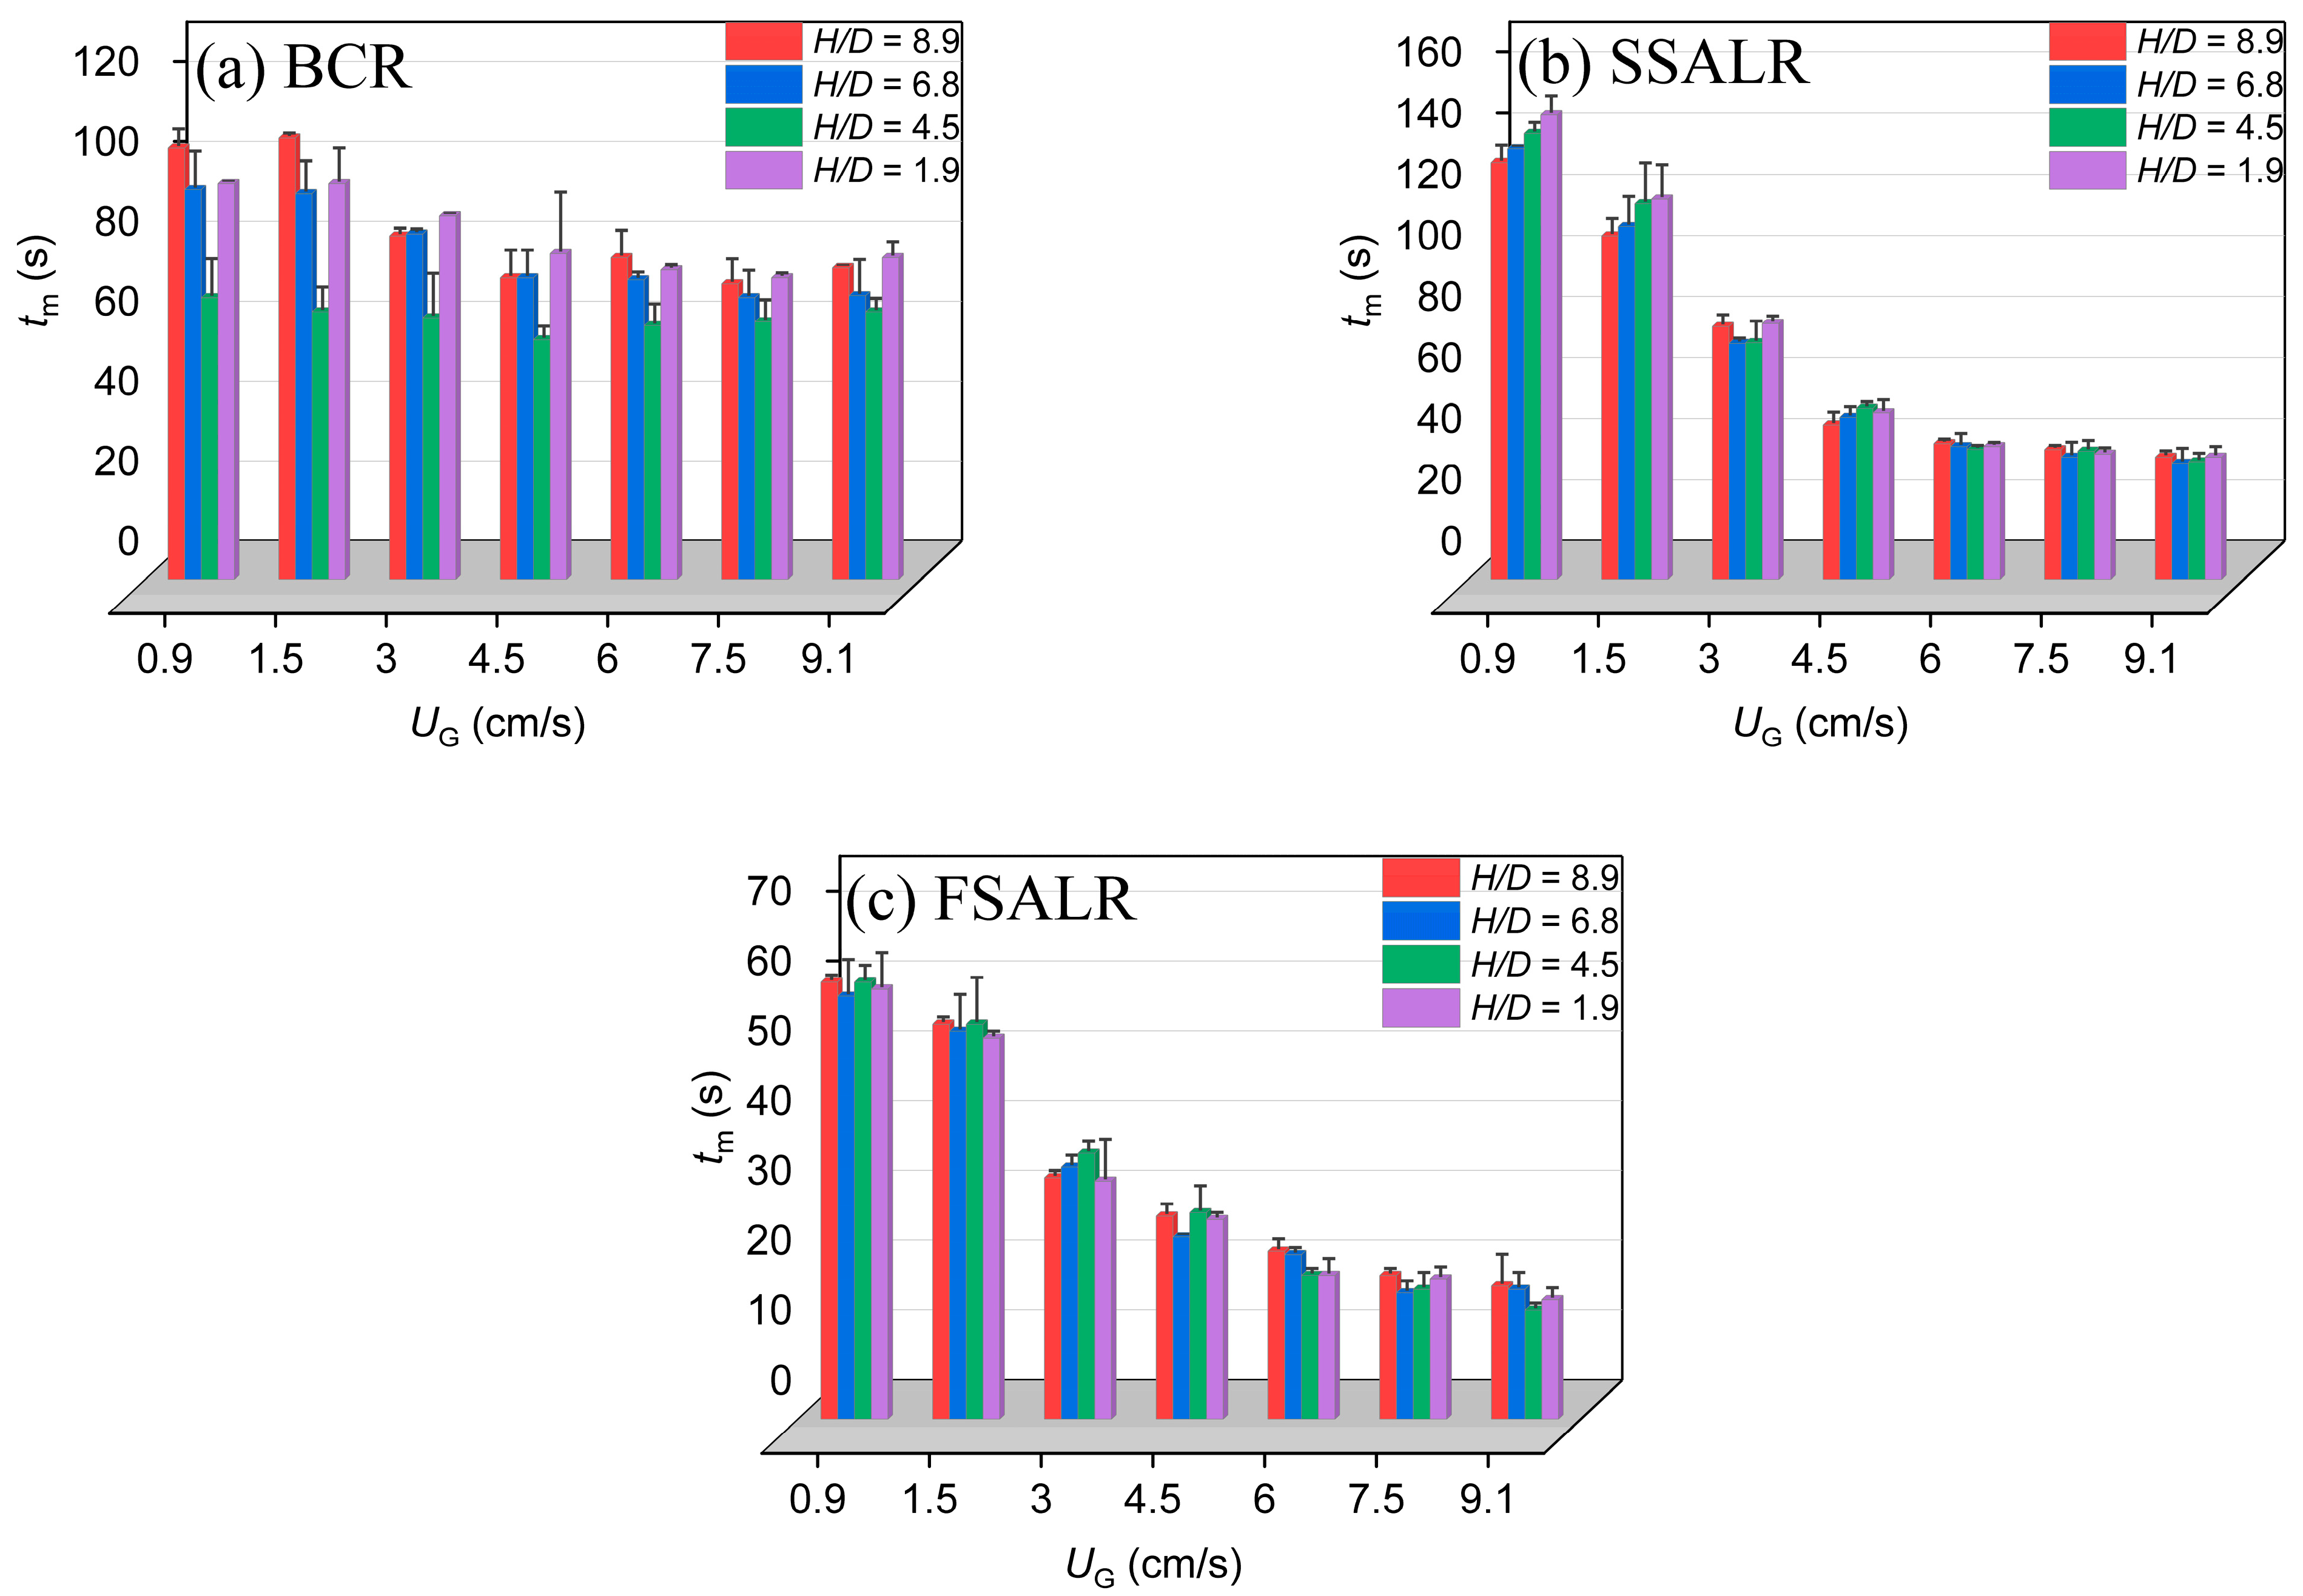
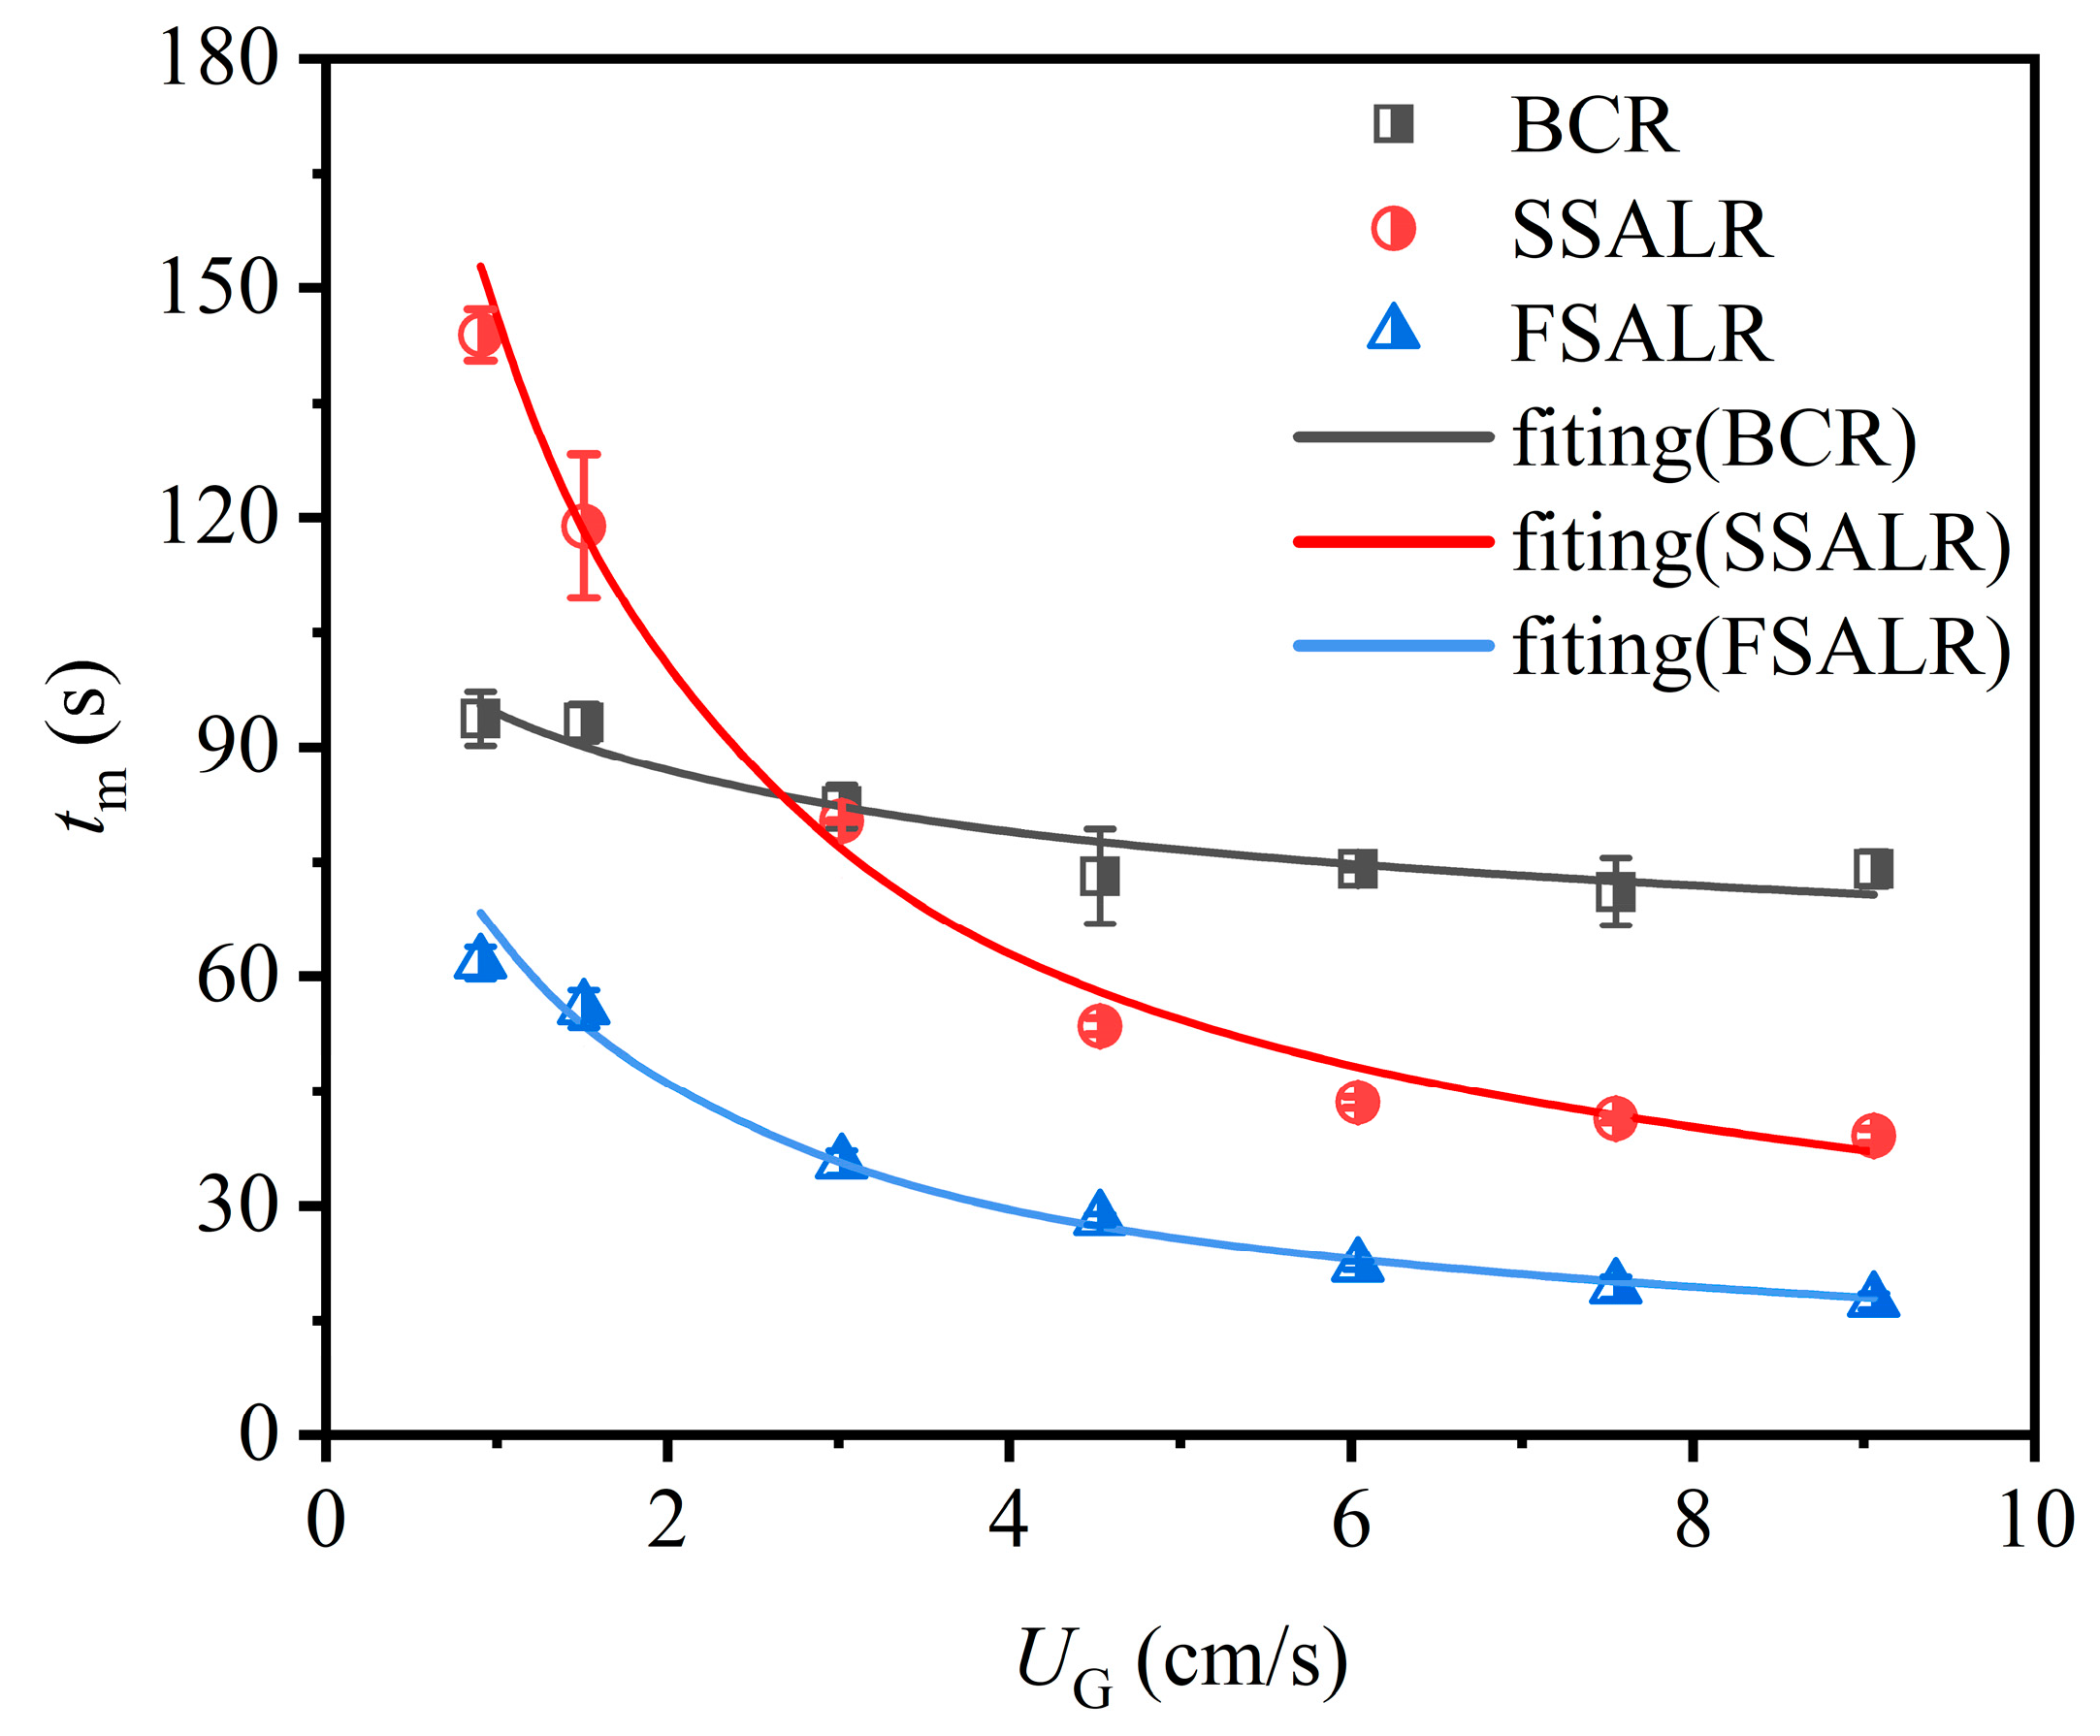
The kLa in the riser and downcomer of the three reactors are shown in Figure 8. At any superficial gas velocity, the kLa of the BCR was the highest, followed by that of the FSALR, and the kLa of the SSALR was the lowest. Similar conclusions were obtained in relevant studies [38,39]. This may be because the BCR had a long bubble residence time, leading to the highest gas holdup. Higher gas holdup often means larger gas–liquid interface area a, and kLa is mainly determined by a. Although the ILAR had faster liquid circulating velocity in the axial direction, the strong circulating flow also led to faster bubble rise velocity, shorter bubble residence time, and a reduction in a, thereby reducing the mass transfer rate. The ILAR has been widely used in sewage treatment due to low energy consumption and the ease of scale-up. Generally, the process involves an oxidation reaction, and the oxygen transfer in water is the limiting step. The faster oxygen transfer rate means lower mass transfer resistance, which is more conducive to the process intensification. These results show that the mass transfer coefficient can be improved by segmenting the draft tube. This finding can provide guidance for the development and design of the reactor in sewage treatment.
Gas holdup and liquid velocity are two key factors affecting the mass transfer rate, but sometimes, they do not synergistically promote the enhancement of mass transfer. Compared with the FSALR, the BCR had a higher gas holdup (14.8% higher than the FSALR) at a higher superficial gas velocity (UG > 3.0 cm/s) but a lower liquid circulating velocity (134.1% lower than the FSALR). This phenomenon indicates that a significantly high liquid circulating velocity may lead to a reduction in the gas holdup and mass transfer interface in the reactor, which is unfavorable to the enhancement of mass transfer. Therefore, in the process of reactor development, blindly pursuing parameter optimization may cause adverse effects, and the relationship among various parameters should be comprehensively considered to seek the optimal solution.
In addition, compared with the SSALR, the kLa in the riser of the FSALR increased by 10.2% on average within the range of superficial gas velocity (0.9 cm/s < UG < 9.1 cm/s), and that in the downcomer increased by 9.3% on average. This is because the FSALR has a higher gas holdup and faster liquid circulating velocity, which causes a larger mass transfer interface and stronger turbulence degree in the FSALR, which is also conducive to faster phase interface refreshing. This shows that the mass transfer process can be enhanced through the optimization of the internals. The average kLa of the whole reactor was obtained using the arithmetic mean of the kLa in the riser and the downcomer. The empirical correlations of the average mass transfer coefficients of the three reactors with respect to the superficial gas velocity were proposed using the least square fitting method, as listed in Table 4.

3.4. Mixing Time

The influence of measurement position on mixing time is shown in Figure 9. For the BCR, when UG < 3 cm/s, significant differences were found in the mixing times for the four measurement positions due to the uneven mixing in the reactor. This may be related to the fact that the fluid flow is in a homogeneous regime, and the circulation intensity is low. It is worth mentioning that the mixing time at the axial height H/D = 4.5 was always the minimum and was maintained at about 60 s. This position was located in the middle of the reactor, which may have stronger local circulation. For the SSALR, when UG < 3 cm/s, the mixing time at the four measurement positions increased with the decrease in axial measurement height. The liquid flow in the SSALR mainly involved the overall circulation, that is, the liquid flows upward in the riser and downward in the downcomer. As the tracer was injected from the top of the reactor, the lower the axial position, the farther the position from the injection point, the longer the path of the tracer, and the longer the time needed for being sufficiently mixed. With the increase in the superficial gas velocity (UG > 4.5 cm/s), and thus more intense circulating flow in the reactor, the influence of the measurement position became undiscernible, that is, the mixing times of the four measurement positions were very close, and the variance was less than 5.5 s. This shows that, in the heterogeneous regime, the mixing state in the SSALR was closer to that of the CSTR than to that of the BCR. For the FSALR, the mixing times at the four measuring positions were very close even at low superficial gas velocity. The variance of the mixing time at the four measuring positions in all ranges of superficial gas velocities was less than 3.6 s. This shows that the FSALR further improved the liquid circulation flow state in the reactor, and the mixing state of the FSALR approached that of the CSTR.
It was reported that the measurement position has an important impact on the mixing time [40]. The mixing time near the tracer injection position was shorter, and the mixing time away from the injection point was longer. However, this phenomenon was only found in the SSALR at low superficial gas velocity. This indicates that the differences among the various research conclusions may be related to the operating gas velocity and the reactor scale, that is, the result of the scale-up effect.
To summarize, the influence of the measurement position on the mixing time is different due to the differences in the structures of the three reactors. The measurement position had the greatest influence on the measurement of the mixing time of the BCR, and the mixing times obtained from different measurement positions were significantly different. The measurement position had the least influence on the measurement of the mixing time of the FSALR. This shows that the addition of a draft tube makes the mixing state in the reactor closer to that of the CSTR and strengthens the mixing effect.
The influence of the three reactor structures on the mixing time was further compared, and the arithmetic average of the mixing time at the four measurement positions was taken as the mixing time under the corresponding experimental conditions. The results are illustrated in Figure 10.
It can be seen that, for the two-loop airlift reactor, the mixing time decreased with the increase in the superficial gas velocity, and the slope of the curve changed at UG = 4.0 cm/s, due to the flow regime transition in the reactor. This indicates that the mixing time in the homogenous regime is more sensitive to the superficial gas velocity. In the range of 4.0 cm/s < UG < 9.1 cm/s, the mixing time of the FSALR was 51.3% less than that of the SSALR and 70.2% less than that of the BCR. This fully illustrates that a multistage draft tube structure can significantly improve the mixing effect in the reactor due to the faster liquid circulating velocity and additional axial mixing; that is, the four-stage structure is closer to the CSTR.
At a higher superficial gas velocity, the mixing time of the three reactors tended to be a stable value. This indicates that there is a critical superficial gas velocity for a reactor structure. When the gas velocity exceeds this critical value, the mixing time tends to be stable and does not vary with gas velocity. Sánchez et al. [41] also reported this phenomenon. For the two ILARs in this study, the critical gas velocity was about 10.0 cm/s. In addition, this also shows that the mixing effect can only be improved through structural optimization when the superficial gas velocity exceeds the critical gas velocity.
At a lower superficial gas velocity (UG < 4 cm/s), the mixing time of the BCR slightly decreased with the increase in gas velocity. When the gas velocity increased further, the mixing time of the BCR did not show a clear decreasing association with the superficial gas velocity; that is, the mixing time of the BCR remained almost unchanged at the higher superficial gas velocity. Some studies also observed this phenomenon [40,42]. In the heterogeneous regime, the local circulation in the BCR was more intense than the large-scale global circulation, and the strong local circulation interfered with the global circulation. This also shows that the addition of a draft tube inhibits the radial mixing and promotes the global circulation in the reactor. It is worth noting that in the homogenous regime, the mixing time of the BCR was lower than that of the SSALR, and the mixing time curves of the two reactors coincide around 3 cm/s. This is because the draft tube restricted the mixing in the radial position, and the mixing in the axial position was not significant, while the BCR had relatively strong radial mixing. Meanwhile, this also illustrates that the mixing in the SSALR mainly depends on global circulation. With the increase in gas velocity, the axial circulation of the liquid phase intensified, and the tracer was mixed uniformly in a shorter time. The empirical correlation of the mixing time regarding the three reactors was obtained by fitting the experimental data, and the results are listed in Table 5.

4. Conclusions

In order to investigate the impact of draft tube structures on mass transfer and mixing performance in a pilot-scale ILAR, the gas holdup, liquid circulating velocity, kLa, and mixing time of three reactor structures (BCR, SSALR, and FSALR) were systematically studied in experiments. Experimental results demonstrated that the BCR had higher gas holdup and kLa values. The gas holdup and kLa decreased due to the rapid escape of bubbles caused by the introduction of the draft tube. The single-stage draft tube was axially segmented to build an FSALR, which increased the gas holdup in the reactor, particularly in the downcomer by 9%. Furthermore, compared with the SSALR, the kLa in the riser of the FSALR increased by 10.2% on average, while that in the downcomer increased by 9.3% on average. The FSALR had the fastest liquid circulating velocity due to its lower circulating resistance. The liquid circulating velocity of the FSALR was 134.1% higher than that of the BCR and 15.8% higher than that of the SSALR. The mixing effect of the FSALR was the best because of its faster liquid circulating velocity and more effective axial and radial mixing, which is close to the CSTR. Specifically, the mixing time experiment illustrated that the mixing time in the BCR was seriously affected by the measurement position, while it was the least affected in the FSALR. In the heterogenous regime, the mixing time of the FSALR was reduced by 70.2% on average compared with the BCR and 51.3% compared with the SSALR. The empirical correlations were developed for gas holdup, liquid circulating velocity, kLa, and mixing time with respect to the superficial gas velocity, which fit the experimental data well.

Author Contributions

Methodology, Z.H.; Validation, P.Y.; Investigation, Z.W.; Writing – original draft, Z.W.; Writing – review & editing, Z.C. and P.Y.; Supervision, Z.H.; Project administration, Z.C. All authors have read and agreed to the published version of the manuscript.

Funding

This research was funded by National Energy R&D Center of Petroleum Refining Technology (No. 33600000-22-ZC0607-0017), the National Key R&D Program of China (No. 2019YFC1906705), Central University First-Class Discipline Guidance Special Project (SLA00231209), and National Natural Science Foundation of China (No. 22178113).

Data Availability Statement

Data can be provided by the request for author.

Conflicts of Interest

The authors declare no conflict of interest.

Abbreviations

aMass transfer area: m2∙m−3
DInner diameter of column, m
gGravitational acceleration, m∙s−2
HHeight, m
kLLiquid side mass transfer coefficient, m∙s−1
PPressure, Pa
r/RDimensionless radial position, dimensionless
tTime, s
tmMixing time, s
UcirCirculating liquid velocity, m∙s−1
UGSuperficial gas velocity, cm∙s−1
Greek letters
εGas holdup, dimensionless
ηDegree of macro-mixing, dimensionless
ρDensity, kg∙m−3
Subscripts
GGas
dDowncomer
LLiquid
rRiser

References

  1. Behin, J.; Amiri, P. A review of recent advances in airlift reactors technology with emphasis on environmental remediation. J. Environ. Manag. 2023, 335, 117560–117583. [Google Scholar] [CrossRef]
  2. Yang, H.; Chen, A.; Geng, S.; Cheng, J.; Gao, F.; Huang, Q.; Yang, C. Influences of fluid physical properties, solid particles, and operating conditions on the hydrodynamics in slurry reactors. Chin. J. Chem. Eng. 2022, 44, 51–71. [Google Scholar] [CrossRef]
  3. Li, L.; Xu, X.; Wang, W.; Lau, R.; Wang, C.H. Hydrodynamics and mass transfer of concentric-tube internal loop airlift reactors: A review. Bioresour. Technol. 2022, 359, 127451–127469. [Google Scholar] [CrossRef] [PubMed]
  4. Bergault, I.; Rajashekharam, M.V.; Chaudhari, R.V.; Schweich, D.; Delmas, H. Modeling and comparison of acetophenone hydrogenation in trickle-bed and slurry airlift reactors. Chem. Eng. Sci. 1997, 52, 4033–4043. [Google Scholar] [CrossRef]
  5. Zhang, T.; Huang, Q.; Geng, S.; Chen, A.; Liu, Y.; Zhang, H. Impacts of solid physical properties on the performances of a slurry external airlift loop reactor integrating mixing and separation. Chin. J. Chem. Eng. 2023, 55, 1–12. [Google Scholar] [CrossRef]
  6. Huang, Q.; Zhang, W.; Yang, C. Modeling transport phenomena and reactions in a pilot slurry airlift loop reactor for direct coal liquefaction. Chem. Eng. Sci. 2015, 135, 441–451. [Google Scholar] [CrossRef]
  7. Li, G.; Chen, K.; Wei, Y.; Zeng, J.; Yang, Y.; He, F.; Li, H.; Ouyang, P. Mass transfer, gas holdup, and kinetic models of batch and continuous fermentation in a novel rectangular dynamic membrane airlift bioreactor. Engineering 2022, 13, 153–163. [Google Scholar] [CrossRef]
  8. Lohwacharin, J.; Annachhatre, A.P. Biological sulfide oxidation in an airlift bioreactor. Bioresour. Technol. 2010, 101, 2114–2120. [Google Scholar] [CrossRef]
  9. Chen, Z.; Min, H.; Hu, D.; Wang, H.; Zhao, Y.; Cui, Y.; Zou, X.; Wu, P.; Ge, H.; Luo, K.; et al. Performance of a novel multiple draft tubes airlift loop membrane bioreactor to treat ampicillin pharmaceutical wastewater under different temperatures. Chem. Eng. J. 2020, 380, 122521–122534. [Google Scholar] [CrossRef]
  10. Xu, P.; Wei, Y.; Ma, C.; Li, S.; Guo, T.; Wang, X.; Li, W. Multi-factorial analysis of the removal of dichloromethane and toluene in an airlift packing bioreactor. J. Environ. Manag. 2020, 261, 109665–109672. [Google Scholar] [CrossRef]
  11. Tao, J.; Huang, J.; Geng, S.; Gao, F.; He, T.; Huang, Q. Experimental investigation of hydrodynamics and mass transfer in a slurry multistage internal airlift loop reactor. Chem. Eng. J. 2020, 386, 122769–122778. [Google Scholar] [CrossRef]
  12. Li, D.; Guo, K.; Li, J.; Huang, Y.; Zhou, J.; Liu, H.; Liu, C. Hydrodynamics and bubble behaviour in a three-phase two-stage internal loop airlift reactor. Chin. J. Chem. Eng. 2018, 26, 1359–1369. [Google Scholar] [CrossRef]
  13. Ramonet, F.; Haddadi, B.; Harasek, M. Optimal Design of Double Stage Internal Loop Air-Lift Bioreactor. Energies 2023, 16, 3267. [Google Scholar] [CrossRef]
  14. Ramonet, F.; Haddadi, B.; Jordan, C.; Harasek, M. Modelling and Design of Optimal Internal Loop Air-Lift Reactor Configurations Through Computational Fluid Dynamics. Chem. Eng. Trans. 2022, 94, 817–822. [Google Scholar]
  15. Shi, J.; Guo, K.; Wang, Z.; Zheng, L.; Liu, H.; Xiang, W.; Liu, C.; Li, X. Computational fluid dynamics simulation of hydrodynamics in a two-stage internal loop airlift reactor with contraction-expansion guide vane. ACS Omega 2021, 6, 6981–6995. [Google Scholar] [CrossRef] [PubMed]
  16. Zhang, X.; Guo, K.; Qi, W.; Zhang, T.; Liu, C. Gas holdup, bubble behaviour, and mass transfer characteristics in a two-stage internal loop airlift reactor with different screens. Can. J. Chem. Eng. 2017, 95, 1202–1212. [Google Scholar] [CrossRef]
  17. Li, S.; Qi, T. Hydrodynamics and flow regimes of a multi-stage internal airlift loop reactor. Mater. Focus 2014, 3, 205–210. [Google Scholar] [CrossRef]
  18. Li, S.; Qi, T.; Zhang, Y.; Liu, C. Hydrodynamics of a Multi-Stage Internal Loop Airlift Reactor. Chem. Eng. Technol. 2009, 32, 80–85. [Google Scholar] [CrossRef]
  19. Zuber, N.; Findlay, J.A. Average volumetric concentration in two-phase flow systems. J. Heat Transfer. 1965, 87, 453–468. [Google Scholar] [CrossRef]
  20. Behin, J. Modeling of modified airlift loop reactor with a concentric double-draft tube. Chem. Eng. Res. Des. 2010, 88, 919–927. [Google Scholar] [CrossRef]
  21. Yu, W.; Wang, T.; Liu, M.; Wang, Z. Liquid Backmixing and Particle Distribution in a Novel Multistage Internal-Loop Airlift Slurry Reactor. Ind. Eng. Chem. Res. 2008, 47, 3974–3982. [Google Scholar] [CrossRef]
  22. Yu, W.; Wang, T.; Liu, M.; Wang, Z. Bubble circulation regimes in a multi-stage internal-loop airlift reactor. Chem. Eng. J. 2008, 142, 301–308. [Google Scholar] [CrossRef]
  23. Yu, W.; Wang, T.; Song, F.; Wang, Z. Investigation of the Gas Layer Height in a Multistage Internal-Loop Airlift Reactor. Ind. Eng. Chem. Res. 2009, 48, 9278–9285. [Google Scholar] [CrossRef]
  24. Yu, W.; Wang, T.; Liu, M.; Song, F. Investigation of Operation Regimes in a Multistage Internal-Loop Airlift Reactor. Ind. Eng. Chem. Res. 2010, 49, 11752–11759. [Google Scholar] [CrossRef]
  25. Mohanty, K.; Das, D.; Biswas, M.N. Hydrodynamics of a novel multi-stage external loop airlift reactor. Chem. Eng. Sci. 2006, 61, 4617–4624. [Google Scholar] [CrossRef]
  26. Mohanty, K.; Das, D.; Biswas, M.N. Mass transfer characteristics of a novel multi-stage external loop airlift reactor. Chem. Eng. J. 2007, 133, 257–264. [Google Scholar] [CrossRef]
  27. Sarkar, S.; Mohanty, K.; Meikap, B. Hydrodynamic modeling of a novel multi-stage gas–liquid external loop airlift reactor. Chem. Eng. J. 2008, 145, 69–77. [Google Scholar] [CrossRef]
  28. Liu, Y.-Q.; Tay, J.-H. Cultivation of aerobic granules in a bubble column and an airlift reactor with divided draft tubes at low aeration rate. Biochem. Eng. J. 2007, 34, 1–7. [Google Scholar] [CrossRef]
  29. Kumar, N.; Gupta, R.; Bansal, A. Effect of Surface Tension on Hydrodynamics and Mass Transfer Coefficient in Airlift Reactors. Chem. Eng. Technol. 2020, 43, 995–1004. [Google Scholar] [CrossRef]
  30. Huang, Z.-B.; Cheng, Z.-M. Liquid circulation hydrodynamics in an external loop airlift reactor. Can. J. Chem. Eng. 2013, 91, 223–230. [Google Scholar] [CrossRef]
  31. Wang, Z.; Guo, H.; Zhou, T.; Cheng, Z.; Huang, Z. Influence of sparger type on mass transfer in a pilot-scale internal loop airlift reactor. Processes 2022, 10, 429. [Google Scholar] [CrossRef]
  32. Vasconcelos, J.M.T.; Rodrigues, J.M.L.; Orvalho, S.C.P.; Alves, S.S.; Mendes, R.L.; Reis, A. Effect of contaminants on mass transfer coefficients in bubble column and airlift contactors. Chem. Eng. Sci. 2003, 58, 1431–1440. [Google Scholar] [CrossRef]
  33. Tsuchiya, K.; Haryono, M.H.; Tomida, T.; Hatano, H.; Oaki, H. Performance of a hollow-fiber spiral disk for effective gas dispersion toward high mass transfer rate. Ind. Eng. Chem. Res. 1996, 35, 613–620. [Google Scholar] [CrossRef]
  34. Merchuk, J.C.; Ladwa, N.; Cameron, A.; Bulmer, M.; Pickett, A. Concentric-tube airlift reactors: Effects of geometrical design on performance. AIChE J. 1994, 40, 1105–1117. [Google Scholar] [CrossRef]
  35. Zhang, W.; Yong, Y.; Zhang, G.; Yang, C.; Mao, Z. Mixing characteristics and bubble behavior in an airlift internal loop reactor with low aspect ratio. Chin. J. Chem. Eng. 2014, 22, 611–621. [Google Scholar] [CrossRef]
  36. Gourich, B.; Vial, C.; Essadki, A.H.; Allam, F.; Belhaj Soulami, M.; Ziyad, M. Identification of flow regimes and transition points in a bubble column through analysis of differential pressure signal—Influence of the coalescence behavior of the liquid phase. Chem. Eng. Process. Process Intensif. 2006, 45, 214–223. [Google Scholar] [CrossRef]
  37. Blažej, M.; Kiša, M.; Markoš, J. Scale influence on the hydrodynamics of an internal loop airlift reactor. Chem. Eng. Process. Process Intensif. 2004, 43, 1519–1527. [Google Scholar] [CrossRef]
  38. Lee, J.S.; Jin, H.R.; Lim, H.; Lim, D.H.; Kang, Y.; Kim, S.D.; Jun, K.W. Interfacial area and liquid-side and overall mass transfer coefficients in a three-phase circulating fluidized bed. Chem. Eng. Sci. 2013, 100, 203–211. [Google Scholar] [CrossRef]
  39. van Baten, J.M.; Krishna, R. Comparison of hydrodynamics and mass transfer in airlift and bubble column reactors using CFD. Chem. Eng. Technol. 2003, 26, 1074–1079. [Google Scholar] [CrossRef]
  40. McClure, D.D.; Aboudha, N.; Kavanagh, J.M.; Fletcher, D.F.; Barton, G.W. Mixing in bubble column reactors: Experimental study and CFD modeling. Chem. Eng. J. 2015, 264, 291–301. [Google Scholar] [CrossRef]
  41. Sánchez Mirón, A.; Cerón García, M.C.; García Camacho, F.; Molina Grima, E.; Chisti, Y. Mixing in bubble column and airlift reactors. Chem. Eng. Res. Des. 2004, 82, 1367–1374. [Google Scholar] [CrossRef]
  42. Pandit, A.B.; Joshi, J.B. Mixing in mechanically agitated gas-liquid contactors, bubble columns and modified bubble columns. Chem. Eng. Sci. 1983, 38, 1189–1215. [Google Scholar] [CrossRef]
Figure 1. Diagram of the experimental setup.
Processes 11 02866 g001
Figure 2. Schematic diagram of three reactor configurations: (a) BCR; (b) SSALR; (c) FSALR.
Processes 11 02866 g002
Figure 3. Relationship between KCl concentration and conductivity.
Processes 11 02866 g003
Figure 4. Tracer concentration vs. time.
Processes 11 02866 g004
Figure 5. Comparison of (a) riser and downcomer gas holdup and (b) overall gas holdup in the three reactors.
Processes 11 02866 g005
Figure 6. Comparison of gas holdup differences among three reactors.
Processes 11 02866 g006
Figure 7. Comparison of liquid circulating velocity among three reactors.
Processes 11 02866 g007
Figure 8. kLa in the riser and downcomer of three reactors.
Processes 11 02866 g008
Figure 9. Influence of measurement position on mixing time.
Processes 11 02866 g009
Figure 10. Influence of multistage structure on mixing time.
Processes 11 02866 g010
Table 1. Empirical correlations regarding overall gas holdup of three reactors.
Reactor typeCorrelationR2
BCR ε = 6.592 ln U G + 4.192 0.996
SSALR ε = 5.503 ln U G + 4.156 0.999
FSALR ε = 5.163 ln U G + 3.958 0.999
Note: UG (cm/s).
Table 2. Effect of airlift structure on liquid circulating velocity.
UG (cm/s)FSALR Compared with SSALR (%)FSALR Compared with BCR (%)
0.917.1113.9
1.529.486.2
3.017.9129.7
4.515.2143.6
6.012.8151.4
7.510.5152.7
9.18.1161.2
Table 3. Empirical correlations regarding liquid circulating velocity of three reactors.
Reactor TypeCorrelationR2
BCR U cir = 0.147 U G 0.420 0.994
SSALR U cir = 0.467 U G 0.681 0.997
FSALR U cir = 0.293 U G 0.540 0.991
Note: UG (cm/s), Ucir (m/s).
Table 4. Empirical correlations for global kLa of BCR and FSALR.
Reactor TypeCorrelationR2
BCRkLa = 0.0262lnUG + 0.01650.994
SSALRskLa = 0.0243lnUG + 0.01290.995
FSALRkLa = 0.0244lnUG + 0.01590.995
Note: UG (cm/s).
Table 5. Mixing time empirical correlations.
Reactor TypeCorrelationR2
BCRtm = 94.227UG−0.1300.91
SSALRtm = 143.880UG−0.6150.98
FSALRtm = 64.574UG−0.5810.97
Note: UG (cm/s).
Disclaimer/Publisher’s Note: The statements, opinions and data contained in all publications are solely those of the individual author(s) and contributor(s) and not of MDPI and/or the editor(s). MDPI and/or the editor(s) disclaim responsibility for any injury to people or property resulting from any ideas, methods, instructions or products referred to in the content.

