Abstract
The detailed physics-based description of anaerobic digesters is characterized by their multiscale and multiphysics nature, with Computational Fluid Dynamics (CFD) simulations being the most comprehensive approach. In practice, difficulties in obtaining a detailed characterization of the involved biochemical reactions hinder its application in the design of novel reactor concepts, where all physics interplays in the reactor must be considered. To solve this limitation, a practical approach is introduced where a calibration step using actual process data was applied for the simplified biochemical reactions involved, allowing us to efficiently manage uncertainties arising when characterizing biochemical reactions with lab scale facilities. A complete CFD modeling approach is proposed for the anaerobic digestion of wastewater, including heat transfer and multiphasic flow. The proposed multiphase model was verified using reference data and, jointly with the biochemical modeling approach, applied to a lab-scale non-conventional anaerobic digester for winery wastewater treatment. The results showed qualitative improvement in predicting methane production when the diameter of the particles was reduced, since larger particles tend to move downwards. The biochemistry of the process could be simplified introducing a preexponential factor of 380 (kmol/m3)(1 – n)/s for each considered chemical reaction. In general, the proposed approach can be used to overcome limitations when using CFD to scale-up optimization of non-conventional reactors involving biochemical reactions.
1. Introduction
The development of the bioeconomy is gaining in political relevance [1], as it is considered [2,3] a key element for the energy transition and the mitigation of climate change, while at the same time providing a means for economic growth. At least one third of the primary energy value in 2050 is expected to be associated with the bioeconomy [4], which relies on the use of biotechnology to transform biomass through bioreactors. Thus, bioreactors are essential for the conversion of organic matter into energy and other valuable products. Anaerobic digesters (Ads) are among the most widely used bioreactors, allowing the conversion of organic matter into mainly biogas. Nonetheless, the design and scale-up of Ads is a non-trivial task, due to the many bio-chemical and physical variables and parameters involved. Due to this complex interplay of multiphysics and multiscale phenomena, different modeling approaches are typically used to support the process of designing and scaling-up of Ads. Within this framework, the development of fast, accurate, and robust methods for simulating Ads is of the utmost importance for the efficient deployment of the bioeconomy.
The modeling of anaerobic digestion processes has been extensively studied in the literature. Various approaches have been proposed. From a biochemical point of view, these methods include the kinetic simulation of biochemical conversion processes, using mainly the ADM1 model [5,6,7,8] or most advanced related models, such as the Anaerobic Digestion System Model (ADSM) [9] and the theoretical analysis of kinetic parameters [10]. These approaches are useful for screening purposes or long-term continuous monitoring of AD processes [11], however they often introduce high uncertainty when implemented in practice to achieve optimal design and scale-up, due to the complexity of the biochemical processes and the need for accurate data. The current research includes novel methods for calibrating the ADM1 [12,13,14] and rigorous analysis of reduced ADM1 versions [7,15,16]. In addition, biochemical models alone are intrinsically restricted to biochemical reactions, without further considerations regarding limiting effects due to mass, momentum, and energy transfer within the reactor [17]. These latter effects have been typically considered by bioengineers through compartment modeling [18], which considers the bioreactor as a series of partially stirred reactors. Despite the simplicity of the approach, it has been a successful practical tool for design purposes. In recent years, computational fluid dynamics (CFD) has emerged as an attractive alternative for modeling anaerobic digestion processes [19], expanding the ability to capture the spatio-temporal influence of transport phenomena and its relationship to biochemical reactions. CFD is a powerful tool that can provide detailed information about the flow of fluids in a given system. Current research includes appropriate experimental characterization of the rheological properties of organic waste [20]. When biochemistry was not considered, existing studies have analyzed how CFD simulations contribute to predicting mixing in anaerobic digesters [21,22]. Attempts to partially introduce biochemistry have been based on coupling ADM1 with compartment models derived from non-reacting CFD simulations [23], or on coupling simplified ADM1 with full CFD [24], which allow us to quantify the effect of chemical diffusion on the homogenization of soluble substrates [24]. However, there have been few studies focused on coupling biochemical reactions with CFD simulations of AD tanks due to the complexity of AD processes. Recently, an open solver has been developed to couple a comprehensive CFD model for energy and fluid flow with ADM1 chemistry [25], however, quantitative predictions of product concentrations can have error rates of up to 30%. These results, and the associated computation cost of CFD simulations, suggest that there is still a need for rapid but rigorous approaches to CFD evaluation, including biochemistry, of existing and novel AD concepts [26].
This paper aimed to fill this research gap by proposing a practical approach for introducing and adapting existing biochemical empirical mechanisms within CFD evaluation of novel anaerobic digester concepts for biogas production. This paper is organized as follows: Section 2 presents a lab-scale anaerobic digester and the comprehensive CFD model, including the novel biochemistry calibration approach; Section 3 presents the results of the study, including the validation of the multiphase model; and Section 4 presents the conclusions based on the results.
2. Materials and Methods
A lab-scale anaerobic reactor used as a test case is introduced first in this section. Then, the full CFD method is detailed, and finally the theoretical basis for the biochemistry model calibration is discussed.
2.1. Lab-Scale Anaerobic Digester
The experimental set-up was based on a 100 L multiphase (sludge mixed with liquid and gas) reactor for anaerobic digestion. This is a patent concept [27] designed for high-performance Chemical Oxygen Demand (COD) reduction and conversion to biogas in applications within the food and drink sector (Figure 1). It consists of two main separate parts: (i) a main reactor body and (ii) a three-phase separator coupled to the main body. Within the reactor, there are baffles that can be adjusted to different angles between −40° and +40°, and which divide the inside volume into as many chambers as the number of baffles plus one.
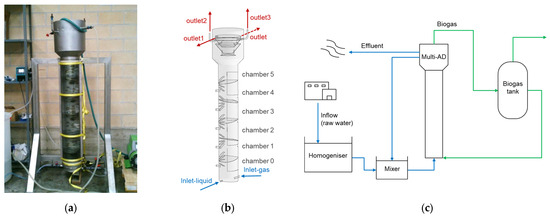
Figure 1.
(a) Image of the lab-scale digester. (b) Geometry of the reactor used in the simulations. (c) Schematic representation of the liquid and gas flows.
The design used in the present research had five baffles with an angle of 15° and six chambers, as shown in Figure 1b. The device had two inlets and four outlets, and a total volume (reactor and separator) of 126 L. As shown in Figure 1c, the reactor was fed with wastewater from a previous hydrolysis/acidogenesis unit already located in the production plant, which was collected in a homogenizer and then mixed with a liquid recirculation current in a mixing tank. While the effluent discharged into a water collecting system, a significant amount of biogas returned to the digester. The amount of sludge inside the reactor remained constant.
The reactor had a non-isothermal turbulent multiphase flow with liquid, solid, and gas phases involved. The liquid phase was water with Volatile Fatty Acids (VFAs), including acetic acid, propanoic acid, and butyric acid, among others. The gas phase was the biogas (a mixture of methane, hydrogen, and carbon dioxide) generated within the reactor through a heterogeneous system of reactions that considered the presence of the solid phase, where the methanotrophic bacteria were active.
2.2. Lab-Scale Experimental Results
The experimental data were acquired for 218 days using winery wastewater. The volumetric flow rates, influent COD, and sludge and biogas composition selected to validate the numerical model were extracted from the data acquired during a representative day. Experiments were conducted at a measured constant pH in the effluent, equal to 7.8. All soluble COD at the outlet came from VFAs. The amount of organic waste fed per unit volume of the digester per day (ORL) was ORL = 13.6 kg COD/m3/day, which was within typical values of anaerobic reactors use to treat winery wastewater [28]. A summary of the experimental data used for validation is presented in Table 1.

Table 1.
Summary of the experimental data used for validation.
2.3. Computational Fluid Dynamics Model
A detailed summary of the full CFD model setup is presented Appendix A. Reproducing the anaerobic digester behavior required solving the Navier–Stokes equations in three dimensions with an additional multiphase model, a turbulence model, and solving energy and species transport equations with chemical reactions. Due to the high computational cost of the full CFD model, parallelization was required. A brief explanation of the numerical models and simulation setup are described below.
The numerical model was defined to predict the three-phase fluid flow, heat transfer, and chemical reactions inside the lab-scale digester, and was solved by the double-precision pressure-based solver in ANSYS Fluent 19.2 [29], assuming a steady state (Table A1). The reference boundary conditions are shown in Table A2, unless other conditions were defined.
The three-phase flow behavior in the digester was predicted using the Eulerian multiphase model, which can describe multiple separate, yet interacting, phases (i.e., liquids, gases, solids, or a combination of these) [30]. The multiphase flow was described as interpenetrating continua; that is, the volume of a phase cannot be occupied by other phases, although different phases can be present in the same cell [29]. The space occupied by each phase was represented by its volume fraction.
In the Eulerian model, volume fraction conservation equations and phase interactions equations, among others, were solved, in addition to momentum and continuity conservation equations. A single pressure was shared by all phases and the laws of conservation of mass and momentum were satisfied by each phase individually, what meant each phase had its own velocity, temperature, and turbulence, which affect the other phases.
In the simulation of the lab-scale digester, one primary phase (liquid) and two secondary phases (gas and solid) were considered, as shown in Table A3. Gas bubbles were not directly simulated; instead, a transport equation was solved to study the variation of their diameter (ranging between 1.2 mm and 1 cm). The solid phase (sludge) was modeled as granular material with a particle diameter of 3 mm (see Table A3), as referenced in the simulation case. A second simulation of an inert flow (without chemical reaction) with 1 mm diameter particles was also carried out in order to better understand the solid hydrodynamics.
Interactions between phases included drag, heat transfer, and chemical reactions (Table A1). The reactions were only solved when the non-reacting flow achieved a statically steady state; that is, when the gas phase reached a constant mass inside the reactor (See Section 2.4). A rapid compilation of involved transport equations and models can be found in [31], which applied most of the numerical models involved here.
The numerical domain of the CFD simulations captured the 3D characteristics of the digester, described in Section 2.1 and shown in Figure 1. The geometry of the model was built from the original CAD data of the experimental facility and meshed in ANSYS Meshing 19.2.
The resulting mesh had a regular grid composed of 427,810 polyhedral cells and 2.76 × 10⁶ faces, which formed one single body that included six chambers and one separator. There were 43 boundaries grouped in five categories: degassing, inlet, internal, outlet, and wall. Figure 2a shows the mesh at the bottom of the reactor. The liquid inlet was a straight tube of 16 mm diameter located at the right side, while the gas inlet was a tee junction located at the opposite side. Gas was inserted into the reactor through two perforated balls colored in blue and with holes of 1.2 mm diameter. Figure 2b shows the mesh at the separator. The tubes at the left and right sides were located over the horizontal plate and the liquid phase flowed out through them. Their diameters were 16 mm (left side) and 21 mm (right side). The tubes located under the plate were the outlet of the gas side and the diameter was 16 mm for both. The separator was a labyrinth composed of three cones colored in red.
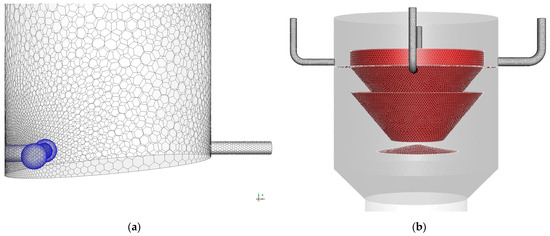
Figure 2.
Details of the 3D mesh: (a) liquid inlet, (b) three-phase separator.
The calculations were carried out in parallel using 8 CPUs (Intel Core i7-6700, 3.41 GHz) and a maximum RAM memory of 10.95 GB. The computational time was about 3.5 h every 1000 iterations.
Owing to the complexity of the numerical model, a numerical strategy was defined to allow the development of the gas phase along the domain, to achieve a real distribution of solids along the different chambers and to obtain a converged solution when chemical reactions were considered. This numerical strategy was composed of three stages: (i) initialization, (ii) inert flow development, and (iii) reactive flow.
2.4. Biochemical Modeling Approach
We analyzed a complete description of the biochemistry of anaerobic digestion to derive a strongly simplified biochemical model able to reproduce the syntrophic anaerobic digestion of VFAs within the reactor described in Section 2.1. This model assumed that (i) there was a previous hydrolysis/acidogenesis unit in the process plant (see Section 2.1); (ii) acetoclastic methanogenesis was the main method, since the origin of the wastewater was a winery [32]; and (iii) we initially considered chemical reactions calibrated in a lab-scale bioreactor without considering the effect of current microorganisms. The latter was included in the novel calibration procedure described in Section 2.5. Applying these assumptions, we considered the model proposed by [30], which was based on three reactions, namely:
- (a)
- propanoic acid degradation (acetogenic reaction),
- (b)
- butyric acid degradation (acetogenic reaction),
- (c)
- acetic acid degradation (methanogenic reaction),
These three reactions can be modeled as:
where is the pre-exponential factor of the Arrhenius equation, is the activation energy, is the universal gas constant, is the temperature, is the order of reaction, and subscriIt i is related to each of the three considered VFA-substrates (propanoic, butyric, and acetic acids). Kinetic constants for the above reactions were calculated at mesophilic temperature (35 °C). An initial set of parameters included in the numerical model to calculate the reaction rates are presented in Table 2. This chemical reaction mechanism did not consider the effect of current biomass (microorganisms). This effect is critical, and it was added as described in the next section.

Table 2.
Parameters of the reaction mechanism for heterogeneous chemical reactions [30].
2.5. A Novel Practical Approach for Biochemistry Calibration
The parameters in Table 2 were obtained in a continuous stirred bioreactor [30] for a particular wastewater sludge. Therefore, these parameters were obtained under conditions that differ from those of any other real digester in several ways. An analysis of the sources of variability that affect methane production was used here to lead to a simple but practical approach to adjust the model (i.e., Equation (1) and Table 2) to actual reactor conditions. Let us first analyze the main characteristics of the model:
- (i)
- Mass transport restrictions: The model was purely empirical, and all parameters were fitted to experimental data. No assumption about the order of the reaction of a particular mechanism was made. In addition, the parameters obtained may not have been true kinetic parameters, as no protocol was applied to check if any transport mechanism controlled the reaction. Therefore, mass transfer processes could be embedded to a great extent in the kinetic parameters [10]. For example, as a Continuous Stirred Tank Reactor (CSTR) was used for the experimental characterization, a homogeneous and perfect mixing was assumed, which neglected the effect of the density and granular size distribution of the microbial aggregate. The model did not provide a specific means for tuning (without re-fitting all parameters) to micro-mixing and mass transfer conditions different to those used for the characterization.
- (ii)
- Microbial definition: Even without considering mass transport restrictions, as described above, the fitting was specific to the sludge used and the microorganisms living there. This included the microbial reaction mechanisms and growth kinetics. Although the specific microorganisms could be identified and reported, the kinetics may change (e.g., due to mutations).
- (iii)
- Additional inhibition/activation effects: The operating temperature in the objective reactor could differ from the mesophilic temperature (37 °C) which was used for the experimental characterization [30]. The model does not provide a way to correct this. The pH of the mixture was not considered, which could alter the proton transfer mechanisms.
- (iv)
- Substrate definition: The introduced model was based on a substrate with three VFAs. Although this was convenient for the case studied in [30], when applied to other cases, there will be a difference that needs to be corrected with the C/H/O fundamental composition of the actual substrate. Therefore, if model generalization is desired, the three VFA substrate approach needs to be used as a model of the actual COD.
We next introduce simple mechanistic arguments in order to substantiate a proper method to tune the model, considering the discussion above. Let us assume first that acetogenesis and methanogenesis are both sequential reactions [18] that can be generically expressed as a substrate (S) that gives an intermediate prodI (R), and then (P):
where and are the kinetic parameters, both with an Arrhenius dependence of temperature. Assuming, for simplicity, monomolecular reactions, if these reactions take place in a CSTR and the corresponding mass balance is considered, the concentration of the product P will have the following expression:
where τ is the residence time in seconds, computed as the reactor volume, cubic meter, over the volumetric flow rate, cubic meter per second. Assuming that the concentration of methane can be approximated by a solution with the structure of Equation (3), it would be possible to use a modified residence time to tune the behavior of the model. A modified, or effective, residence time can be interpreted as a direct modification of the micro-mixing behavior, which is a direct representation of possible mass transfer limitations and an indirect way of introducing the relationships between the fundamental composition of the actual COD with regards to the VFA considered. The residence time τ appeared to always be multiplying the kinetic coefficient and can also be interpreted as a modulator of the pre-exponential factor. Such a modulator can include the effect of the operation temperature (T/Tref), which is typically included as a correction of the pre-exponential factor [33].
Alternatively, it is possible to reason, based on Michaelis–Menten kinetics (see for example [17]), where a substrate (S) adds to an Iyme (E) to produce an intermediate product (EP) and, later, they separate after the conversion of S to the product (P), allowing E to be free again. This is expressed as:
where and are the kinetic parameters. For this case, the reaction rate typically considered is:
where rs is the volumetric reaction rate with respect to reactant s, [s] is the concentration of s, rmax is the maximum rate of reaction (typical units for rs and rmax are mol m−3 s−1), and Km is the Michaelis constant. This kinetic also represents the microorganism reaction [17], and rmax can be reinterpreted as a factor bringing together parameters related to the microorganisms that influence the reaction.
Considering both arguments, namely, basic reactions in series and the enzymatic-like reaction mechanism, introducing a parameter multiplying the kinetic coefficient will allow us to jointly reproduce most of the effects not directly modeled in (1). Therefore, the proposed model reduces to:
where Ac needs to be adjusted experimentally and Ea and n are taken from a previous fitting at lab-scale CSTR kinetic parameter estimation. In this case, values from Table 2 can be adopted.
In summary, we used Arrhenius-type kinetic equations and assumed that the pre-exponential term was proportional to the maximum rate of the enzymatic reaction. We could then adjust the effect of microorganisms by changing this term while keeping the other kinetic parameters constant. These latter parameters referred to the bio-catalyzed reaction and not to the difficulty of accessing microorganisms (referred also as biomass or substrate).
3. Results
A validation of the multiphase model (without chemical reactions) was first introduced based on a literature test case. Then, flow patterns and solid distributions were given for a particular solution of the lab-scale digester described in Section 2.1. Finally, results are shown for the solid distribution and for the biochemistry model calibration.
3.1. Multiphase Model Validation
The numerical model was validated against the experimental gas holdup published by [34] and the gas, liquid, and solid holdup obtained from classical correlations [35,36,37,38].
The domain consisted of a cylinder of 0.1 m of diameter and 1.24 m height. A structured mesh was built, containing 96,140 cells. The liquid phase was composed of water, the gas phase was air, and the solid phase was composed of glass beads with a diameter of 3.05 mm. The initial height of the solid bed was 256 mm and the initial solid holdup was 0.59. Fives cases were selected for validation with the numerical results, varying the superficial liquid (UL) and gas velocities (UG) according to Table 3:

Table 3.
Superficial liquid and gas velocities for validation cases.
Figure 3 compares the gas, solid, and liquid holdup for the analyzed cases. The current numerical model (labeled CFD and colored in orange) could predict each holdup with the same accuracy as the experimental results and well-established correlations available in the literature.
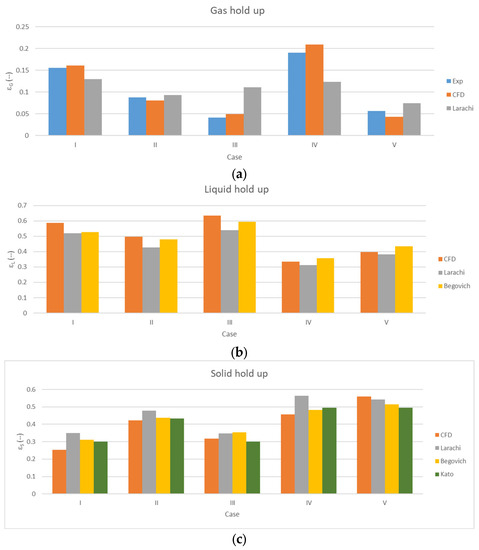
Figure 3.
Validation test case, including volume fractions in each case: (a) Gas phase: Experimental values from [34] (blue), CFD results (orange), and Larachi’s correlation [35,36] (grey). (b) Liquid phase: CFD results (orange), Larachi’s correlation [35,36] (grey), and Begovich’s correlations [37] (yellow). (c) Solid phase: CFD results (orange), Larachi’s correlation [35,36] (grey), Begovich’s correlations [37] (yellow), and Kato’s correlation [38] (green).
The differences of the gas holdup between the numerical and experimental results were lower than 10% when the gas holdup was larger than 0.08. For smaller values of gas holdup, the difference increased to up to 25%. The Larachi’s correlation provided larger differences to the experimental results in all cases, varying from 6.3% (case II) to 62.7% (case III).
With respect to the liquid holdup, the differences between the numerical results and the Begovich’s correlations were lower than 10% in all cases, while the Larachi’s correlations increased the difference to up to 14.7% in case III. The comparison of the solid holdup predicted by the Begovich’s and Kato’s correlations with the CFD results revealed a similar accuracy, varying from 3% in case II to 20% in case I. The Larachi’s correlation led to larger differences, from 3% in case V to 38.4% in case I.
3.2. Lab-Scale Reactor Simulation without Biochemistry
As explained in Section 2.3, the fluid was initially considered isothermal and at rest, with the solid volume fraction in each chamber corresponding to the values reported in Table A1. After 75,000 iterations, the mass of gas inside the digester reached a constant value (approximately) and the inert flow could be considered converged. As shown in Figure 4, during the first 4000 iterations, which corresponded to calculations with a time scale factor ranging from 0.001–0.05, the mass of gas inside the reactor was almost zero, meaning that time scale factors lower than 0.05 are not suitable for solving the fluid behavior in the reactor. During iterations 4000–37,500 (time scale factor of 0.10–0.12), the mass of gas grew linearly with a relatively low slope until a value of 0.3 g. After that, during iterations 37,500–50,000, the mass of gas increased faster until it reached a value of approximately 0.7 g. Then, the mass of gas inside the reactor grew very slowly and only varied from 0.695 to 0.735 g in 25,000 iterations, with a time scale factor equal to 0.15. Therefore, the results for this stage could be considered sufficiently converged.
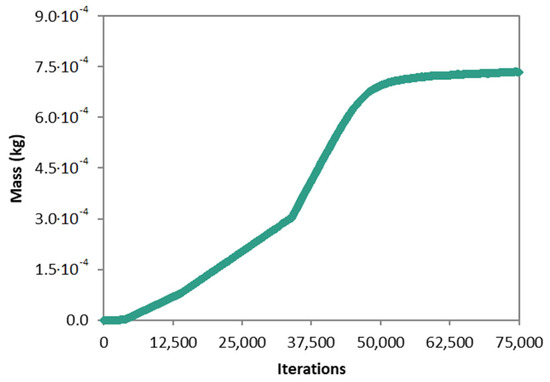
Figure 4.
Inert flow: Mass of gas inside the digester.
A grid sensitivity study was performed at this point. A coarse mesh composed of 203,431 cells and a fine mesh of 1,191,793 cells were built. The overall amount of gas was compared in Figure 5a, while Figure 5b shows the distribution of the mass of the gas phase in each part of the reactor:
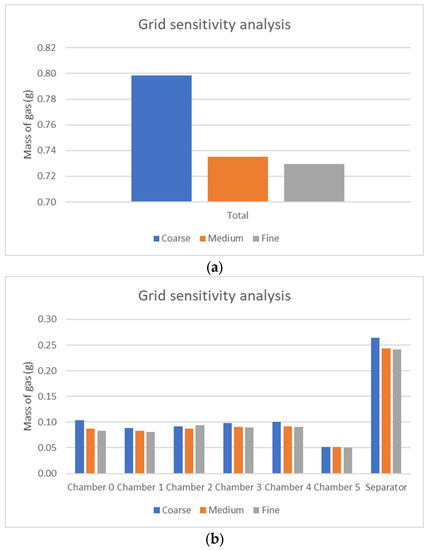
Figure 5.
Grid sensitivity analysis: (a) Mass of gas contained inside of the reactor; (b) distribution of mass of gas in each chamber.
The overall mass of gas calculated by the coarse mesh was 8.63% larger than that calculated by the medium mesh, while the difference between the medium and fine meshes was 0.75%. There were minor differences between the gas contained in each chamber for the medium and fine meshes, but the medium mesh was selected, since it provides a good equilibrium of accuracy and computational expense.
The velocity of the liquid and gIs phases inside the reactor was very small, thus the pressure at each point of the inside of the digester was hydrostatic and only depended on the fluid column above it. During the inert flow calculations, as the reactions were disabled and there was no heat transfer through the walls (heat flow through the wall was approximately 1.2 × 10⁻⁴ W), the operation in the reactor was adiabatic and isothermal. Therefore, the temperature of the fluids and walls remained constant at the initial value of 303 K.
The contours of the gas and solid volume fraction in the digester are depicted in Figure 6. The gas rose from the gas inlet (at the right bottom corner) to the phase separator, following a zigzag path through the chambers. The gas phase accumulated at the top of the reactor because there was a small hole in the cones of the separator. This gas flow is represented by the green zone at the center of the separator. The sludge (solid phase), modeled as a solid particulate material with a particle diameter of 3 mm (see Table A3), was deposited at the bottom of the reactor instead of being distributed over the different baffles that divide the chambers. This accumulation of particles at the bottom should have been represented by a maximum solid fraction of 0.63 but, in that case, this high max value would have hindered the description of the solid distribution in the rest of the chambers. Therefore, the maximum limit in the scale was reduced to 0.01. In any case, the solid accumulation at the bottom of the reactor seemed to indicate a non-appropriate approximation of the particle diameter, which will be discussed later.
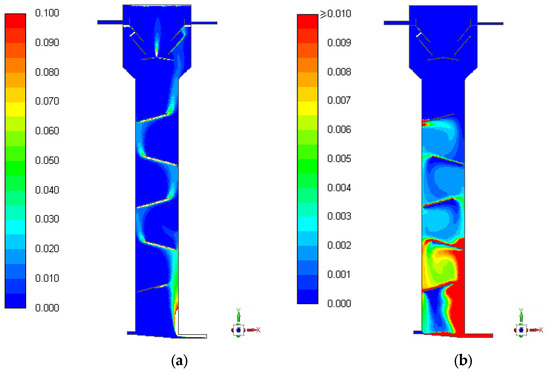
Figure 6.
Inert flow: (a) General visualization of the contours of the gas volume fraction. (b) General visualization of the solid volume fraction.
The liquid phase occupied most of the inner volume of the digester and travelled from the bottom to the top of the device, passing through all the chambers. As can be observed in Figure 7, the water entered each chamber and swirled before moving to another one, facilitating the digestion process. This swirl motion increased the residence time of the fluid and produced a change in the performance of the reactor. The external appearance of the reactor was like a plug flow reactor, but the deflectors divided the tubular flow into five different chambers. The reactor can be simplified as five CSTRs connected serially.
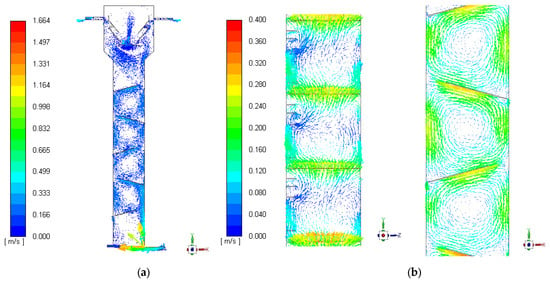
Figure 7.
Inert flow: Vectors of liquid velocity. (a) General visualization and (b) details of the chambers.
The motion of the different phases (liquid, gas, and solid) inside the reactor is depicted in Figure 8, in which different lines represent the path that a particle suspended in each phase would follow through the reactor. In the figures, in general terms, the green and turquoise colors indicate a positive vertical velocity (the phase moves up) while the darker blue colors denote a negative vertical velocity (the phase moves down). In general, positive vertical liquid velocity is preferred, because it pushes up the solid particles and impedes solids accumulation at the bottom.
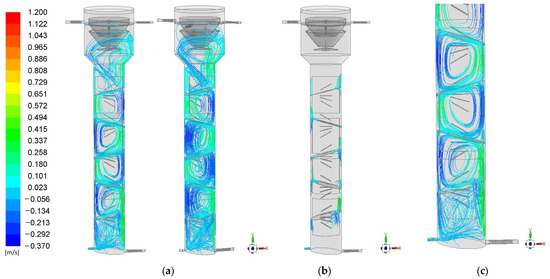
Figure 8.
Inert flow: Motion of the liquid phase. (a) General visualization, (b) details of zones between chambers, and (c) bottom of the device (the color scale indicates vertical velocity).
3.3. Lab-Scale Reactor Simulation with Biochemistry
Once the inert flow simulations converged, it was possible to proceed with the calculations of the heterogeneous chemical reactions that take place inside the reactor. The results of this third simulation stage comprised iterations 75,000–141,000. The distribution of solids (dp = 3 mm) within the digester during the second (inert flow) and third calculation stages (reactive flow) showed that the 3 mm diameter solids tended to accumulate at the bottom of the reactor. This tendency of the bigger particles to deposit at the bottom of the digester can be observed in Table 4, which shows the variation of the mass of solids in each chamber at the end of the third calculation stage (reactive flow) with respect to the initial conditions. As seen in Table 4, when the particle diameter was 3 mm, the granular material tended to travel from the upper chambers and accumulate in Chamber 0, in which the mass of solids were 159% higher at the end of the third stage than at the beginning of the simulation (first stage). When the particle diameter was 1 mm, the mass of solids varied moderately in each of the chambers, and both positive and negative variations of mass occurred. The behavior of the solid phase, determined by the diameter of the microbial aggregates (granular material), influenced the production of biogas, since the chemical reactions could only take place in the solid phase surroundings.

Table 4.
Variation of the mass of solids in each chamber at the end of the reactive flow calculation with respect to the initial conditions (%).
As described in Section 2.4, three chemical reactions were defined to model the anaerobic digestion processes that took place within the reactor: (a) Propanoic acid degradation, (b) butyric acid degradation, and (c) acetic acid degradation, which lead to methane formation. To apply the modeling approach described in Section 2.4 to calibrate the kinetic parameters that lead to the production of 15.1 L/h of gas, the chemical kinetic model was scripted externally to the CFD simulation in order to run the inverse analysis. By analyzing the behavior of the system and assuming a constant volume of liquid inside the reactor, a pre-exponential factor of 380 (–mol/m3)(1 − n)/s for each of the three reactions was obtained.
4. Conclusions
One of the challenges in modeling biochemical reactions (e.g., when adding biochemical effects in mass and energy transfer CFD models) is to find a suitable kinetics equation that describes the rate of change of the reactants and products. However, finding such an equation is not always easy, as it depends on many factors, such as the type of reaction, the microorganism activity, the substrate concentration, the temperature, the pH, and the presence of inhibitors or activators. Moreover, even if a kinetics equation is found, it may not be applicable to other reactor conditions or configurations, as it may be specific to a certain experimental setup or scale.
A comprehensive CFD model was proposed here, including a procedure that overcomes these limitations by adapting existing experimental fittings of representative biochemical reactions. This approach was discussed based on a theoretical simplified analysis that considers mechanistic methods of justifying appropriate, simple, practical, and robust corrections for dealing with complex biochemical reactions and transport phenomena occurring within the digester. The model adaptation, which can be seen as a parameter tuning or model calibration, is theoretically justified for enzyme-like reactions, and it is thus restricted to these cases.
Using the validated CFD model for multiphase non-isothermal fluid flow, a non-conventional anaerobic digester was simulated, including biochemical reactions to obtain the methane production rate. The results confirmed that the model increases the accuracy of CFD simulations of anaerobic digesters under real operation conditions, as long as there is access to experimental data.
Future work will be devoted to online adaptation of the model according to data collected in the plant, to analyze to what extent this may be useful for identifying malfunctions during operation. The second focus will be to generate synthetic data, from a comprehensive numerical DoE, to build real time reduced order models focused on design optimization.
5. Patents
The lab-scale reactor used in this study is protected under patent ES-2541078-B1.
Author Contributions
Conceptualization of this research and funding acquisition was initially performed by G.G. and S.I.; M.M. and C.B. took part in computational tasks of the investigation and performed the formal analysis of the obtained data. J.B.C. led the project administration and experimental activities. J.B.C. and S.I. jointly supervised the overall research. M.M. supervised the computational activities, including validation and software/hardware resources management. A.M.S. contributed to the definition of the methodology, and finally S.I., J.B.C. and M.M. guided the writing and review & editing of the manuscript. All authors have read and agreed to the published version of the manuscript.
Funding
This research received funding from the LIFE Programme of the European Union for the environment and climate action under agreement number LIFE17 ENV/ES/331—Acronym: LIFE MultiAD 4 AgroSMEs (https://lifemultiad.eu/?lang=es (accessed on 24 May 2023)).
Data Availability Statement
Data sharing not applicable.
Conflicts of Interest
The authors declare no conflict of interest. The funders had no role in the design of the study; in the collection, analyses, or interpretation of data; in the writing of the manuscript; or in the decision to publish the results.
Appendix A

Table A1.
General setup of the full CFD model.
Table A1.
General setup of the full CFD model.
| Model | Zone | Value |
|---|---|---|
| General | Geometry | 3D |
| Solver | ANSYS Fluent, Release 19.2 Pressure-based, double precision | |
| Time Formulation | Steady (pseudotransient) | |
| Gravity | Enabled (g = 9.81 m/s2) | |
| Materials | Mixture: liquid | Composition:
Density: volume-weighted-mixing-law Specific heat: mixing-law Thermal conductivity & viscosity: mass-weighted-mixing-law Mass diffusivity: constant-dilute-appx, 2.88 × 10⁻⁵ m2/s |
| Mixture: solid | Composition:
Density: 1060 kg/m3; Other properties: Kinetic Theory of Granular Flow (KTGF) | |
| Mixture: gas | Composition:
Density: volume-weighted-mixing-law Specific heat: mixing-law Thermal conductivity & viscosity: mass-weighted-mixing-law Mass diffusivity: constant-dilute-appx, 2.88 × 10⁻⁵ m2/s | |
| Models | Multiphase | Eulerian, Implicit, 3 Phases, Phase Interactions |
| Viscous (Turbulence) | Realizable k-ε, Enhanced Wall Treatment, Dispersed | |
| Energy | Enabled | |
| Species Transport | Enabled | |
| Phases | Liquid | Primary phase |
| Gas | Secondary phase, Bubbly | |
| Solid (sludge) | Secondary phase, Granular | |
| Phase interactions | Drag | Model: schiller-naumann for all pairs of phase interactions. |
| Heat | Model: ranz-marshall (gas–liquid phases), gunn (solid–liquid phases) and hughmark (gas–solid phases) | |
| Reactions | Heterogeneous chemical reactions are solved when the non-reacting flow achieves a statically steady state; that is, when the gas phase reaches a constant mass inside the reactor. | |
| Numerical algorithms | Pressure-velocity coupling | Coupled |
| Spatial discretization | Gradient: Least Squares Cell based Pressure: 2nd Order Momentum, Volume Fraction, Turbulent Kinetic Energy, Turbulent Dissipation Rate, Energy, Interfacial Area Concentration, Species: 1st Order Upwind | |
| Other options | Pseudotransient Wrapped-face gradient correction | |
| Solution controls | Pseudotransient explicit relaxation factors | Pressure, momentum, volume fraction: 0.5 Density, body forces, turbulent viscosity: 1 Granular temperature, k, epsilon, energy, IAC: 0.75 |
| Initialization | Standard |
|
| Pseudo-Time | Timescale Factor | Varied from 0.001 to 0.15 |

Table A2.
Reference boundary conditions for the CFD model.
Table A2.
Reference boundary conditions for the CFD model.
| Boundary Condition | Value |
|---|---|
| Inlet: liquid | Velocity = 0.1599788 m/s (100 L/h) Turbulence: Intensity = 5%, Hydraulic Diam. = 0.016 m Temperature = 303 K (30 °C) Species Mole Fractions:
|
| Inlet: gas | Velocity = 0.1493667 m/s (180 L/h) Temperature = 303 K (30 °C) Species Mole Fractions:
|
| Outlet: liquid | Gauge Pressure = 1054 Pa (hydrostatic, upper outlets) |
| Outlet: gas | Gauge Pressure = 1268 Pa (hydrostatic, lower outlets) |
| Degassing | Top of the device. Gas phase is allowed to get out of the domain, while liquid phase encounters a free-slip boundary and do not leave the reactor. |
| Walls | Temperature = 303 K (30 °C) |

Table A3.
Multiphase model details of the CFD set-up: phase material description.
Table A3.
Multiphase model details of the CFD set-up: phase material description.
| Phase | Material | Modeling Details |
|---|---|---|
| Liquid—Primary | Mixture: liquid | - |
| Gas—Secondary | Mixture: gas | Interfacial area concentration Surface tension: 0.0728 n/m Coalescence, breakage kernel: hibiki-ishii Nucleation rate: none Dissipation function: 0.01 m2/s3 Min diameter: 0.0012 m Max diameter: 0.01 m |
| Solid—Secondary | Mixture: solid | Granular Temperature model: Phase property Diameter: 0.003 m Granular viscosity: syamlal-obrien Granular bulk viscosity, solids pressure, Radial Distribution: lun-et-al Fractional viscosity: none Granular temperature: algebraic Elasticity modulus: derived Packing limit: 0.63 |
References
- Publications Office of the European Union. European Bioeconomy Policy: Stocktaking and Future Developments: Report from the Commission to the European Parliament, the Council, the European Economic and Social Committee and the Committee of the Regions; Publications Office of the European Union: Belgium, Brussel, 2022. [Google Scholar] [CrossRef]
- Carus, M.; Dammer, L. The Circular Bioeconomy—Concepts, Opportunities, and Limitations. Ind. Biotechnol. 2018, 14, 83–91. [Google Scholar] [CrossRef]
- Tan, E.C.D.; Lamers, P. Circular Bioeconomy Concepts—A Perspective. Front. Sustain. 2021, 2, 53. [Google Scholar] [CrossRef]
- IRENA. Geopolitics of the Energy Transformation: The Hydrogen Factor; IRENA: Masdar City, United Arab Emirates, 2022. [Google Scholar]
- Donoso-Bravo, A.; Sadino-Riquelme, M.C.; Valdebenito-Rolack, E.; Paulet, D.; Gómez, D.; Hansen, F. Comprehensive ADM1 Extensions to Tackle Some Operational and Metabolic Aspects in Anaerobic Digestion. Microorganisms 2022, 10, 948. [Google Scholar] [CrossRef]
- Batstone, D.J.; Keller, J.; Angelidaki, I.; Kalyuzhnyi, S.V.; Pavlostathis, S.G.; Rozzi, A.; Sanders, W.T.M.; Siegrist, H.A.; Vavilin, V.A. The IWA Anaerobic Digestion Model No 1 (ADM1). Water Sci. Technol. 2002, 45, 65–73. [Google Scholar] [CrossRef]
- Weinrich, S.; Mauky, E.; Schmidt, T.; Krebs, C.; Liebetrau, J.; Nelles, M. Systematic simplification of the Anaerobic Digestion Model No. 1 (ADM1)–Laboratory experiments and model application. Bioresour. Technol. 2021, 333, 125104. [Google Scholar] [CrossRef]
- Hagos, K.; Zong, J.; Li, D.; Liu, C.; Lu, X. Anaerobic co-digestion process for biogas production: Progress, challenges and perspectives. Renew. Sustain. Energy Rev. 2017, 76, 1485–1496. [Google Scholar] [CrossRef]
- Hu, C.; Yan, B.; Wang, K.-J.; Xiao, X.-M. Modeling the performance of anaerobic digestion reactor by the anaerobic digestion system model (ADSM). J. Environ. Chem. Eng. 2018, 6, 2095–2104. [Google Scholar] [CrossRef]
- Villadsen, J. Fundamental Bioengineering. Wiley-VCH Verlag GmbH & Co. KGaA: Weinheim, Germany, 2015. [Google Scholar] [CrossRef]
- Ozgun, H. Anaerobic Digestion Model No. 1 (ADM1) for mathematical modeling of full-scale sludge digester performance in a municipal wastewater treatment plant. Biodegradation 2019, 30, 27–36. [Google Scholar] [CrossRef]
- Liu, Y.; Jiang, Y.; Bortone, I. A Scheme for Anaerobic Digestion Modelling and ADM1 Model Calibration. Chem. Eng. Trans. 2022, 96, 133–138. [Google Scholar] [CrossRef]
- Catenacci, A.; Grana, M.; Malpei, F.; Ficara, E. Optimizing ADM1 Calibration and Input Characterization for Effective Co-Digestion Modelling. Water 2021, 13, 3100. [Google Scholar] [CrossRef]
- Panaro, D.; Frunzo, L.; Mattei, M.; Luongo, V.; Esposito, G. Calibration, validation and sensitivity analysis of a surface-based ADM1 model. Ecol. Model. 2021, 460, 109726. [Google Scholar] [CrossRef]
- Meadows, T.; Weedermann, M.; Wolkowicz, G.S.K. Global Analysis of a Simplified Model of Anaerobic Digestion and a New Result for the Chemostat. SIAM J. Appl. Math. 2019, 79, 668–689. [Google Scholar] [CrossRef]
- Weinrich, S.; Nelles, M. Systematic simplification of the Anaerobic Digestion Model No. 1 (ADM1)–Model development and stoichiometric analysis. Bioresour. Technol. 2021, 333, 125124. [Google Scholar] [CrossRef] [PubMed]
- Doran, P. Engineering Principles, 2nd ed; Academic Press: Cambridge, MA, USA, 2013; p. 903. [Google Scholar]
- Levenspiel, O. Chemical reaction engineering. Ind. Eng. Chem. Res. 1999, 38, 4140–4143. [Google Scholar] [CrossRef]
- Bridgeman, J. Computational fluid dynamics modelling of sewage sludge mixing in an anaerobic digester. Adv. Eng. Softw. 2012, 44, 54–622. [Google Scholar] [CrossRef]
- Caillet, H.; Adelard, L. A Review on the Rheological Behavior of Organic Waste for CFD Modeling of Flows in Anaerobic Reactors. Waste Biomass-Valorization 2022, 14, 389–405. [Google Scholar] [CrossRef]
- Li, L.; Wang, K.; Wei, L.; Zhao, Q.; Zhou, H.; Jiang, J. CFD simulation and performance evaluation of gas mixing during high solids anaerobic digestion of food waste. Biochem. Eng. J. 2021, 178, 108279. [Google Scholar] [CrossRef]
- Li, L.; Wang, K.; Zhao, Q.; Gao, Q.; Zhou, H.; Jiang, J.; Mei, W. A critical review of experimental and CFD techniques to characterize the mixing performance of anaerobic digesters for biogas production. Rev. Environ. Sci. Bio/Technol. 2022, 21, 665–689. [Google Scholar] [CrossRef]
- Huang, Y.; Ma, Y.; Wan, J.; Wang, Y. Mathematical modelling of the internal circulation anaerobic reactor by Anaerobic Digestion Model No. 1, simultaneously combined with hydrodynamics. Sci. Rep. 2019, 9, 6249. [Google Scholar] [CrossRef]
- Tobo, Y.M.; Rehman, U.; Bartacek, J.; Nopens, I. Partial integration of ADM1 into CFD: Understanding the impact of diffusion on anaerobic digestion mixing. Water Sci. Technol. 2020, 81, 1658–1667. [Google Scholar] [CrossRef]
- Dabiri, S.; Kumar, P.; Rauch, W. Integrating biokinetics with computational fluid dynamics for energy performance analysis in anaerobic digestion. Bioresour. Technol. 2023, 373, 128728. [Google Scholar] [CrossRef] [PubMed]
- Conti, F.; Saidi, A.; Goldbrunner, M. CFD Modelling of Biomass Mixing in Anaerobic Digesters of Biogas Plants. Environ. Clim. Technol. 2019, 23, 57–69. [Google Scholar] [CrossRef]
- Fraile Torres, A.; Weichgrebe, D.J.; Martínez Fraile, L.C.; Huete Palos, E. Reactor Para el Tratamiento de Aguas Residuales. ES2541078B1, 3 March 2015. [Google Scholar]
- Petropoulos, E.; Cuff, G.; Huete, E.; Garcia, G.; Wade, M.; Spera, D.; Aloisio, L.; Rochard, J.; Torres, A.; Weichgrebe, D. Investigating the feasibility and the limits of high rate anaerobic winery wastewater treatment using a hybrid-EGSB bio-reactor. Process. Saf. Environ. Prot. 2016, 102, 107–118. [Google Scholar] [CrossRef]
- ANSYS Inc. ANSYS® Fluent Release 19.2, ANSYS Fluent Theory Guide; ANSYS Inc.: Canonsburg, PA, USA, 2019. [Google Scholar]
- Azargoshasb, H.; Mousavi, S.; Amani, T.; Jafari, A.; Nosrati, M. Three-phase CFD simulation coupled with population balance equations of anaerobic syntrophic acidogenesis and methanogenesis reactions in a continuous stirred bioreactor. J. Ind. Eng. Chem. 2015, 27, 207–217. [Google Scholar] [CrossRef]
- Hamidipour, M.; Chen, J.; Larachi, F. CFD study on hydrodynamics in three-phase fluidized beds—Application of turbulence models and experimental validation. Chem. Eng. Sci. 2012, 78, 167–180. [Google Scholar] [CrossRef]
- Lettinga, G.; van Haandel, A.C. Anaerobic Sewage Treatment: A Practical Guide for Regions with a Hot Climate; Wiley: Chichester, UK, 1994; Available online: https://www.cabdirect.org/cabdirect/abstract/19382700446 (accessed on 27 July 2023).
- Shuler, M.; Kargi, F. Bioprocess Engineering: Basic Concepts. Available online: https://www.amazon.es/Shuler-Bioprocess-Engineering_c3-International-Engineering/dp/0137062702 (accessed on 24 May 2023).
- Jena, H.M.; Roy, G.K.; Meikap, B.C. Prediction of gas holdup in a three-phase fluidized bed from bed pressure drop measurement. Chem. Eng. Res. Des. 2008, 86, 1301–1308. [Google Scholar] [CrossRef]
- Larachi, F.; Iliuta, I.; Rival, O.; Grandjean, B.P.A. Prediction of Minimum Fluidization Velocity in Three-Phase Fluidized-Bed Reactors. Ind. Eng. Chem. Res. 1999, 39, 563–572. [Google Scholar] [CrossRef]
- Larachi, F.; Belfares, L.; Iliuta, I.; Grandjean, B.P.A. Three-Phase Fluidization Macroscopic Hydrodynamics Revisited. Ind. Eng. Chem. Res. 2001, 40, 993–1008. [Google Scholar] [CrossRef]
- Begovich, J.M.; Watson, J.S. Hydrodynamic Characteristics of Three-Phase Fluidized Beds. In Proceedings of the Conference on Fluidization, Cambridge, UK, 1 April 1978. [Google Scholar]
- Kato, Y.; Uchida, K.; Mooroka, S.; Kago, T.; Saruwatari, T.; Yang, S.-Z. Axial holdup distributions of gas and solid particles in three-phase fluidized bed for gas-liquid (slurry)-solid systems. J. Chem. Eng. Jpn. 1985, 18, 308–313. [Google Scholar] [CrossRef]
Disclaimer/Publisher’s Note: The statements, opinions and data contained in all publications are solely those of the individual author(s) and contributor(s) and not of MDPI and/or the editor(s). MDPI and/or the editor(s) disclaim responsibility for any injury to people or property resulting from any ideas, methods, instructions or products referred to in the content. |
© 2023 by the authors. Licensee MDPI, Basel, Switzerland. This article is an open access article distributed under the terms and conditions of the Creative Commons Attribution (CC BY) license (https://creativecommons.org/licenses/by/4.0/).