
Unraveling Anaerobic Digestion Instability: A Simple Index Based on the Kinetic Balance of Biochemical Reactions


Abstract
:1. Introduction
2. Materials and Methods
2.1. Substrate, Anaerobic Digester, and Operation
2.2. Analysis
2.3. VFA Balance in Anaerobic Digestion
3. Results
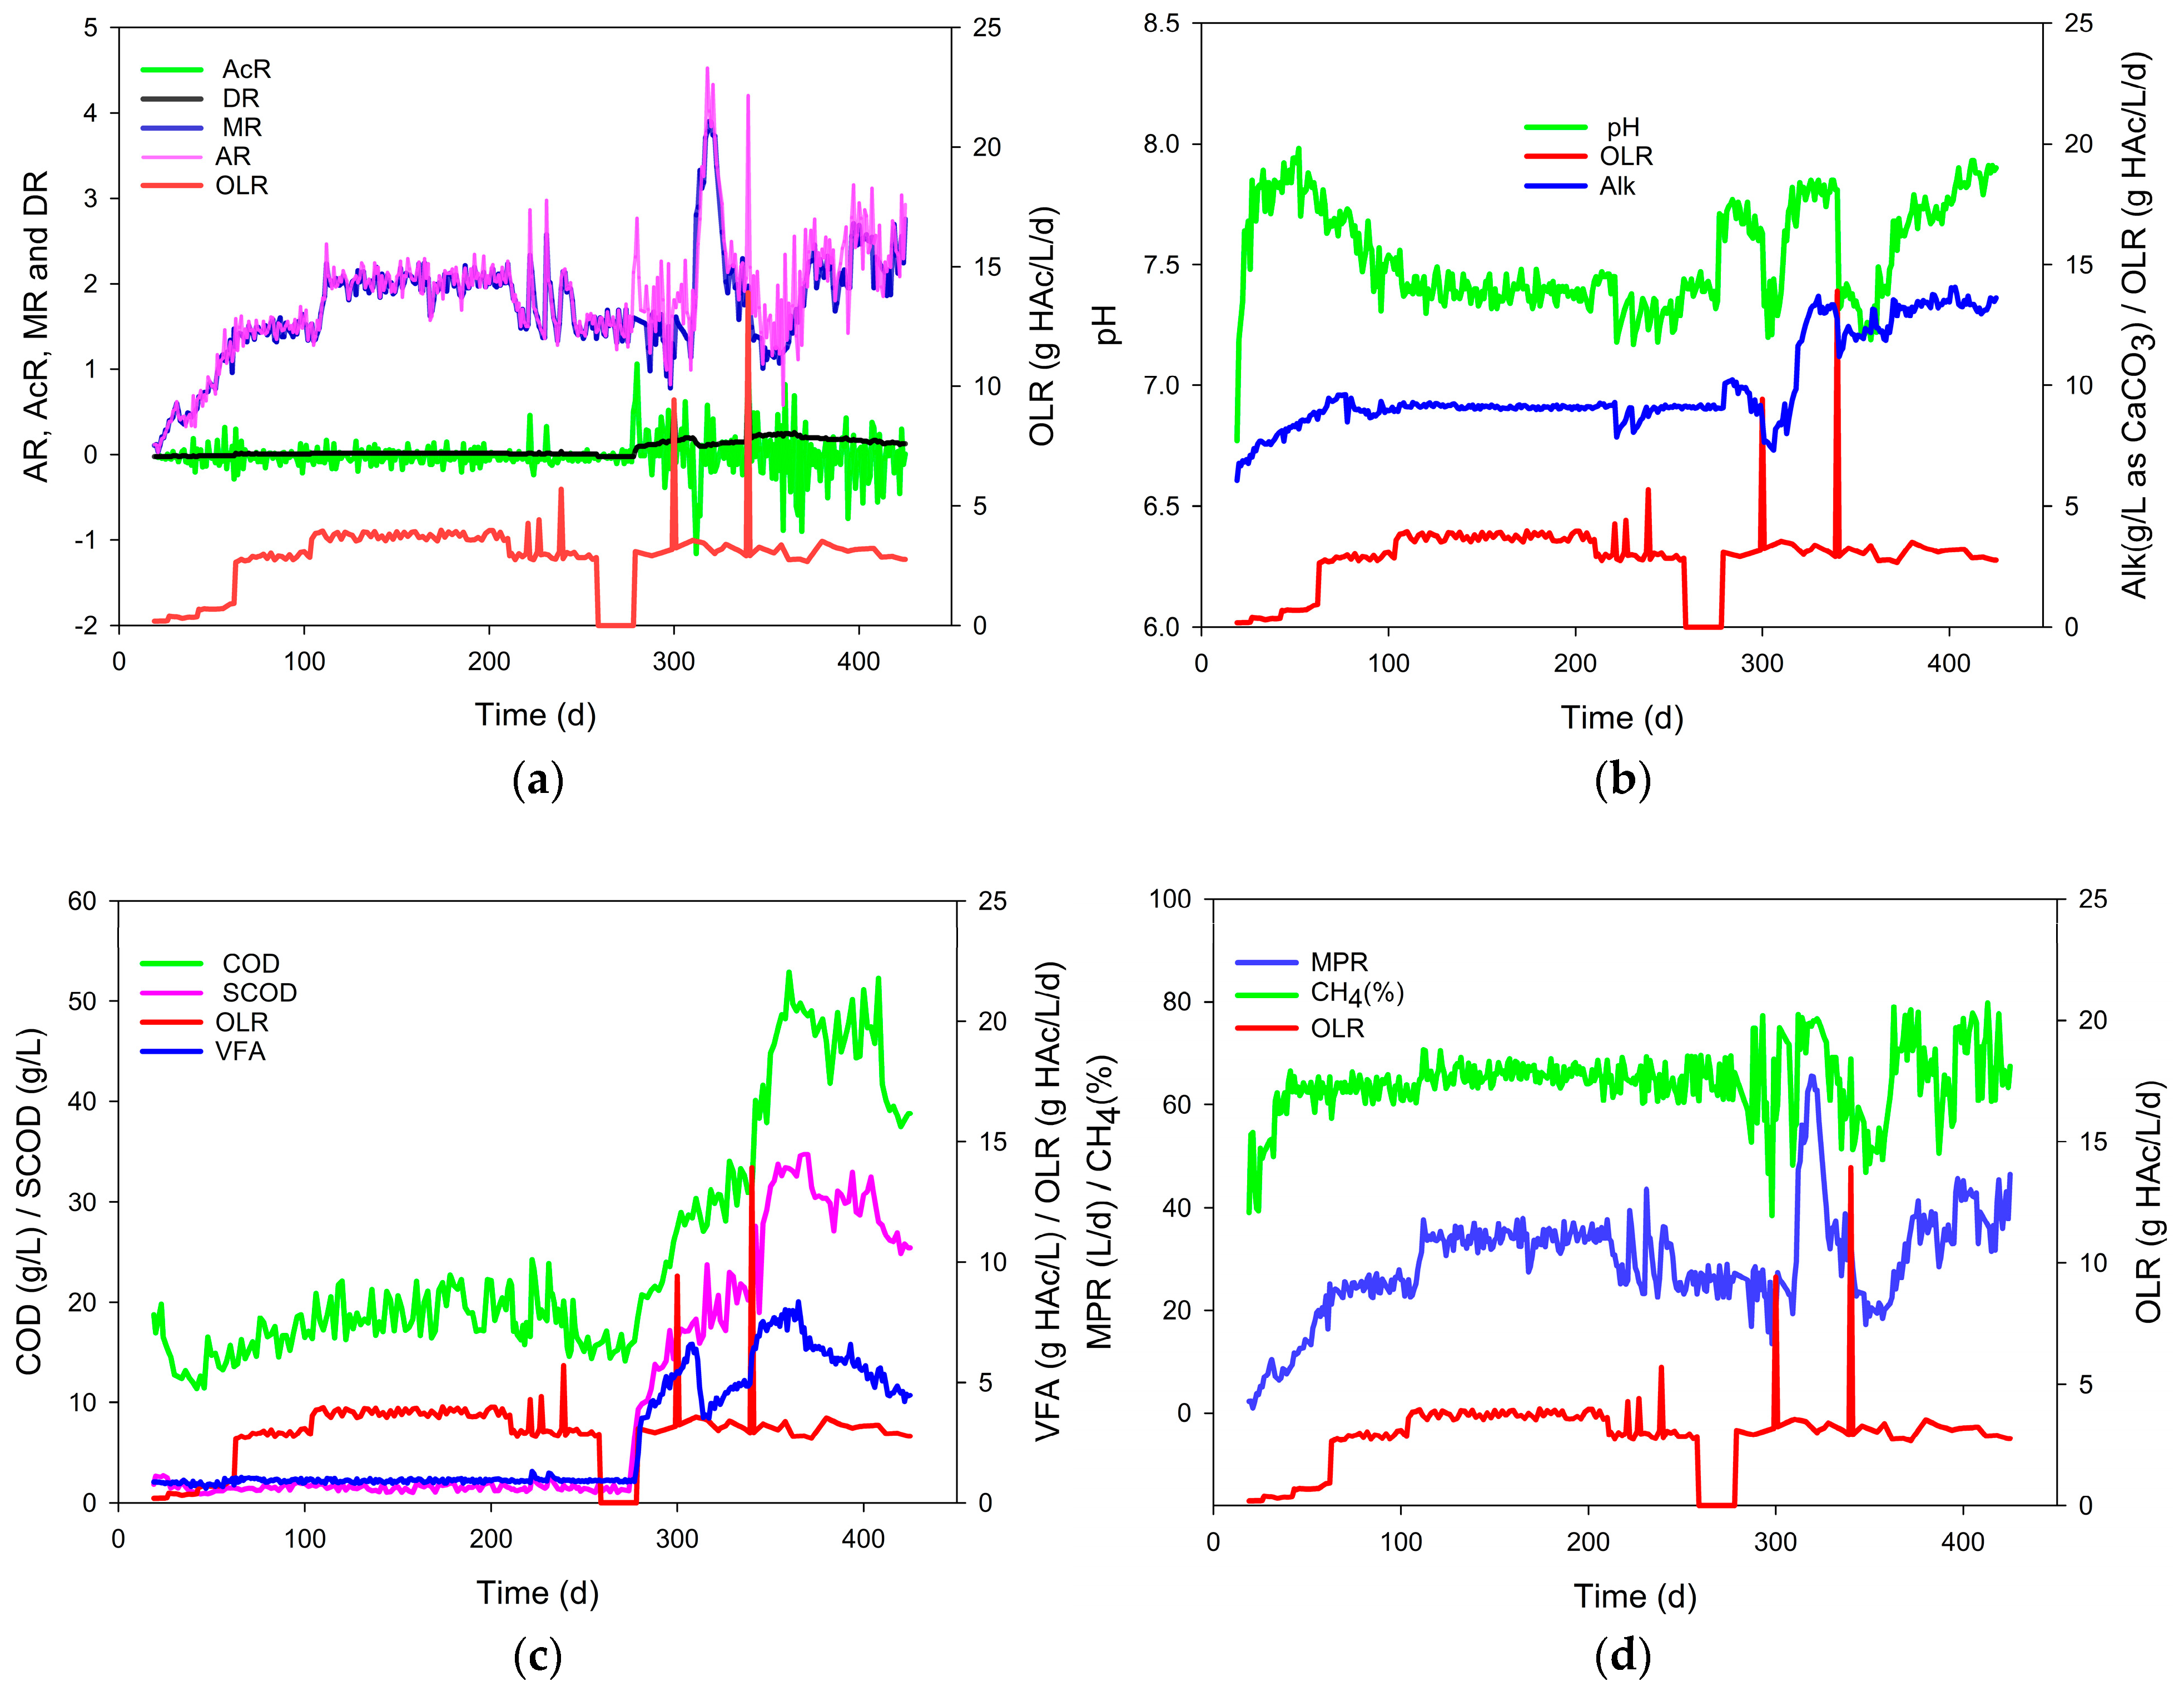
3.1. Kinetic Response of Anaerobic Digestion to the Fluctuations in OLR
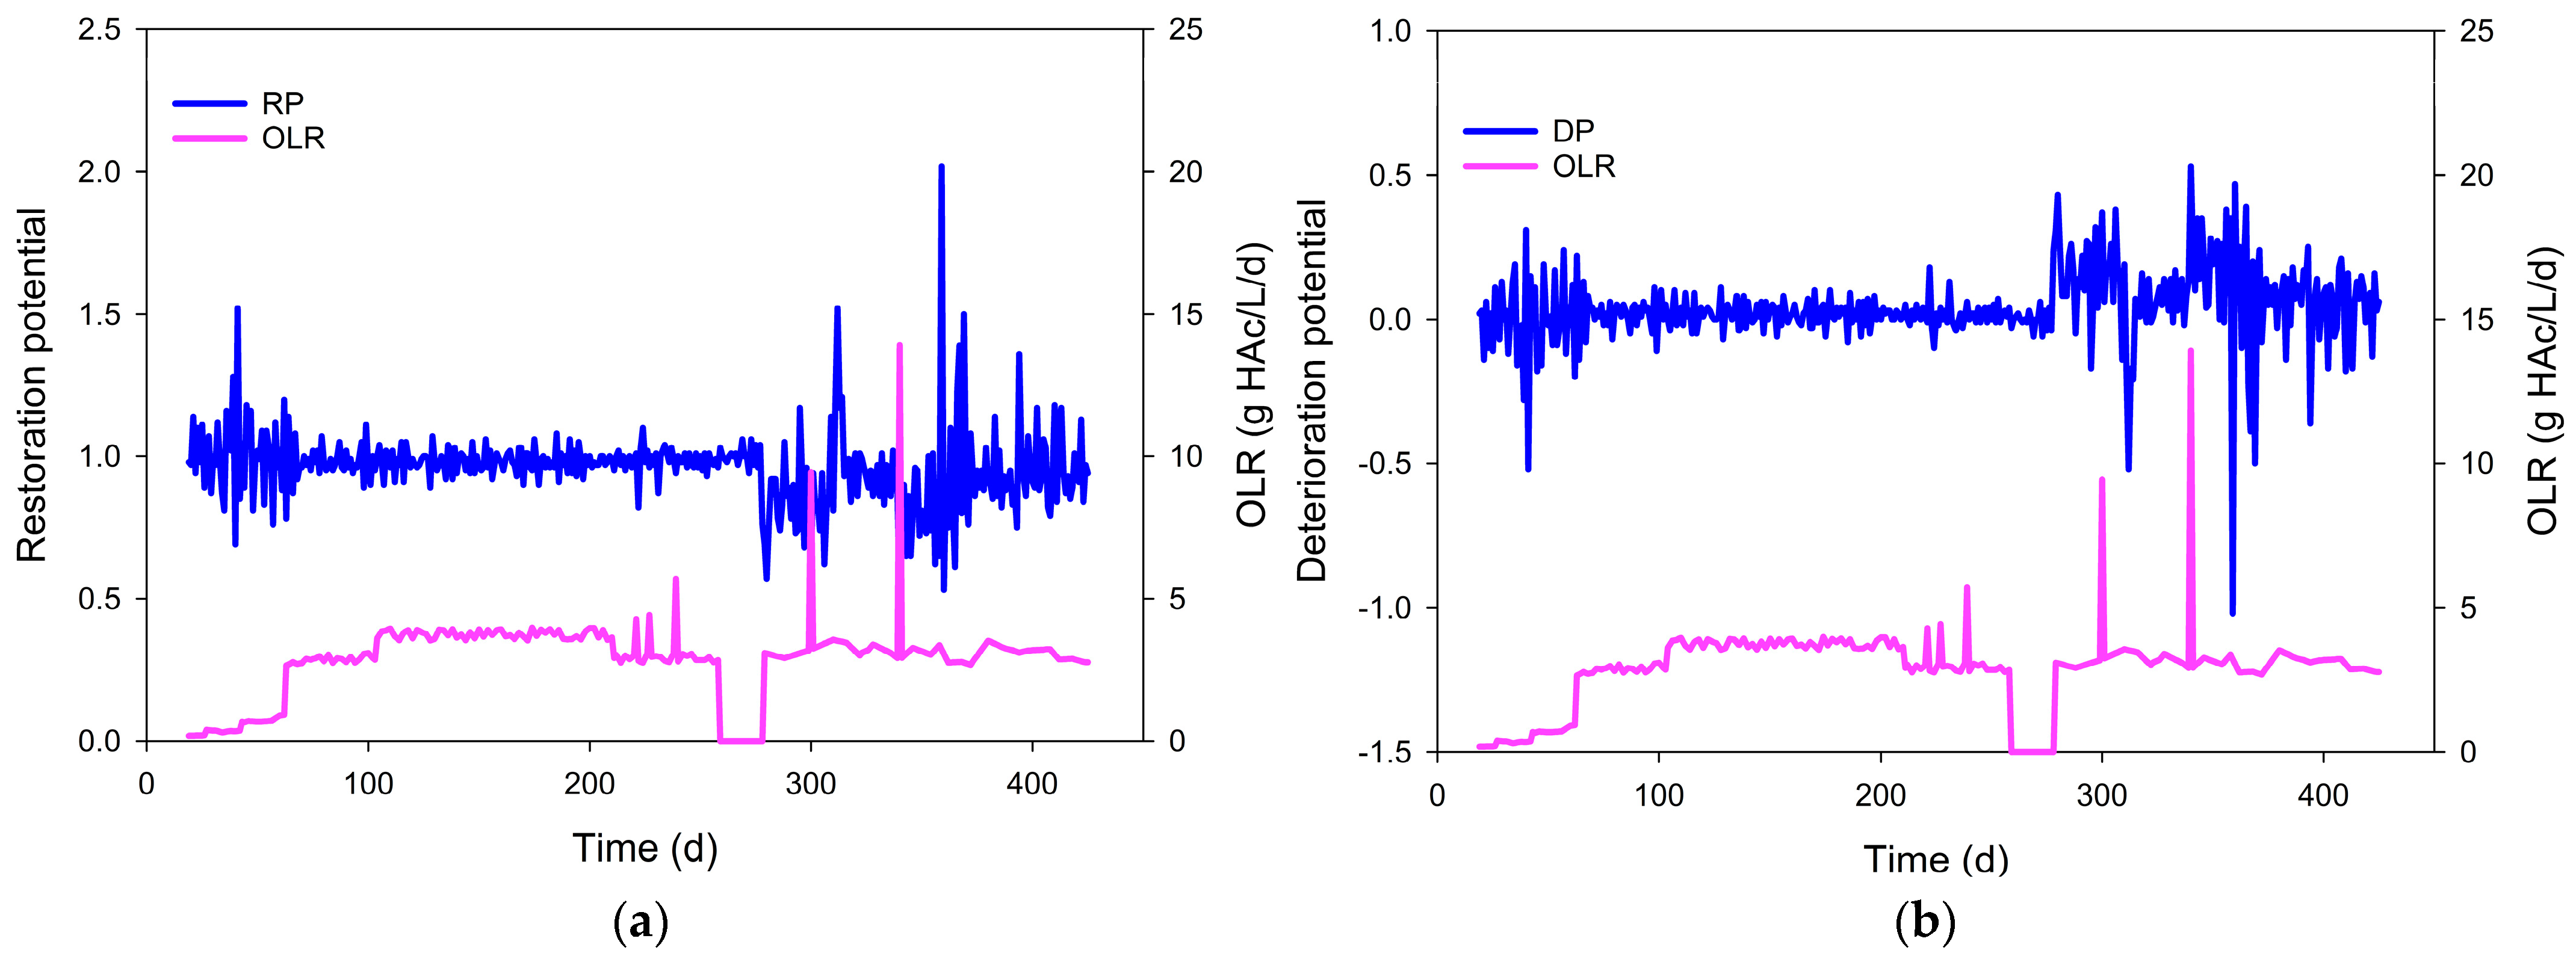
3.2. Restoration and Deterioration of the Kinetic Balance in the Biochemical Reactions
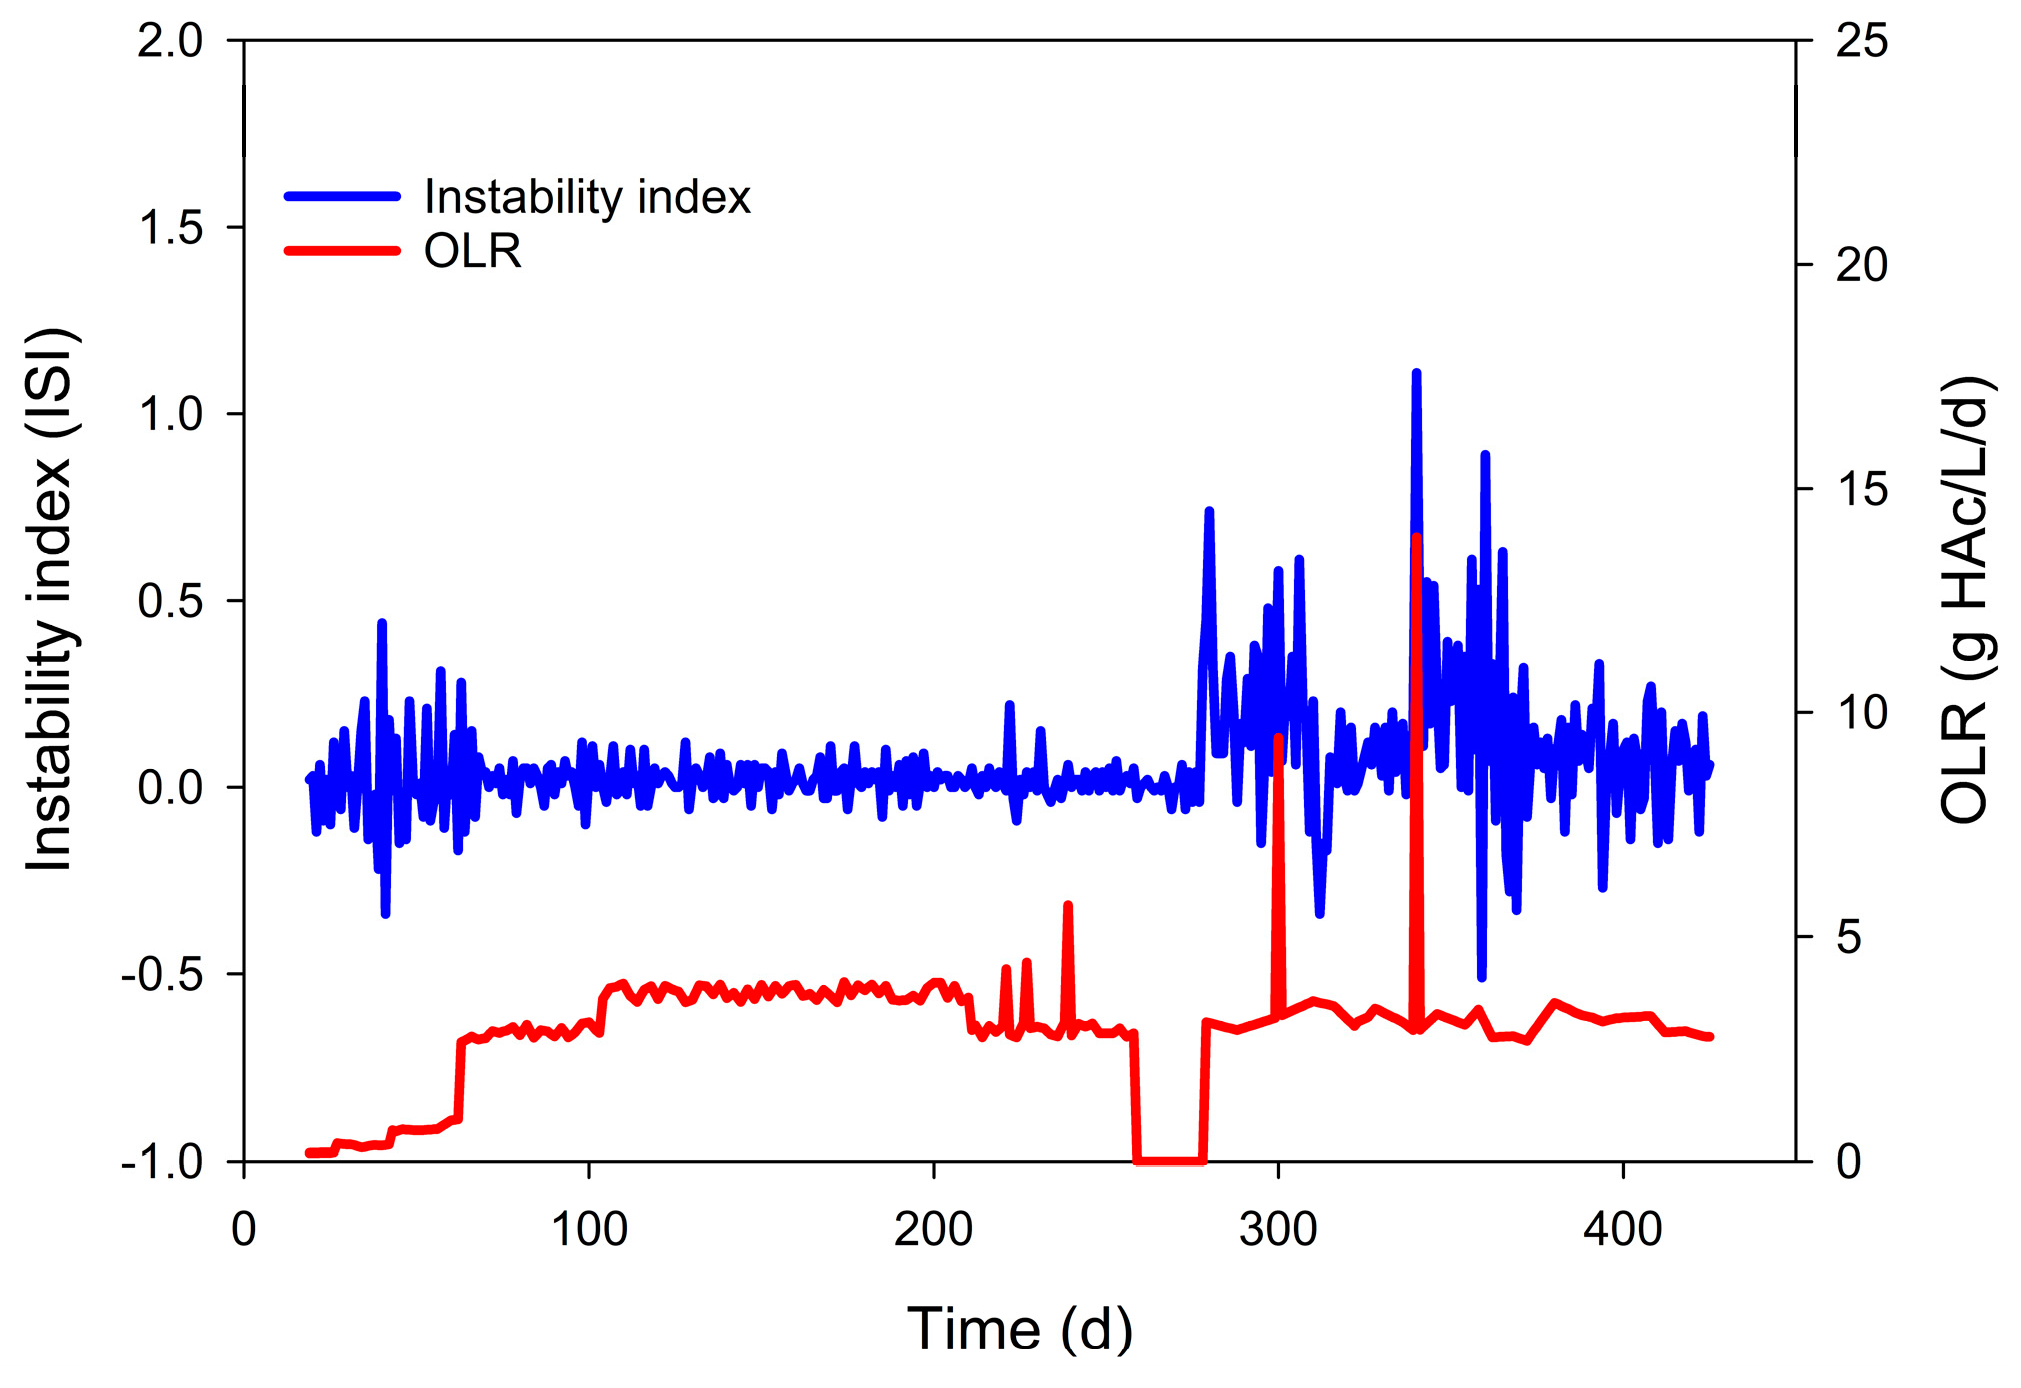
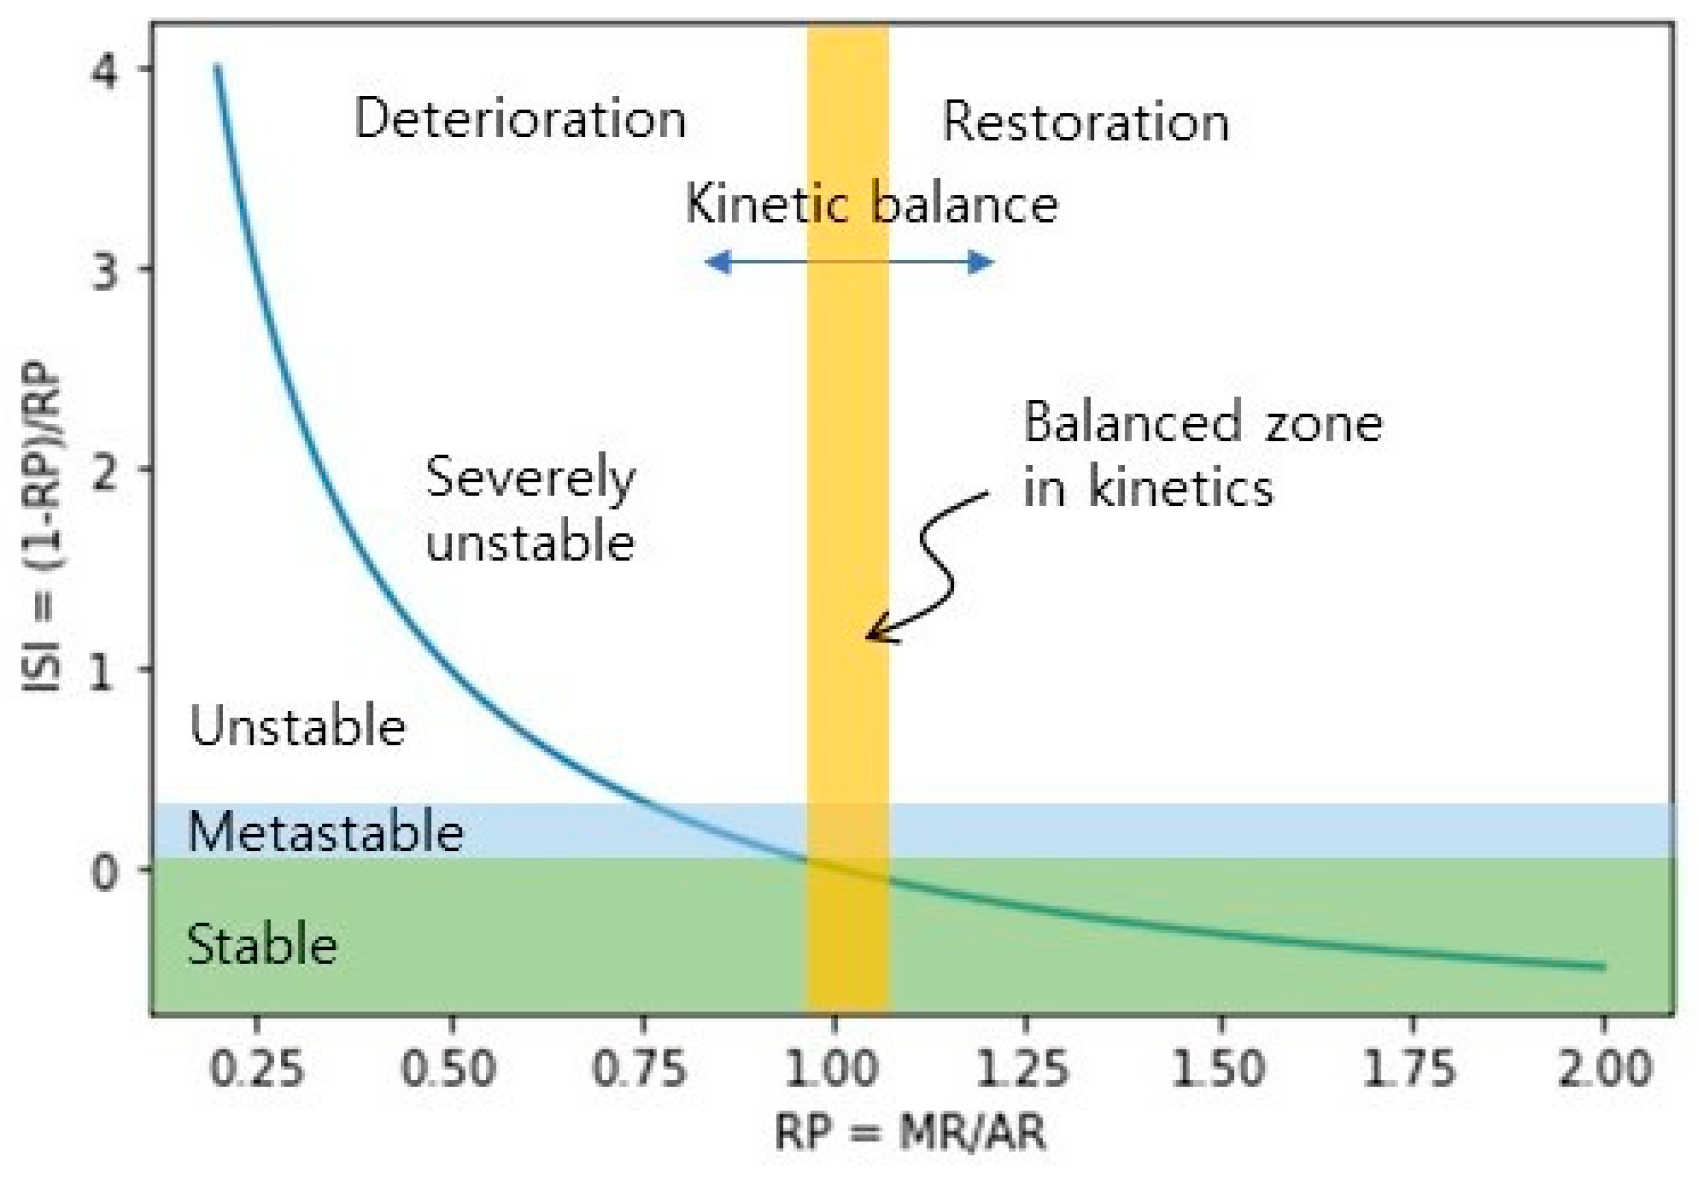
3.3. Instability Index (ISI) of Anaerobic Digestion
4. Discussion
5. Conclusions
Author Contributions
Funding
Data Availability Statement
Acknowledgments
Conflicts of Interest
References
- Jia, R.; Song, Y.C.; Piao, D.M.; Kim, K.; Lee, C.Y.; Park, J. Exploration of deep learning models for real-time monitoring of state and performance of anaerobic digestion with online sensors. Bioresour. Technol. 2022, 363, 127908. [Google Scholar] [CrossRef] [PubMed]
- Yu, H.; Song, Y.C.; Bae, B.U.; Li, J.; Jang, S.H. Electrostatic Fields Promote Methanogenesis More than Polarized Bioelectrodes in Anaerobic Reactors with Conductive Materials. ACS Omega 2021, 6, 29703–29712. [Google Scholar] [CrossRef] [PubMed]
- Wang, J.; Sun, Y.; Zhang, D.; Broderick, T.; Strawn, M.; Santha, H.; Pallansch, K.; Deines, A.; Wang, Z.W. Unblocking the rate-limiting step of the municipal sludge anaerobic digestion. Water Environ. Res. 2022, 94, e10793. [Google Scholar] [CrossRef] [PubMed]
- Van, D.P.; Fujiwara, T.; Tho, B.L.; Toan, P.P.S.; Minh, G.H. A review of anaerobic digestion systems for biodegradable waste: Configurations, operating parameters, and current trends. Environ. Eng. Res. 2020, 25, 1–17. [Google Scholar] [CrossRef]
- Morales-Polo, C.; Cledera-Castro MD, M.; Moratilla Soria, B.Y. Reviewing the anaerobic digestion of food waste: From waste generation and anaerobic process to its perspectives. Appl. Sci. 2018, 8, 1804. [Google Scholar] [CrossRef]
- Shin, H.S.; Song, Y.C. A model for evaluation of anaerobic degradation characteristics of organic waste: Focusing on kinetics, rate-limiting step. Environ. Technol. 1995, 16, 775–784. [Google Scholar] [CrossRef]
- Oh, G.G.; Song, Y.C.; Bae, B.U.; Lee, C.Y. Electric field-driven direct interspecies electron transfer for bioelectrochemical methane production from fermentable and non-fermentable substrates. Processes 2020, 8, 1293. [Google Scholar] [CrossRef]
- Shin, S.G.; Park, S.H.; Hwang, S. Substrate Characteristics Fluctuations in Full-Scale Anaerobic Digesters Treating Food Waste at Marginal Organic Loading Rates: A Case Study. Energies 2022, 15, 3471. [Google Scholar] [CrossRef]
- Trujillo-Reyes, Á.; Serrano, A.; Cubero-Cardoso, J.; Fernández-Prior, Á.; Fermoso, F.G. Does seasonality of feedstock affect anaerobic digestion? Biomass Convers. Biorefin. 2022, 1–10. [Google Scholar] [CrossRef]
- Khalid, A.; Arshad, M.; Anjum, M.; Mahmood, T.; Dawson, L. The anaerobic digestion of solid organic waste. Waste Manag. 2011, 31, 1737–1744. [Google Scholar] [CrossRef]
- Wu, D.; Li, L.; Peng, Y.; Yang, P.; Peng, X.; Sun, Y.; Wang, X. State indicators of anaerobic digestion: A critical review on process monitoring and diagnosis. Renew. Sustain. Energy Rev. 2021, 148, 111260. [Google Scholar] [CrossRef]
- Feng, Q.; Song, Y.C.; Kim, D.H.; Kim, M.S.; Kim, D.H. Influence of the temperature and hydraulic retention time in bioelectrochemical anaerobic digestion of sewage sludge. Int. J. Hydrogen Energy 2019, 44, 2170–2179. [Google Scholar] [CrossRef]
- Uddin, M.M.; Wright, M.M. Anaerobic digestion fundamentals, challenges, and technological advances. Phys. Sci. Rev. 2022. [Google Scholar] [CrossRef]
- EPA. Anaerobic Digester/Biogas System Operator Guidebook; EPA 430-B-20-003; EPA: Washington, DC, USA, 2020; pp. 8.4–8.6.
- Singh, B.; Szamosi, Z.; Siménfalvi, Z. Impact of mixing intensity and duration on biogas production in an anaerobic digester: A review. Crit. Rev. Biotechnol. 2020, 40, 508–521. [Google Scholar] [CrossRef] [PubMed]
- Li, L.; Peng, X.; Wang, X.; Wu, D. Anaerobic digestion of food waste: A review focusing on process stability. Bioresour. Technol. 2018, 248, 20–28. [Google Scholar] [CrossRef] [PubMed]
- Ahring, B.K.; Sandberg, M.; Angelidaki, I. Volatile fatty acids as indicators of process imbalance in anaerobic digestors. Appl. Microbiol. Biotechnol. 1995, 43, 559–565. [Google Scholar] [CrossRef]
- Dyksma, S.; Jansen, L.; Gallert, C. Syntrophic acetate oxidation replaces acetoclastic methanogenesis during thermophilic digestion of biowaste. Microbiome 2020, 8, 105. [Google Scholar] [CrossRef]
- Müller, N.; Worm, P.; Schink, B.; Stams, A.J.M.; Plugge, C.M. Syntrophic butyrate and propionate oxidation processes: From genomes to reaction mechanisms. Environ. Microbiol. Rep. 2010, 2, 489–499. [Google Scholar] [CrossRef]
- Schink, B.; Friedrich, M. Energetics of syntrophic fatty acid oxidation. FEMS Microbiol. Rev. 1994, 15, 85–94. [Google Scholar] [CrossRef]
- Onwosi, C.O.; Eke, I.E.; Igbokwe, V.C.; Odimba, J.N.; Ndukwe, J.K.; Chukwu, K.O.; Aliyu, G.O.; Nwagu, T.N. Towards effective management of digester dysfunction during anaerobic treatment processes. Renew. Sustain. Energy Rev. 2019, 116, 109424. [Google Scholar] [CrossRef]
- Pontoni, L.; Panico, A.; Salzano, E.; Frunzo, L.; Iodice, P.; Pirozzi, F. Innovative parameters to control the efficiency of anaerobic digestion process. Chem. Eng. Trans. 2015, 43, 2089–2094. [Google Scholar] [CrossRef]
- Sun, H.; Ni, P.; Angelidaki, I.; Dong, R.; Wu, S. Exploring stability indicators for efficient monitoring of anaerobic digestion of pig manure under perturbations. Waste Manag. 2019, 91, 139–146. [Google Scholar] [CrossRef] [PubMed]
- Dong, F.; Zhao, Q.B.; Li, W.W.; Sheng, G.P.; Zhao, J.B.; Tang, Y.; Yu, H.Q.; Kubota, K.; Li, Y.Y.; Harada, H. Novel online monitoring and alert system for anaerobic digestion reactors. Environ. Sci. Technol. 2011, 45, 9093–9100. [Google Scholar] [CrossRef] [PubMed]
- Li, L.; He, Q.; Wei, Y.; He, Q.; Peng, X. Early warning indicators for monitoring the process failure of anaerobic digestion system of food waste. Bioresour. Technol. 2014, 171, 491–494. [Google Scholar] [CrossRef] [PubMed]
- Wismüller, A.; Dsouza, A.M.; Vosoughi, M.A.; Abidin, A. Large-scale nonlinear Granger causality for inferring directed dependence from short multivariate time-series data. Sci. Rep. 2021, 11, 7817. [Google Scholar] [CrossRef]
- Kotsyurbenko, O.R.; Chin, K.J.; Glagolev, M.V.; Stubner, S.; Simankova, M.V.; Nozhevnikova, A.N.; Conrad, R. Acetoclastic and hydrogenotrophic methane production and methanogenic populations in an acidic West-Siberian peat bog. Environ. Microbiol. 2004, 6, 1159–1173. [Google Scholar] [CrossRef]
- Adekunle, K.F.; Okolie, J.A. A review of biochemical process of anaerobic digestion. Adv. Biosci. Biotechnol. 2015, 6, 205–212. [Google Scholar] [CrossRef]
- Batstone, D.J.; Keller, J.; Angelidaki, I.; Kalyuzhnyi, S.V.; Pavlostathis, S.G.; Rozzi, A.; Sanders, W.T.M.; Siegrist, H.; Vavilin, V.A. The IWA anaerobic digestion model no 1 (ADM1). Water Sci. Technol. 2002, 45, 65–73. [Google Scholar] [CrossRef]
- Zou, L.; Wang, Y.; Wu, R.; Ji, S.; Wan, Y.; Cheng, H.; Li, Y.Y.; Liu, J. Increasing the organic loading rate of household food waste anaerobic digestion by landfill leachate addition: Performance and mechanism. J. Environ. Manag. 2023, 342, 118170. [Google Scholar] [CrossRef]
- Zhan, Y.; Cao, X.; Xiao, Y.; Wei, X.; Wu, S.; Zhu, J. Start-up of co-digestion of poultry litter and wheat straw in anaerobic sequencing batch reactor by gradually increasing organic loading rate: Methane production and microbial community analysis. Bioresour. Technol. 2022, 354, 127232. [Google Scholar] [CrossRef]
- Zhang, Y.; Li, C.; Yuan, Z.; Wang, R.; Angelidaki, I.; Zhu, G. Syntrophy mechanism, microbial population, and process optimization for volatile fatty acids metabolism in anaerobic digestion. Chem. Eng. J. 2023, 452, 139137. [Google Scholar] [CrossRef]
- Jiang, M.; Qiao, W.; Wang, Y.; Zou, T.; Lin, M.; Dong, R. Balancing acidogenesis and methanogenesis metabolism in thermophilic anaerobic digestion of food waste under a high loading rate. Sci. Total Environ. 2022, 824, 153867. [Google Scholar] [CrossRef] [PubMed]
- Amin, F.R.; Khalid, H.; El-Mashad, H.M.; Chen, C.; Liu, G.; Zhang, R. Functions of bacteria and archaea participating in the bioconversion of organic waste for methane production. Sci. Total Environ. 2021, 763, 143007. [Google Scholar] [CrossRef] [PubMed]
- Peces, M.; Astals, S.; Jensen, P.D.; Clarke, W.P. Deterministic mechanisms define the long-term anaerobic digestion microbiome and its functionality regardless of the initial microbial community. Water Res. 2018, 141, 366–376. [Google Scholar] [CrossRef]
- Wang, Y.N.; Wang, Q.; Li, Y.; Wang, H.; Gao, Y.; Sun, Y.; Wang, B.; Bian, R.; Li, W.; Zhan, M. Impact of incineration slag co-disposed with municipal solid waste on methane production and methanogens ecology in landfills. Bioresour. Technol. 2023, 377, 128978. [Google Scholar] [CrossRef]
- Guo, X.; Wang, C.; Sun, F.; Zhu, W.; Wu, W. A comparison of microbial characteristics between the thermophilic and mesophilic anaerobic digesters exposed to elevated food waste loadings. Bioresour. Technol. 2014, 152, 420–428. [Google Scholar] [CrossRef]
- Siegert, I.; Banks, C. The effect of volatile fatty acid additions on the anaerobic digestion of cellulose and glucose in batch reactors. Process Biochem. 2005, 40, 3412–3418. [Google Scholar] [CrossRef]
- Jantsch, T.G.; Mattiasson, B. An automated spectrophotometric system for monitoring buffer capacity in anaerobic digestion processes. Water Res. 2004, 38, 3645–3650. [Google Scholar] [CrossRef]
- Li, W.; Zhu, L.; Wu, B.; Liu, Y.; Li, J.; Xu, L.; Huangfu, X.; Shi, D.; Gu, L.; Chen, C. Improving mesophilic anaerobic digestion of food waste by side-stream thermophilic reactor: Activation of methanogenic, key enzymes and metabolism. Water Res. 2023, 241, 120167. [Google Scholar] [CrossRef]
- Li, L.; He, Q.; Ma, Y.; Wang, X.; Peng, X. A mesophilic anaerobic digester for treating food waste: Process stability and microbial community analysis using pyrosequencing. Microb. Cell Factories 2016, 15, 65. [Google Scholar] [CrossRef]
- Wu, D.; Li, L.; Zhen, F.; Liu, H.; Xiao, F.; Sun, Y.; Peng, X.; Li, Y.; Wang, X. Thermodynamics of volatile fatty acid degradation during anaerobic digestion under organic overload stress: The potential to better identify process stability. Water Res. 2022, 214, 118187. [Google Scholar] [CrossRef] [PubMed]
- Zhou, H.; Jiang, J.; Zhao, Q.; Li, L.; Wang, K.; Wei, L. Effects of organic loading rates on high-solids anaerobic digestion of food waste in horizontal flow reactor: Methane production, stability and mechanism. Chemosphere 2022, 293, 133650. [Google Scholar] [CrossRef] [PubMed]
- Goux, X.; Calusinska, M.; Fossépré, M.; Benizri, E.; Delfosse, P. Start-up phase of an anaerobic full-scale farm reactor–Appearance of mesophilic anaerobic conditions and establishment of the methanogenic microbial community. Bioresour. Technol. 2016, 212, 217–226. [Google Scholar] [CrossRef] [PubMed]
- Awhangbo, L.; Bendoula, R.; Roger, J.M.; Béline, F. Detection of early imbalances in semi-continuous anaerobic co-digestion process based on instantaneous biogas production rate. Water Res. 2020, 171, 115444. [Google Scholar] [CrossRef]
- Kafle, G.K.; Kim, S.H. Sludge exchange process on two serial CSTRs anaerobic digestions: Process failure and recovery. Bioresour. Technol. 2011, 102, 6815–6822. [Google Scholar] [CrossRef]
- Wilches, C.; Vaske, M.; Hartmann, K.; Nelles, M. Representative sampling implementation in online VFA/TIC monitoring for anaerobic digestion. Energies 2019, 12, 1179. [Google Scholar] [CrossRef]
- Wu, D.; Li, L.; Zhao, X.; Peng, Y.; Yang, P.; Peng, X. Anaerobic digestion: A review on process monitoring. Renew. Sustain. Energy Rev. 2019, 103, 1–12. [Google Scholar] [CrossRef]
- Gaida, D.; Wolf, C.; Bongards, M. Feed control of anaerobic digestion processes for renewable energy production: A review. Renew. Sustain. Energy Rev. 2017, 68, 869–875. [Google Scholar] [CrossRef]


| Parameters | HLS | PFW | Mixed Substrate | Inoculum |
|---|---|---|---|---|
| pH | 7.64 ± 0.02 | 5.46 ± 0.04 | 5.73 ± 0.04 | 7.58 ± 0.03 |
| Alkalinity (g/L CaCO3) | 12.8 ± 1.0 | 2.6 ± 1.0 | 4.66 ± 0.53 | 3.0 ± 0.1 |
| VFA (g COD/L) | 8.0 ± 0.6 | 1.4 ± 0.4 | 3.30 ± 0.19 | 0.7 ± 0.0 |
| COD (g/L) | 64.9 ± 2.0 | 112.1 ± 8.4 | 88.07 ± 6.68 | 12.5 ± 0.0 |
| SCOD (g/L) | 58.5 ± 3.4 | 42.8 ± 7.3 | 47.79 ± 6.09 | 53.5 ± 1.6 |
| TS (g/L) | 58.4 ± 1.7 | 103.6 ± 4.4 | 72.76 ± 1.74 | 118.7 ± 3.0 |
| VS (g/L) | 43.7 ± 1.3 | 87.02 ± 2.5 | 56.27 ± 2.29 | 65.7 ± 2.2 |
| Condition | Variable Behavior | RP | ISI | AD State | ||||
|---|---|---|---|---|---|---|---|---|
| Range | Mean | Std | Range | Mean | Std | |||
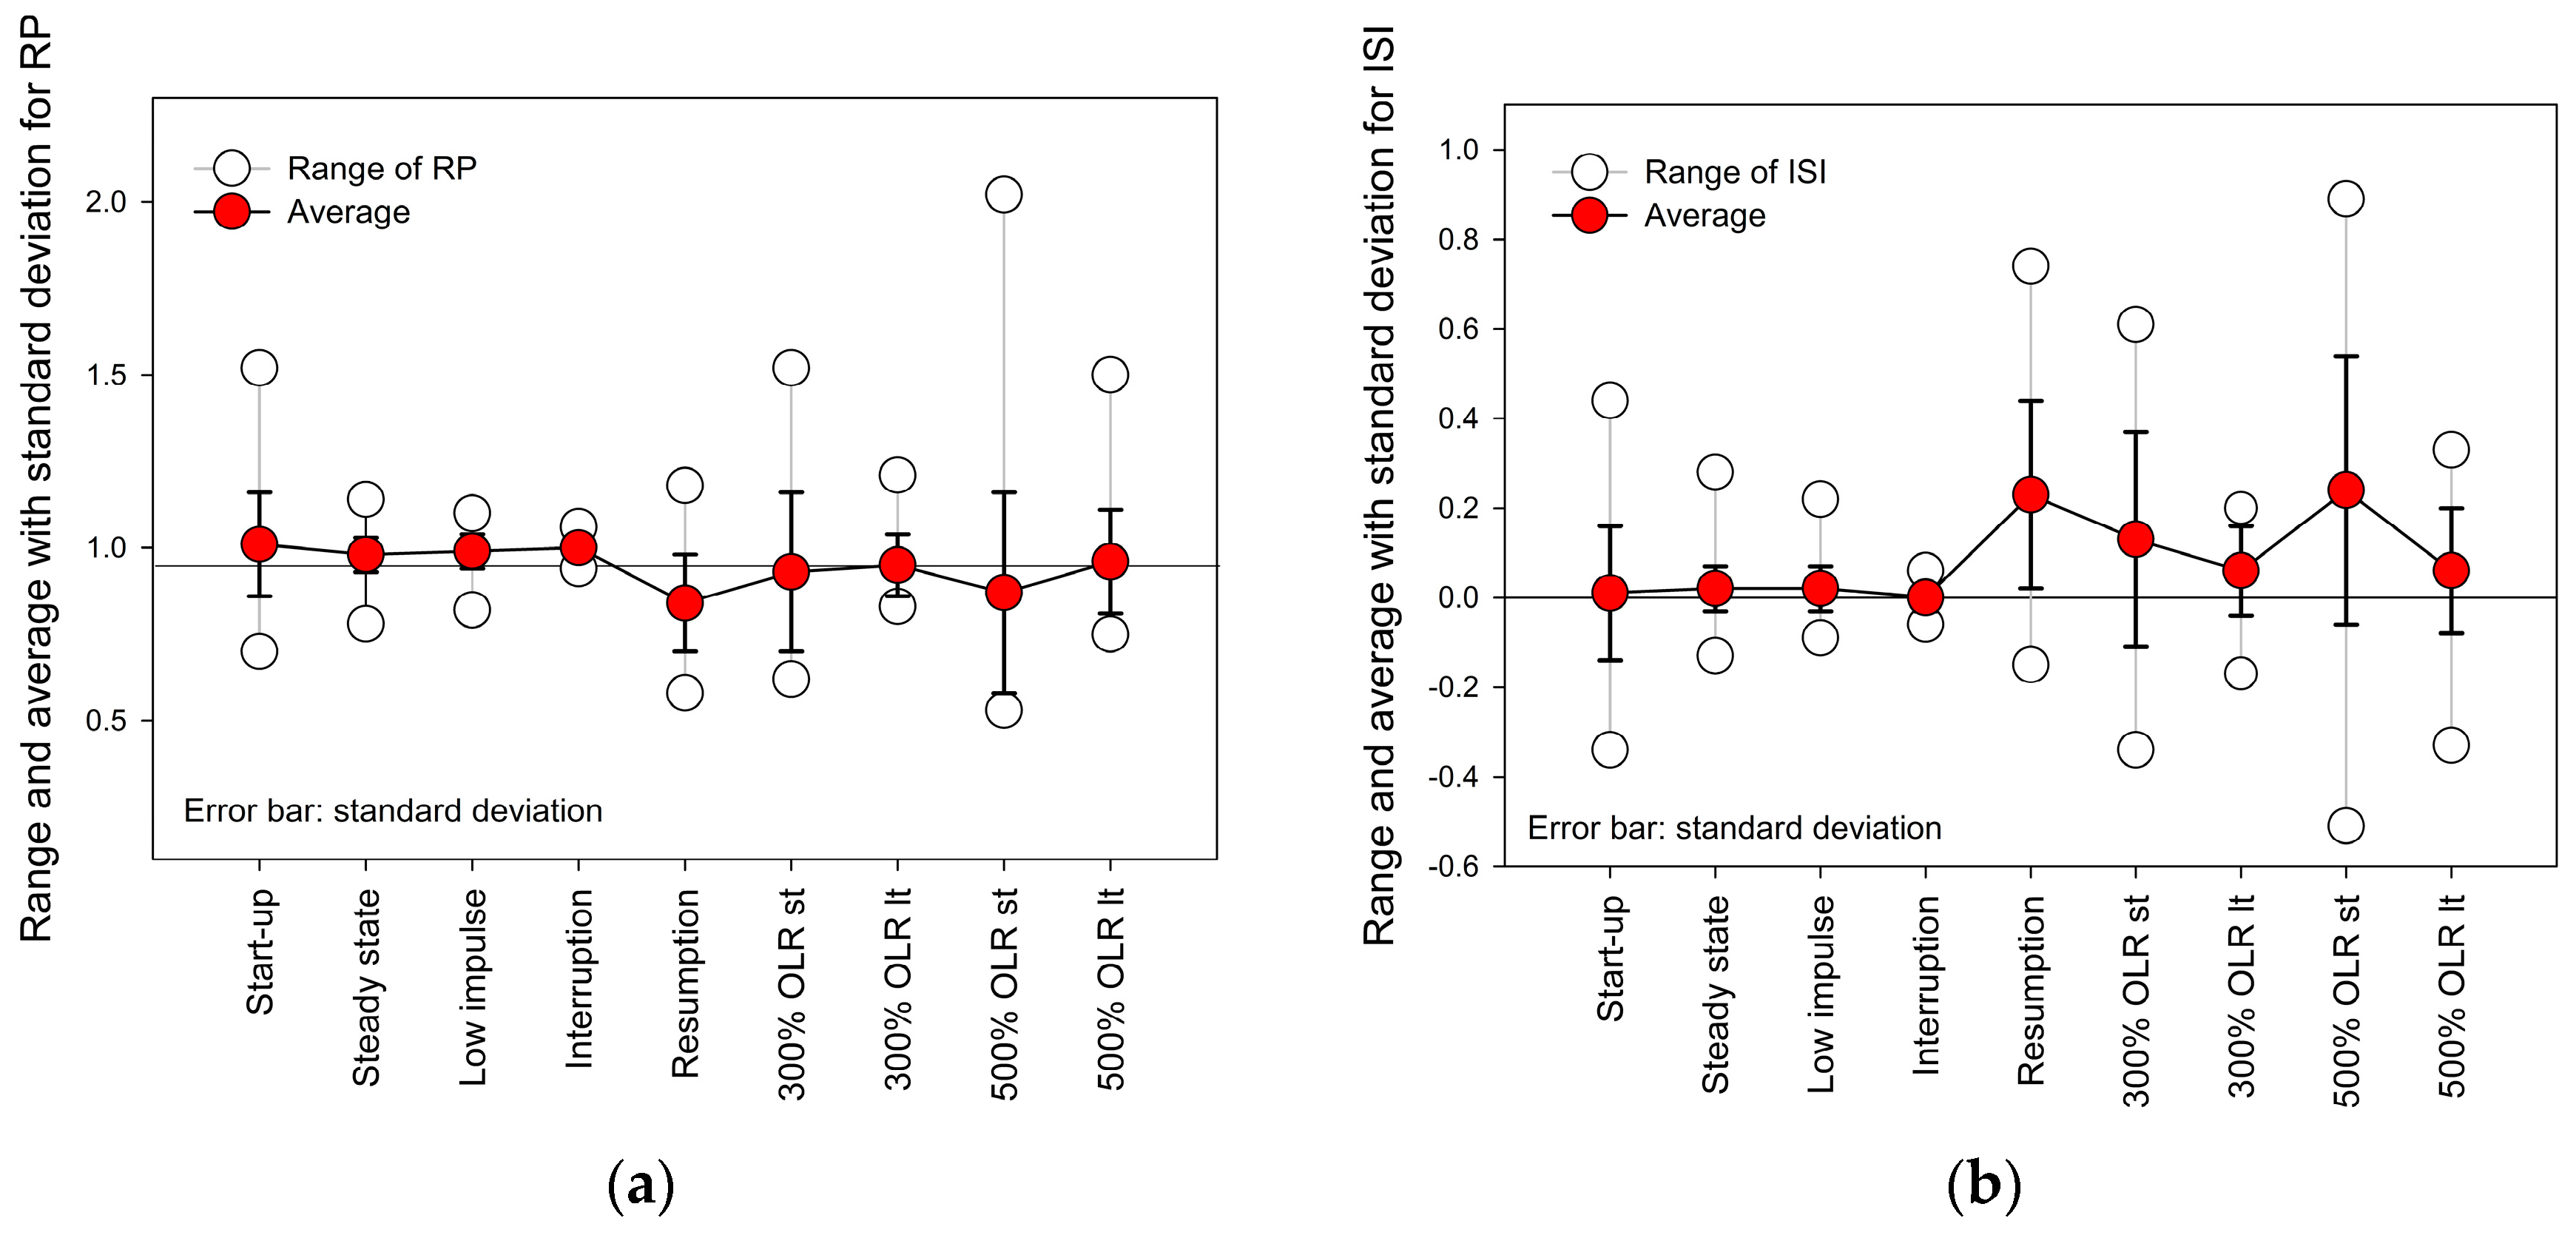
| Startup | AR and MR increased. | 0.70~1.52 | 1.01 | 0.15 | −0.34~0.44 | 0.01 | 0.15 | Stable |
| Steady state | MR approached AR; AcR and DR maintained low and stable. | 0.78~1.14 | 0.98 | 0.05 | −0.13~0.28 | 0.02 | 0.05 | Stable |
| After low-impulse OLRs (<200%) | MR was close to AR, and a small peak in AcR. | 0.82~1.10 | 0.99 | 0.05 | −0.09~0.22 | 0.02 | 0.05 | Stable |
| Interruption of substrate supply | No change. | 0.94~1.06 | 1.00 | 0.03 | −0.06~0.06 | 0.00 | 0.03 | Stable |
| Aftermath following resumption of substrate supply | Upward AR, AcR, DR, and downward MR. | 0.58~1.18 | 0.84 | 0.14 | −0.15~0.74 | 0.23 | 0.21 | Unstable |
| Aftermath following the impulse OLR (300%) | (i) Short term: SCOD and VFA increased; pH and Alk decreased. | 0.62~1.52 | 0.93 | 0.23 | −0.34~0.61 | 0.13 | 0.24 | Metastable |
| (ii) Long term: downward AcR; upward MR, AR. | 0.83~1.21 | 0.95 | 0.09 | −0.17~0.20 | 0.06 | 0.10 | Metastable | |
| Aftermath following the impulse OLR of 500% | (i) Short term: AR higher than MR. | 0.53~2.02 | 0.87 | 0.29 | −0.51~0.89 | 0.24 | 0.30 | Unstable |
| (ii) Long term: the downward of AcR began to increase. | 0.75~1.50 | 0.96 | 0.15 | −0.33~0.33 | 0.06 | 0.14 | Metastable | |
Disclaimer/Publisher’s Note: The statements, opinions and data contained in all publications are solely those of the individual author(s) and contributor(s) and not of MDPI and/or the editor(s). MDPI and/or the editor(s) disclaim responsibility for any injury to people or property resulting from any ideas, methods, instructions or products referred to in the content. |
© 2023 by the authors. Licensee MDPI, Basel, Switzerland. This article is an open access article distributed under the terms and conditions of the Creative Commons Attribution (CC BY) license (https://creativecommons.org/licenses/by/4.0/).
Share and Cite
Jia, R.; Song, Y.-C.; An, Z.; Kim, K.; Oa, S.-W. Unraveling Anaerobic Digestion Instability: A Simple Index Based on the Kinetic Balance of Biochemical Reactions. Processes 2023, 11, 2852. https://doi.org/10.3390/pr11102852
Jia R, Song Y-C, An Z, Kim K, Oa S-W. Unraveling Anaerobic Digestion Instability: A Simple Index Based on the Kinetic Balance of Biochemical Reactions. Processes. 2023; 11(10):2852. https://doi.org/10.3390/pr11102852
Chicago/Turabian StyleJia, Ru, Young-Chae Song, Zhengkai An, Keugtae Kim, and Seong-Wook Oa. 2023. "Unraveling Anaerobic Digestion Instability: A Simple Index Based on the Kinetic Balance of Biochemical Reactions" Processes 11, no. 10: 2852. https://doi.org/10.3390/pr11102852
APA StyleJia, R., Song, Y.-C., An, Z., Kim, K., & Oa, S.-W. (2023). Unraveling Anaerobic Digestion Instability: A Simple Index Based on the Kinetic Balance of Biochemical Reactions. Processes, 11(10), 2852. https://doi.org/10.3390/pr11102852