Article

Origin and Geological Significance of Residual Oil in High-Angle Joint Fissures: A Case Study of the Nadu Formation in Baise Basin, South China

1
Hubei Key Laboratory of Petroleum Geochemistry and Environment, Yangtze University, Wuhan 430100, China
2
School of Resources and Environment, Yangtze University, Wuhan 430100, China
3
Hubei Key Laboratory of Oil and Gas Drilling and Production Engineering, Yangtze University, Wuhan 430100, China
4
Research Institute of Exploration and Development, Sinopec Jiangsu Oilfield Company, Yangzhou 225009, China
*
Author to whom correspondence should be addressed.
Processes 2023, 11(10), 2850; https://doi.org/10.3390/pr11102850
Submission received: 12 September 2023 / Revised: 21 September 2023 / Accepted: 25 September 2023 / Published: 27 September 2023

Abstract

:
The Baise Basin is a Paleogene pull-apart basin with numerous strike-slip faults which are not favorable for hydrocarbon preservation. The Nadu Formation, research object of this paper, is generally rich in oil and contains a large number of high-angle joint fissures. Analyzing the origin of residual oil in high-angle joint fissures can reveal the hydrocarbon migration and accumulation characteristics of the pull-apart-type basins. Molecular geochemical composition characteristics of crude oil and oil source of the Nadu Formation were discussed based on the saturated hydrocarbon biomarker compound and stable carbon isotope distribution of n-alkanes. The studied samples were selected from four members (E2n1, E2n2, E2n3up, and E2n3low) of the Nadu Formation. The results suggested that the average oil content of E2n1 fissures is 0.32 mg/cm2, and the oil distribution is not uniform. The distribution of oil on the fissures of E2n2 and E2n3 is uniform and complete, and the oil content reaches 0.53 mg/cm2. The oil in the joint fissures of the Nadu Formation is heavy, as the light hydrocarbon is seriously lost during migration. Thus, the oil in the joint fissures is residue after crude oil loses light components during migration. By comparing the molecular biomarker characteristics and stable carbon isotopic compositions, crude oil of the Nadu Formation can be classified into three categories: E2n1, E2n2 + E2n3up, and E2n3low. The E2n1 oils have the lowest maturity and are sourced from the E2n1 source rocks. Moreover, the maturity of E2n2 and E2n3 samples are relatively high. Biomarker and carbon isotope characteristics of the E2n2 and E2n3up oils are similar, indicating that they are derived from the E2n2 + E2n3up source rocks. The E2n3low oils are the mixture of the crude oil generated from the E2n3up source rocks and the E2n3low source rocks. Results presented show that the residual oil of high-angle joint fissures in the Nadu Formation is contributed by adjacent source rocks. The crude oil discharged from the Nadu Formation can only migrate upward along high-angle joints in a short distance, and the migration distance is usually less than 5 m. In conclusion, although the Nadu Formation has developed a large number of high-angle joint fissures, crude oil in the Nadu Formation has not vertically migrated for long distance along the joint fissures. The well-preserved fractures as important shale oil storage spaces indicate that the Nadu Formation has good shale oil exploration potential. The results may provide insights into the origins of hydrocarbons in the Nadu Formation from the Baise Basin and enhanced knowledge for optimizing future exploration and production.

1. Introduction

Pull-apart basins are known to develop a large number of high-angle or even steep faults and fractures due to the action of transtension or transpression [1]. These faults and fractures serve as important hydrocarbon migration pathways and reservoir spaces in continuous subsidence basins [2,3,4,5]. However, late-exposed pull-apart basins often result in a large loss of hydrocarbons, which is not conducive to preservation [6].
The Baise Basin is a typical inland pull-apart basin resulting from a crustal pull-apart movement caused by the collision of the Indian and Eurasian plates [7,8]. It has been eroded since the Paleogene, resulting in a large number of strike-slip faults, which is unfavorable for hydrocarbons preservation [9]. In 1936, oil-bearing sandstone outcrops were first discovered, and since the 1970s, several conventional oil and gas reservoirs have been found in the eastern depression of the Baise Basin [10]. Previous studies that used organic carbon content and vitrinite reflectance methods indicate that the E2n2 source rocks of the Nadu Formation in the eastern depression of the Baise Basin are an efficient source rock in the eastern depression [10]. By analyzing the characteristics of crude oil biomarkers and carbon isotopes in the Baise Basin, extensive studies have revealed that the original accumulation has the characteristics of near-source focusing. This phenomenon may be related to the lack of a wide-coverage transport layer, fault cutting, and sealing in the basin [11]. Previous studies have analyzed the elements of the oil system in the Baise Basin, indicating that the source-reservoir-cap assemblage in the basin is good. However, the tectonic action of the Baise pull-apart Basin influences its oil preservation conditions. A number of fractures and faults lead to oil and gas seepage, and the prospect of oil is not optimistic [12,13]. Previous studies have been performed on various aspects such as source rock distribution, geochemical characteristics, petroleum system, development characteristics of the sedimentary reservoir, period of hydrocarbon accumulation, and causes of reservoir fissures. However, problems of oil source and migration distance in the study area have not been clarified. This paper conducts research on these aspects.
However, in the past two decades, shale oil exploration has been stagnant due to the lack of major discoveries. Driven by shale oil development, Sinopec Jiangsu Oilfield drilled the Kunye 1 well in the Baise Basin, fully exposing the source rocks of the Nadu Formation. According to the seismic facies characteristics of the cross-well seismic section, the source rocks of the Nadu Formation have good continuity and are far away from the seismic identifiable faults. Core observation reveal that a large number of high-angle joint fissures are developed in the Nadu Formation, which contain oil to varying degrees. Therefore, the Nadu Formation in Kunye 1 well is a good sample for studying the relationship between joint fissures and oil migration. The characteristics of oil sources in each part were analyzed using organic geochemical analysis technology. This study effectively indicates the migration distance of crude oil within the joint fissures, and offer compelling evidence to examine the impact of these joint fissures on the preservation of oil.

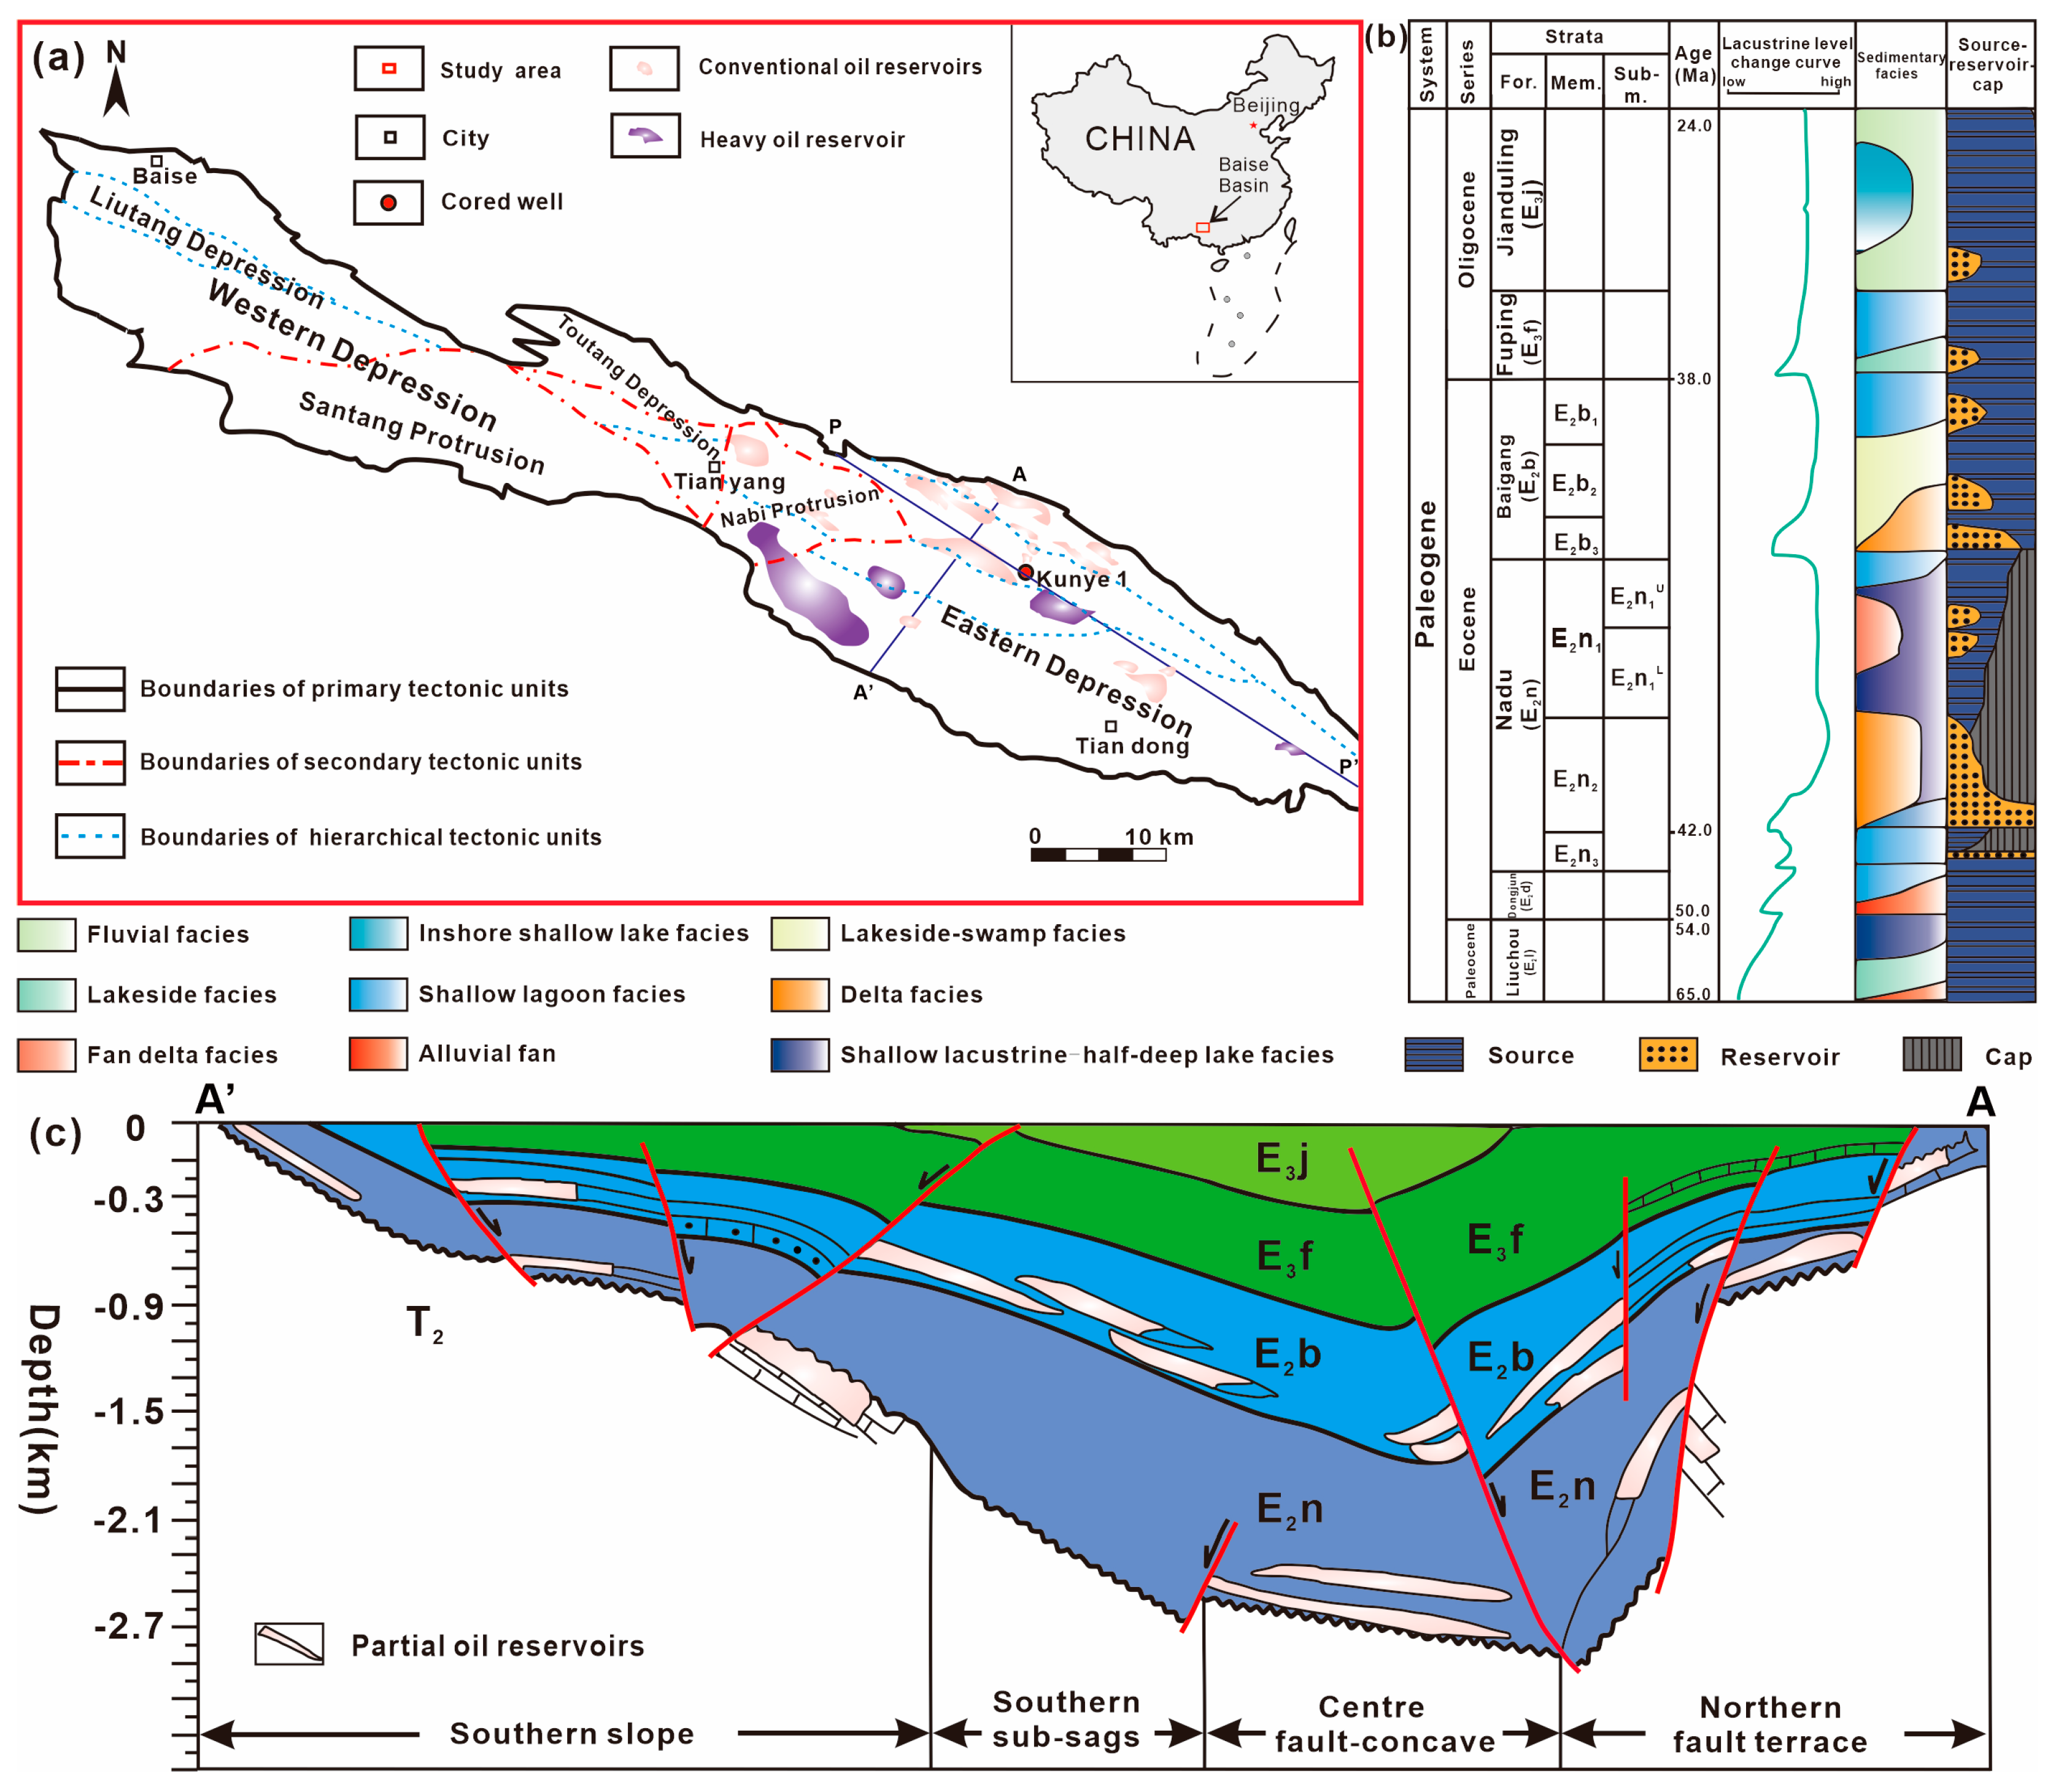
2. Geological Setting

The Baise Basin is located in the southwestern region of Guangxi province, China, and is situated along the Youjiang River. It follows a roughly northwest-to-southeast trend, (Figure 1a) and has a length of 109 km and a width of 7–9 km, covering an area of 830 km2. Kunye 1 well is located in the central fault depression zone of the Tiandong sag within the Baise Basin. The central fault-depression zone is a long-narrow banded monoclinic structure controlled by early NW-trending reverse faults. It is positioned near the steep northern slope to the north, the sub-sag to the south, and the Nabi uplift to the west. Its length measures approximately 28 km in east–west direction, while its north–south width ranges from 1 to 4 km, covering a total area of 60 km2 [14].
Since the Paleocene epoch, the Baise Basin has undergone three stages of development: fault depression, general subsidence, and eventual shrinkage. The Liuchou Formation (E1l), Dongjun Formation (E2d), Nadu Formation (E2n), Baigang Formation (E3b), Fuping Formation (N1f), Jianduling Formation (N1j), and Changsheling Formation (N2ch) were deposited sequentially (Figure 1b). Among these formations, the Nadu Formation and Baigang Formation are the major hydrocarbon-bearing stratigraphic units in the basin (Figure 1c). In particular, the source rock in the Nadu Formation is the most widespread and thickest in the Baise Basin. The stratigraphic unit was deposited during the most active period of sinistral strike-slip pull-apart of the Youjiang fault zone and basement fault subsidence. As a result, lithology, lithofacies, and thickness varied widely throughout the range of the basin, and faults and joint fissures developed in abundance [15]. The lithology of the Nadu Formation in Paleogene comprises thick brown-gray mudstone, gray siltstone, argillaceous siltstone, and a coal seam. During the middle and late Eocene periods, extensional faults developed in the west-northwest direction, joining the two sags to form a lake. The lacustrine sandstone and mudstone deposition of the Nadu Formation was then completed. The Nadu Formation is in an unconformable contact in the Upper Eocene epoch and overlies the Hongyan Formation and Triassic rocks. The layers can be divided into three parts, from bottom to top: The initial member of the Nadu Formation (E2n1) consists of dark grey and brown-grey mudstone, as well as oil shale and iron-bearing mudstone. Its thickness ranges from 47 m to 237 m. The Nadu Formation’s second member (E2n2) consists mainly of brown-gray calcareous mudstone, which serves as the main source rock and regional cap rock of the basin, with a thickness ranging from 38 m to 279 m. The source rocks of E2n3 consist of gray-black and brown-gray mudstone, calcareous mudstone, sandstone, lignite, and conglomerate of oil-bearing sandstone. The rocks of E2n3 have a thickness ranging from 0 m to 534 m. The dark mudstone serves as a good source and cap rock [10].

3. Samples and Methods
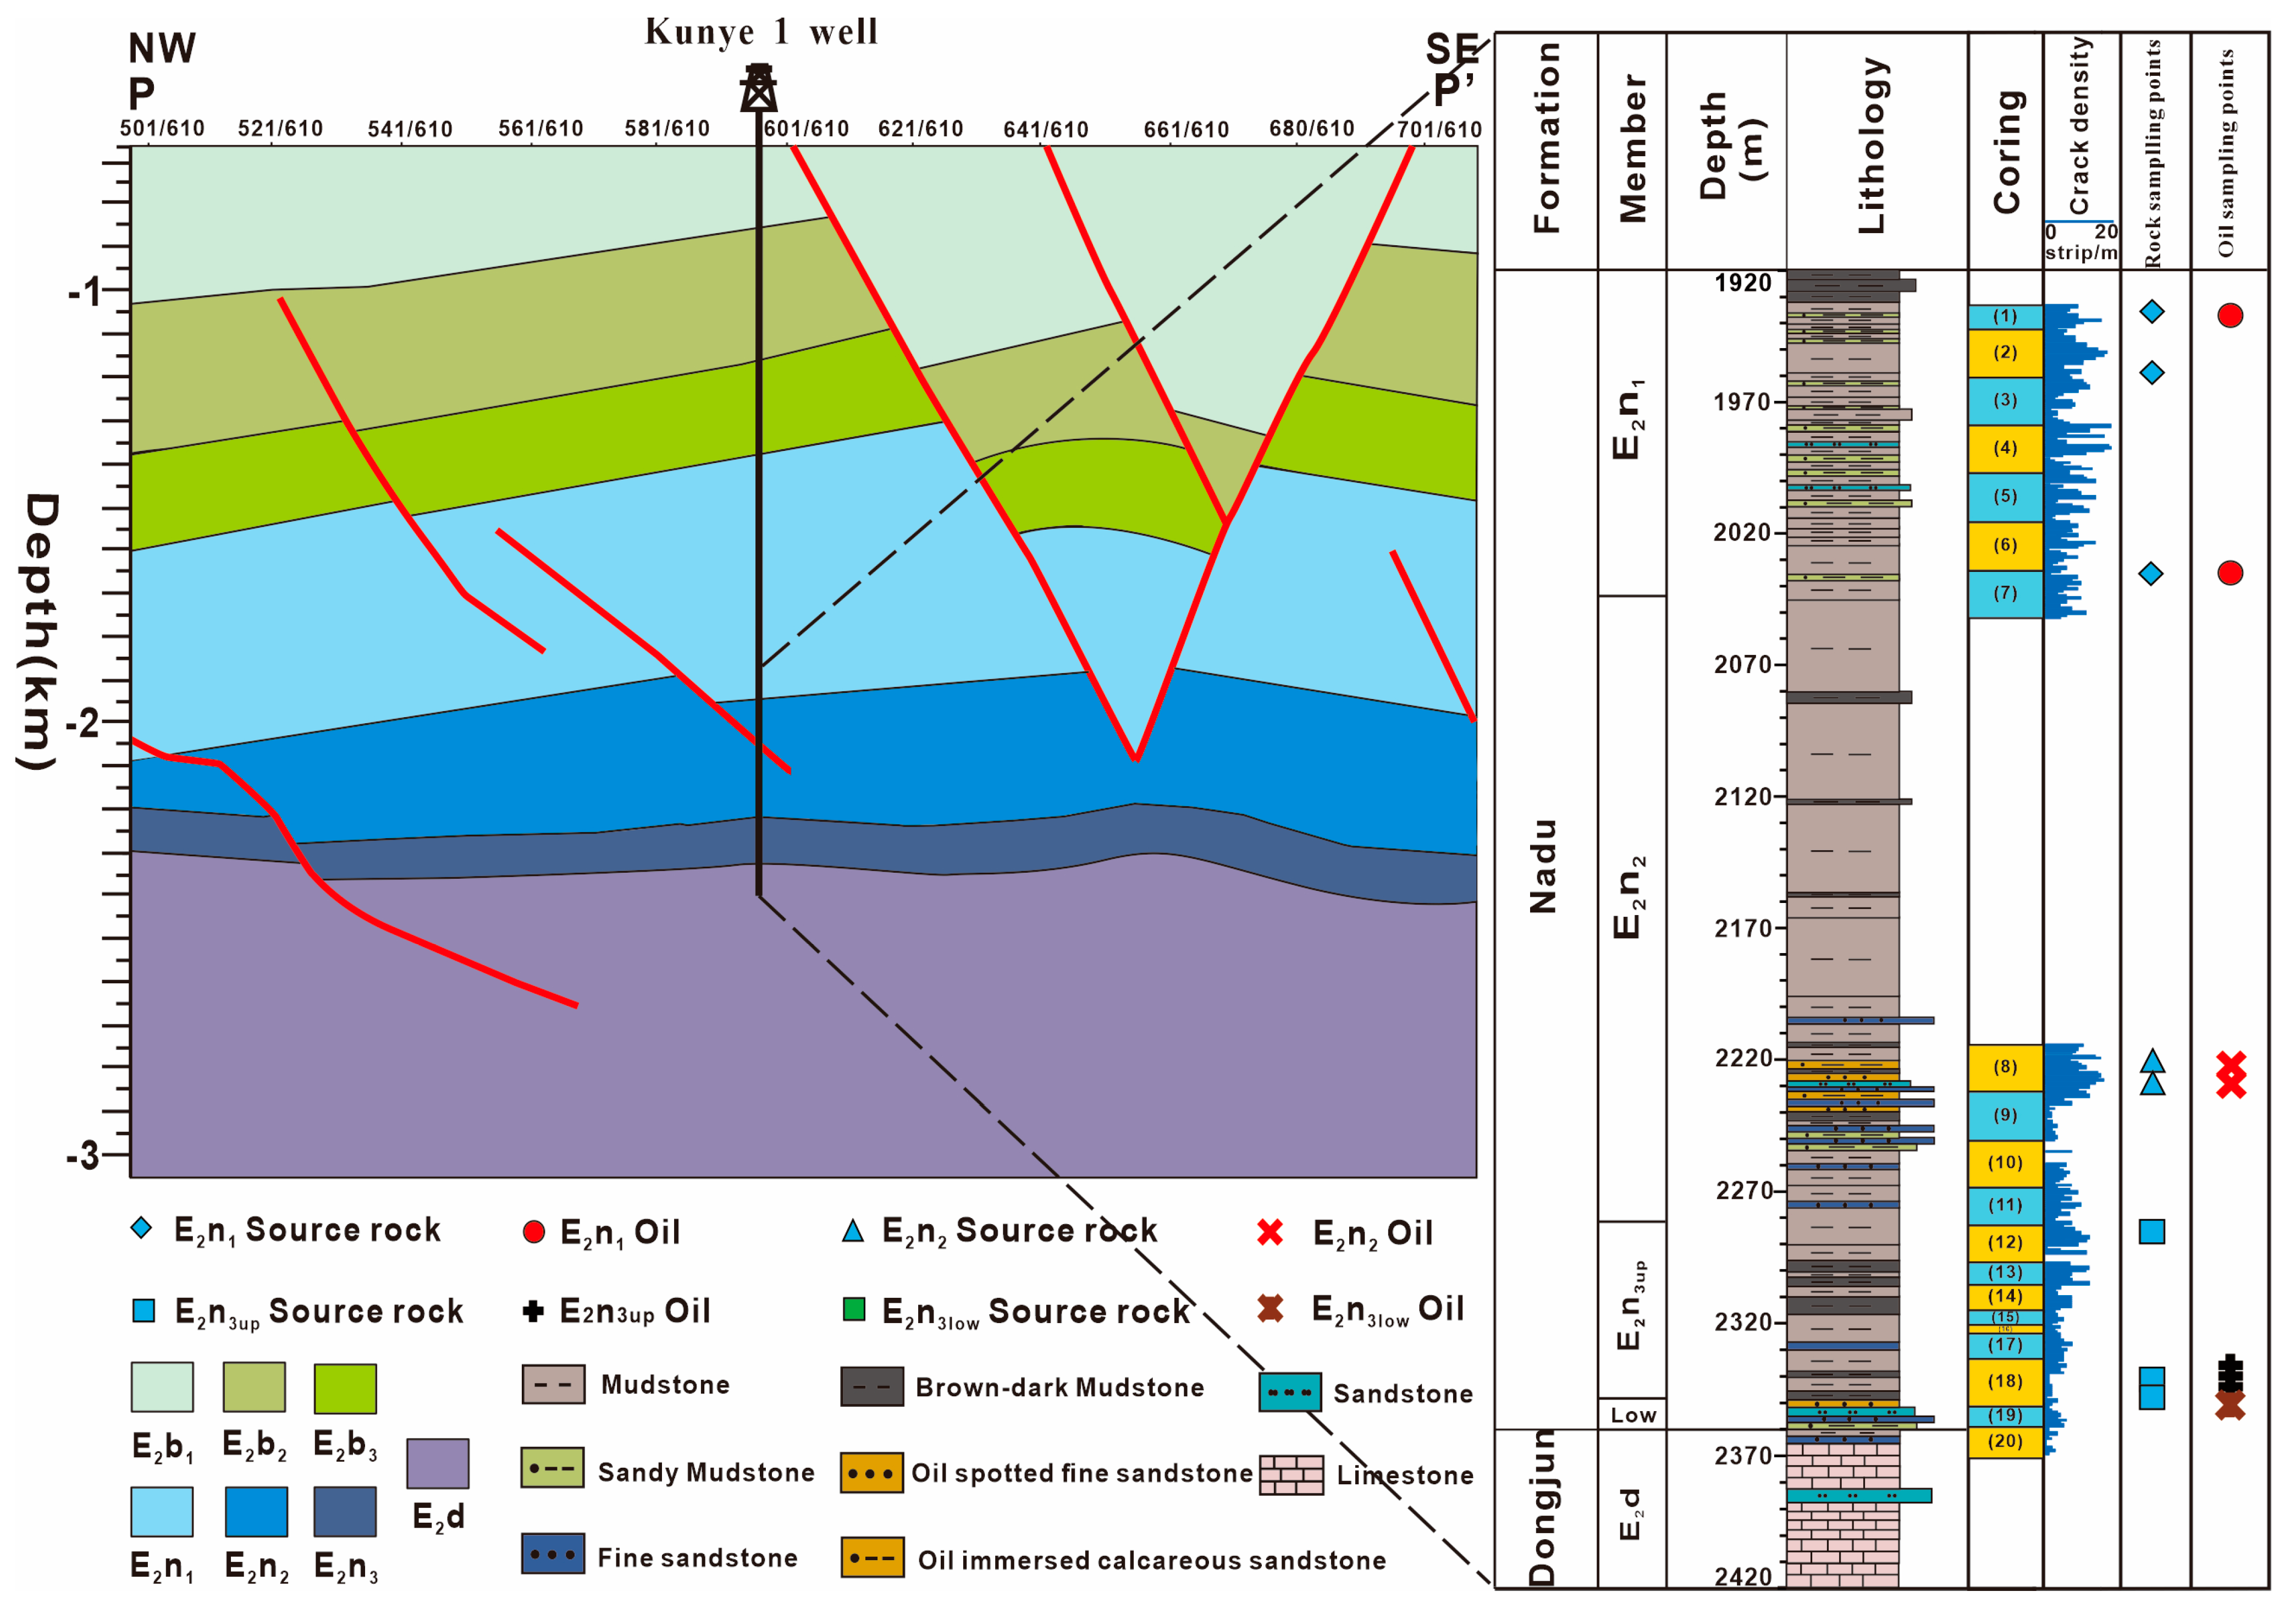
3.1. Samples

The source rocks of the Nadu Formation include three members: E2n1, E2n2, and E2n3. Due to the development of a small number of coal lines at the bottom of E2n3, they are further divided into two sections: E2n3up and E2n3low (Figure 2). Eight residual oil samples from high-angle joint fissure surfaces and eight source rocks were selected for analysis. The sampling depths ranged from 1935.5 m to 2343.81 m. Among them, the oil samples are residual oil extracted from high-angle joint fissures surfaces. The rock samples comprise blocky mudstone and sandstone. The depth distribution of the samples is displayed in Figure 2.
The mudstone of the Nadu Formation is frequently characterized by high-angle joint fissures. The density of these joint fissures is generally high, as observed in the core. The E2n1 source rocks exhibit the highest density of joint fissures, reaching 9.87 strips/m. The source rocks of the E2n2 have a density of 8.58 strips/m, while the source rocks of the E2n3 have a relatively low density, reaching 5.33 strips/m.
Figure 3 displays photos of representative joint fissures and oil-bearing characteristics in four members of the Nadu Formation. It is evident that the rocks of the Nadu Formation often exhibit high-angle fissures. The source rocks of E2n3 have nearly 90° vertical joint fissures, with an average oil content of 0.54 mg/cm2 on the fissure surface (Figure 3j,k). The joint fissures in E2n2 are mainly at medium to high-angles, with an average oil content of 0.51 mg/cm2 on the fissure surface (Figure 3e,f). In contrast, shear joint fissures with medium to low angles are mainly present in the E2n3 source rocks (Figure 3a,b). The oil content on the joint fissure surface is relatively low, with an average value of 0.32 mg/cm2 (Table 1).

3.2. Methodse

3.2.1. Sample Preparation and Bulk Analyses

A total of 5 g of source rock samples was taken and crushed into particles of 100 mesh size.
For the determination of total organic carbon (TOC), 100 mg of the sample was weighed and placed in a quartz crucible. The crucible was then placed in a water bath environment at 80 °C and soaked in dilute hydrochloric acid (hydrochloric acid/water = 1:7) for 4 h to remove carbonate rocks. The sample was washed repeatedly using deionized water until neutral and then dried for 24 h. The treated samples were then subjected to TOC testing using a LECO CS230 carbon–sulfur analyzer.
For Rock-Eval pyrolysis analysis, powder samples (80–100 mg) were taken for heating analysis on the Rock-Eval 6 oil and gas evaluation workstation. The content of free hydrocarbon (S1) and pyrolysis hydrocarbon (S2) in the unit mass sample and the maximum pyrolysis yield temperature (Tmax) corresponding to S2 were measured. After that, the hydrogen index (HI) was calculated using the Rock-Eval rock pyrolysis analysis method.
The Zeiss Axio Scope instrument was used to measure vitrinite reflectance (Ro). A1J&M Msp 200 digital microscopic coal petrography analysis system (213876), at a wavelength of 546 ± 5 nm, was used to analyze Ro (0.589% and 1.171%), which served as the standard sample for the Ro test. Finally, more than 30 measurement points were averaged for each sample.

3.2.2. Soxhlet Extraction and Group Component Separation

The source rock samples were crushed into particles of 100 mesh size. Soxhlet extraction was performed with dichloromethane for 72 h to obtain soluble organic compounds. Asphaltenes were precipitated using n-hexane in chloroform bitumen “A” and crude oil. The organic matter, after removing asphaltene, was fractionated into saturated, aromatic, and non-hydrocarbons using silica gel/alumina column chromatography.

3.2.3. Gas Chromatography–Mass Spectrometry (GC–MS)

For the analysis of molecular marker compounds, Agilent 7980B-5977B gas chromatography-quadrupole mass spectrometry was used. The column was a HP-5MS (60 m× 0.25 mm × 0.25 µm). The temperature program involved keeping the initial temperature at 70 °C for 5 min, increasing it to 300 °C at 4 °C/min, and maintaining it at a constant temperature for 30 min. Helium was injected at 1 mL/min as the carrier gas. The scan range was from 50 to 500 amu in full scan, and multiple ion detection (MID) modes in the electron ionization (EI) mode at 70 eV [16].

3.2.4. Carbon Isotope of Monomer Paraffin Hydrocarbons (GC-IR-MS)

The GEOVISION instrument of the German Elementar Company with the 8890GC gas phase chromatography system from Agilent Company in the United States was used for stable carbon isotope analysis of n-alkanes. The column was an HP-PONA quartz elastic capillary column (50 m × 0.2 mm × 0.5 µm) produced by Agilent company. The sample was injected without split, into the injection chamber that was kept at a temperature of 290 °C. The temperature program involved keeping the temperature at 50 °C for 1 min initially, increasing it to 150 °C at 10 °C/min, then to 320 °C at 3 °C/min, and maintaining it at a constant temperature for 30 min. Helium was injected at 1 mL/min as the carrier gas. The isotopic compositions of all samples were analyzed at least twice, ensuring that the deviation in carbon isotope values of the same compound is no more than ±0.5‰.

4. Results

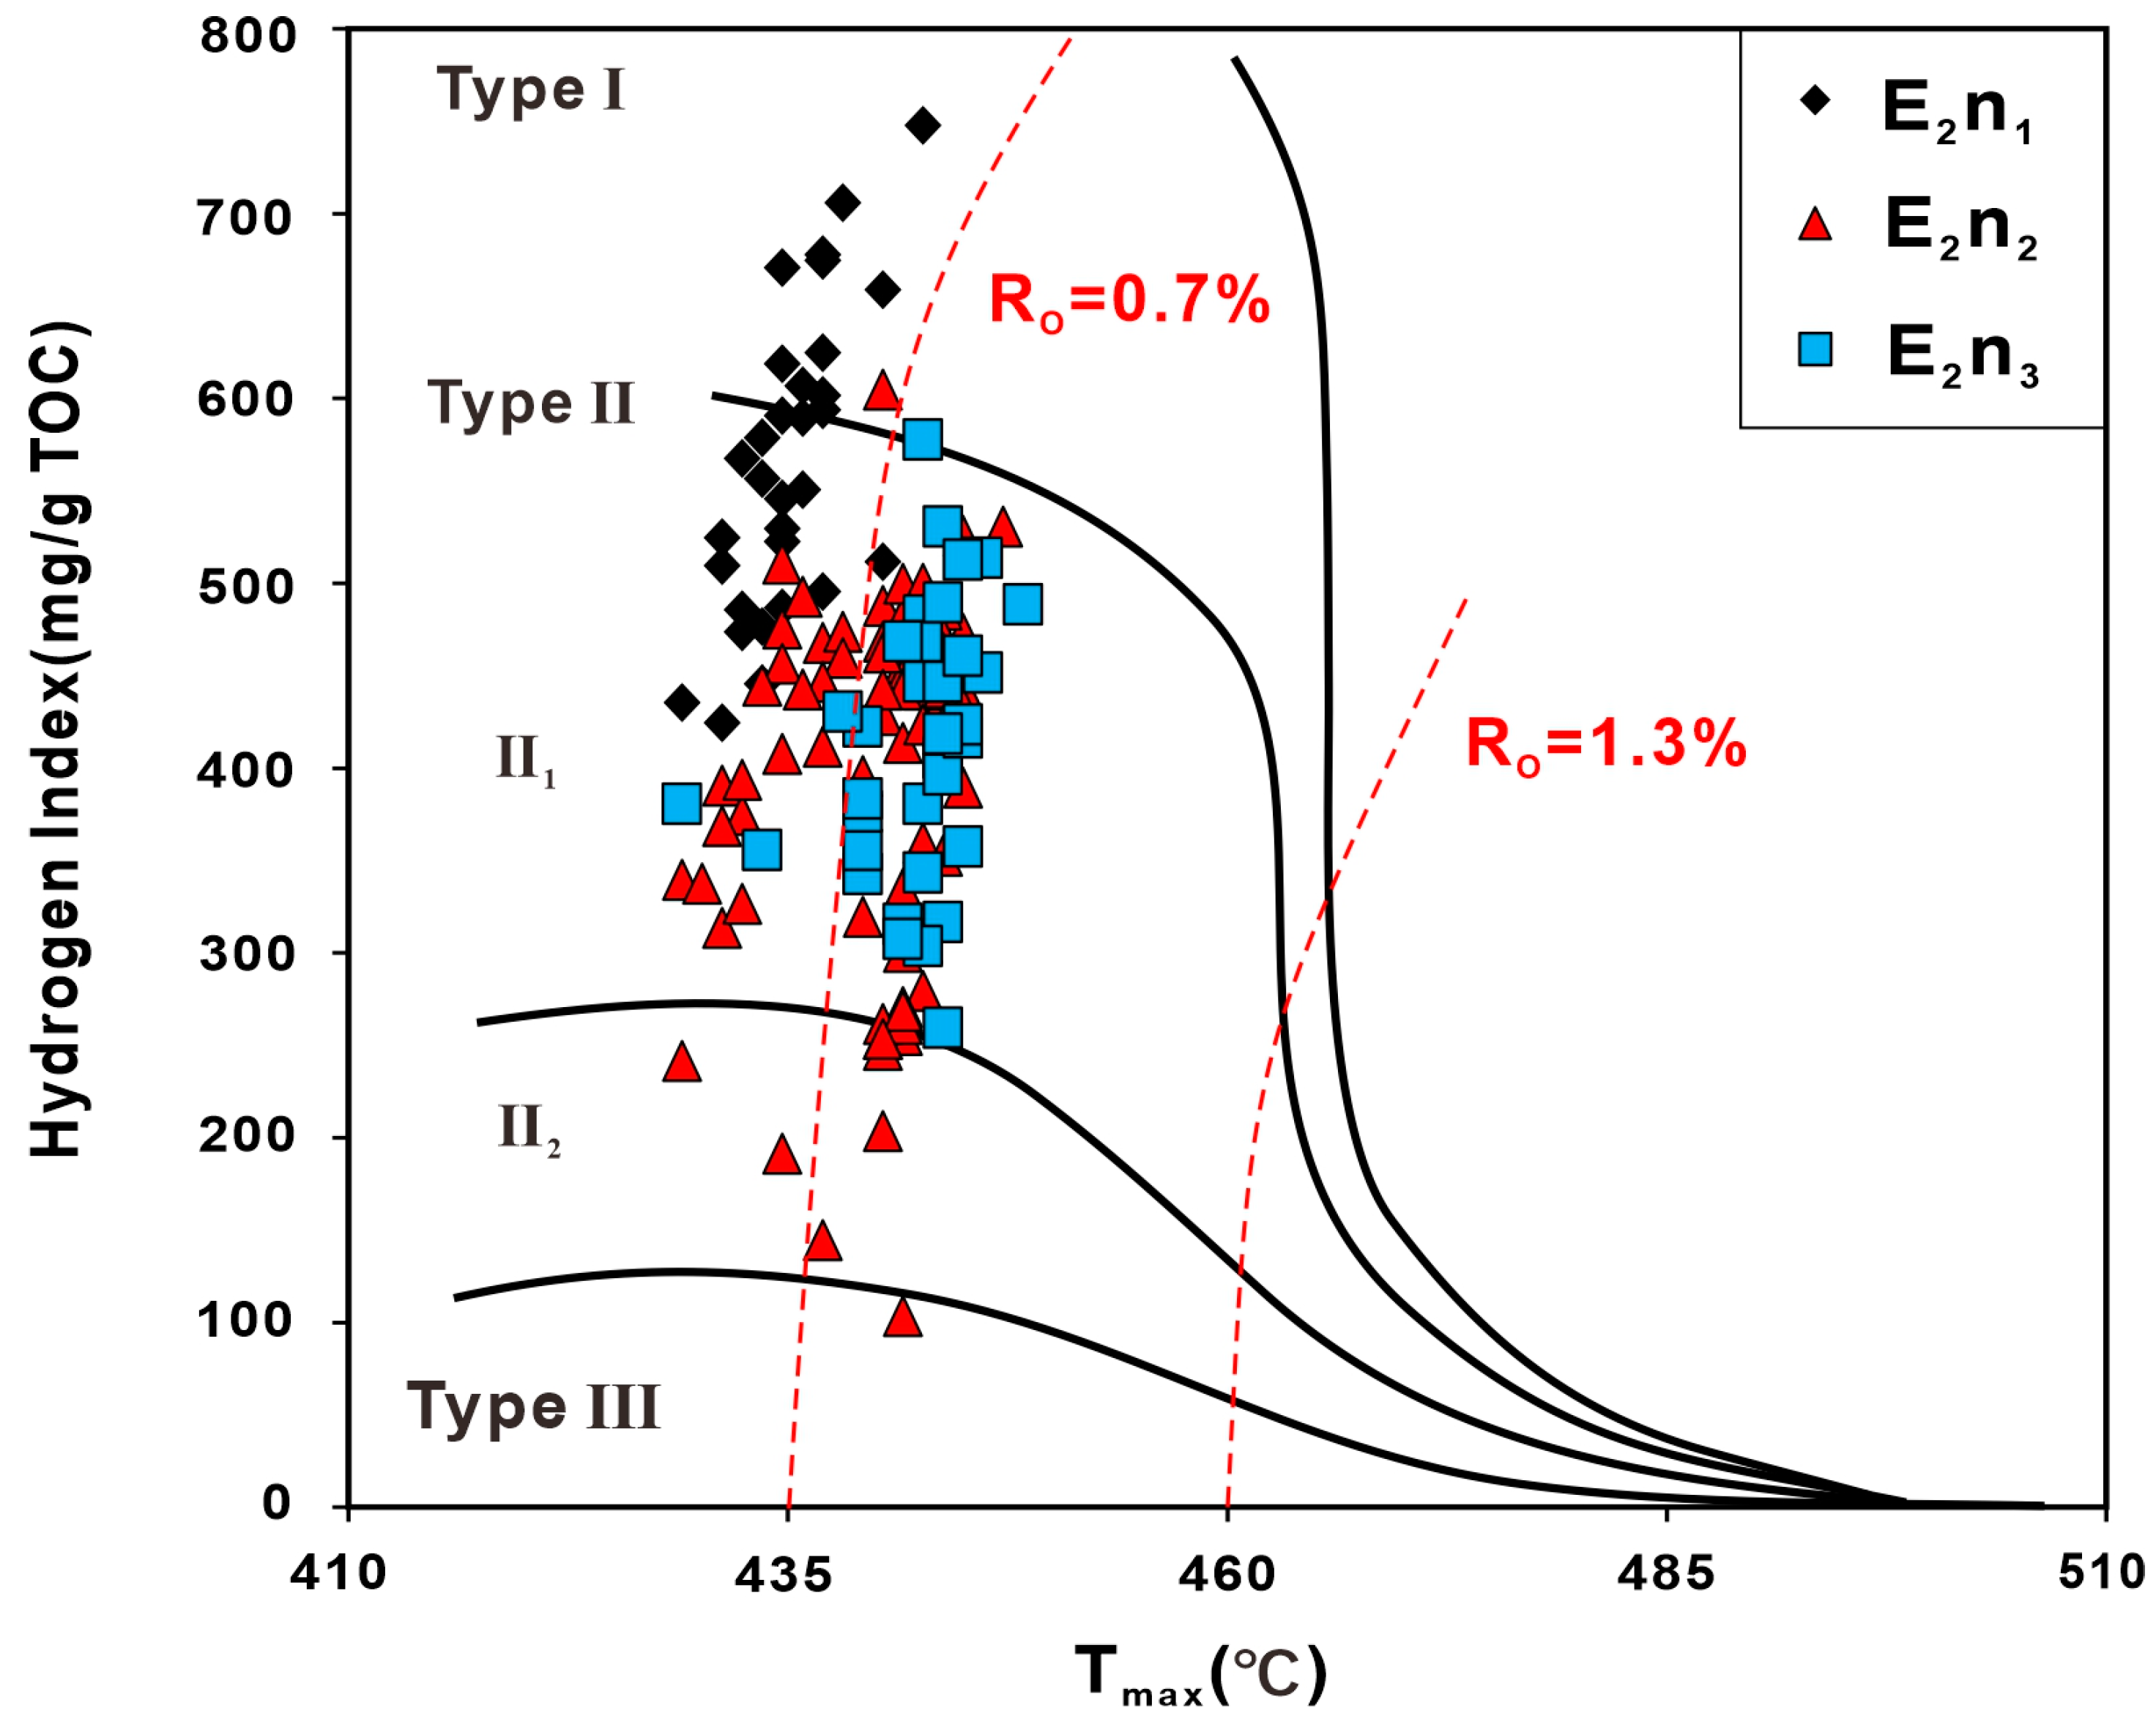
4.1. Bulk Analyses of Source Rock

The total organic carbon (TOC) of source rocks ranges from 0.18 to 5.37 wt%, with an average of 1.58 wt%. The E2n1 source rocks have a TOC range of 0.93% to 4.96% wt%, with an average of 1.92% wt%. The E2n2 source rocks have a TOC range of 0.41% to 4.89% wt%, with an average of 1.30% wt%. The E2n3 source rocks have a TOC range of 0.23% to 3.86% wt%, with an average of 1.29% wt%.
The organic matter types in the study area are mainly type II1, with a small amount of type I, type II2, and type III (Figure 4). In terms of organic matter maturity, the E2n3 samples have the highest pyrolysis peak temperature (Tmax) with an average of 440 °C. The E2n2 samples display higher Tmax values, ranging from 430 °C to 440 °C, compared to those of E2n1 (430 °C on average). The majority of Tmax values range from 430 °C to 440 °C, indicating that most samples are in low maturity to mature stage [17].
The Ro values obtained from the mean random vitrinite reflectance measurements are 0.68–0.71% (0.69% on average) for E2n1 samples, lower than that for E2n2 and E2n3 source rocks, which vary from 0.72% to 0.75% (0.74% on average) and 0.78% to 0.79% (0.79% on average), respectively. The Ro values of the E2n2 and E2n3 source rocks are more than 0.7%, indicating that source rock horizons are mature in the studied area [10].

4.2. Group Composition of the Chloroform Bitumen“A”

The chloroform bitumen “A” group components of the Nadu Formation source rocks in the Baise Basin are mainly composed of saturated hydrocarbons, followed by resin components and aromatic hydrocarbons, with a low content of asphaltenes. The chloroform bitumen “A” of the E2n2 and E2n3 source rocks have higher saturated hydrocarbon contents, ranging from 53.73% to 61.86% (58.31% on average), compared to those of the E2n1 source rocks (44.05% on average ranging from 37.08% to 50.04%). Conversely, the resin content of the chloroform bitumen “A” of the E2n1 source rocks (20.18–24.4%) is higher than that of the E2n2 and E2n3 source rocks (7.57–14.93%). The amounts of aromatic hydrocarbons and asphaltenes are similar, with the proportion of aromatic hydrocarbons ranging from 15.42% to 25.48%. The proportion of asphaltenes is low, ranging below 6% (Table 2).

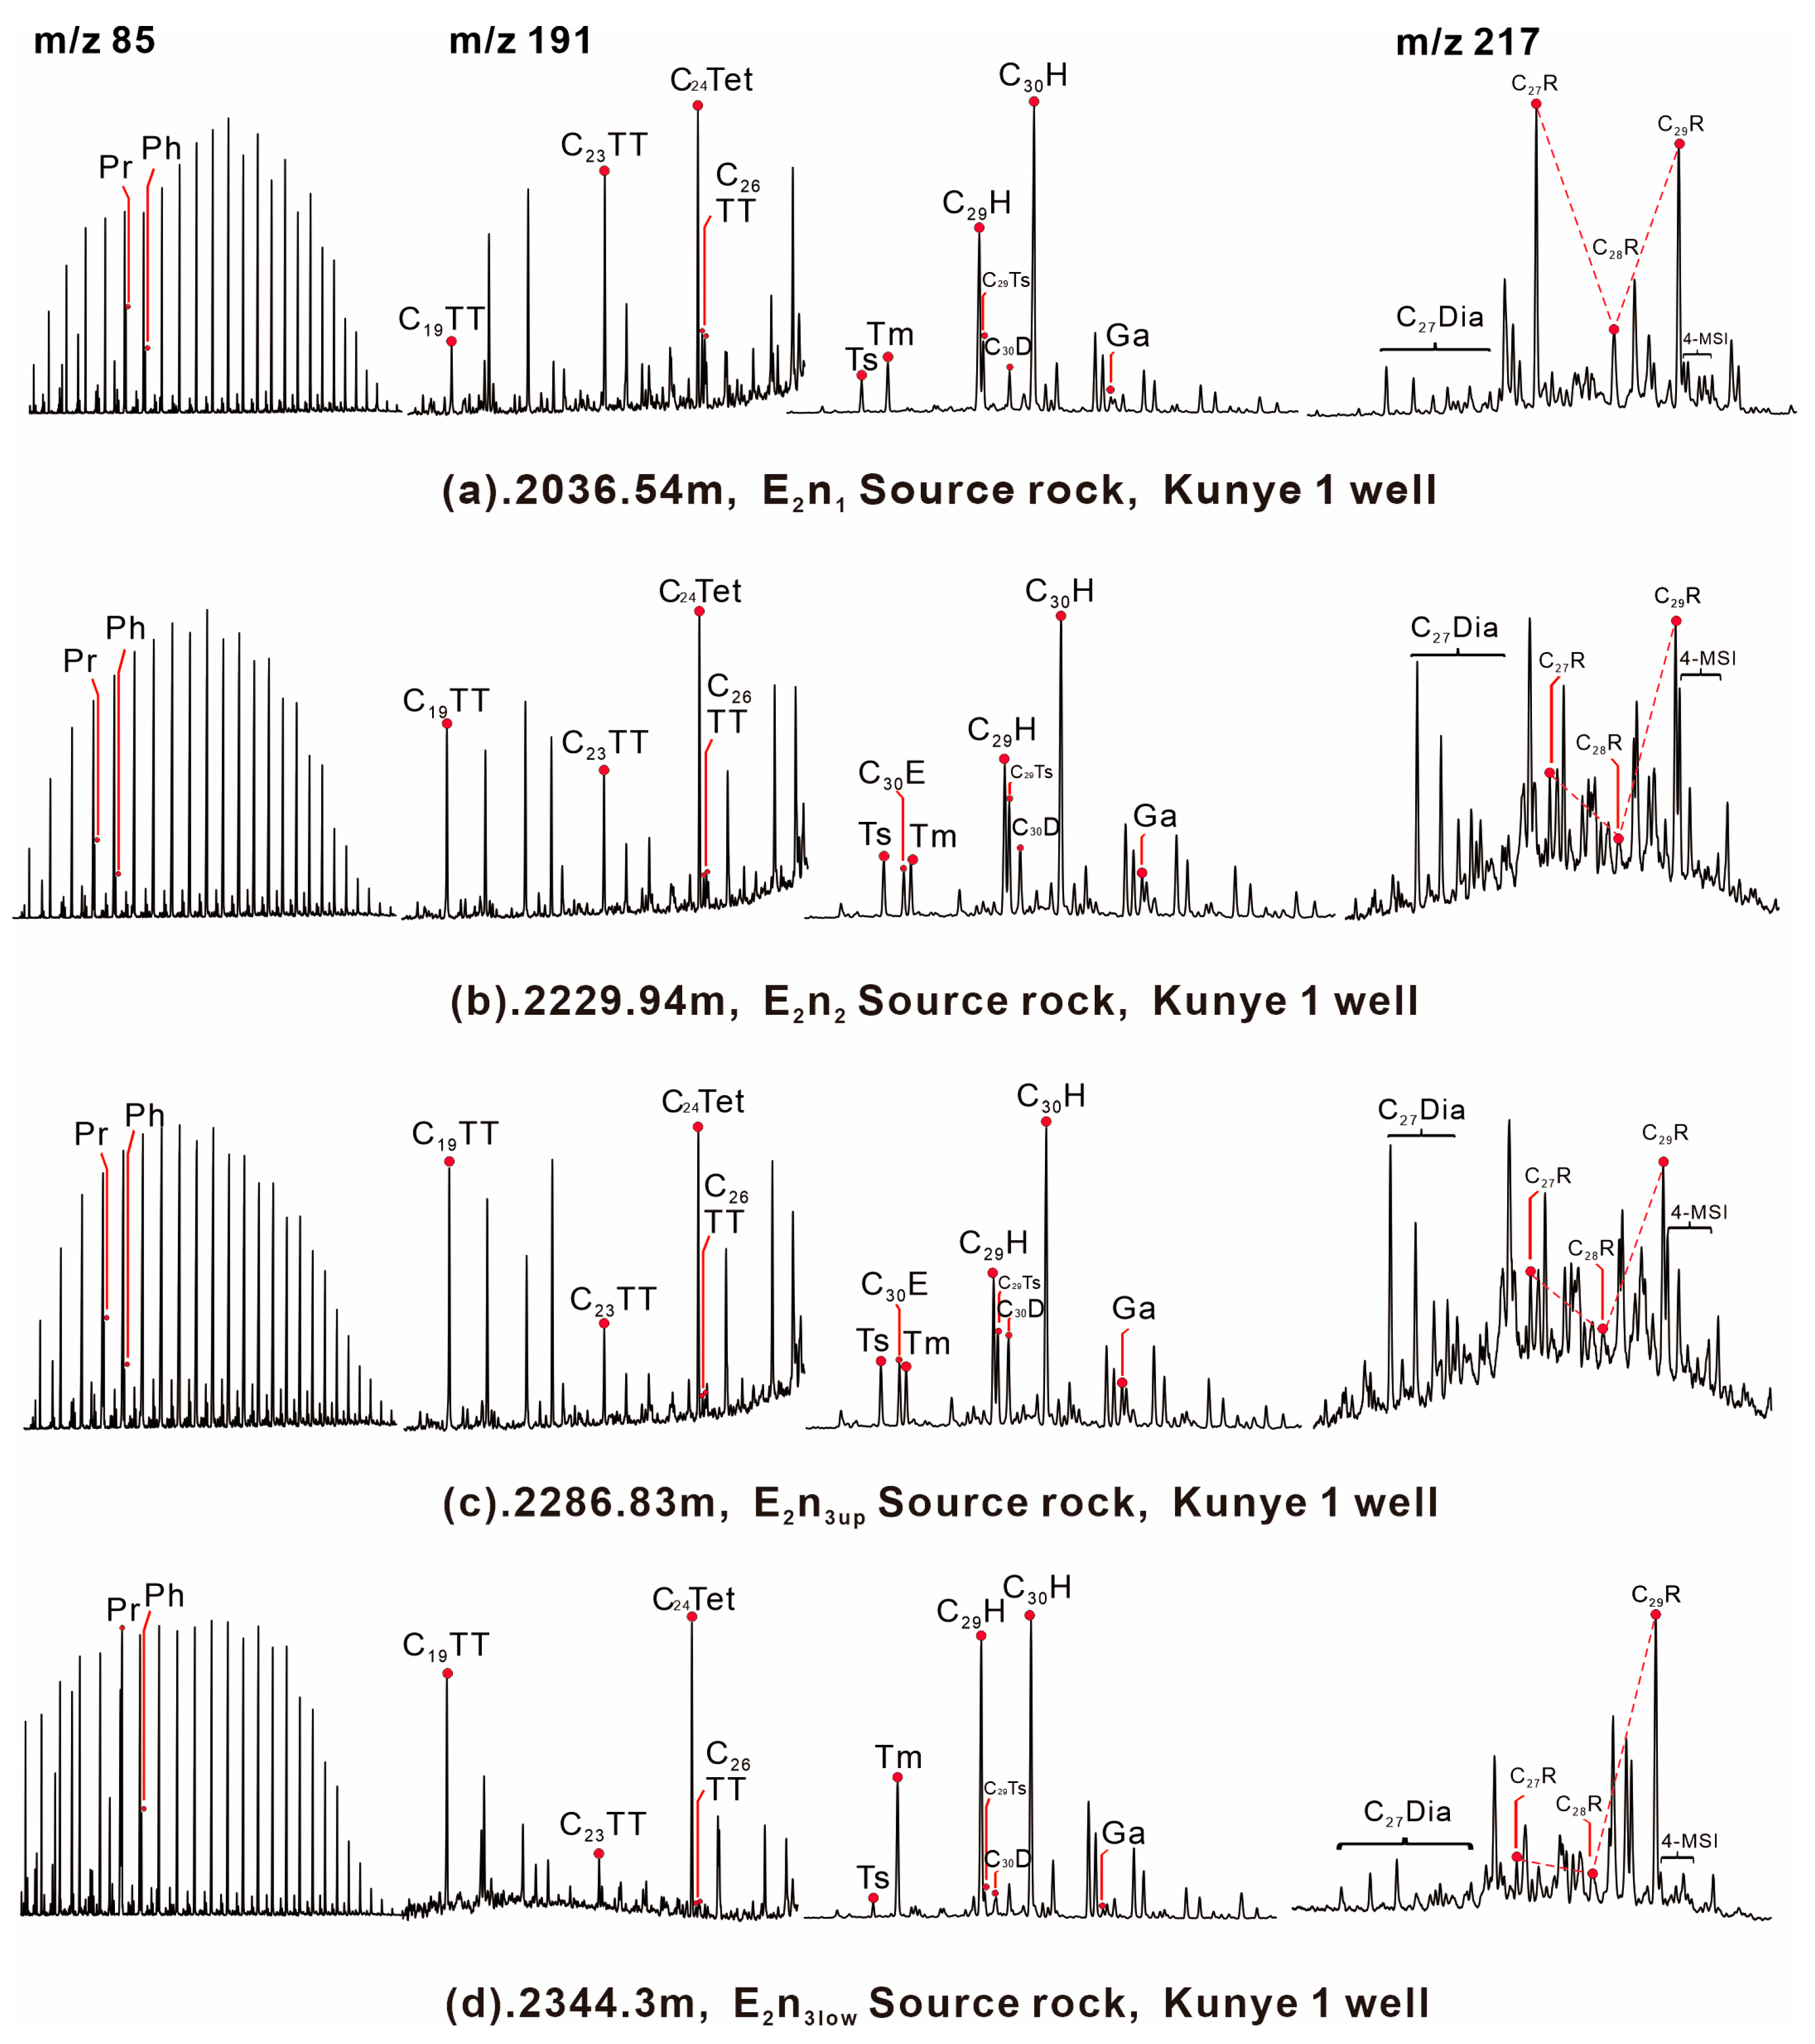
4.3. Characteristics of Biomarkers from Source Rocks

The source rock samples from the Nadu Formation in the study area contain n-alkanes with a carbon number range of n-C12 to n-C35, primarily unimodal in distribution (Figure 5). Short-chain n-alkanes are typically derived from bacteria, algae, and other aquatic organisms, while medium-chain n-alkanes are commonly found in large aquatic plants. Long-chain n-alkanes are mainly sourced from terrestrial higher plants [18,19]. The abundance of Pristine (Pr) and Phytane (Ph) are relatively low to moderate compared to that of n-alkanes. The value of Pr/Ph can indicate the redox conditions of source rocks and crude oil deposition [20,21]. The E2n1 sample has a lower Pr/Ph value of 1.6 compared to the E2n2 and E2n3up source rocks with a value of 1.92. The E2n3low rock samples are coal-measure source rocks, and the (Pr/Ph) value of the E2n3low samples is the highest, with an average of 4.49. Furthermore, the E2n2 and E2n3 samples display lower CPI and OEP values with averages of 1.14 and 1.10, compared to 1.33 and 1.31 of the E2n1 samples. In the study area, the Pr/n-C17 ratio of source rocks from the E2n1 is 0.61. The ratio of Pr/n-C17 is lower in the E2n2 and E2n3up source rocks than that in the E2n1 samples, with an average of 0.26. The Pr/n-C17 ratio for E2n3low source rocks is the highest, with an average of 1.35. The Ph/n-C18 ratio of the E2n1 source rocks is the highest (0.35). The Ph/n-C18 ratio of the E2n3low source rocks is 0.3, while that of the E2n2 and E2n3up source rocks is lowest at 0.11.
Tricyclic terpanes are common in petroleum and source rock extracts and may originate from prokaryotic cell membranes [22]. C19 tricyclic terpanes (C19TT) are mainly derived from terrestrial higher plants [23], while C23 tricyclic terpanes (C23TT) may be derived from algae [24,25]. The abundance of C24 tetracyclic terpene (C24Tet) is high in all samples of source rock. The E2n2 and E2n3 source rocks have higher C19 tricyclic terpanes compared to the E2n1 source rocks. The C19TT/C23TT and C24Tet/C26TT values of the E2n2 and E2n3 samples are higher, ranging from 1.21 to 2.29 (1.89 on average) and 1.66 to 2.81 (2.24 on average), respectively. The C19TT/C23TT and C24Tet/C26TT values of the E2n1 source rocks are relatively low, ranging from 0.43 to 0.67 (0.52 on average) and 1.11 to 1.91 (1.51 on average), respectively (Table 3). The ETR = (C28TT + C29TT)/(C28TT + C29TT + Ts) ratio of the E2n1 source rocks ranges from 0.28 to 0.46 (0.38 on average); the E2n2 and E2n3up source rocks have greater ETR ratios than the E2n1 source rocks, ranging from 0.49 to 0.59 (0.54 on average). The ETR ratio of the E2n3low source rocks is the highest, which is 0.76. The hopanes were detected in all source rock samples, ranging from C27 to C35, with the most significant peak at 17α (H)-hopane (C30H) (Figure 5). C27 hopane display C27 18α(H)-22,29,30-trisnorneohopane (Ts) and C27 17α(H)-22,29,30-trisnorhopane (Tm). The Ts/Tm values of the E2n2 and E2n3up source rocks are close, with an average value of 1.15 (ranging from 1.12 to 1.24); the average value of E2n1 source rock is 0.58. The E2n3low source rocks has a very low Ts value, and the average value of Ts/Tm is 0.14. The abundance of diahopanes is high due to a specific organic matter source and diagenesis conditions [26]. The abundance of 17a (H)-C30 diahopane (C30D) in source rocks of four layers is different. The average C30D value of the E2n3low source rock is 0.14. The C30D values of the E2n2 source rocks are slightly higher, ranging from 0.25 to 0.28, with an average value of 0.27. The C30D values of the E2n3up samples are relatively high, ranging from 0.37 to 0.38, with a mean of 0.38. In contrast, the abundance of C30D in the E2n1 source rocks are extremely low, ranging from 0.05 to 0.06, with an average of 0.06. Gammacerane (Ga) is not dominant in source rocks, and the Ga/C30H value in each source rocks are significantly lower, ranging from 0.05 to 0.19 (0.12 on average).
According to the research paper, the diasterane/regular sterane ratio of source rocks is influenced by their maturity and inorganic characteristics [27]. All source rocks in the study area contain a certain amount of diasteranes. The E2n2 and E2n3up source rocks have a diasterane/regular sterane ratio ranging from 0.35 to 0.48 (0.41 on average), which is slightly higher than that of the E2n3low samples, with a value of 0.35. The E2n1 source rocks have low diasterane/regular sterane values, ranging from 0.16 to 0.28 (0.22 on average). Steranes are mainly derived from algae, higher plants, and zooplankton [28]. The source rocks of the Nadu Formation contain a homologous series of C27–C29 ααα 20R steranes. The abundance of C27 ααα 20R steranes in E2n1 samples is the highest (32.6%). The abundance in E2n2 and E2n3up samples are close (26.9%). C27 ααα 20R steranes in the E2n3low source rocks are the lowest (15.3%). Previous research has shown that the isomerization parameters of steranes can reflect crude oil maturity [19]. The C29 steranes 20S/(20S + 20R) and C29 steranes ββ/(αα + ββ) ratios of the E2n2 + E2n3up and E2n3low source rocks are relatively close, ranging from 0.45 to 0.52 (0.49 on average) and 0.42 to 0.51 (0.46 on average), respectively. The E2n1 source rocks show lower C29 steranes 20S/(20S + 20R) and C29 steranes ββ/(αα + ββ) values than the other source rocks, ranging from 0.25 to 0.39 (0.33 on average) and 0.23 to 0.30 (0.26 on average), respectively. The eruption of dinoflagellate is related to the 4-methyl sterane index(4-MSI) [19,29,30]. The E2n1 source rocks have low 4-methyl sterane values, ranging from 0.07 to 0.38, with an average of 0.21, while the E2n2 + E2n3up and E2n3low source rocks show greater values, ranging from 0.25 to 0.60, with an average of 0.46 (Table 3).

4.4. Group Composition of Oil Samples

According to the research paper, crude oil typically contains a significant proportion of saturated hydrocarbons, except for immature or biodegraded oils that show a considerable amount of aromatic content [31,32]. The components of the oil samples are mainly saturated hydrocarbons, followed by aromatic hydrocarbons, resins, and asphaltenes. The content ranges of these components are 36.11–66.37%, 13.01–22.27%, 4.45–33.3%, and 0.9–4.44%, respectively (Table 4). The E2n1 oil samples have lower saturated hydrocarbon content than the other oil samples, ranging from 36.11% to 48.35%, with an average of 42.23%. The aromatic content is 15.33%. The resin content is relatively high at 28.75%, and the asphaltene content is 3.36%. The variation range of oil-saturated hydrocarbon content at different depths of E2n2 and E2n3 oil samples is 54.73~66.37%, with an average of 59.11%. The aromatic content ranges from 13.26% to 22.27%, with an average of 17.02%. The resin content ranges from 4.45% to 16.28%, with an average of 10.45%. The asphaltene content is 2.22%.

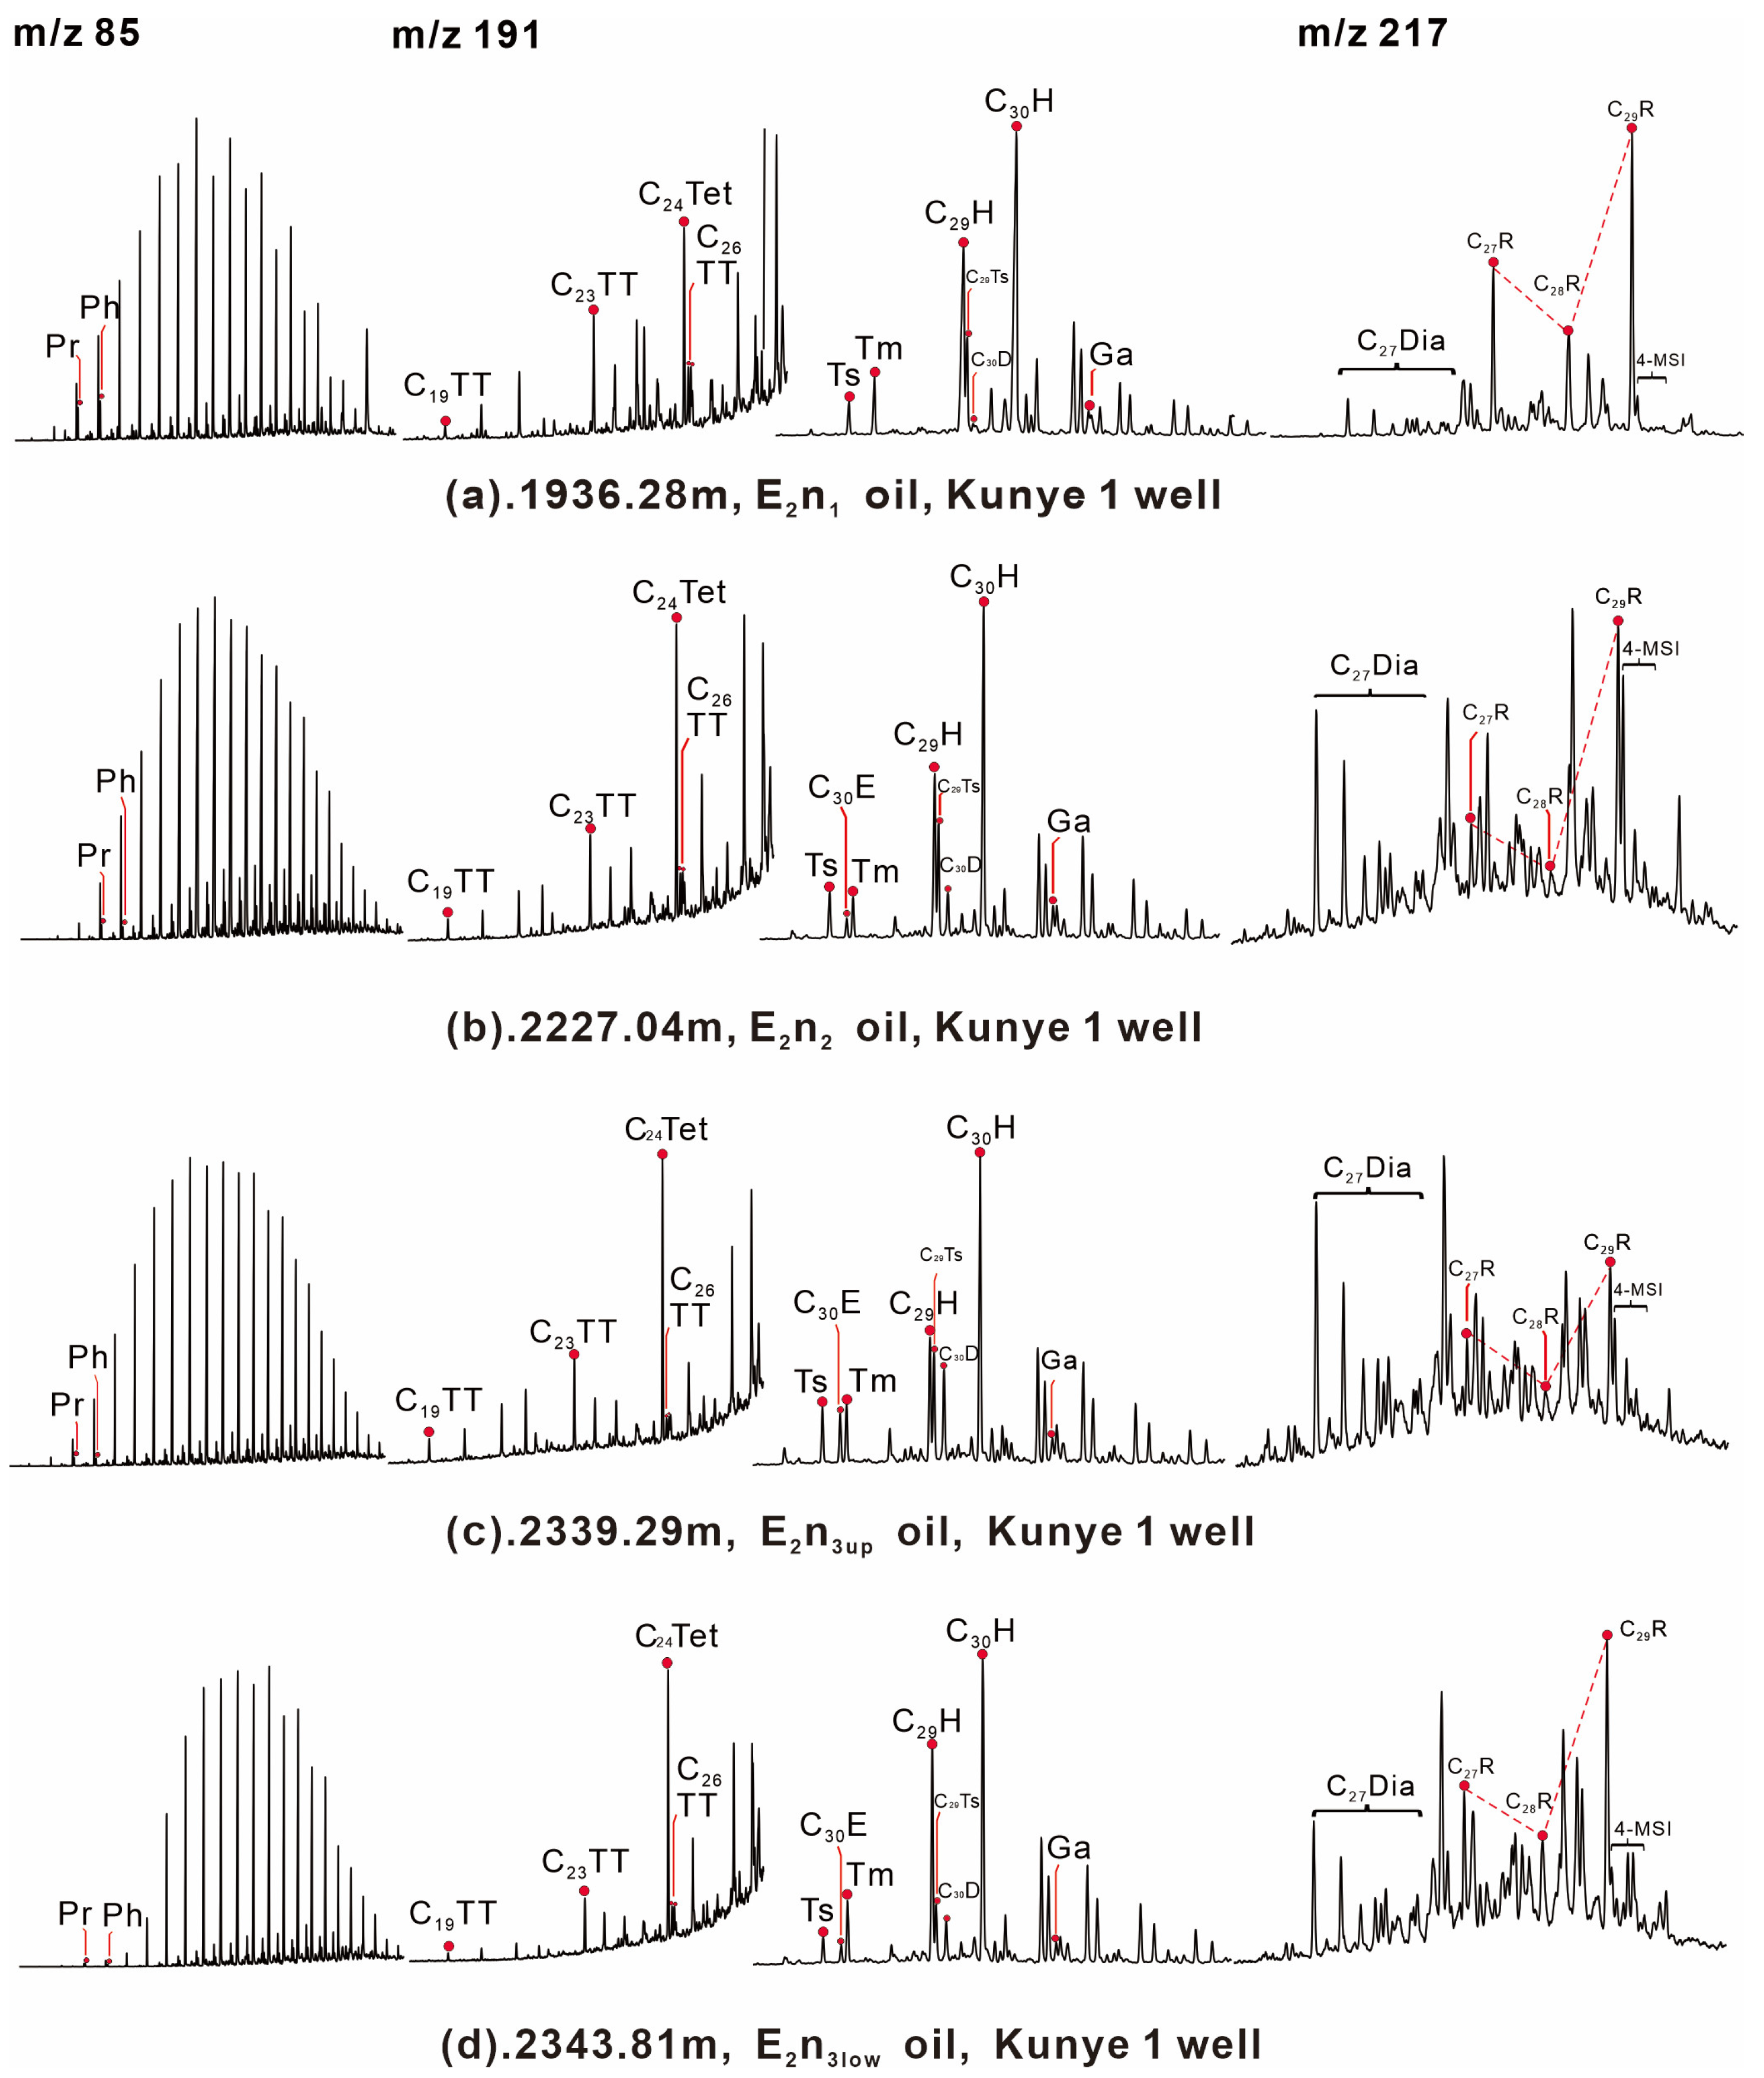
4.5. Biomarker Characteristics of Oil Samples

The n-alkanes in the oil samples have a relatively similar distribution pattern, with carbon numbers ranging from n-C15 to n-C35. The maximum peak carbon number of n-alkanes (Nmax) is n-C25, and the carbon number distribution is a single post-peak (Figure 6). The E2n1 oil samples have low Pr/Ph values (0.87 on average). The E2n2 and E2n3up oil samples have greater Pr/Ph ratios than the E2n1 oil samples, ranging from 0.73 to 1.24, with an average of 1.04. In addition, the highest Pr/Ph value of the E2n3low is 1.17. The E2n2 and E2n3up oil samples have lower Pr/n-C17 values (0.49 on average) than the E2n1 oil samples (0.72 on average). The Pr/n-C17 value of the E2n3low oil samples is highest (1.17 on average). The Ph/n-C18 values of the E2n3low oil samples are highest (0.55 on average), followed by E2n1 (0.44 on average). The Ph/n-C18 values of the E2n2 and E2n3up oil samples are close and the lowest (0.17 on average). All oil samples have higher CPI and OEP values greater than 1.0 with no odd carbon preference. The CPI and OEP values of the E2n1 oil samples are highest, with averages of 1.17 and 1.25, respectively. The E2n2 + E2n3up and E2n3low oil samples show lower CPI and OEP values than the E2n1 oil samples, with averages of 1.04 and 1.09, respectively. The CPI and OEP values of E2n2 + E2n3up and E2n3low oil samples are lower and closer to 1, indicating higher maturity.
The C23TT abundance is relatively high in all oil samples, while the C19TT/C23TT ratio is low. The E2n2 + E2n3up and E2n3low oil samples have greater C24Tet/C26TT ratios varying from 1.39 to 2.53 (1.99 on average). The E2n1 oil samples have lower C24Tet/C26TT ratios than the others, which are in the range of 1.13–1.24 (1.19 on average). The ETR ratio of the E2n1 oil samples ranges from 0.43 to 0.48 (0.45 on average). The E2n2 and E2n3up oil samples have higher ETR ratios than the E2n1 source rocks, ranging from 0.50 to 0.56 (0.53 on average). The ETR ratio of the E2n3low oil samples is the highest, which is 0.62.
All oil samples contain hopanes ranging from C27 to C35, with the most prominent peak at 17α(H)-hopane (C30H), as shown in Figure 6. The Ts/Tm ratios of the E2n2 and E2n3up oil samples are both relatively high, ranging from 0.83 to 1.21, with an average of 1.06. The E2n1 and E2n3low oil samples show lower Ts/Tm values than the E2n2 and E2n3up samples, ranging from 0.50 to 0.62 (0.57 on average). In addition, Ga is present in almost negligible amounts in all oil samples, with Ga/C30H ratios quite low, varying between 0.06 and 0.16 (0.11 on average). The C30D/C30H ratios of the E2n2 + E2n3up and E2n3low oil samples are greater than those of the E2n1 samples, which are in the range of 0.18–0.41 (0.28 on average). The C30D/C30H ratios of the E2n1 oil samples are significantly low (0.05 on average).
The results indicate that the E2n1 oil samples have the highest C27 sterane abundance, with an average of 31.3%. The E2n2 + E2n3up and E2n3low oil samples; on the other hand, they have a lower abundance of C27 sterane, ranging from 20.5% to 28.9% (25.1% on average), which is consistent with the trend in the source rock. The E2n2 + E2n3up and E2n3low oil samples have greater Diasterane/Regular Steranes (Dia/Reg Sterane) ratios than E2n1, which are in the range of 0.31–0.45 (0.38 on average). The Dia/Reg Sterane ratios of the E2n1 oil samples ranged from 0.16 to 0.17 (0.17 on average).
In addition, two sterane ratios were computed: the C29 steranes 20S/(20S + 20R) ratio and the C29 steranes ββ/(αα + ββ) ratio. The C29 steranes 20S/(20S + 20R) and C29 steranes ββ/(αα + ββ) ratios of the E2n1 oil samples vary in a low range of 0.28–0.42 (0.35 on average) and 0.26–0.27 (0.27 on average), respectively. Conversely, the E2n2 + E2n3up and E2n3low oil samples show greater C29 steranes 20S/(20S + 20R) and C29 steranes ββ/(αα + ββ) ratios than the E2n1 samples, which are in the range of 0.47–0.55 (0.51 on average) and 0.41–0.47 (0.44 on average), respectively. The 4-MSI of the E2n2 + E2n3up and E2n3low oil samples ranges from 0.38 to 0.48 (0.42 on average). The E2n1 oil samples have lower 4-MSI values ranging from 0.13 to 0.35 (0.24 on average) (Table 5).

4.6. Compound-Specific Stable Carbon Isotopic Compositions of n-alkanes

Conversely, the δ13C distribution of short-medium-chain n-alkanes (n-C17–27) in source rocks and oil samples is relatively stable. The individual carbon isotope composition curves are very similar, with the δ13C value varying around 2‰. The δ13C distribution of long-chain n-alkanes (n-C27–35) has an obvious sawtooth pattern. The δ13C value of each compound generally shows a trend from light to heavy (positive bias) with the increase in carbon number (Figure 7). The kerogen composed of homogeneous algal matter is rich in δ13C isotope [33], indicating that the kerogen of the source rocks and residual oil in the joint fissures of the Nadu Formation not only contains lacustrine algal matter but also terrestrial matter.
For the E2n1 source rocks, the δ13C(Extract) values of n-C17–27 are in the wide range of −33.6‰ to −36.3‰ (−35.3‰ on average). The δ13C values are light before and heavy after, showing a gradual upward trend with the increase in carbon number. After n-C29, the δ13C values of even carbon are lighter. The characteristics of the E2n2 and the E2n3up samples are more consistent. Overall, the E2n2 and the E2n3up samples have heavier δ13C values than the E2n1 source rocks. The δ13C values of the E2n2 and the E2n3up samples are in the range of −32.2‰ to −34.1‰ (−32.4‰ on average), which is light before and heavy after. The E2n3low source rocks have the heaviest δ13C values, ranging from −30.2‰ to −31.3‰ (−30.7‰ on average).
The δ13C values of E2n1 oil samples only detected n-C17–29; the average value is −34.2‰ (from−32.7‰ to −35.8‰). The δ13C values show a gradual upward trend as the carbon number increases. The E2n2 and the E2n3up oil samples have heavier δ13C values (−31.8‰ on average from−29.5‰ to −33.9‰) than E2n2. The E2n3low oil samples have the heaviest δ13C values, ranging from −29.3‰ to −32.2‰ (−31.2‰ on average).

5. Discussion

5.1. Oil–Source Correlation

The composition of oil groups is influenced by the origin of the source material, and crude oil from various source rock varieties exhibits distinct group compositions [34,35]. In the source rock samples of the Nadu Formation in the Baise Basin, the content of saturated hydrocarbons is relatively high, followed by resin components and aromatic hydrocarbons, and the content of asphaltene is low. The E2n1 oil samples are shallowly buried and have low thermal maturity, indicating that the content of saturated is low (<50%); the content of resins and asphaltenes is rich (>26%). The composition of E2n2 and E2n3up oils are similar, and the saturated hydrocarbon content is high (>54%). The maturity of the E2n3low samples is higher, with a relatively high saturated hydrocarbon content (>60%) and a relatively low resin content (<10%). The composition of the extracts from the source rock in each layer is very similar to the characteristics of the oil samples. Based on the analysis of source rock and oil group composition characteristics, it is suggested that the oil may originate from the same layer of source rock.
The composition of crude oil is influenced by various factors, such as the depositional environment of the source rock, kerogen type, maturity of the source rock, and migration and accumulation of hydrocarbons. Therefore, it is not effective to determine the source rock of regional crude oils by bulk composition [28,36,37].
This section compares the biomarker parameters of oil samples and source rocks in the E2n1, E2n2, E2n3up, and E2n3low layers. The differences of biomarkers in each segment were mainly reflected in Pr/Ph, C24Tet/C26TT, Ts/Tm, diahopane series, diasterane/regular sterane, sterane/hopane, C29 20S/(20S + 20R), C29 ββ/(αα + ββ), 4-MSI and ETR values.
Firstly, some parameters of biomarkers indicating the organic matter source and the sedimentary environment were analyzed. The ratios of Pr/Ph in the Nadu Formation of the Baise Basin (0.73–4.49) indicate that organic matter from the lake was present throughout the deposition period. It suggests that the sedimentary environment was likely aerobic rather than anoxic [38,39]. The Pr/Ph ratio higher than 3 typifies an oxic depositional environment under high terrigenous OM input, whereas a ratio of <0.8 is indicative of an anoxic environment [40]. The Pr/Ph ratios of the E2n1 oil samples are relatively low, indicating that it has the suboxic conditions of deposition, and are possibly derived from the E2n1 source rocks with low Pr/Ph ratios. The higher Pr/Ph ratios (1.05) in the E2n2 and E2n3up oil samples indicate oxidizing conditions of deposition, which are close to the E2n2 and E2n3up source rocks. The E2n3low oil samples and source rocks show the highest Pr/Ph ratio, indicating strong oxidizing conditions of deposition with high terrestrial OM input. The E2n2, E2n3up, and E2n3low samples show relatively higher Ph/n-C18 and Pr/n-C17 values than the E2n1 samples. As shown in Figure 8, we can find that the oils collected from the Nadu Formation are sourced from rocks under an oxidizing environment with aquatic and terrigenous OM inputs [41].
In general, terrestrial crude oil has more abundant C19 and C20 members of tricyclic terpanes [27]. The ratio of C24 Tet to tricyclic terpanes exhibits a relationship with the phase, showing increased concentrations in terrigenous input source rocks and oils [43]. The difference in the distribution of these tricyclic and tetracyclic terpanes can be utilized for oil–source comparison. The ratio of C19 to C23 tricyclic terpanes (C19/C23TT) is commonly interpreted as a marker of the contribution of terrigenous material [19]. The tricyclic terpanes distribution reveals that among all source rock samples, the abundance of C23TT in E2n1 source rocks is relatively high, indicating that there may be lower aquatic organisms, such as the input of bacteria and algae [44]. The E2n2 + E2n3up and E2n3low samples show a higher abundance of C19TT and C24Tet than the E2n1 samples, indicating that terrestrial higher plants may contribute more in these two sections, while lower aquatic organisms contribute less]. It is inferred that the E2n2 and E2n3 source rocks are the main sources of the E2n2 and E2n3 oil samples. The abundance of C19TT in the oil samples was low and could not be compared. In addition, according to previous studies on the source rocks in the Liaodong Bay area [45], the ETR ratio can serve as a reliable indicator to assess sedimentary conditions within a lake environment. The E2n2, E2n3up, and E2n3low samples (>0.5) show greater ETR ratios than the E2n1 samples (<0.5), indicating that the hydrocarbon-generating parent materials of E2n2, E2n3up, and E2n3low are in the brackish water-fresh water environment. The hydrocarbon-generating parent material of the E2n1 samples is in the freshwater environment.
Ga is a special biomarker in saltwater environments, which mainly occurs in high-salinity water environments and indicates stratified water [46,47,48]. The gammacerane index (GI) of all samples is <0.2, indicating that the water body is fresh water and lacks stratification [49,50]. This is roughly the same as the water environment indicated by the ETR index, and there is a significant positive correlation between the ETR index and the GI.
The steranes are primarily derived from algae, higher plants, and zooplankton. The C27–C28–C29 steranes are highly specific for correlation purposes. The C27 steranes are derived from lower aquatic organisms, with C29 mainly derived from higher plants [28]. The distribution of sterane series in the study samples is mainly C29 homologs, which account for over 44.9% on average. The C29 steranes are indicative of OM inputs from land plants. The more abundant presence of C27 steranes suggests the deposition of organic matter (OM) from lake algae during sedimentation [27]. C27–C28–C29 regular steranes showed V-type distribution in E2n1. The E2n1 samples show higher abundances of the C27 steranes than the E2n2 + E2n3up and E2n3low samples, indicating the parent material of the E2n1 samples is a mixed source of planktons and terrestrial materials and is closer to the E2n1 source rocks. The C29 regular steranes were significantly dominant in the E2n2 + E2n3up and E2n3low samples, and the abundance of C27 regular steranes is significantly lower than that of E2n1. This suggests that the parent material primarily originates from organic matter sourced from land. This indicates that the E2n2 and E2n3 source rocks may be the main oil sources of E2n2 and E2n3. The growth environment of dinoflagellates is relatively complex, and some scholars believe that dinoflagellates mainly thrive in freshwater sedimentary environments [29,48]. Other researchers believe that dinoflagellates can form in terrestrial saline water environments [51]. Considering the low GI of each section, it can be inferred that the 4-MSI in the crude oil of the study area originated from the dinoflagellates of the freshwater lake facies. The difference in the abundance of 4-MSI in the samples reflects the difference in the contribution of dinoflagellates in the source of their parent materials. The value of the 4-MSI in the E2n1 samples is low, while the E2n2, E2n3up, and E2n3low samples contain a relatively higher value of 4-MSI. This indicates that the E2n2 + E2n3up and E2n3low oils parent materials were initially formed by relatively greater organic input from dinoflagellates and mainly derived from the E2n2, E2n3up, and E2n3low rocks. The 4-MSI of the E2n1 oils are close to the values of the E2n1 source rocks, inferring the E2n1 rocks as the main source of oils.
The maturity of oil and potential source rocks serve as further proof of oil–source correlation [42,52]. The Pr/Ph ratio symbolically increases with ripeness [53]. The Pr/Ph ratios of source rocks and oil samples from E2n1 to E2n3low gradually increased, indicating that the maturity increases with depth. Previous studies have shown that the CPI and OEP values are less than 1.2 and closer to 1, indicating that maturity has been reached [54,55]. The n-alkanes have higher CPI and OEP values and are greater than 1.0 with no odd carbon preference for all source rock samples. The values of E2n2 + E2n3up and E2n3low samples are lower and closer to 1, indicating a greater maturity. The E2n1 oil samples are in the immature stage, which are derived from the E2n1 source rocks with lower maturity. Prior research has substantiated that the isomerization parameters of steranes may reflect the maturity of crude oil [19,56,57,58]. The values of C2920S/(20S + 20R) and C29ββ/(αα + ββ) below 0.25 are immature oil, 0.25~0.4 are low mature oil, and more than 0.4 are mature oil [59]. C2920S/(20S + 20R) and C29ββ/(αα + ββ) are effective ways to determine the maturity of either the source rock or the oil [56,60]. The C29ααα20S/(20S + 20R) and C29ααα/(ααα + αββ) ratios of the E2n2 + E2n3up and E2n3low samples both more than 0.4, but less than 0.4 in the E2n1 (Figure 9). It indicates that the E2n2 + E2n3up and E2n3low samples have higher maturity than the E2n1 samples. It is further proven that the low mature E2n1 oil samples derived from the source rock of the E2n1 source rocks.
Hopanes with similar biomarker fingerprints provide additional evidence of the correlation between oil and its source [42]. From the distribution of hopanes, E2n2 and E2n3up source rocks and oil samples have Ts/Tm ratios greater than 1, with average values of (1.15 and 1.06), respectively. The Ts/Tm ratios of the E2n1 source rocks and oil samples were significantly lower than the E2n2 and E2n3up source rocks, with average values of (0.58 and 0.6), respectively. The E2n3low coal measure source rock has the lowest Ts/Tm ratio, which is 0.14. The Ts value of E2n3low oil is affected by the influence of E2n3low shallow coal source rocks, as the Ts value of coal is typically much lower than Tm. The Ts/Tm value of E2n3low oils is low because of the influence of E2n3low coal source rocks. This result indicates that the E2n3low oils is not solely derived from the E2n3low coal source rocks, but may be derived from the E2n3up and E2n3low source rocks. The abundance of diahopanes is high due to the specific organic matter source and diagenesis conditions. The exact cause of this high abundance remains unknown. However, these can be used to distinguish different crude oils and are characteristic biomarkers for source rock identification, which can be used for oil–source correlation [26]. Observing Figure 5 and Figure 6, it can be found that there are differences in various types of diahopanes (17α (H)-diahopane series (D), early elution diahopane series (E) and 18α (H)-neo hopane series). The E2n2, E2n3up, and E2n3low samples have high abundance diahopanes including 17α(H)-C30 diahopanes (C30D), C30 early eluting diahopanes(C30E) and 18α(H)-30-norneohopane (C29Ts). The E2n2, E2n3up source rocks, and oil samples have a high abundance of C30E. The abundance of C30E in the E2n1 and E2n3low source rocks is almost negligible, and C30E is also almost absent in E2n1 oil samples. The abundance of C30E in the E2n3low oils is special, which is between the E2n3up and E2n3low source rocks. The comparison of 17α (H)-diahopane series (D) also shows the same change rule. Furthermore, the E2n2 + E2n3up and E2n3low samples show higher C30D/C30H ratios than the E2n1 samples (Table 2 and Table 4), reflecting that the E2n2 + E2n3up and E2n3low samples have higher maturity than E2n1. Similarly, the E2n2 + E2n3up and E2n3low samples show a higher abundance of C29H and C29Ts than the E2n1 samples. This is consistent with the understanding that the relative abundance of C29H in crude oil generated by source rocks rich in terrestrial organic matter is high [61]. C29H and C29Ts are almost invisible in E2n1. However, the E2n3low oil samples show different results, which have a certain content of C29H and C29Ts but are significantly lower than the E2n3up samples. This rule has the same trend with Ts/Tm and C30E values, further indicating that the E2n3low oils have a common contribution from E2n3up and E2n3low source rocks. It also indicates that the residual oil present in the E2n1 joint fissures is unlikely to have derived from the E2n2 and E2n3 source rocks, which discharge crude oil. Although the oil discharged from the E2n2 and E2n3 source rocks migrates upward along the joint fissures, it fails to reach the E2n1 joint fissures.
Some scholars employ C29 steranes to study the phenomenon of oil and gas migration. The migration ability of isocholestane (C29ββR) is higher than normal cholesterol (C29ααR). Therefore, as the migration effect increases, the ratio of C29ββR/ααR will also increase significantly [59]. The C29ααS/R and C29ββR/ααR of all study samples did not reach the end of isomerization, which did not show an obvious migration effect. The residual oil in the high-angle joint fissures of the Nadu Formation in the Baise Basin is believed to have stemmed from the adjacent source rocks (Figure 9).
The isotopic composition of organic carbon in oils is primarily related to the isotopic compositions of the source rocks [62,63,64,65]. The carbon isotopic composition is an effective approach to oil/source correlation. The carbon isotopes of certain individual hydrocarbons in some samples have a limited range of identified compounds due to the significant loss of the lighter components and interference from the heavier part caused by the hopane series. However, through the detection of some compounds, it can also be seen that the closer δ13C value and similar trends can be used for oil source comparison. In general, the δ13C difference between oils does not exceed 2–3‰ for oils of similar maturity from the same source rock [27,28].
The averaged δ13C value of the E2n1 samples is relatively light. Due to the loss of both light and heavy parts of the E2n1 oil samples, the carbon number range is narrow, with only the δ13C value of n-C17–29. However, the difference in carbon isotopes is less than 2 ‰, and the broken line trend reveals a strong genetic relationship between the E2n1 oil samples and the E2n1 source rocks. The δ13C value of the E2n2 oil samples is relatively close to the E2n3up samples, with the δ13C value difference being 0.8‰ (≤2‰) (Figure 7). The E2n2 and E2n3up samples show greater δ13C values than the E2n1. The difference in δ13C value between the E2n2, E2n3up oil samples and the E2n2, E2n3up source rocks is 0.6‰ (≤2‰), showing a good genetic relationship. The average δ13C value differences between the E2n3low oil samples and the E2n3up, E2n3low source rocks are 1.5 ‰ and 0.5%, respectively. The δ13C values of n-C20 to n-C22, n-C26 to n-C29, and after n-C33 are closer to the E2n3low source rocks, indicating that they are mainly derived from the E2n3low source rocks. However, the δ13C values of n-C23 to n-C25 and n-C30 to n-C32 are similar to the E2n3up source rocks, indicating that they are mainly derived from the E2n3up source rocks. This phenomenon exhibits the characteristics of two mixed sources, primarily emanating from the E2n3up source rocks and the E2n3low coal measure source rocks. This follows the same pattern as the characteristics exhibited by biomarker compounds.
Based on the source rock evaluation, composition of chloroform bitumen “A” and oil samples, carbon isotopes, and molecular biomarkers from eight source rock samples and eight oil samples, the oil–source correlation was discussed using a variety of parameters. The results indicate that the properties of the remaining oil in the joint fissures of the Nadu Formation are similar to those of the adjoining source rocks. As a result, the crude oils of the Nadu Formation are categorized into three groups: E2n1, E2n2 + E2n3up, E2n3low.
Group I: E2n1 oils. The E2n1 oil samples have high resin and asphaltene content, low saturates content, low Pr/Ph, low Ga content, low C19TT/C23TT and C24Tet/C26TT, low C2920S/(20S + 20R) and C29ββ/(αα + ββ), low Ts/Tm, low C30D content, low diasteranes content, low 4-MSI, and the lowest δ13C value, indicating that the source rocks of oils were deposited under a suboxic environment with mixed inputs derived from planktons and land plants. The maturity of the E2n1 is lower and the content of dinoflagellates is less. Cross plots of C2920S/(20S + 20R) versus C29ββ/(αα + ββ) (Figure 9a), C29ααS/R versus C29ββR/ααR (Figure 9b), Ts/Tm versus C30diahopane/C30hopane and Ga/C30hopane (Figure 10a,b), Ts/(Ts + Tm) versus C2920S/(20S + 20R)steranes (Figure 10c), and C29D/C29R steranes versus C28R/C29R steranes (Figure 10d) illustrate a good correlation between the E2n1 oils and the E2n1 source rocks and distinct differences between the E2n1 oils and the E2n2, E2n3 source rocks [66].
Group II: E2n2 + E2n3up oils. This group oils show high Pr/Ph, low Ga content, high C19TT/C23TT and C24Tet/C26TT, high C2920S/(20S + 20R) and C29ββ/(αα + ββ), high Ts/Tm, high C30D and diasteranes content, and high 4-MSI, indicating that the source rocks of oils were deposited under an oxidizing environment with input mainly derived from land plants. The E2n2 and E2n3up oils have higher maturity than the E2n1 oils and have a large number of dinoflagellates. Cross plots of Figure 9 and Figure 10 the E2n2 and E2n3up oils cannot be clearly distinguished. The large number of parameters infer that oils in the E2n2 and E2n3up are mainly derived from the E2n2 and E2n3up source rocks.
Group III: E2n3low oils. The E2n3low oil samples show high Pr/Ph, low Ga content, medium C19TT/C23TT and C24Tet/C26TT, high C2920S/(20S + 20R) and C29ββ/(αα + ββ), high Ts/Tm, medium C30D and diasteranes content, the heaviest δ13C value, and high 4-MSI, indicating that the source rocks of the E2n3low oils were deposited under a strong oxidizing environment with input mainly derived from land plants. The maturity of the E2n3low is high and the content of dinoflagellates is higher. Many parameters of the E2n3low oils are between the E2n3up and E2n3low source rocks, indicating that they were generated from the E2n3up and E2n3low source rocks (Table 4 and Table 5).
To sum up, the composition, molecular biomarkers, and n-alkane carbon isotopes exhibit the same variation pattern, indicating that the residual oil present in the E2n1 joint fissures is unlikely derived from the E2n2 and E2n3 source rocks. Although the oil discharged from the E2n2 and E2n3 source rocks migrates upward along the joint fissures, it fails to reach the E2n1 joint fissures. The comparison of the E2n3 oil samples illustrates distinct differences between the oil from the coal-bearing source rock and the oil in the joint fissures from the E2n3up source rock. The oil in the joint fissures at 2341.44 m has no biomarker characteristics of coal samples. Therefore, the migration distance of crude oil discharged from the E2n2 and E2n3 source rocks along high-angle joint fissures is extremely limited, and the speculated range is within 5 m.

5.2. Geological Significance

The residual oil in high-angle joint fissures of the Nadu Formation in the Baise Basin is derived from the contribution of adjacent source rocks. The crude oil discharged from the Nadu Formation can only migrate upward along high-angle joints in a short distance, and the migration distance is usually less than 5 m. This suggests that the numerous high-angle joint fissures present in the Nadu Formation of the Baise Basin do not significantly impact the maintenance of hydrocarbons reservoirs. Mudstone possesses excellent sealing capacity, which fosters the preservation of crude oil within its source [67]. In this region, the well-preserved shale oil and fractures which act as important storage spaces indicate that shale oil of the Nadu Formation has good exploration potential [68]. Revealing the migration distance of crude oil along the joint fissures provides valuable evidence for studying the impact of these joint fissures on oil and gas conservation.

6. Conclusions

(1)
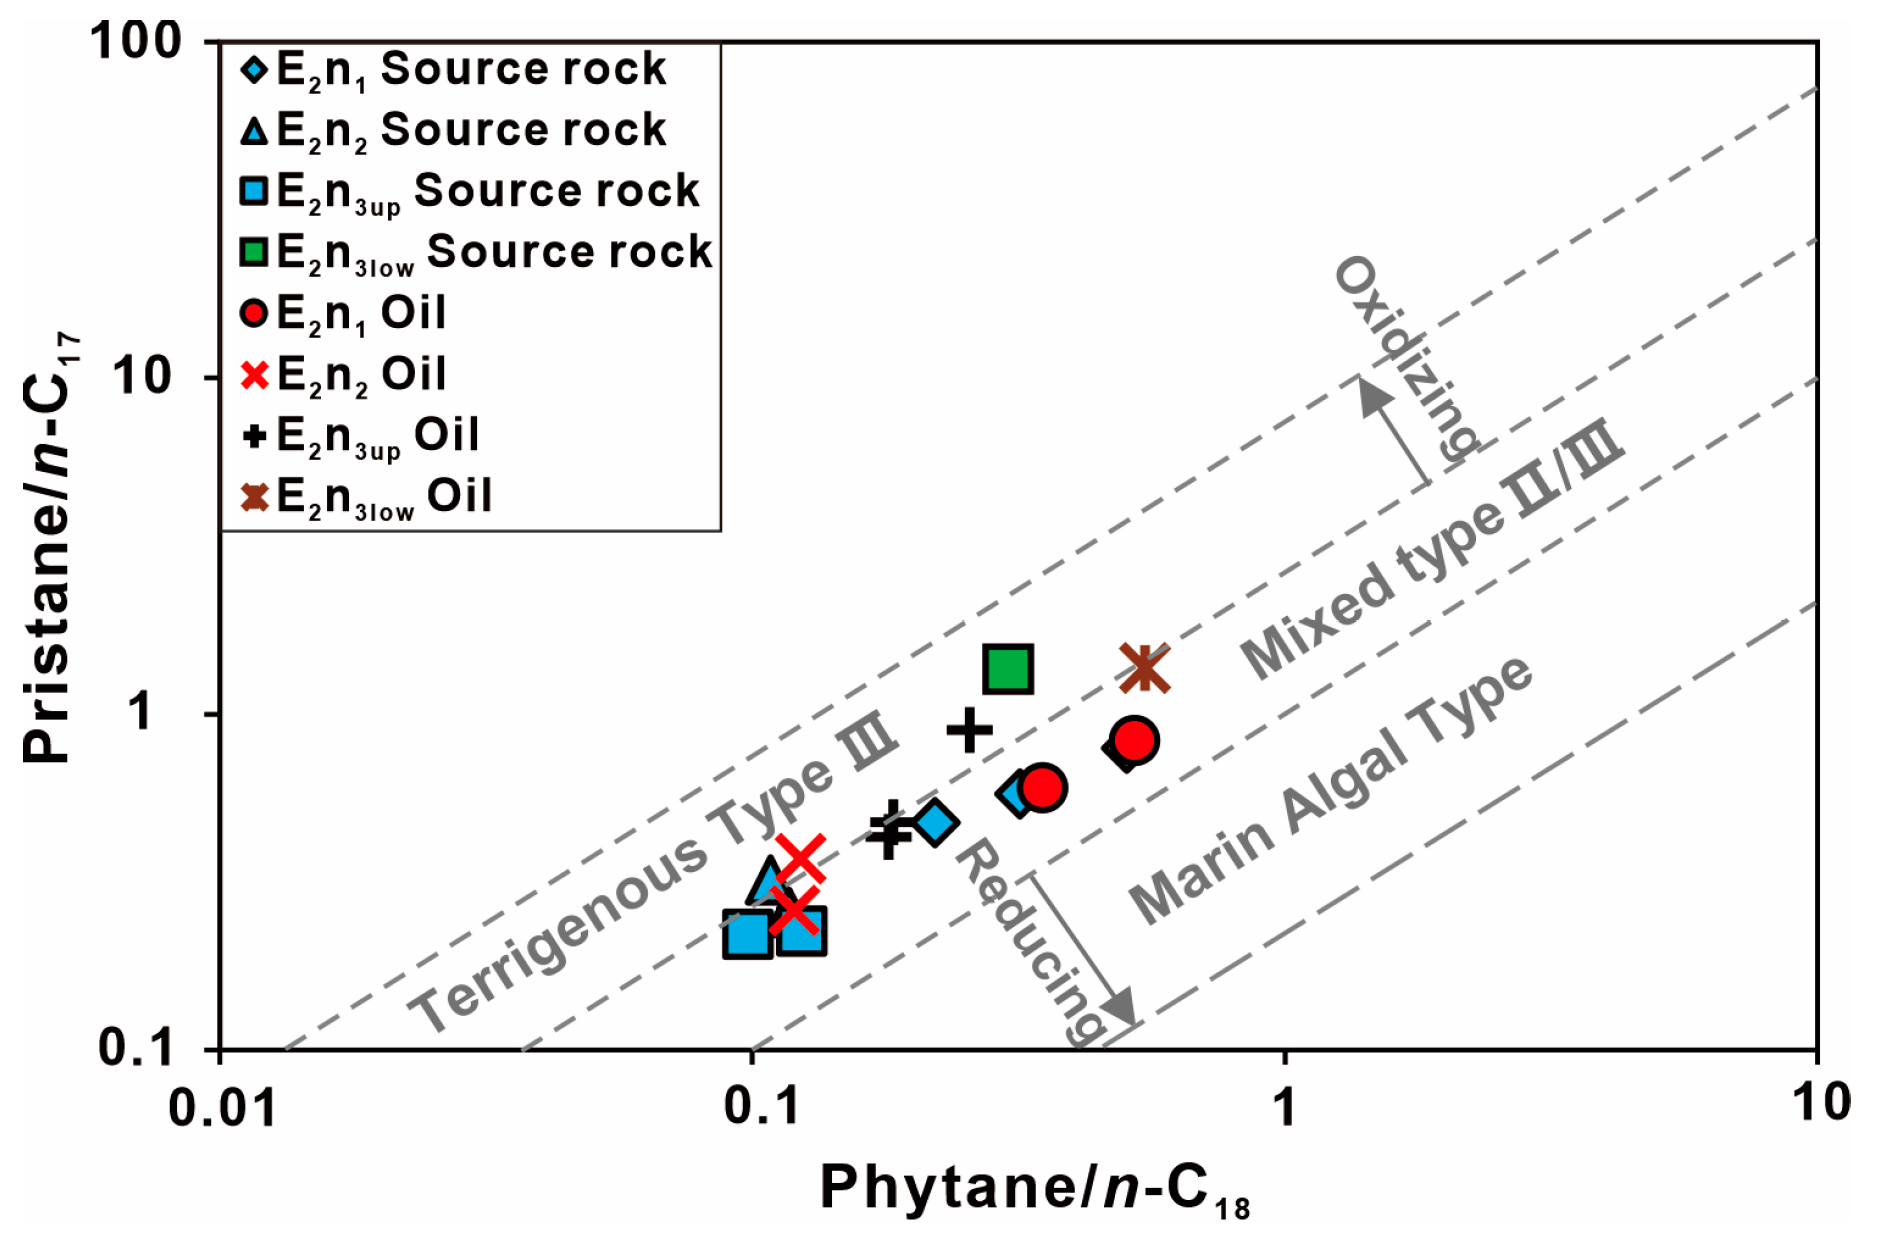
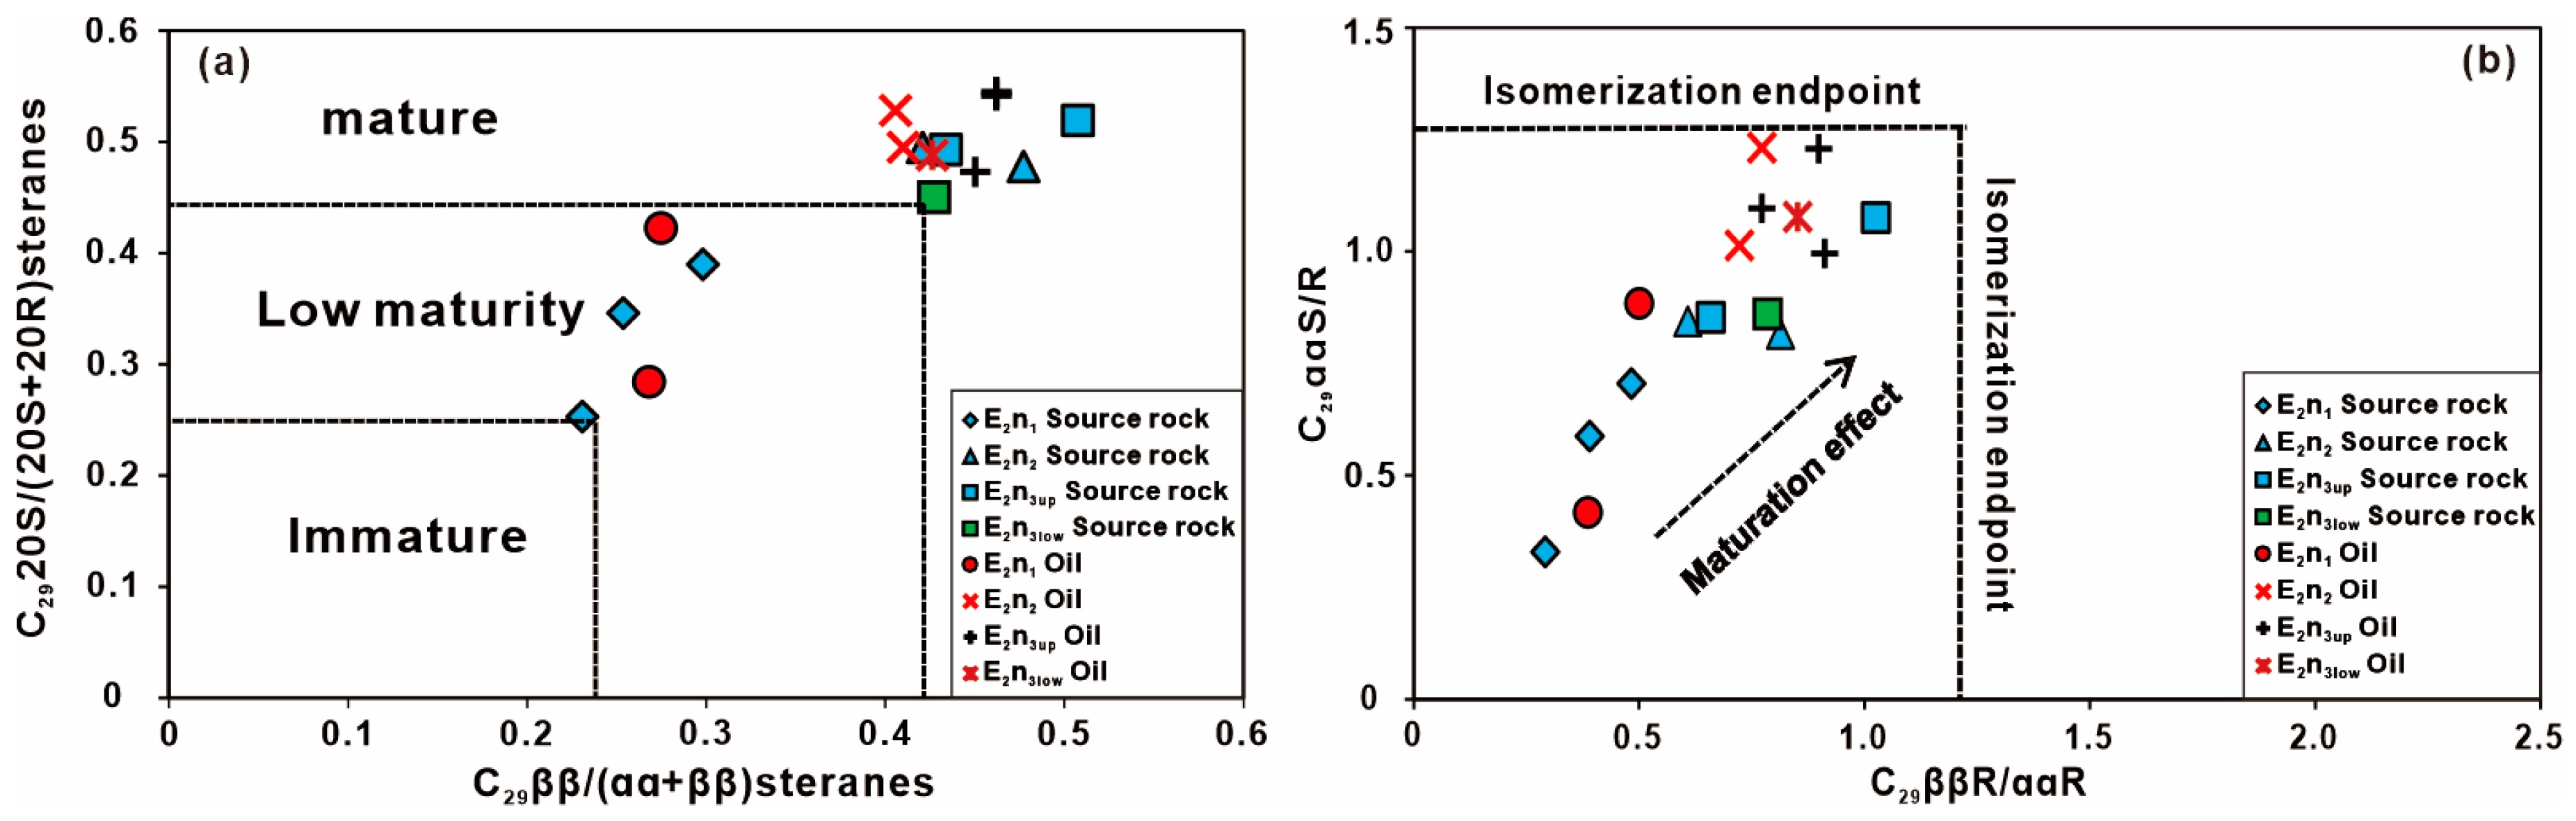
The source rocks of the Nadu Formation in the Baise Basin are in the stage of low maturity to maturity, primarily comprising type II1, with a minor proportion of type I, type II2, and type III. The parent materials of E2n1 oils were deposited in a suboxic freshwater shallow lake to semi-deep lake facies with input mainly derived from plankton and land plants. The organic matter of E2n2 and E2n3up oils were deposited within an oxidizing freshwater shallow lake to shore-shallow lake facies with input mainly derived from land plants. The parent materials of E2n3low oils were deposited within strong oxidizing freshwater shallow lake facies with input mainly derived from land plants.
(2)
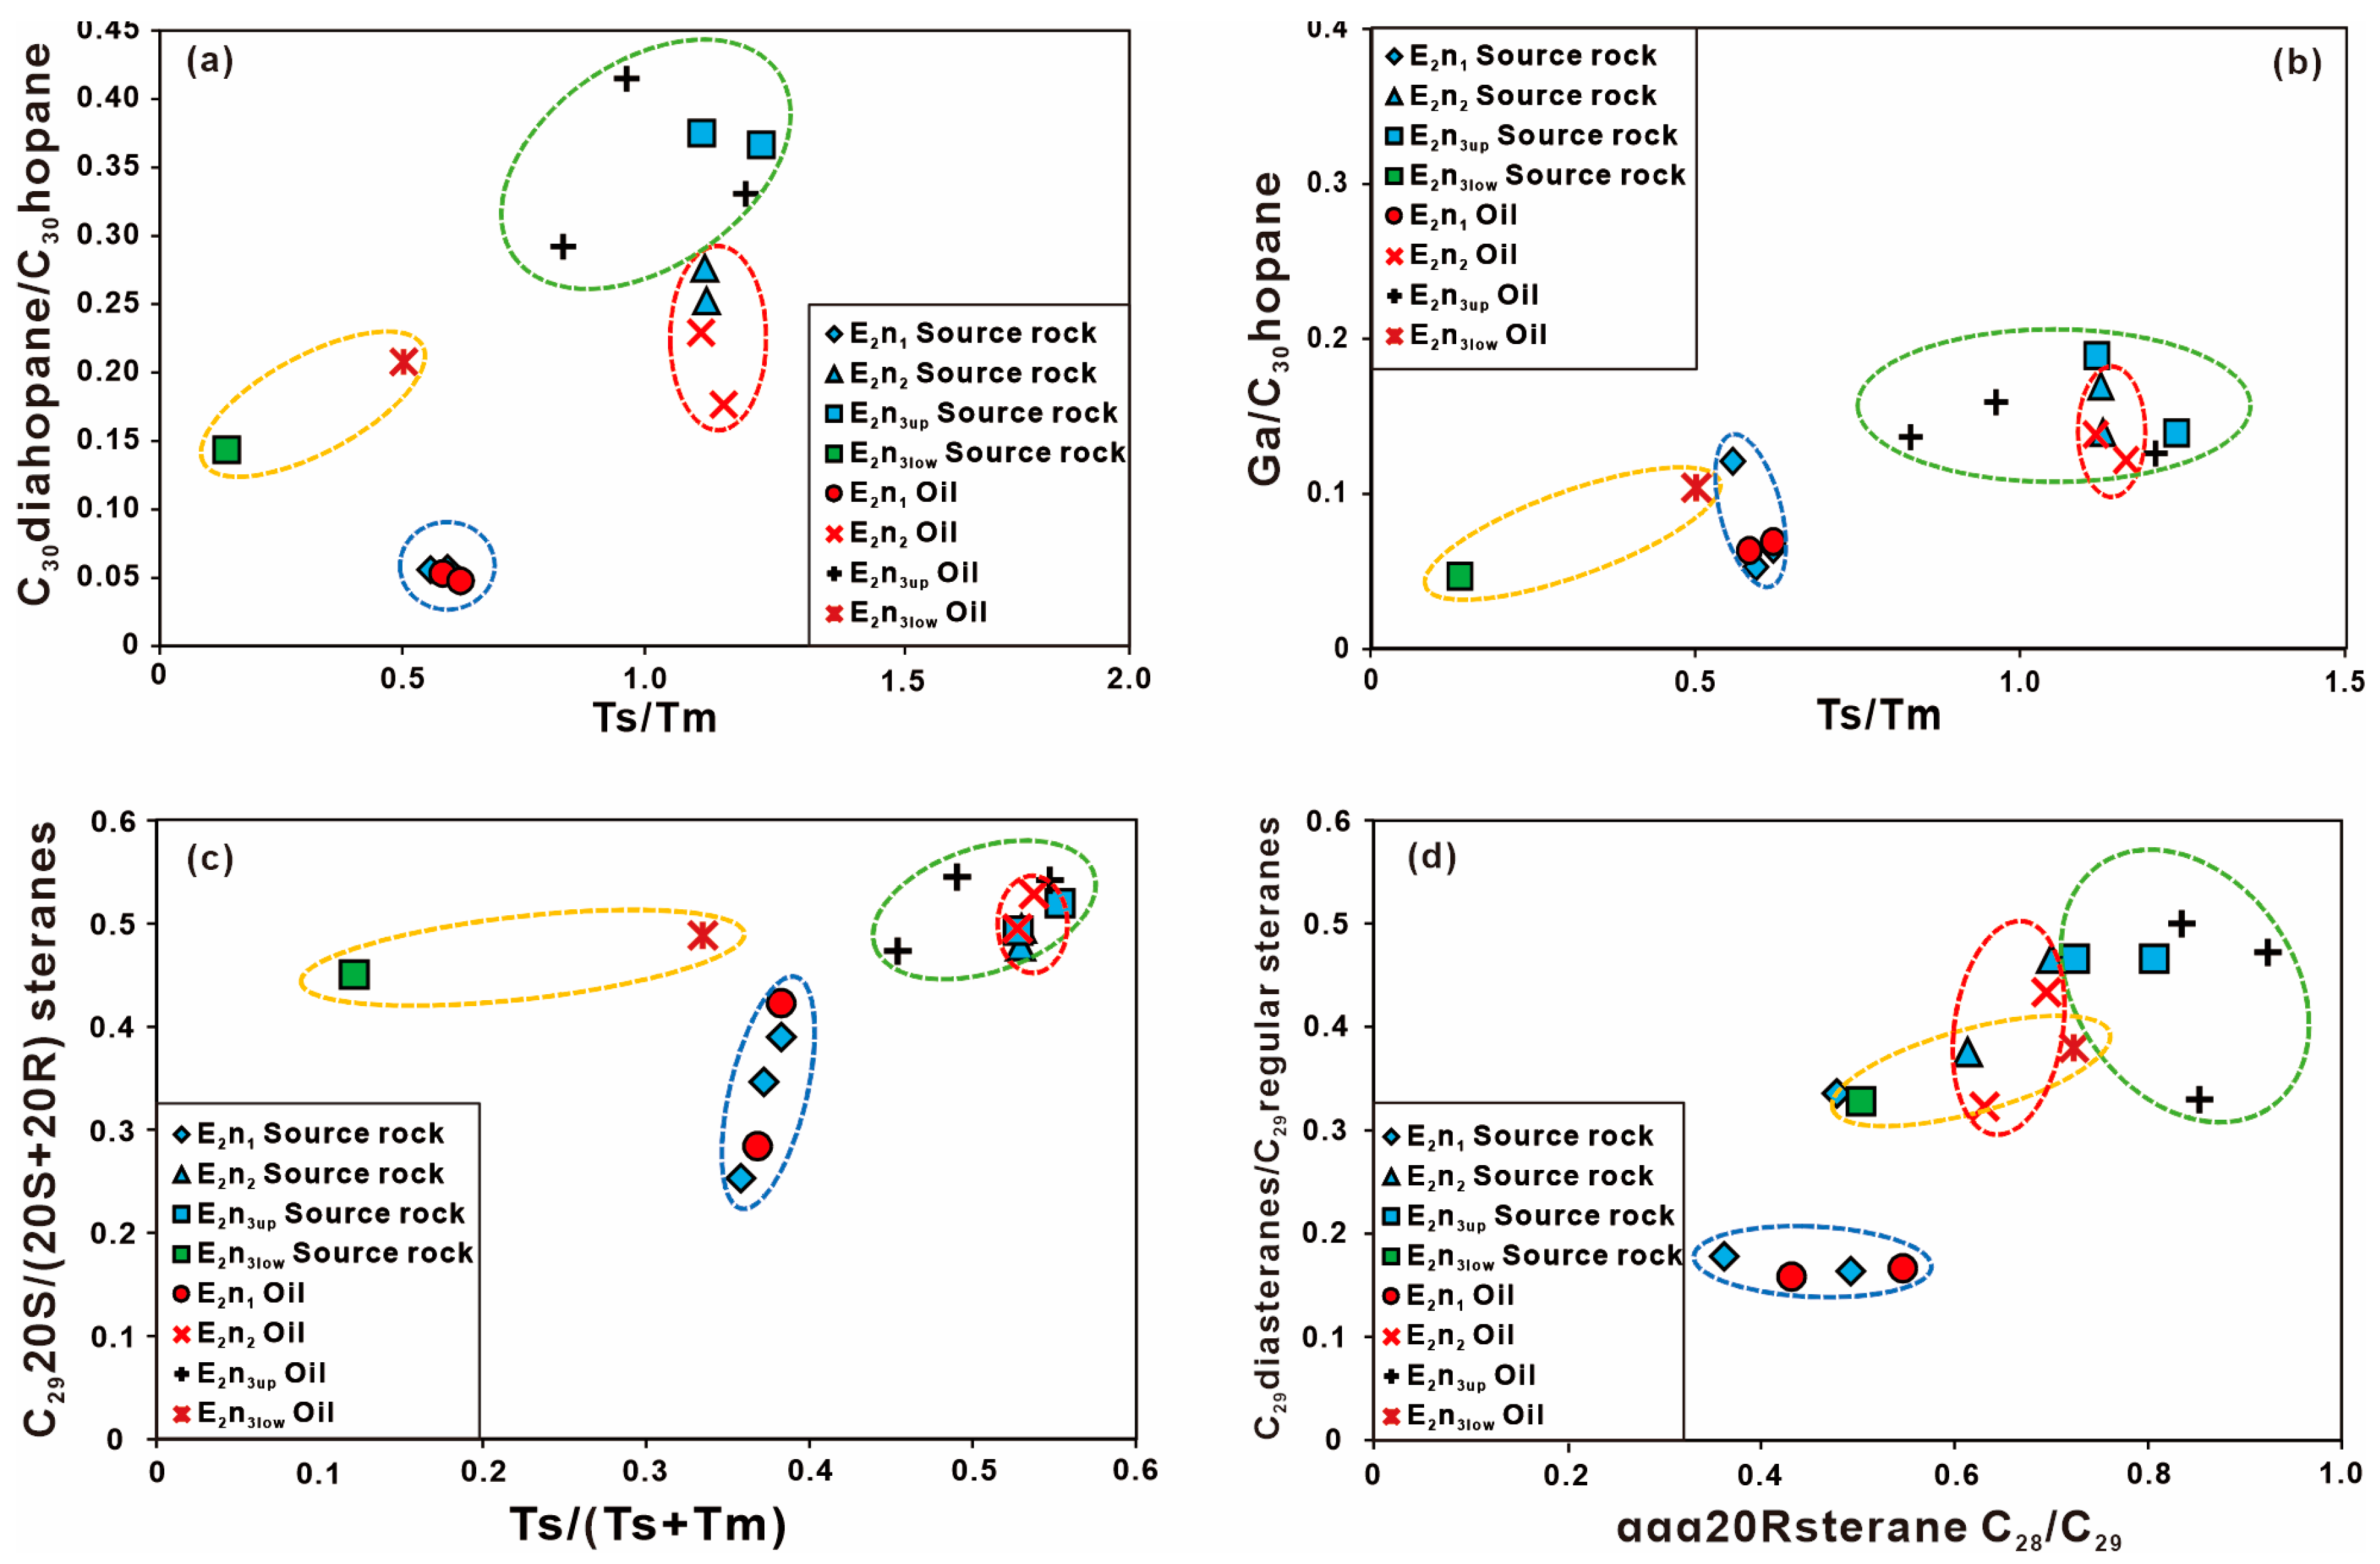
the biomarker characteristics of the four layers of source rocks and the corresponding high-angle joint fissures residual oil samples were compared. The differences in biomarker parameters were mainly reflected in Pr/Ph, Ts/Tm, C19TT/C23TT, C24Tet/C26TT, C30 diahopane, early elution diahopane, diasterane/regular sterane, C2920S/(20S + 20R) and C29ββ/(αα + ββ), ETR index, and δ13C values. The oil–source correlation indicates that the E2n1 oils are derived from the E2n1 source rocks. The E2n2 and E2n3up oils cannot be distinguished, which are mainly derived from the E2n2 and E2n3up source rocks. The E2n3low oils have the characteristics of two mixed sources and were generated from the E2n3up and E2n3low source beds.
(3)
Although the Baise pull-apart Basin has developed a large number of high-angle joint fissures within the Nadu Formation, the crude oil discharged from the Nadu Formation can only migrate upward along high-angle joints in a short distance. The well-preserved shale oil and fractures as important storage spaces indicate that shale oil of the Nadu Formation has good exploration potential. Collectively, the results provide insights into the origins of hydrocarbons in the Nadu Formation in the Baise Basin and enhanced knowledge needed for optimizing future exploration and production.

Author Contributions

Conceptualization, project administration, funding acquisition, Y.L.; writing—review and editing, Y.G. and Y.L.; software, B.L.; validation and resources, H.D., W.C. (Wei Cheng) and Y.X.; formal analysis, W.H.; investigation, Y.F. and W.T.; data curation, W.C. (Wei Chen); writing—original draft preparation, Y.G.; supervision, W.T. All authors have read and agreed to the published version of the manuscript.

Funding

Jointly funded by the National Natural Science Foundation of China (42272175, 41503034, 42172139); Major national science and technology projects (2017ZX0500105).

Data Availability Statement

The original contributions presented in the study are included in the article, further inquiries can be directed to the corresponding author.

Conflicts of Interest

The authors declare no conflict of interest.

References

  1. Binks, R.M.; Faihead, J.D. A plate tectonic setting for Mesozoic rifts of West and Central Africa. Tetonopysics 1992, 213, 141–151. [Google Scholar] [CrossRef]
  2. Picha, F.J. Exploring for Hydrocarbons Under Thrust Belts—A Challenging New Frontier in the Carpathians and Elsewhere. AAPG Bull. 1996, 80, 1547–1564. [Google Scholar] [CrossRef]
  3. Liu, C.; Li, H.; Shan, X.; Yi, J.; Xu, P.; Ren, S.; Niu, P. Development mechanism of metamorphic fractured reservoirs in the Bozhong area, Bohai Bay Basin: Implications from tectonic and magmatic hydrothermal activities. Geoenergy Sci. Eng. 2023, 229, 212030. [Google Scholar] [CrossRef]
  4. Martyushev, D.A.; Chalova, P.O.; Davoodi, S.; Ashraf, U. Evaluation of facies heterogeneity in reef carbonate reservoirs: A case study from the oil field, Perm Krai, Central-Eastern Russia. Geoenergy Sci. Eng. 2023, 227, 211814. [Google Scholar] [CrossRef]
  5. Galkin, S.V.; Martyushev, D.A.; Osovetsky, B.M.; Kazymov, K.P.; Song, H. Evaluation of void space of complicated potentially oil-bearing carbonate formation using X-ray tomography and electron microscopy methods. Energy Rep. 2022, 8, 6245–6257. [Google Scholar] [CrossRef]
  6. Demaison, G.; Huizinga, B.J. Genetic Classification of Petroleum Systems (1). AAPG Bull. 1991, 75, 1626–1643. [Google Scholar] [CrossRef]
  7. Tapponnier, P.; Molnar, P. Slip-line field theory and large-scale continental tectonics. Nature 1976, 264, 319–324. [Google Scholar] [CrossRef]
  8. Tapponnier, P.; Peltzer, G.L.; Le Dain, A.Y.; Armijo, R.; Cobbold, P. Propagating extrusion tectonics in Asia: New sights form simple experiment with plasticine. Geology 1982, 10, 611–616. [Google Scholar] [CrossRef]
  9. Wu, J.E.; McClay, K.; Whitehouse, P.; Dooley, T. 4D analogue modelling of transtensional pull-apart basins. Mar. Pet. Geol. 2009, 26, 1608–1623. [Google Scholar] [CrossRef]
  10. Liu, L.; Lee, Y.-J. Geochemistry of source rocks in the lower Tertiary Nadu Formation, Eastern Depression of the Baise Basin, Guangxi Province, China. J. Pet. Sci. Eng. 2004, 41, 135–157. [Google Scholar] [CrossRef]
  11. Zhu, Y.; Wang, Q.; Zou, H.; Huang, S.; Cai, X. Genetic type and accumulation characteristics of crude oil in Baise Basin. Acta Pet. Sin. 2006, 2, 28–33. [Google Scholar]
  12. Wang, L.; Wu, C.; Li, S.; Mao, X.; Li, X. Petroleum system of the Baise Basin, Guangxi Province. Pet. Geol. Exp. 2006, 28, 113–116. [Google Scholar]
  13. Xiao, L.; Zheng, R.C.; Wei, Q.L. Genesis of freshwater limestone of Paleogene Nadu Formation in Nakun area, Baise Basin. Geol. China 2012, 39, 965–971. [Google Scholar]
  14. Chen, Y.Z.; Jiang, Z.X.; Wu, J.R.; Lei, S.G.; Liu, L.F. Reservoir characteristics of Nadu Formation in the central fault depression of the eastern depression of the Baise Basin, China. J. Jianghan Pet. Inst. 2004, 26, 59–61. [Google Scholar]
  15. Peng, J.; Zheng, R.C.; Chen, J.S. Sequence Analysis and Source-Reservoir-Cap Rock Associations of Nadu Formation in Baise Basin. Acta Sedimentol. Sin. 2002, 20, 106–111. [Google Scholar]
  16. Bao, J.; Yang, X.; Zhu, C. Geochemical significances of 8,14-secohopanes in marine crude oils from the Tazhong area in the Tarim Basin, NW China. Pet. Explor. Dev. 2021, 48, 1077–1088. [Google Scholar] [CrossRef]
  17. Evenick, J.C. Examining the relationship between Tmax and vitrinite reflectance: An empirical comparison between thermal maturity indicators. J. Nat. Gas Sci. Eng. 2021, 91, 103946. [Google Scholar] [CrossRef]
  18. Ficken, K.J.; Li, B.; Swain, D.L.; Eglinton, G. An n-alkane proxy for the sedimentary input of submerged/floating freshwater aquatic macrophytes. Org. Geochem. 2000, 31, 745–749. [Google Scholar] [CrossRef]
  19. Peters, K.E.; Walters, C.C.; Moldowan, J.M. The Biomarker Guide: Biomarkers and Isotopes in Petroleum Exploration and Earth History; Cambridge University Press: Cambridge, UK, 2005; Volume 2, p. 1155. [Google Scholar]
  20. El Diasty, W.S.; El Beialy, S.; Anwari, T.; Peters, K.; Batten, D. Organic geochemistry of the Silurian Tanezzuft Formation and crude oils, NC115 Concession, Murzuq Basin, southwest Libya. Mar. Pet. Geol. 2017, 86, 367–385. [Google Scholar] [CrossRef]
  21. Brito, M.; Rodrigues, R.; Baptista, R.; Duarte, L.V.; Azerêdo, A.C.; Jones, C.M. Geochemical characterization of oils and their correlation with Jurassic source rocks from the Lusitanian Basin (Portugal). Mar. Pet. Geol. 2017, 85, 151–176. [Google Scholar] [CrossRef]
  22. Ourisson, G.; Albrecht, P.; Rohmer, M. Predictive microbial biochemistry from molecular fossils to procaryotic membrances. Trends Biochem. Sci. 1982, 7, 236–239. [Google Scholar] [CrossRef]
  23. Noble, R.A.; Alexander, R.; Kagi, R.I.; Knox, J. Tetracyclic diterpenoid hydrocarbons in some Australian coals, sediments and crude oils. Geochim. Cosmochim. Acta 1985, 49, 2141–2147. [Google Scholar] [CrossRef]
  24. Volkman, J.K.; Farrington, J.W.; Gagosian, R.B. Marine and terrigenous lipids in coastal sediments from the Peru upwelling region at 15°S: Sterols and triterpene alcohols. Org. Geochem. 1987, 11, 463–477. [Google Scholar] [CrossRef]
  25. Azevedo, D.; Neto, F.A.; Simoneit, B.; Pinto, A. Novel series of tricyclic aromatic terpanes characterized in Tasmanian tasmanite. Org. Geochem. 1992, 18, 9–16. [Google Scholar] [CrossRef]
  26. Smith, M.; Bend, S. Geochemical analysis and familial association of Red River and Winnipeg reserved oils of the Williston Basin, Canada. Org. Geochem. 2004, 35, 443–452. [Google Scholar] [CrossRef]
  27. Peters, K.E.; Moldowan, J.M. The Biomarker Guide: Interpreting Molecular Fossils in Petroleum and Ancient Sediments; Prentice Hall: Englewood Cliffs, NJ, USA, 1993. [Google Scholar]
  28. Lan, X.D.; Liu, H. The geochemical characteristics of the Paleogene lacustrine source rock and Cenozoic oil in the eastern Huangkou Sag, Bohai Bay Basin, China: An oil-source rock correlation. J. Pet. Sci. Eng. 2022, 214, 110434. [Google Scholar] [CrossRef]
  29. Wolff, G.A.; Lamb, N.A.; Maxwell, J.R. The origin and fate of 4-methyl steroid hydrocarbons. I. Diagenesis of 4-methyl sterenes. Geochim. Cosmochim. Acta 1986, 50, 335–342. [Google Scholar] [CrossRef]
  30. Boreham, C.J.; Summons, R.E.; Roksandic, Z.; Dowling, L.M.; Hutton, A.C. Chemical, molecular and isotopic differentiation of organic facies in the Tertiary lacustrine Duaringa oil shale deposit, Queensland, Australia. Org. Geochem. 1994, 21, 685–712. [Google Scholar] [CrossRef]
  31. Tissier, M.; Qudin, J.L. Characteristics of naturally occurring and pollutant hydrocarbons in marine sediments. In Proceedings of the 1973 Joint Conference on Prevention and Control of Oil Spills, Washington, DC, USA, 13–15 March 1973; pp. 205–214. [Google Scholar]
  32. Charrié-Duhaut, A.; Lemoine, S.; Adam, P.; Connan, J.; Albrecht, P. Abiotic oxidation of petroleum bitumens under natural conditions. Org. Geochem. 2000, 31, 977–1003. [Google Scholar] [CrossRef]
  33. Schoell, M. Stable isotope studies in petroleum exploration. In Advances in Petroleum Geochemistry; Brooks, J., Welte, D.H., Eds.; Academic Press: London, UK, 1984; Volume 1, pp. 215–245. [Google Scholar]
  34. Mei, B.W.; Liu, X.J. The distribution of isopentadienes in Chinese crude oil and their relationship with the geological environment. Oil Gas Geol. 1980, 1, 99–115. [Google Scholar]
  35. Mu, G.Y.; Zhong, N.N.; Liu, B. The Geochemical Characteristic and Genetic type of crude oil in the western sag of the Liaohe Baisin. Pet. Geol. Exp. 2008, 30, 611–616. [Google Scholar]
  36. Tissot, B.; Durand, B.; Espitali’e, J.; Combaz, A. Influence of the nature and diagenesis of organic matter in the formation of petroleum. AAPG Bull. 1974, 58, 499–506. [Google Scholar]
  37. Powell, T.G.; Creaney, S.; Snowdon, L.R. Limitations of use of organic petrographic techniques for identification of petroleum source rocks. AAPG Bull. 1982, 66, 430–435. [Google Scholar]
  38. Hunt, J.M. Petroleum Geochemistry and Geology; Freeman: New York, NY, USA, 1996; pp. 1–743. [Google Scholar]
  39. Wang, J.; Gao, Z.; Kang, Z.; Zhu, D.; Liu, Q.; Ding, Q.; Liu, Z. Geochemical characteristics, hydrocarbon potential and depositional environment of the Yangye Formation source rocks in Kashi sag, southwestern Tarim Basin, NW China. Mar. Pet. Geol. 2019, 112, 104084. [Google Scholar] [CrossRef]
  40. Didyk, B.M.; Simoneit, B.R.T.; Brassell, S.C.; Eglinton, G. Organic geochemical indicators of palaeo environmental conditions of sedimentation. Nature 1978, 272, 216–222. [Google Scholar] [CrossRef]
  41. Zhang, Z.; Gu, Y.; Jin, J.; Li, E.; Yu, S.; Pan, C. Assessing source and maturity of oils in the Mahu sag, Junggar Basin: Molecular concentrations, compositions and carbon isotopes. Mar. Pet. Geol. 2022, 141, 105724. [Google Scholar] [CrossRef]
  42. Liu, N.; Qiu, N.; Cai, C.; Li, Z.; Wang, Y.; Jiao, Y.; Gao, T.; Sun, H.; Lu, M. Geochemical characteristics and natural gas-oil-source correlation of the Shulu depression in the Jizhong Subbasin, Bohai Bay Basin, eastern China. J. Pet. Sci. Eng. 2022, 216, 110831. [Google Scholar] [CrossRef]
  43. Philp, R.; Gilbert, T. Biomarker distributions in Australian oils predominantly derived from terrigenous source material. Org. Geochem. 1986, 10, 73–84. [Google Scholar] [CrossRef]
  44. Barnes, M.A.; Barbers, W.C. Oxic and anoxic diagenesis of diterpenes in lacustrine sediments. In Advances in Organic Geochemistry; Bjorøy, M., Albrecht, C., Cornford, C., Eds.; John Wiley & Sons: Hoboken, NJ, USA, 1981; pp. 289–298. [Google Scholar]
  45. Tian, J.Q.; Zou, H.Y.; Zhou, X.H.; Xu, C.; Jiang, X.; Guo, Z.; Yang, Y. Biomarker characters of source rocks and oil-source correlation in Liaodong Bay. J. China Univ. Pet. 2011, 35, 53–58. [Google Scholar]
  46. Moldowan, J.M.; Seifert, W.K.; Gallegos, E.J. Relationship between petroleum composition and depositional environment of petroleum source rocks. AAPG Bull. 1985, 69, 1255–1268. [Google Scholar]
  47. Ten Haven, H.; Rohmer, M.; Rullkötter, J.; Bisseret, P. Tetrahymanol, the most likely precursor of gammacerane, occurs ubiquitously in marine sediments. Geo. Cos. Acta 1989, 53, 3073–3079. [Google Scholar] [CrossRef]
  48. Damst´e, J.S.S.; Kenig, F.; Koopmans, M.P.; Köster, J.; Schouten, S.; Hayes, J.; de Leeuw, J.W. Evidence for gammacerane as an indicator of water column stratification. Geo. Cos. Acta 1995, 59, 1895–1900. [Google Scholar] [CrossRef] [PubMed]
  49. Zou, C.N.; Zhao, Z.Z.; Yang, H.; Fu, J.H.; Zhu, R.K.; Yuan, X.J.; Wang, L. Genetic mechanism and distribution of sandy debris flows in terrestrial lacustrine basin. Acta Sed. Sin. 2009, 27, 1065–1075. [Google Scholar]
  50. Liu, B.; Bechtel, A.; Sachsenhofer, R.F.; Gross, D.; Gratzer, R.; Chen, X. Depositional environment of oil shale within the second member of Permian Lucaogou Formation in the Santanghu Basin, Northwest China. Int. J. Coal Geol. 2017, 175, 10–25. [Google Scholar] [CrossRef]
  51. Jiamo, F.; Guoying, S.; Jiayou, X.; Eglinton, G.; Gowar, A.P.; Rongfen, J.; Shanfa, F.; Pingan, P. Application of biological markers in the assessment of paleoenvironments of Chinesenon-marine sediments. Org. Geochem. 1990, 16, 769–779. [Google Scholar] [CrossRef]
  52. Wang, Y.J.; Cai, C.; Xiao, Y.; Ming, J.; Tian, R.; Ren, Y.; Zhu, Z.L.; Zhang, Y.J.; Shi, C. Geochemical characteristics and oil-source correlation of crude oils of buried hills in Shulu Sag, Jizhong Depression. Earth Sci. 2021, 46, 3629–3644. [Google Scholar]
  53. Alexander, R.; Larcher, A.V.; Kagi, R.I.; Price, P.L. The use of plant derived biomarkers for correlation of oils with source rocks in the Cooper/Eromanga Basin system, Australia. APPEA J. 1988, 28, 310–324. [Google Scholar] [CrossRef]
  54. Li, D.; Li, R.; Wang, B.; Liu, Z.; Wu, X.; Liu, F.; Zhao, B.; Cheng, J.; Kang, W. Study on oil–source correlation by analyzing organic geochemistry characteristics: A case study of the Upper Triassic Yanchang Formation in the south of Ordos Basin, China. Acta Geochim. 2016, 35, 408–420. [Google Scholar] [CrossRef]
  55. Lu, Z.X.; Chen, S.J.; He, Q.B.; Li, Y.; Zhang, J.Y.; Wu, Q.B. Relationship between methyl phenanthrene distribution and organic matter maturity: A case study of Yangchang Formation Chang 7 source rocks, Erdos Basin, China. Pet. Sci. Technol. 2018, 36, 1718–1724. [Google Scholar] [CrossRef]
  56. Justwan, H.; Dahl, B.; Isaksen, G.H. Geochemical characterization and genetic origin of oils and condensates in the south viking graben, Norway. Mar. Petrol. Geol. 2006, 23, 213–239. [Google Scholar] [CrossRef]
  57. Mrkić, S.; Stojanović, K.; Kostić, A.; Nytoft, H.P.; Šajnović, A. Organic geochemistry of Miocene source rocks from the Banat Depression (SE Pannonian Basin, Serbia). Org. Geochem. 2011, 42, 655–677. [Google Scholar] [CrossRef]
  58. Baoshou, Z.H.; Meijun, L.I.; Qing, Z.H.; Tieguan, W.; Ke, Z.; Zhongyao, X.; Shaoying, H. Determining the relative abundance of C26-C28 triaromatic steroids in crude oils and its application in petroleum geochemistry. Pet. Geol. Exp. 2016, 38, 692–697. [Google Scholar]
  59. Huang, D.F.; Li, J.C.; Zhang, D.J. Maturation sequence of continental crude oils in hydrocarbon basins in China and its significance. Org. Geochem. 1990, 16, 521–529. [Google Scholar]
  60. Seifert, W.K.; Moldowan, J.M. Paleore construction by biological markers. Geo. Cos. Acta 1981, 45, 783–794. [Google Scholar] [CrossRef]
  61. Brooks, P. Unusual biological marker geochemistry of oils and possible source rocks, offshore Beaufort-Mackenzie Delta, Canada. Org. Geochem. 1986, 10, 401–406. [Google Scholar] [CrossRef]
  62. Stahl, W. Source rock-crude oil correlation by isotopic type-curves. Geochim. Cosmochim. Acta 1978, 42, 1573–1577. [Google Scholar] [CrossRef]
  63. Clayton, C. Carbon isotope fractionation during natural gas generation from kerogen. Mar. Pet. Geol. 1991, 8, 232–240. [Google Scholar] [CrossRef]
  64. Sun, Y.; Chen, Z.; Xu, S.; Cai, P. Stable carbon and hydrogen isotopic fractionation of individual n-alkanes accompanying biodegradation: Evidence from a group of progressively biodegraded oils. Org. Geochem. 2005, 36, 225–238. [Google Scholar] [CrossRef]
  65. Marcano, N.; Larter, S.; Mayer, B. The impact of severe biodegradation on the molecular and stable (C, H, N, S) isotopic compositions of oils in the Alberta Basin, Canada. Org. Geochem. 2013, 59, 114–132. [Google Scholar] [CrossRef]
  66. Huang, H.; Zhang, S.; Gu, Y.; Su, J. Impacts of source input and secondary alteration on the extended tricyclic terpane ratio: A case study from Palaeozoic sourced oils and condensates in the Tarim Basin, NW China. Org. Geochem. 2017, 112, 158–169. [Google Scholar] [CrossRef]
  67. Martyushev, D.A.; Ponomareva, I.N.; Chukhlov, A.S.; Davoodi, S.; Osovetsky, B.M.; Kazymov, K.P.; Yang, Y. Study of void space structure and its influence on carbonate reservoir properties: X-ray microtomography, electron microscopy, and well testing. Mar. Pet. Geol. 2023, 151, 106192. [Google Scholar] [CrossRef]
  68. Liu, B.; Song, Y.; Zhu, K.; Su, P.; Ye, X.; Zhao, W. Mineralogy and element geochemistry of salinized lacustrine organic-rich shale in the Middle Permian Santanghu Basin: Implications for paleoenvironment, provenance, tectonic setting and shale oil potential. Mar. Pet. Geol. 2020, 120, 104569. [Google Scholar] [CrossRef]
Figure 1. Location and geological profile of the Nadu Formation in the Baise Basin. (a) study area of the Baise Basin; (b) generalized stratigraphy of the Baise Basin; (c) geological cross section. (modified from Liu et al. [8] and Chen et al. [12]).
Processes 11 02850 g001
Figure 2. Stratigraphic histogram and sampling point location of Kunye 1 well in Baise Basin.
Processes 11 02850 g002
Figure 3. Pictures of high-angle jointed fissures rock cores and residual oil on fissure surfaces. Note: (a,b) E2n1 has developed multi-angle fissures, mainly at medium to low angles, (c,d) with uneven oil content on the fissure surface and yellow fluorescence dry light; (e,f) E2n2 is mainly developed with high-angle fissures, (g,h) and the fissure surface is oily with fluorescent dry light yellow and wet light yellow; (j,k) E2n3up and E2n3low are mainly characterized by high-angle fissures, with a large number of vertical fissures developed. (i,l) The oil content on the fissure surfaces is uniform, fluorescent dry illuminated yellow, and wet illuminated yellow.
Processes 11 02850 g003
Figure 4. Hydrogen index with Tmax for source rocks from the Kunye 1 well showing the organic matter type, respectively.
Processes 11 02850 g004
Figure 5. GC-MS chromatograms showing distributions of normal alkanes (m/z 85), terpanes, hopanes (m/z 191), and steranes (m/z 217) from source rocks samples in the Nadu Formation, Baise Basin. Note: Pr = Pristane; Ph = Phytane; H = hopane; TT = tricyclic terpane; TE = tetracyclic terpane; Ga = gammacerane; C29Ts = C29 18α(H)-norneohopane; C27R, C28R and C29R = C27–29 5α(H), 14α(H), 17α(H)-20R steranes; C30E = C30 early eluting diahopanes; C30D = 17a(H)-C30 diahopane; C29H = C29 17a(H),21b(H)-30-norhopane; C27 Dia = C27 diasteranes; 4-MSI = 4-methyl sterane.
Processes 11 02850 g005
Figure 6. GC-MS chromatograms showing distributions of normal alkanes (m/z 85), terpanes, hopanes (m/z 191), and steranes (m/z 217) from oil samples in the Nadu formation, Baise Basin. Note: Pr = Pristane; Ph = Phytane; H = hopane; TT = tricyclic terpane; TE = tetracyclic terpane; Ga = gammacerane; C29Ts = C29 17α(H),21β(H)-30-norhopane; C27R, C28R and C29R = C27–29 5α(H), 14α(H), 17α(H)-20R steranes; C30E = C30 early eluting diahopanes; C30D = 17a(H)-C30 diahopane; C29H = C29 17a(H),21b(H)-30-norhopane; C27 Dia = C27 diasteranes; 4-MSI = 4-methyl sterane.
Processes 11 02850 g006
Figure 7. δ13C values of C17–C35 n-alkanes in all samples from the Nadu formation, Baise Basin.
Processes 11 02850 g007
Figure 8. Cross plot of Pr/n-C17 ratios versus Ph/n-C18 ratios for assessing oil source, in the Nadu Formation, Baise Basin (modified from Liu et al. [42]).
Processes 11 02850 g008
Figure 9. Cross plot of (a) C2920S/(20S + 20R) and C29ββ/(αα + ββ); (b) C29ααS/R and C29ββR/ααR ratios of oil samples and source rocks extracts in the Nadu Formation, Baise Basin.
Processes 11 02850 g009
Figure 10. Cross plots of selective biomarker parameters for oil and source rock samples from the Nadu Formation, Baise Basin. (a) C30D/C30H and Ts/Tm; (b) Ga/C30H and Ts/Tm; (c) C2920S/(20S + 20R) and Ts/(Ts + Tm); (d) C29D/C29R steranes and C28R/C29R.
Processes 11 02850 g010
Table 1. Oil content of joint fissures surface.
Depth/m1936.282036.542223.922227.042337.722339.292341.442343.81
LayerE2n1E2n1E2n2E2n2E2n3upE2n3upE2n3upE2n3low
Oil content
(mg/cm2)
0.250.380.540.480.650.560.370.57
Table 2. Family composition of the data of source rock extract in the Nadu Formation, Baise Basin.
Depth/mLayerComponent
Saturate/%Aromatics/%Resin/%Asphaltene/%
1935.50E2n137.0824.5824.165.00
1959.57E2n144.6615.4220.182.37
2036.54E2n150.418.5024.404.44
2223.52E2n257.5917.4713.542.23
2229.84E2n253.7316.3914.934.98
2286.83E2n3up59.0715.5013.133.09
2341.09E2n3up59.3217.4414.045.71
2344.30E2n3low61.8620.437.576.00
Table 3. Saturated biomarker parameters calculated from m/z 85, m/z 191, and m/z 217 mass spectra of the source rock in the Nadu Formation, Baise Basin.
Depth/mLayerCPIOEPPr/
Ph
Pr/
n-C17
Ph/
n-C18
Ts/
Tm
Ga/
C30H
C30D/
C30H
4-
MSI
ETRC19TT/
C23TT
C24Tet/
C26TT
C2920S/
(20S + 20R)
C29ββ/
(ββ + ɑɑ)
Dia/Reg
Sterane
Ts/
(Ts + Tm)
1935.50E2n11.411.391.260.790.510.560.120.060.070.400.451.110.250.230.280.36
1959.57E2n11.371.311.830.470.220.590.050.060.170.280.671.910.350.250.200.37
2036.54E2n11.211.231.710.580.320.620.060.050.380.460.431.510.390.300.160.38
2223.52E2n21.171.132.480.320.111.130.140.250.570.561.672.070.490.420.440.53
2229.94E2n21.161.131.800.260.121.120.170.280.550.491.241.660.480.480.360.53
2286.83E2n3up1.131.091.900.220.101.120.190.380.600.592.142.810.490.430.420.53
2341.09E2n3up1.091.081.480.230.121.240.140.370.310.502.132.240.520.510.480.55
2344.30E2n3low1.171.074.491.350.300.140.050.140.250.762.292.430.450.430.350.12
Note: CPI = [(ΣC25–C33)/(ΣC26–C34) + (ΣC25–C33)/(ΣC24–C32)] × 0.5; OEP = (C21 + C23 + C25)/4 × (C22 + C24); Pr = Pristane; Ph = Phytane; C17 = normal straight-chain acyclic alkane with 17 carbon atoms; C18 = normal straight-chain acyclic alkane with 18 carbon atoms; Ts: C27 18α(H)-22,29,30-trisnorneohopane; Tm: C27 17α(H)-22,29,30-trisnorhopane; Ga = gammacerane; C30D = 17a(H)-C30 diahopane; C30H = C30 hopane; C19 TT = C19 tricyclic terpane; C23 TT = C23 tricyclic terpane; C26 TT = C26 tricyclic terpane; C24 Tet = C24 tetracyclic terpane; 4-MSI = 4-methyl steranes; ETR = (C28 TT + C29 TT)/(C28 TT + C29TT + Ts); C29αααS = 24-ethyl-5α,14α,17α(H) (20S) cholestane; C29αββR = 24-ethyl-5α,14β,17β(H) (20R) cholestane; C29αββS = 24-ethyl-5α,14β,17β(H) (20S) cholestane;C29αααR = 24-ethyl-5α,14α,17α(H) (20R) cholestane; C2920S/(20S + 20R) = (C29αααS + C29αββS)/(C29αααS + C29αββR + C29αββS + C29αααR); C29ββ/(ββ + αα) = (C29αββR + C29αββS)/(C29αααS + C29αββR + C29αββS + C29αααR); Dia/Reg sterane = (C27 αβS + C27 αβR + C27 βαS + C27 βαR + C29 βαR + C29 αβS)/(C27 αααS + C27 αββR + C27 αββS + C27 αααR + C28 αααS + C28 αββR + C28 αββS + C28 αααR + C29 αααS + C29 αββR + C29 αββS + C29 αααR).
Table 4. Family composition of the data of oil samples in the Nadu Formation, Baise Basin.
Depth/mLayerComponent
Saturate/%Aromatic/%Resin/%Asphaltene/%
1936.28E2n136.1116.6733.334.17
2036.54E2n148.3513.9924.172.54
2223.92E2n257.9122.274.454.44
2227.04E2n266.3713.019.870.90
2337.72E2n3up54.7316.4515.361.45
2339.29E2n3up56.5113.2616.282.33
2341.44E2n3up58.0817.968.381.80
2343.81E2n3low61.0819.168.382.39
Table 5. Saturated biomarker parameters calculated from m/z 85, m/z 191, and m/z 217 mass spectra of oil samples in the Nadu formation, Baise Basin.
Depth/mLayerCPIOEPPr/PhPr/
n-C17
Ph/
n-C18
Ts/
Tm
Ga/
C30H
C30D/
C30H
4-
MSI
ETRC19TT/
C23TT
C24Tet/
C26TT
C2920S/
(20S + 20R)
C29ββ/
(ββ + αα)
Dia/Reg
Sterane
Ts/
(Ts + Tm)
1936.28E2n11.251.300.780.830.520.580.060.050.130.430.191.240.280.260.160.37
2036.54E2n11.091.200.960.600.350.620.070.050.350.480.111.130.420.270.170.38
2223.92E2n21.081.091.240.260.121.120.140.230.420.511.162.530.500.410.420.53
2227.04E2n21.121.101.110.370.121.160.120.180.380.500.211.720.530.410.370.54
2337.72E2n3up1.021.080.730.430.180.830.140.290.430.550.172.170.470.450.320.45
2339.29E2n3up1.031.080.950.480.180.960.160.410.420.560.212.080.550.460.450.49
2341.44E2n3up1.001.081.110.890.261.210.130.330.480.540.121.390.540.460.420.55
2343.81E2n3low0.981.091.171.370.550.500.100.210.410.620.152.030.490.430.310.33
Note: CPI = [(ΣC25–C33)/(ΣC26–C34) + (ΣC25–C33)/(ΣC24–C32)] × 0.5; OEP = (C21 + C23 + C25)/4 × (C22 + C24); Pr = Pristane; Ph = Phytane; C17 = normal straight-chain acyclic alkane with 17 carbon atoms; C18 = normal straight-chain acyclic alkane with 18 carbon atoms; Ts: C27 18α(H)-22,29,30-trisnorneohopane; Tm: C27 17α(H)-22,29,30-trisnorhopane; Ga = gammacerane; C30D = 17a(H)-C30 diahopane; C30H = C30 hopane; C19 TT = C19 tricyclic terpane; C23 TT = C23 tricyclic terpane; C26 TT = C26 tricyclic terpane; C24 Tet = C24 tetracyclic terpane; 4-MSI = 4-methyl steranes; ETR = (C28 TT + C29 TT)/( C28 TT + C29 TT + Ts); C29αααS = 24-ethyl-5α,14α,17α(H) (20S) cholestane; C29αββR = 24-ethyl-5α,14β,17β(H) (20R) cholestane; C29αββS = 24-ethyl-5α,14β,17β(H) (20S) cholestane;C29 αααR = 24-ethyl-5α,14α,17α(H) (20R) cholestane; C2920S/(20S + 20R) = (C29 αααS + C29 αββS )/(C29 αααS + C29 αββR + C29 αββS + C29 αααR); C29 ββ/(ββ + αα) = (C29αββR + C29αββS)/((C29 αααS + C29 αββR + C29 αββS + C29 αααR); Dia/Reg sterane = (C27 αβS + C27 αβR + C27 βαS + C27 βαR + C29 βαR + C29 αβS)/(C27 αααS + C27 αββR + C27 αββS + C27 αααR + C28 αααS + C28 αββR + C28 αββS + C28 αααR + C29 αααS + C29 αββR + C29 αββS + C29 αααR).
Disclaimer/Publisher’s Note: The statements, opinions and data contained in all publications are solely those of the individual author(s) and contributor(s) and not of MDPI and/or the editor(s). MDPI and/or the editor(s) disclaim responsibility for any injury to people or property resulting from any ideas, methods, instructions or products referred to in the content.

