1. Introduction
The recent commitment of most industrially advanced countries in the world, including the EU, to reduce CO
2 emissions implies strong actions both in terms of the use of alternative energy sources and in terms of energy-saving strategies [
1]. Particularly, energy saving is considered the most economical energy source since it can provide, at a cheap cost, a great reduction in CO
2 emissions and save investments on infrastructures and new energy sources [
2]. In this sense, the Fit for 55 package, proposed in July 2021 by the European Commission, aims to enhance the efforts of the EU in terms of the rational use of energy. In the package, the Commission has proposed to revise the Energy Efficiency Directive by increasing the current EU-level 2030 target for energy efficiency from 32.5% to 36% for final energy consumption. In addition, several provisions to accelerate energy efficiency efforts by member states were put forward, such as increased annual energy savings obligations. EU Member States presented Long-Term Strategies featuring national energy scenarios together with sectorial targets, which should be monitored to ensure that national contributions are consistent with the achievement of the European reduction path. Recently, geopolitical events required an acceleration of the clean energy transition: in May 2022 European Commission presented the REPowerEU plan to end the dependence on Russian fossil fuels at the same time to tackle the climate crisis. The 2030 energy efficiency target under the ‘Fit for 55’ package has been increased from 9% to 13%, and among the actions in the REPowerEU plan, there are those grouped as Clean Industry. Replacing coal, oil and gas in industrial processes will help cut the dependency on Russian fossil fuels. Key actions such as electrification, energy efficiency and uptake of renewables could allow industry to achieve natural gas savings by 2030, even beyond Fit for 55 targets [
3].
Among the many industrial sectors, the pharmaceutical industry (NACE code 21.20) is particularly energy-intensive: according to Belkhir and Elmeligi [
4] and data dating back to 2012–2015 from the major 15 pharmaceutical companies in the world (60% of the overall sector), the CO
2 emission intensity, measured as the ratio between emissions and revenues, the results are higher than that of the automotive industry. In order to meet the Paris agreement targets, the authors also underline that the companies should reduce their emission intensity by almost 60% relative to 2015 values.
Despite its high energy intensity, in recent years, greater attention on the topic of sustainability in the pharmaceutical industry around the world has been raised, together with awareness of the great improvements that the sector is still capable of achieving. Milanesi et al. [
5], for example, outline how research in sustainability in the pharmaceutical sector has evolved recently, especially from a managerial standpoint. The authors state that there is room for further research both on the theme of cleaner production (green chemistry, waste management, etc.) and on the impact of sustainability on business ethics or corporate social responsibility policies. Chaturvedi et al. [
6] instead provided a bibliographical analysis of the sustainability reports from Indian pharmaceutical industries, observing that sustainability reporting is a recent trend in the sector. Despite the few data reported, the authors concluded that several sustainability practices could lead to reduced environmental impact in the sector. Between those practices, the use of metering and sub-metering and the use of energy performance indicators may reduce energy consumption by 10% and waste by 18%. In the end, Xu and Tan [
7] quantified the reduction potential for CO
2 emissions in the Chinese pharmaceutical industry and shown that technical efficiency, technological advancement, and technological leadership may have a huge influence on decarbonization.
In line with the growing attention on energy transition, further literature studies focus on energy efficiency in different sectors, including the pharmaceutical sector. Examples are as follows. In references [
8,
9], the authors study the means of the German chemical and pharmaceutical industry to achieve a reduction in global warming potential via several scenarios. They show that an economically sustainable reduction in environmental impact requires the adoption of circular economy schemes, not just the pursuit of a 100% renewable energy supply. Wernet et al. [
10] show that, with respect to basic chemicals, pharmaceutical products, especially Active Pharmaceutical Ingredients (APIs), have a larger environmental impact, especially due to larger energy needs. Afridi et al. [
11] investigate the role of energy management and energy efficiency, collecting survey data from eight different industries in Pakistan, belonging to the steel, food and pharmaceutical sectors. The awareness of energy management practices is low, and their further introduction would be associated with a significant saving potential exists relative to lighting and HVAC. Different scenarios for decarbonization opportunities in the chemical sector are analyzed in [
12], focusing on the UK and a wide variety of production processes and technologies, among which those of the pharmaceutical sector. On a similar topic, Aughney and O’ Donnell [
13] elaborate a method to assess different energy-saving opportunities in the manufacturing industry, also applying it to the pharmaceutical sector and showing an interesting saving potential. Applying a stochastic frontier modeling approach, reference [
14] investigates the level and drivers of electricity consumption in several manufacturing sectors in Kenya, among which pharmaceutical: results show that the energy efficiency of the sector can significantly improve.
Despite there being some estimations in terms of the CO
2 energy intensity of the pharmaceutical industry, the sector generally lacks data about both final energy and resource consumption, which makes it difficult to analyze its sustainability performances [
4,
15]. This also means that the sector lacks energy performance indexes and information about how energy is used inside the plants, which in turn hinders the definition of what the proper energy-saving strategies may be.
A good example is a recent study about the energy performances of the Swiss chemical and pharmaceutical sector [
15]. The authors underline the absence of Specific Energy consumption (SEC) indexes (usually defined as the ratio of energy consumption to an energy driver, such as goods production, as in ref. [
16]) due to the confidentiality of production-related data. They also state that the lack of publicly available industrial databases hinders energy efficiency analyses whose aim should be to indicate energy efficiency strategies. In this sense, they state that a bottom–up approach, based on real case studies, can provide more reliable information on energy-saving strategies with respect to other methods that analyze the whole sector at the statistical level: their data came from energy audits provided to private companies.
Another issue related to the evaluation of the energy performances of the pharmaceutical sector is that the whole sector is often included in the wider branch of the chemical industry since part of the pharmaceutical industry is related to the production of the bulk. Referring to the NACE classification (Nomenclature statistique des activités économiques dans la Communauté européenne or Statistical Nomenclature of economic activities inside the European Community), the chemical industry is classified under the NACE code 20, while the pharmaceutical is NACE code 21, with the bulk production being identified as 21.10 and drug production as 21.20. Zuberi et al. [
15] approach the three sectors together, not distinguishing between the different plants.
In terms of process similarities, sectors 20 and 21.10 are comparable since their main processes are chemical reactions, such as inorganic, organic or biochemical. Sector 21.20, instead, is mainly related to the formulation of commercial drugs, thus mainly including mixing, filling and finishing processes. As we will see, this has a huge influence on the distribution of energy consumption since sectors 20 and 21.10 generally require more energy for the production process, while 21.20 requires more energy for auxiliary services (for example, air quality and conditioning). When examining energy efficiency interventions and their saving potential, it is important to analyze sites that are comparable in terms of energy demand and production processes.
In the next subsections, the current literature in terms of Energy Performance Indexes (EnPIs) and Energy Performance Improvement Actions (EPIAs) in the pharmaceutical sector will be briefly outlined. The main research questions of this research are, indeed, connected to these two areas and summarized in the last section.
1.1. Energy Performance Indexes
Regarding the pharmaceutical sector, the main reference in terms of EnPIs is the work carried on in the United States under the Environmental Protection Agency (EPA) and Department of Energy (DOE) Energy Star® program.
Under the Energy Star program, the work of G. A. Boyd [
17] developed a benchmark where energy consumption, in terms of total source energy, i.e., the overall primary energy required by the plant, is related to its surface area. According to this work, the pharmaceutical plant can be divided into three main areas: bulk (areas where the preparation in in a bulk form of active and inactive ingredients), finish (areas used for Fill or Finish processes OR other manufacturing, production, or warehousing with climate-controlled environments) and R&D (R&D and QA laboratories, including the associated offices). Primary energy consumption is related to certain drivers: (a) summer or (b) winter degree days, (c) the percentage of surface area intended to produce the active ingredient or for (d) the fill and finish of the drug, (e) and the annual coverage of the plant’s capacity, with a greater importance of the surface areas and of the annual coverage of the plant capacity. Such results indicate a certain importance of fixed energy uses with respect to variable energy uses.
The work by Boyd is used as a baseline to determine the Energy Star Energy Performance Index (EPI) of the plant [
18], calculated on a scale from 1 to 100 (with 100 corresponding to the most efficient level of performance) in relative terms respect to the other plants in the USA participating to the energy Star program.
When it comes to the analysis of the final energy uses in the plant, two important references are [
19,
20]. Both underline the great importance of Heating Ventilation and Air Conditioning (HVAC) systems in terms of keeping the proper environmental conditions required for the processes.
Capparella in [
19] shows that most of the energy consumption in the pharmaceutical sector is due to auxiliary services, mainly dedicated to maintaining the environmental conditions necessary to produce drugs. This means that the air conditioning of the production rooms plays a fundamental role, even more so if large quantities of air changes are required in the rooms to be treated. The article also focuses on the requests for these process conditions, highlighting how different standards can be implemented with a different concept of the process. The standards cited (compared to ISO 14644) are:
Unidirectional air flow ISO 5/EU grade A (300–600 air changes per hour);
Non-unidirectional flow ISO 7/EU Grade B (60 changes per hour);
Non-unidirectional flow ISO 8/EU Grade C (30 changes per hour);
Non-unidirectional flow not classified (15 changes per hour).
The Energy Star guide for energy management in the pharmaceutical sector [
20] estimates the final energy consumption, as explained in
Table 1, where the energy consumption is split by function (plug loads, lighting, HVAC) or by destination (R&D, Offices, Bulk, Finish, Warehouses, Miscellaneous).
It is worth mentioning that based on data by [
17], the mean, median and 75% percentile values of the Energy Use Intensity in the US industry, calculated as the primary energy, are, respectively, 3819, 4391 and 2544 kWh/m
2.
1.2. Energy Saving Actions
In terms of energy saving actions, the literature provides some interesting examples.
Again, an early important contribution is [
20], which provides an exhaustive list of recommendations divided by consumption areas (HVAC, motors, air compression, etc.). However, the first recommendation is the adoption of energy-saving programs, which should be intended as a systemic set of actions aimed at achieving energy saving. They should include the following: the appointment of an energy manager, a company energy policy, periodic analysis of the data, comparisons with benchmarks and objectives and the involvement of staff through periodic reports on the achieved energy savings. The adoption of energy-saving programs can be seen as a precondition to making better-founded and more effective choices concerning the implementation of recommendations by consumption areas. In an analysis devoted to two industrial and two tertiary sectors, [
21] shows that both the number of EPIAs and energy savings per site are higher in enterprises with an Energy Management System or a monitoring system. This confirms the value added of EPIAs in the general/managerial area, which could improve the planning and effectiveness of those in technical areas, as will be further investigated in the following.
Focusing on different energy consumption areas, instead, in [
20], most recommendations regard periodic maintenance and energy management strategies, which also include the wide monitoring of energy consumption and its drivers. Examples are temperature settings regarding HVAC systems or the inventory and the programmed maintenance of electric motors. In 2008, the guide estimated that such measures could have payback times of less than 3 years, thus proving to be interesting for companies.
Ref. [
19], instead, suggests production process isolation technologies (which only isolate the production line) as an energy-saving action. Plants with such technologies can consume from 30 to 50% less energy for air conditioning than plants that use barrier systems for clean rooms (which instead isolate entire environments).
An important example of the possible savings related to proper management and the retrofitting of HVAC systems is reported in [
22]. The authors categorize the existing systems and controls into three typical options (a) partially or totally decoupling the heating and cooling stages of the HVAC system and (b) allowing dry bulb and relative humidity to vary within certain ranges. Their performances are then analyzed under different weather and load conditions, applying the results to a retrofit project for a pharmaceutical factory located in Hong Kong. The results show that cleanrooms’ HVAC systems in a tropical environment can achieve up to 70% and 88% electricity and gas reduction for cooling and heating purposes, respectively.
Still looking at cleanrooms, Kircher et al. [
23] simulated and validated the model of a cleanroom located in a research facility to identify energy-saving strategies. They identified a heat recovery system (4.3 years of payback time), an improved lighting system (1.5 years payback time) and a demand-controlled filtration system as economically attractive (6 months payback time). They stated that the three actions could save up to 9 TJ/year (214 toe/year), equal to 15% of the energy used in the facility.
Another important work estimating the possible savings in the pharmaceutical sector is [
15]. This work estimated, in 2016, the overall energy saving in the chemical and pharmaceutical industries in Switzerland (thus, including both sectors 21.10 and 21.20) as 4400 TJ, roughly 104 ktoe of the total energy saving. Savings are shown by means of energy efficiency cost curves, describing their cost-effectiveness (CHF per GJ of energy saved) and the corresponding contribution of each technological solution in terms of cumulative saving. Those savings, attainable mainly via acting on motor systems, main processes and heat recovery strategies, were, however, related to the whole chemical and pharmaceutical sectors, while in the drug production industry (21.20), chemical processes certainly have a lower if no impact on overall energy consumption.
The work of Loomans et al. instead [
24] investigates to what extent air change rates optimization and ventilation energy use reduction are possible in current and future pharmaceutical cleanrooms. The paper monitors two facilities located in the Netherlands and elaborates on three strategies for energy-efficient ventilation: fine-tuning, Demand Controlled Filtration (DCF), and optimizing airflow patterns. The results showed that, for the cases investigated, large energy savings are possible (in the order of 70–90%).
Focusing on another important energy service in the pharmaceutical sector, namely compressed air systems, [
25] proposes a methodology built on statistical tools for energy measurement, which was then customized for real-time energy performance control and tested on a pharmaceutical company. This approach was useful for identifying the role of the compressors’ activation sequence in determining consumption to facilitate troubleshooting activities and yield more accurate predictions of the energy budget related to the use of compressed air.
Efforts are also underway toward process optimization, as in [
26], where tablet production was optimized, with a reduction in GHG emissions and energy cost of 73.2%.
In [
27], localized product cooling systems are analyzed to identify the saving potential associated with a localized HVAC refrigeration system. The authors prove that smaller localized refrigeration housing can reduce the total energy demand by up to 65%
Both [
13,
28] show that targeting low-value-added energy uses can lead to substantial savings. Ref. [
28], relative to 2007 data, showed the importance of monitoring energy and raw material flows with the aim of optimizing their use, while [
13] achieving a mean of 51% energy savings in several activities, including the pharmaceutical industry.
1.3. Scope and Structure of This Work
The references listed above allow drawing some important conclusions: (i) the majority of the final energy consumption in the pharmaceutical sector is related to the auxiliary services; (ii) the scarcity of data regarding the production makes it difficult to calculate EnPIs related to production; the only available data in terms of plant energy consumption are related to the US industry and have not been updated; (iii) the whole sector has potential for energy savings, yet a clear quantification of such savings is not present; (iv) the whole sector lacks data publicity, and it is often treated together with other sectors (chemical), making it difficult to quantify data for the 21.20 NACE sector; (v) a proper strategy for the evaluation of both the EnPIs and EPIAs is the bottom–up approach based on plant-based data.
Given the above, this work aims to evaluate both the energy performances and the energy savings potential of the pharmaceutical plants in Italy.
The data shown in this paper are based on the Italian Energy Audit database, Audit 102 [
29], managed by ENEA under the framework of the compulsory energy auditing scheme required in Europe by the Energy Efficiency Directive (EED) [
30]. The EED is implemented in Italy by the D.Lgs 102/2014 (updated by D.Lgs. 73/2020) where, according to Art. 8, two categories of companies have been targeted as obliged to implement an Energy Management System (EMS) compliant with the international standard UNI CEN ISO 50001 or to carry out energy audits compliant to the international standard UNI CEI EN 16247 on their production sites, firstly by the 5 December 2015, and then at least every four years: Large Enterprises and Energy Intensive Enterprises. The 50,001 suggests how to properly manage energy with the aim of achieving savings while also providing the guidelines to calculate EnPIs. 16247, instead, is specifically focused on the requirements of the energy audits.
Large enterprises are companies with more than 250 employees and revenues higher than 50 MEUR and/or a balance sheet higher than 43 MEUR. Energy-intensive companies are the ones with large energy consumption (>1 GWh of electricity) applying for tax relief on the part of the purchased energy. All energy-intensive enterprises are registered on the list of «Cassa per i servizi energetici ed ambientali» (Governmental Agency related to electricity).
Those companies are required to send an energy audit to the ENEA every four years; since the obligation started in 2015, now, the Audit102 database includes more than 28,000 audits from almost two complete cycles of obligation.
Inside the Program “Electrical System Research 2019–2021”, with Project 1.6, “Energy efficiency of industrial products and processes”, ENEA and Farmindustria (Italian Pharmaceutical Industry Association, [
31]) established a collaboration with the aim to inquire about the energy performances of the pharmaceutical sector, find the most promising EPIAs and provide a specific guideline to draft an energy audit for pharmaceutical production sites. Farmindustria associate companies provided the ENEA with technical feedback with respect to the analysis of the energy consumption data and the identification of the EPIAs [
32].
The data used in this paper are referred to the audits of the pharmaceutical plants sent to ENEA by December 2019 (referred to the 2018 year of consumption), at the beginning of the second cycle of obligation, before the COVID-19 pandemic. They are analyzed according to the methodology explained in [
33].
Based on those data and the above-mentioned methodology, the paper tries to understand these research questions in two thematic areas:
- (1)
How to determine an energy performance index for the pharmaceutical sector? Additionally, once having defined it, what is its level?
- (2)
What is the energy-saving potential embedded in the whole sector? What kind of energy-saving strategies should the plants adopt and according to the indicators assessed?
The evaluation model presented in this paper aims to define and compute EnPIs and characterize EPIAs: the achieved results, in addition to having significance in a research field where information is relatively scarce, can also provide practical guidance to policy makers in terms of benchmarking and targeting support measures.
This paper is organized as follows:
Section 2 shows the methodology adopted to analyze the available data and calculate both EnPIs and EPIAs;
Section 3 shows the results in terms of energy consumption and EnPIs determination;
Section 4 shows the most important EPIAs reported in the Italian energy audits, with relative energy saving potential.
Section 5 draws some conclusions with respect to the data shown in
Section 3 and
Section 4.
2. Methodology
The energy analysis of specific economic sectors should ideally be sufficiently disaggregated to allow for the analysis of processes and sites, while models should be the same for all economic sectors [
34]. Therefore, the use of information from energy audits is ideal for defining sectoral Energy Performance Indicators (EnPIs).
At the company level, the relationship between all the involved processes and the final product can be represented by an energy–flow distribution in the different company areas in a “Plant Energy Model” [
35]. The Audit102 database, managed by ENEA, stores, for every audited site, production volumes representing the activity, purchase and consumption volumes of all energy commodities. End uses are split among three main functional areas: main activities (activities focused on goods manufacturing), auxiliary services (activities supporting the main ones, such as energy conversion, air compression, cold energy production, etc.) and general services (activities needed for the run of the industrial site, such as lighting or air conditioning), as shown in
Figure 1.
Two types of energy performance indicators can be obtained using such information basis:
First-level index (covering all energy carriers: electricity, thermal energy, natural gas) as follows:
Second-level index (covering the prevalent carrier(s)):
Specific consumption in the individual production department;
Consumption by energy destination (main activities, auxiliary services, or general services);
Consumption of characteristic technologies.
In this work, different first-level EnPIs are computed and analyzed.
Global EnPI: includes total energy consumption;
Electric EnPI: includes only the electrical consumption of production processes (taken from power-grid and/or autonomous production, fossil fuels, renewable sources, and cogeneration);
Thermal EnPI: it includes only the thermal consumption of production processes (from natural gas, cogeneration, heat, cold, biomass, fossil fuels and other carriers).
Moreover, second-level EnPIs related to HVAC systems are also computed.
The methodology used during the analysis can be outlined in the following steps:
Step 1—Selection of the Sample and Data Cleaning;
Step 2—Calculation of the Real Sectoral EnPI (EnPIr);
Step 3—Analysis of Linear Correlation between consumption and energy drivers;
Step 4—Formulation of Specific EnPI Model (EnPIm).
In Step 1, based on the ENEA energy audit database, a qualitative and quantitative analysis of the energy consumption of every site is developed by the four-digit NACE group. Normalization is carried out in order to correct or dismiss nonhomogeneous elements from both energy audit reports and summary spreadsheets containing the energy consumption summaries. In this way, a statistical sample is extracted from the reference population to implement the mathematical model. A numeric threshold of sites is set, conventionally equal to 5, below which the modeling was not carried out due to insufficient statistical representativeness.
In Step 2, for each NACE group, the EnPIr is calculated as a mean referring to the entire group and to the whole range of the energy driver (in the case the NACE group has been split into many partitions, as many EnPIrs are calculated). Once the EnPIr and its standard deviation are calculated, the Coefficient of Variation of the EnPIr (CV) is also computed as the ratio between the standard deviation and the mean value. A “reliability index” of the EnPIr is defined as a function of the CV values, as follows:
«high» if it is less than 20%
«medium» if it is between 20% and 60%;
«low» if it is between 60% and 100%;
«not available» if it is equal to or greater than 100%.
The values of this indicator should be used with caution: high reliability is related to stable EnPIs with the energy drivers and homogenous products and processes, whereas a low value of the “reliability” of real EnPIs indicates high variability in the products and processes.
A linear regression involving two variables, energy consumption (global, electrical, thermal or natural gas as a function of the EnPI) and the energy driver (in its specific P.U.), is elaborated in Step 3. In order to evaluate the statistical representativeness of the linear correlation, the following parameters are used: R2, coefficient of determination, R, coefficient of correlation, and finally, the p-value parameter. It is also necessary to define the confidence interval (CI) achieved with the analysis.
Linear regression is represented by the production function in Equation (1)
where
y represents the final energy consumption [MJ] as the sum of a constant term,
b [MJ], which is not dependent on the quantity of the energy driver
x and of a variable term,
a [MJ/P.U.], proportional to
x [P.U.]:
The correlation is considered statistically representative if
p-value < 0.05 and
R > Rcrit = f (N, α) and
R2 > 0.5.
When the model did not show a significant linear relationship between energy consumption and the energy driver, the mere EnPIr calculated for every NACE group and its standard deviation are used to describe the sector.
In Step 4, EnPI is calculated as the ratio of energy used for producing a unit of product (P.U.). Hence, EnPI
m is calculated by dividing both sides of the production function and is represented by a hyperbolic function (2):
where a and b, respectively, represent the slope and the intercept of the linear regression line. Further methodological details can be found in Bruni et al. [
33].
The characterization of energy consumption at the company level is also complemented by a qualitative and quantitative analysis of EPIAs, which are also covered by the Audit102 database. The database includes, for every audited site, information on both implemented and planned EPIAs (It is worth mentioning that each Energy Audit should include information on implemented and identified EPIA, but this is not always the case. Moreover, the information characterizing EPIAs could be incomplete, for example, in terms of CAPEX or achieved/potential energy savings. An ad hoc investigation of Energy Audit could allow the integration of the information in the database).
The information basis has been organized in seventeen intervention areas, as follows: (1) compressed air systems; (2) industrial hoods and ventilation; (3) thermal power plant/heat recovery; (4) HVAC; (5) cold production units; (6) monitoring, training, energy management system (EMS); (7) lighting; (8) electric systems; (9) production lines and machines; (10) engines, inverters, and other electrical installations; (11) power factor correction; (12) building envelope; (13) distribution networks; (14) transport; (15) not elsewhere classified; (16) cogeneration/Trigeneration; and (17) production from renewable sources. Each area, according to the sector, could be referred to different process phases, namely Main Activities, Auxiliary Services and General Services and, in each of them, EPIAs can be technical, technical/managerial and managerial.
EPIAs are described by identifying the intervention category, which can be technical (e.g., most of the interventions in “Cogeneration/Trigeneration”, “Thermal power plant/Heat recovery” or “Building envelope”) or managerial, such as “Monitoring, training, Energy Management System”. Technical–managerial interventions also exist, which are common, for example, in the areas of “Compressed air systems” or “HVAC” but can also be found in “Thermal power plant/Heat recovery” (Further details referring to the pharmaceutical sector can be found in
Section 4 and in
Section 5).
Figures on different types of energy savings are provided, namely savings of electricity, thermal energy, transport fuels, etc.; they regard achieved savings for implemented EPIAs and potential savings for planned ones. CAPEX is also covered by the database, and, in the case of planned EPIAs, further economic indicators are provided: simple payback time (PBT), net present value (NPV) and actualization rate (AR). Based on the database information, total energy savings, measured in toe, can be computed and sorted either as final or as primary energy savings, with the latter referring to the technical intervention areas “Cogeneration and trigeneration” and “Production from renewable energy sources”. Indeed, in these two areas, auto-production implies that electrical or thermal energy is not withdrawn from the national grid.
Using the information on CAPEX and energy savings, it is possible to compute cost-effectiveness (the cost of saving one toe of final or primary energy) for both implemented and planned EPIAs. The NACE code for the company and for every site can be used to develop sector-specific analyses, which, when combined with energy consumption comparative analyses and benchmarking described above, could provide useful inputs for policymaking.
3. Energy Performance and EnPIs Determination
The database was composed of energy audits from 99 pharmaceutical sites: 84 of them are manufacturing sites, while the other ones are storage sites, R&D plants or registered offices. The samples deriving from the energy audit obligation were supplemented by a survey provided by Farmindustria to its associate companies: the survey was filled in by 27 sites, some of which were already part of the energy audit sample. The survey provided additional information about the technical plants present in the sites and the usage of water for manufacturing purposes.
The data included in the audits are taken from energy bills and energy monitoring: monitoring usually refers to electricity and natural gas: cold energy and heat produced inside the plant are usually not monitored, which, as commented later in this section and in
Section 5, is both a limitation of this study and plant management. However, from the collected data, it was possible to identify the typical energy consumption layout in the pharmaceutical sites and the main energy drivers. In the following paragraphs, first, the typical energy consumption layout is identified, then the ENEA methodology for the EnPI determination is shown, with the sample selection and the EnPI
r and EnPI
m calculation.
3.1. Final Energy Consumption
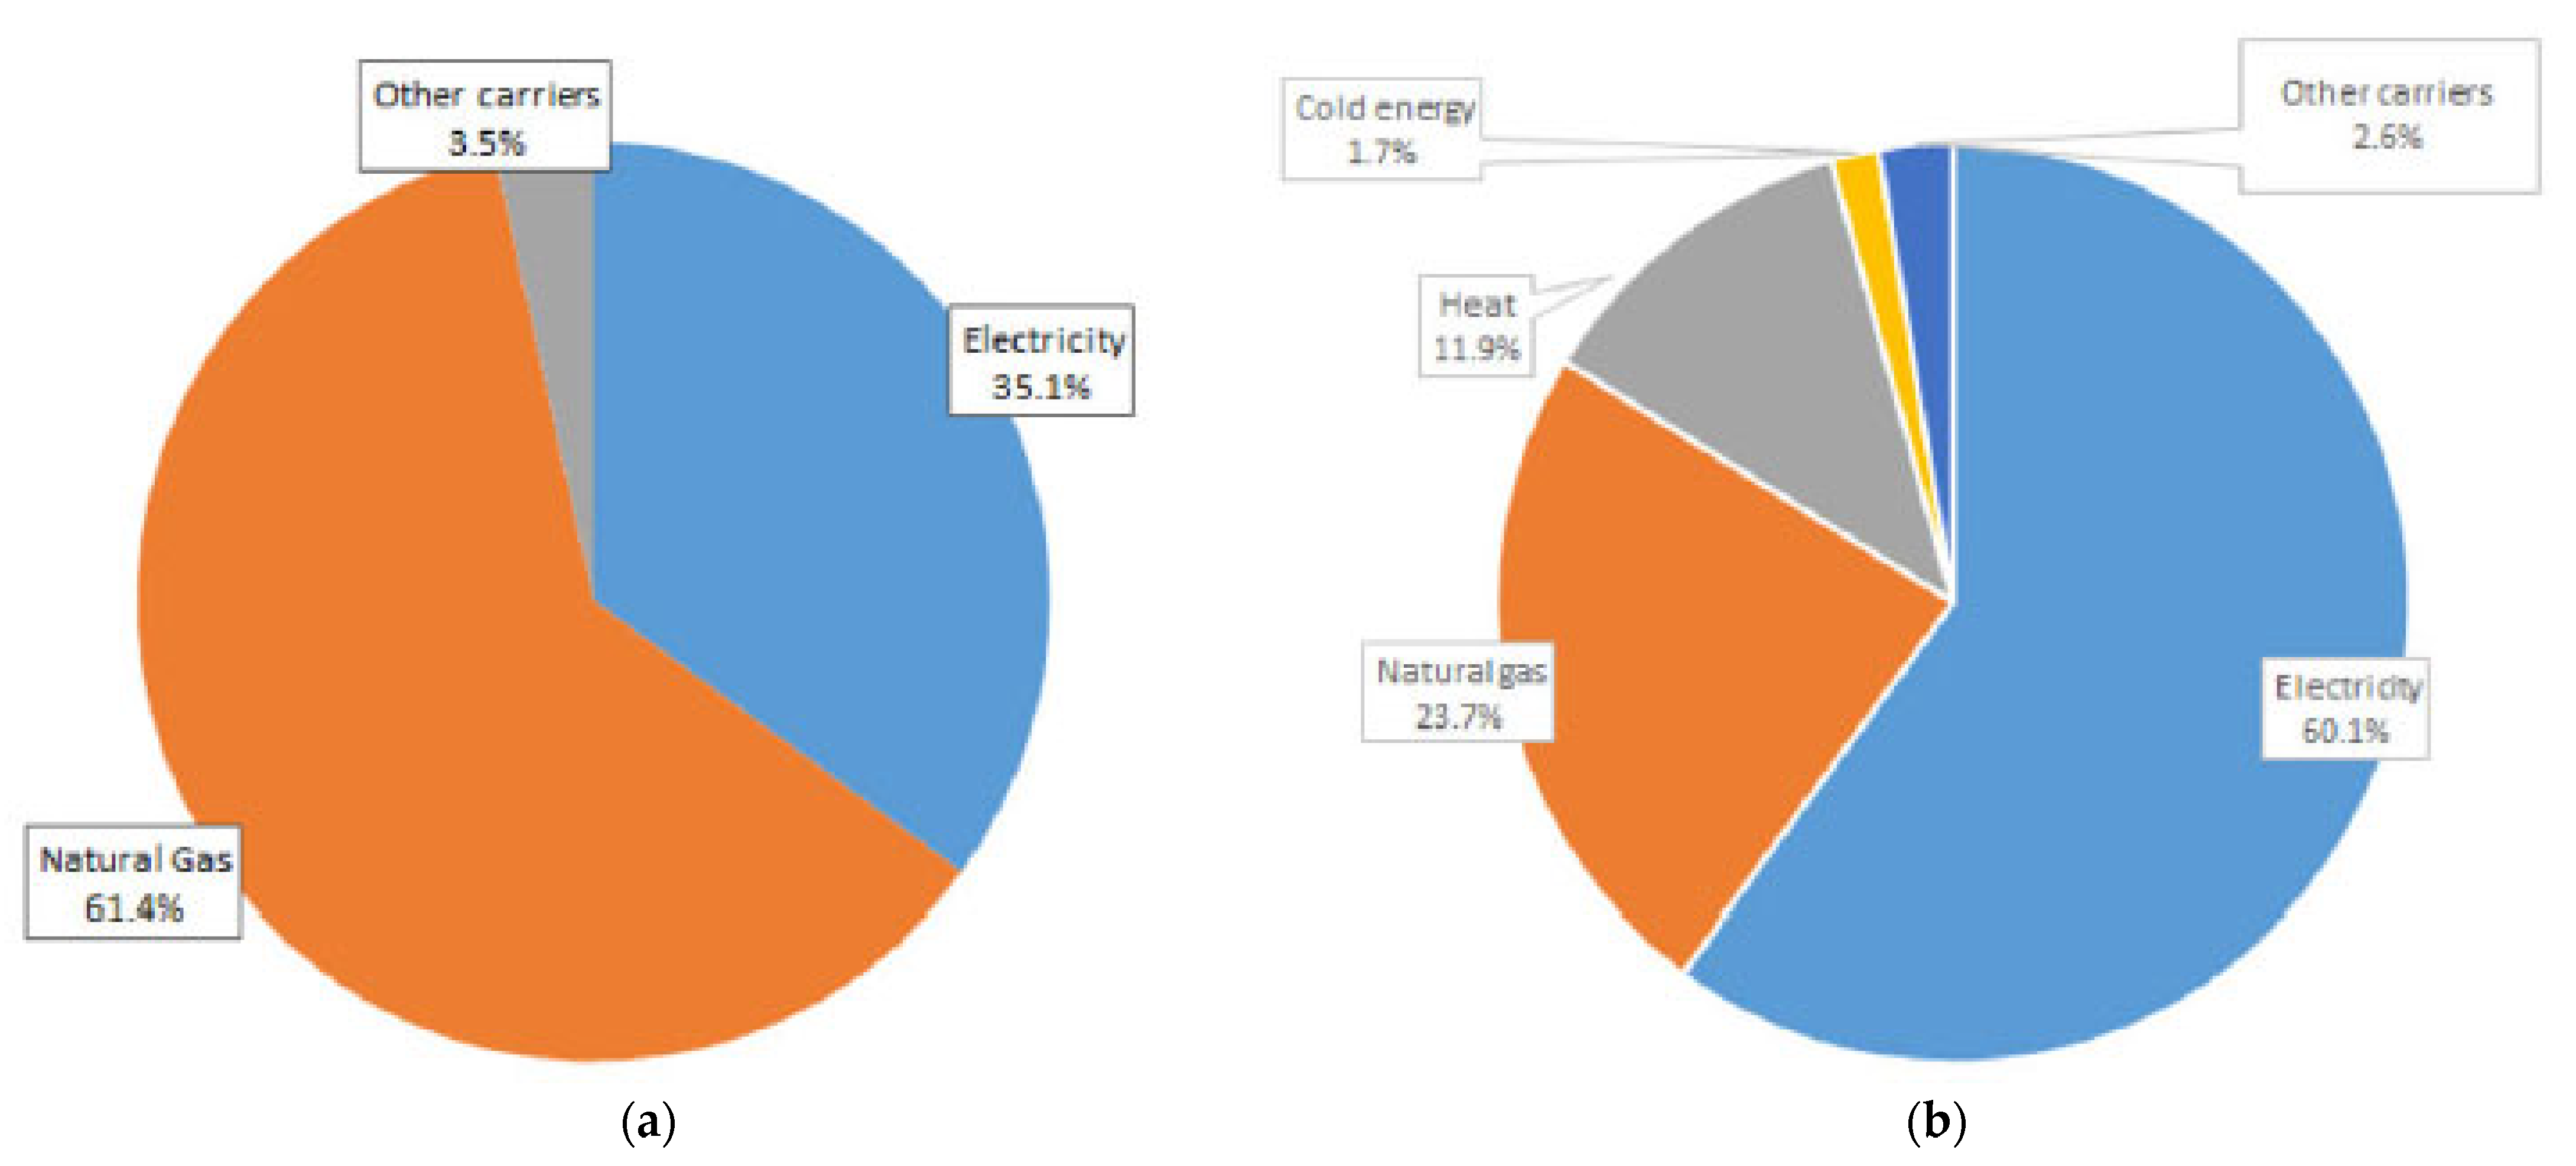
Figure 2 shows energy purchase and final energy use. Primary energy is purchased mainly via natural gas (61% of the total), followed by electricity (35%). The rest is purchased in terms of other vectors. The final energy consumption, instead, is divided into the following carriers: electricity (60%), natural gas (24%) and heat (12%). The different distribution in terms of the vectors between primary and final energy is due to internal energy conversion: around 44% of the purchased natural gas is used in combined heat and power plants.
Figure 3 shows the distribution of the final energy consumption with respect to the three functional areas: a great part of the consumed energy is needed for the auxiliary services (70.7%), while only 19.8% of the overall energy consumption is ascribable to the main activities and less than 10% to the general services of the plant. It is worth here to underline that, for the pharmaceutical sector and according to the definition reported in the sectoral energy audit guideline written by ENEA and Farmindustria [
32], the functional areas include the following activities:
Main activities are specifically the production lines, the storage areas and the R&D and quality control laboratories.
Auxiliary services are heat and cold energy production for both air conditioning and production processes, AHUs ad air conditioning of the production areas, air compression systems, pump systems, water purification and air extraction systems.
General services include internal and external space lighting, non-production areas’ air conditioning, office power supply and all the other site general facilities (dining hall, dressing rooms, etc.).
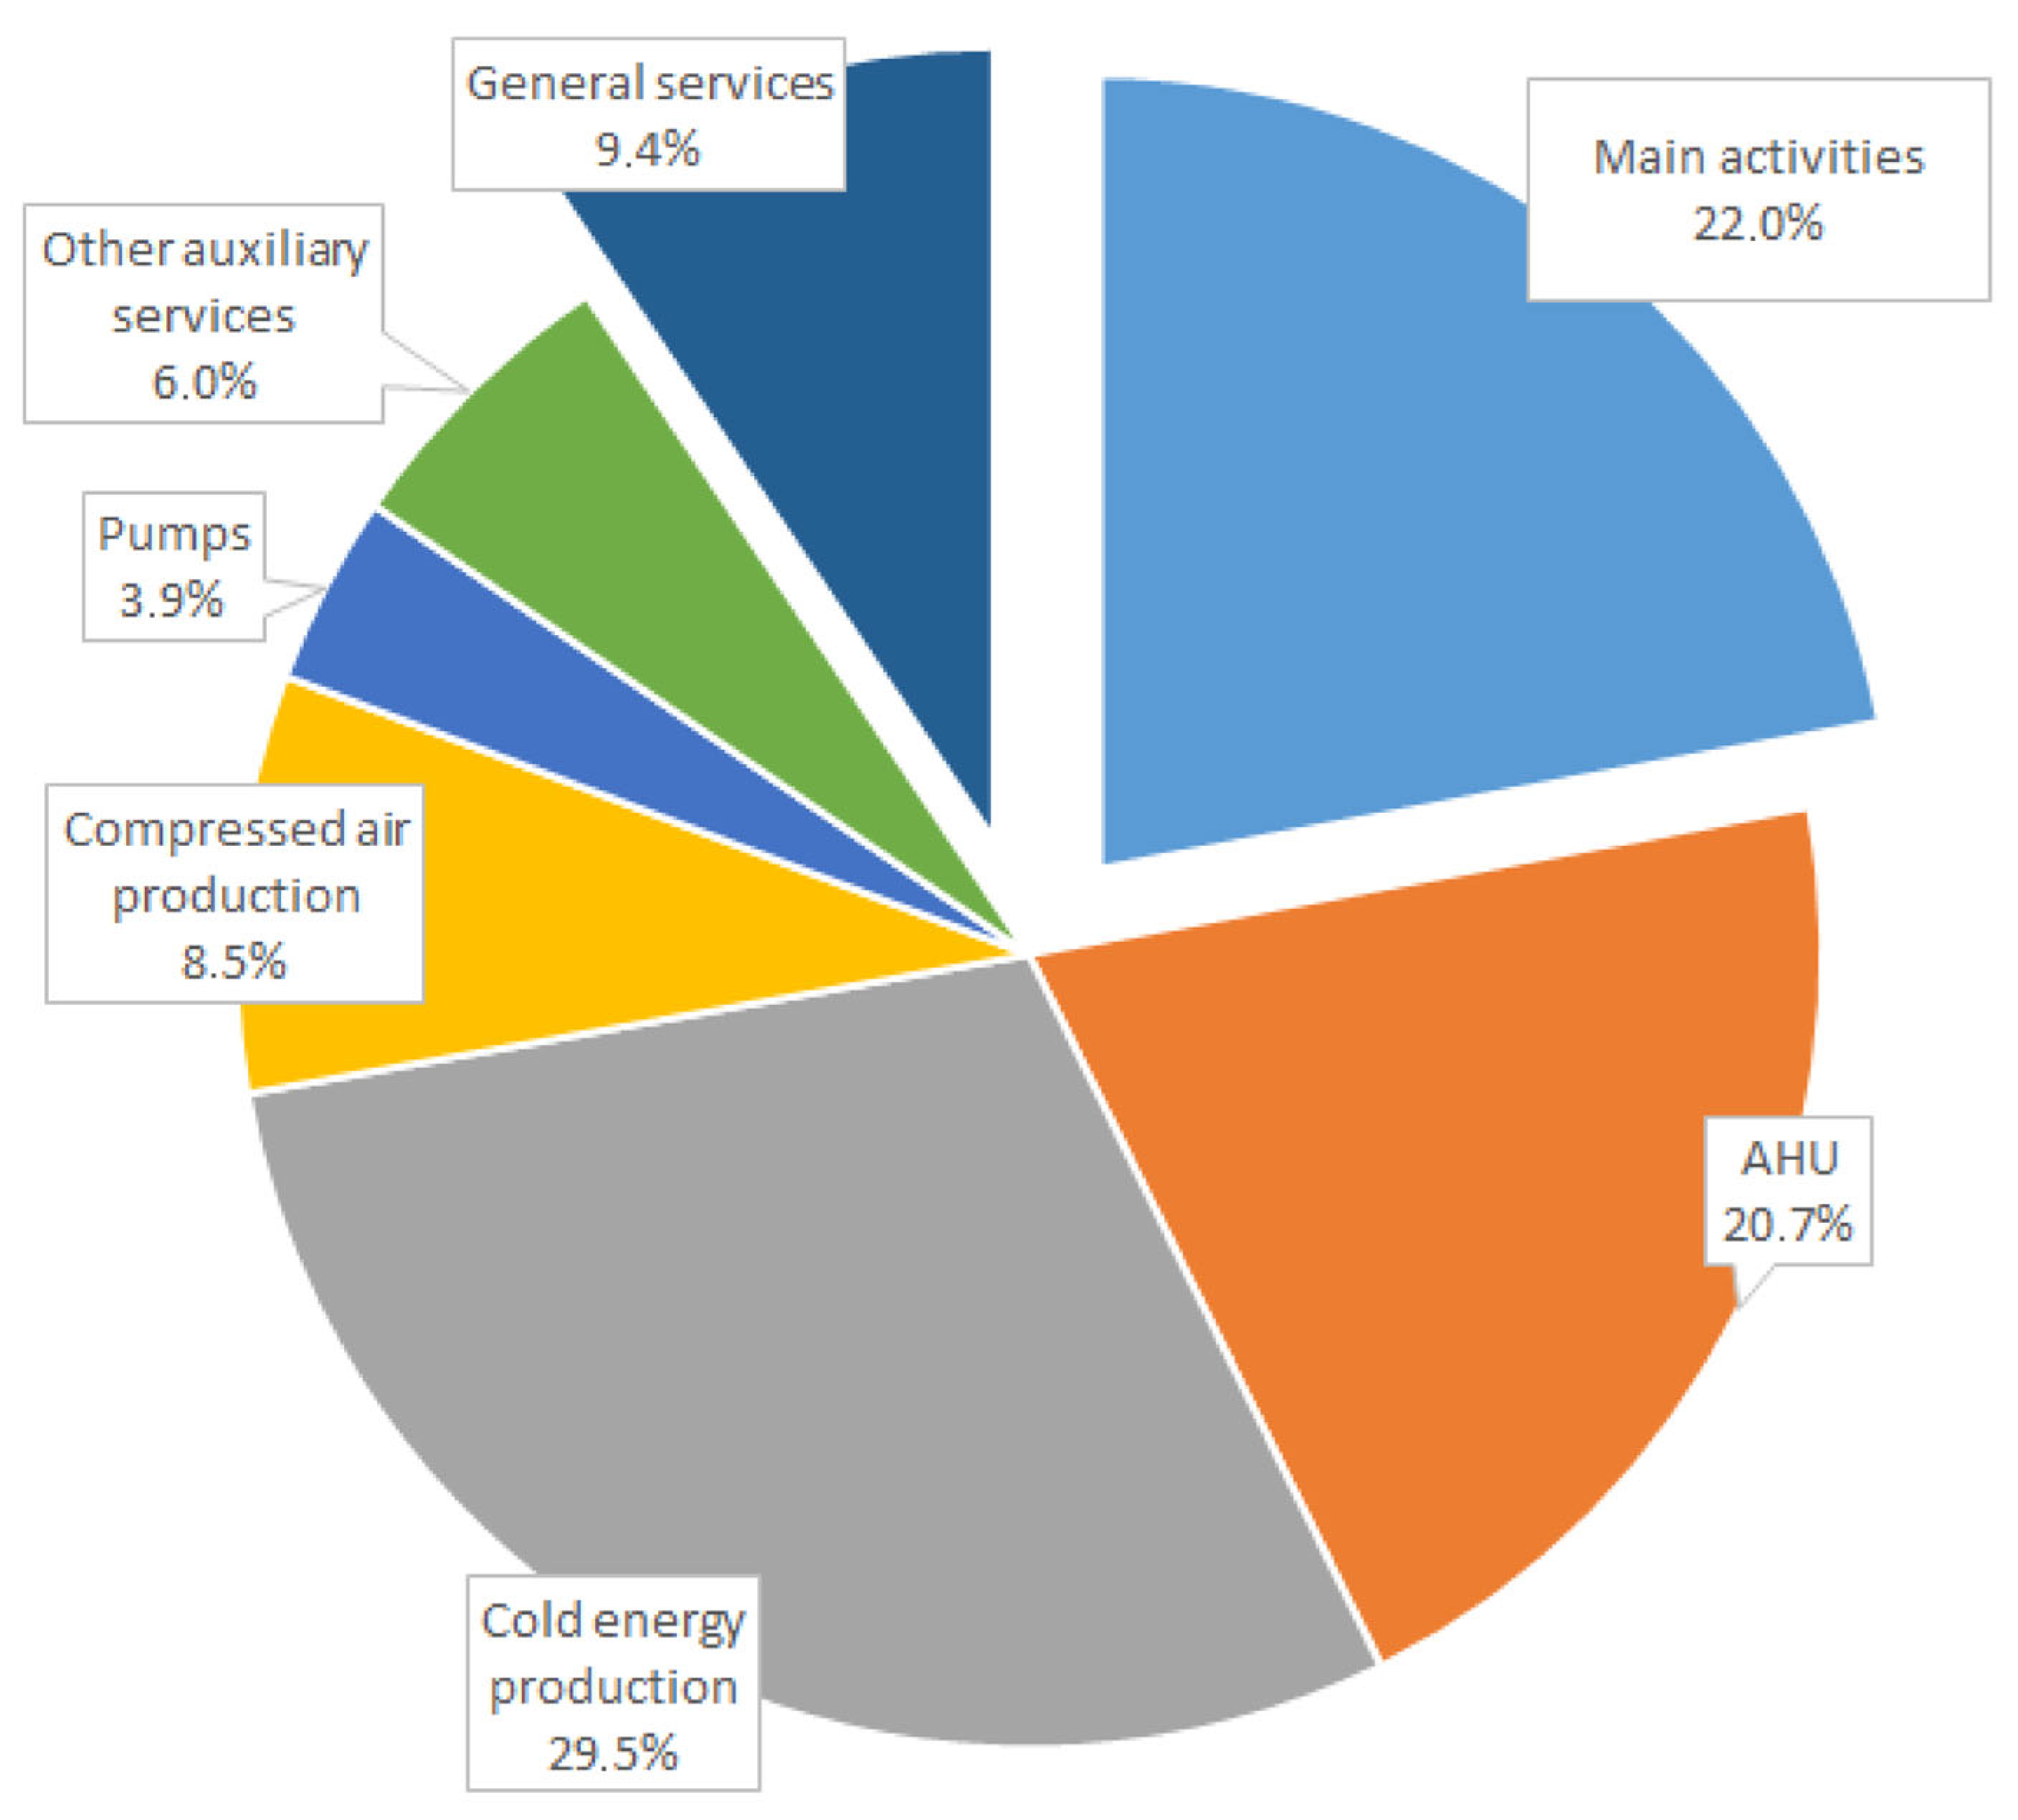
Looking more specifically at the electricity consumption, as shown in
Figure 4, only 18.2% refers to the production lines, compared to 29.4% deriving from the cold production units (chillers for room cooling and for production process) and 20.6% from the air production and treatment units. The thermal power plant, on the other hand, absorbs most of the heat consumption (66%), with only 14% used directly by the production lines.
Starting from the data reported in
Figure 2 and
Figure 4, it is possible to calculate that around 50% of the final energy consumption is used as heat or cold energy.
Figure 5 shows that 18% of the final energy is cold energy produced from refrigerators powered with electricity, 20% is heat coming from boilers powered with natural gas and 12% is heat produced in CHP plants. Heat and cold energy, though, are not monitored at their actual uses, which makes it difficult to ascertain if they are used efficiently and, thus to assess if specific EPIAs are needed.
Since a great part of the energy is used in the auxiliary services, especially those devoted to maintaining strict environmental conditions within the production areas, in this study, we investigated the relationship between energy consumption and both the production [kg] and the size of the production areas [m2]. It is worth mentioning that regarding the size, probably the most representative parameter is the volume of the rooms [m3]; however, in this analysis, the surface area is considered to be the data available from the energy audits mainly reported for these data and not the volumes.
3.2. Sectoral First Level EnPI Calculation
The information included in the energy audits was used to select the statistical sample used for the EnPI determination. Sites whose products and processes were not declared were excluded from the sample, as much as those sites whose values of the energy drivers were at the higher or lower end of the field of existence of the drivers. The chosen energy drivers were production [kg] and the surface of the production areas [m2].
In terms of production, the sites generally produce drugs in more than a single form, varying from solid to semi-solid to liquid. Around half of the sites produce drugs in different forms, while only 10 produce exclusively in a solid form, and 20, produce the liquid form. In the energy audits, only 37 manufacturing sites provided data about the number of drugs produced: the maxim declared production is 10,000 t/y, but most of the sites, 31 of them, produce less than 2500 t/y of drugs. To identify a homogeneous sample, only sites producing less than 2500 t/y of drugs and sites whose products and processes were declared in the energy audit were used in the statistical analysis. This reduced the sample to 24 sites, whose product yields are between 20,000 kg and 2,500,000 kg of drugs produced in a year.
The size of the manufacturing plants is also important in terms of energy consumption since, as shown in the following paragraphs, a significant amount of energy is used to ensure the environmental conditions required in the production areas. For this reason, the surface area of the production departments of the plants was collected from the audits and the surveys: a total of 36 sites provided data relating to the productive surface area, with a maximum of 57,000 m2; however, 32 out of the 36 sites measure less than 15,000 m2 of productive surface area. Again, only sites that declared production and processes with productive surface areas of less than 15,000 m2 were used in the statistical analysis, the larger sites being considered outliers. The sample referred to the surface area included 30 sites.
Finally, it is worth mentioning that the overall sample was not divided into subsamples based on different processes or the type of drugs produced: the pharmaceutical sites manufacture different types of drugs and generally include several processes operated in parallel but using the same auxiliary services (e.g., cold energy production for AHUs). It was impossible to differentiate between the sites based on the manufacturing processes, leading to high variability in the EnPI values, as shown in the following paragraphs.
Table 2 reports the values of the EnPI
r calculated with respect to mass production, including the standard deviation and the reliability assigned to each EnPI
r value. Commenting on the reported results, the value of the EnPIr decreases with higher drug production: sites with large production can have, as a mean, less than one-third of the specific final energy consumption with respect to sites whose annual production is in the low range. However, it is worth mentioning that the value of the mean EnPI
r has greater reliability for low values of mass production, and the results can be ascribed to the high variation in the processes that large sites may include.
Table 3 shows the values of the EnPIr calculated with respect to the surface of the production areas. The results can be commented on as follows. Increased size leads to a general reduction in the EnPIr, which can be halved, passing from a low- to medium-sized industrial site: this is a simple scale effect. However, the sample showed increased EnPIr for sites with high surface areas: this result is obtained since, in that particular range, there are plants that consume more energy due to their production processes. By contrast, this does not happen for low- and medium-size sites where generic drugs are manufactured. This specific case shows how different processes affect the evaluation of EnPIs: when in a given sector, it is not possible to sample sites with similar processes, the EnPI value has a large variability and does not necessarily follow scale effect rules.
This paragraph shows the results of the linear correlation between the total, electric and thermal energy consumption with respect to the two chosen energy drivers.
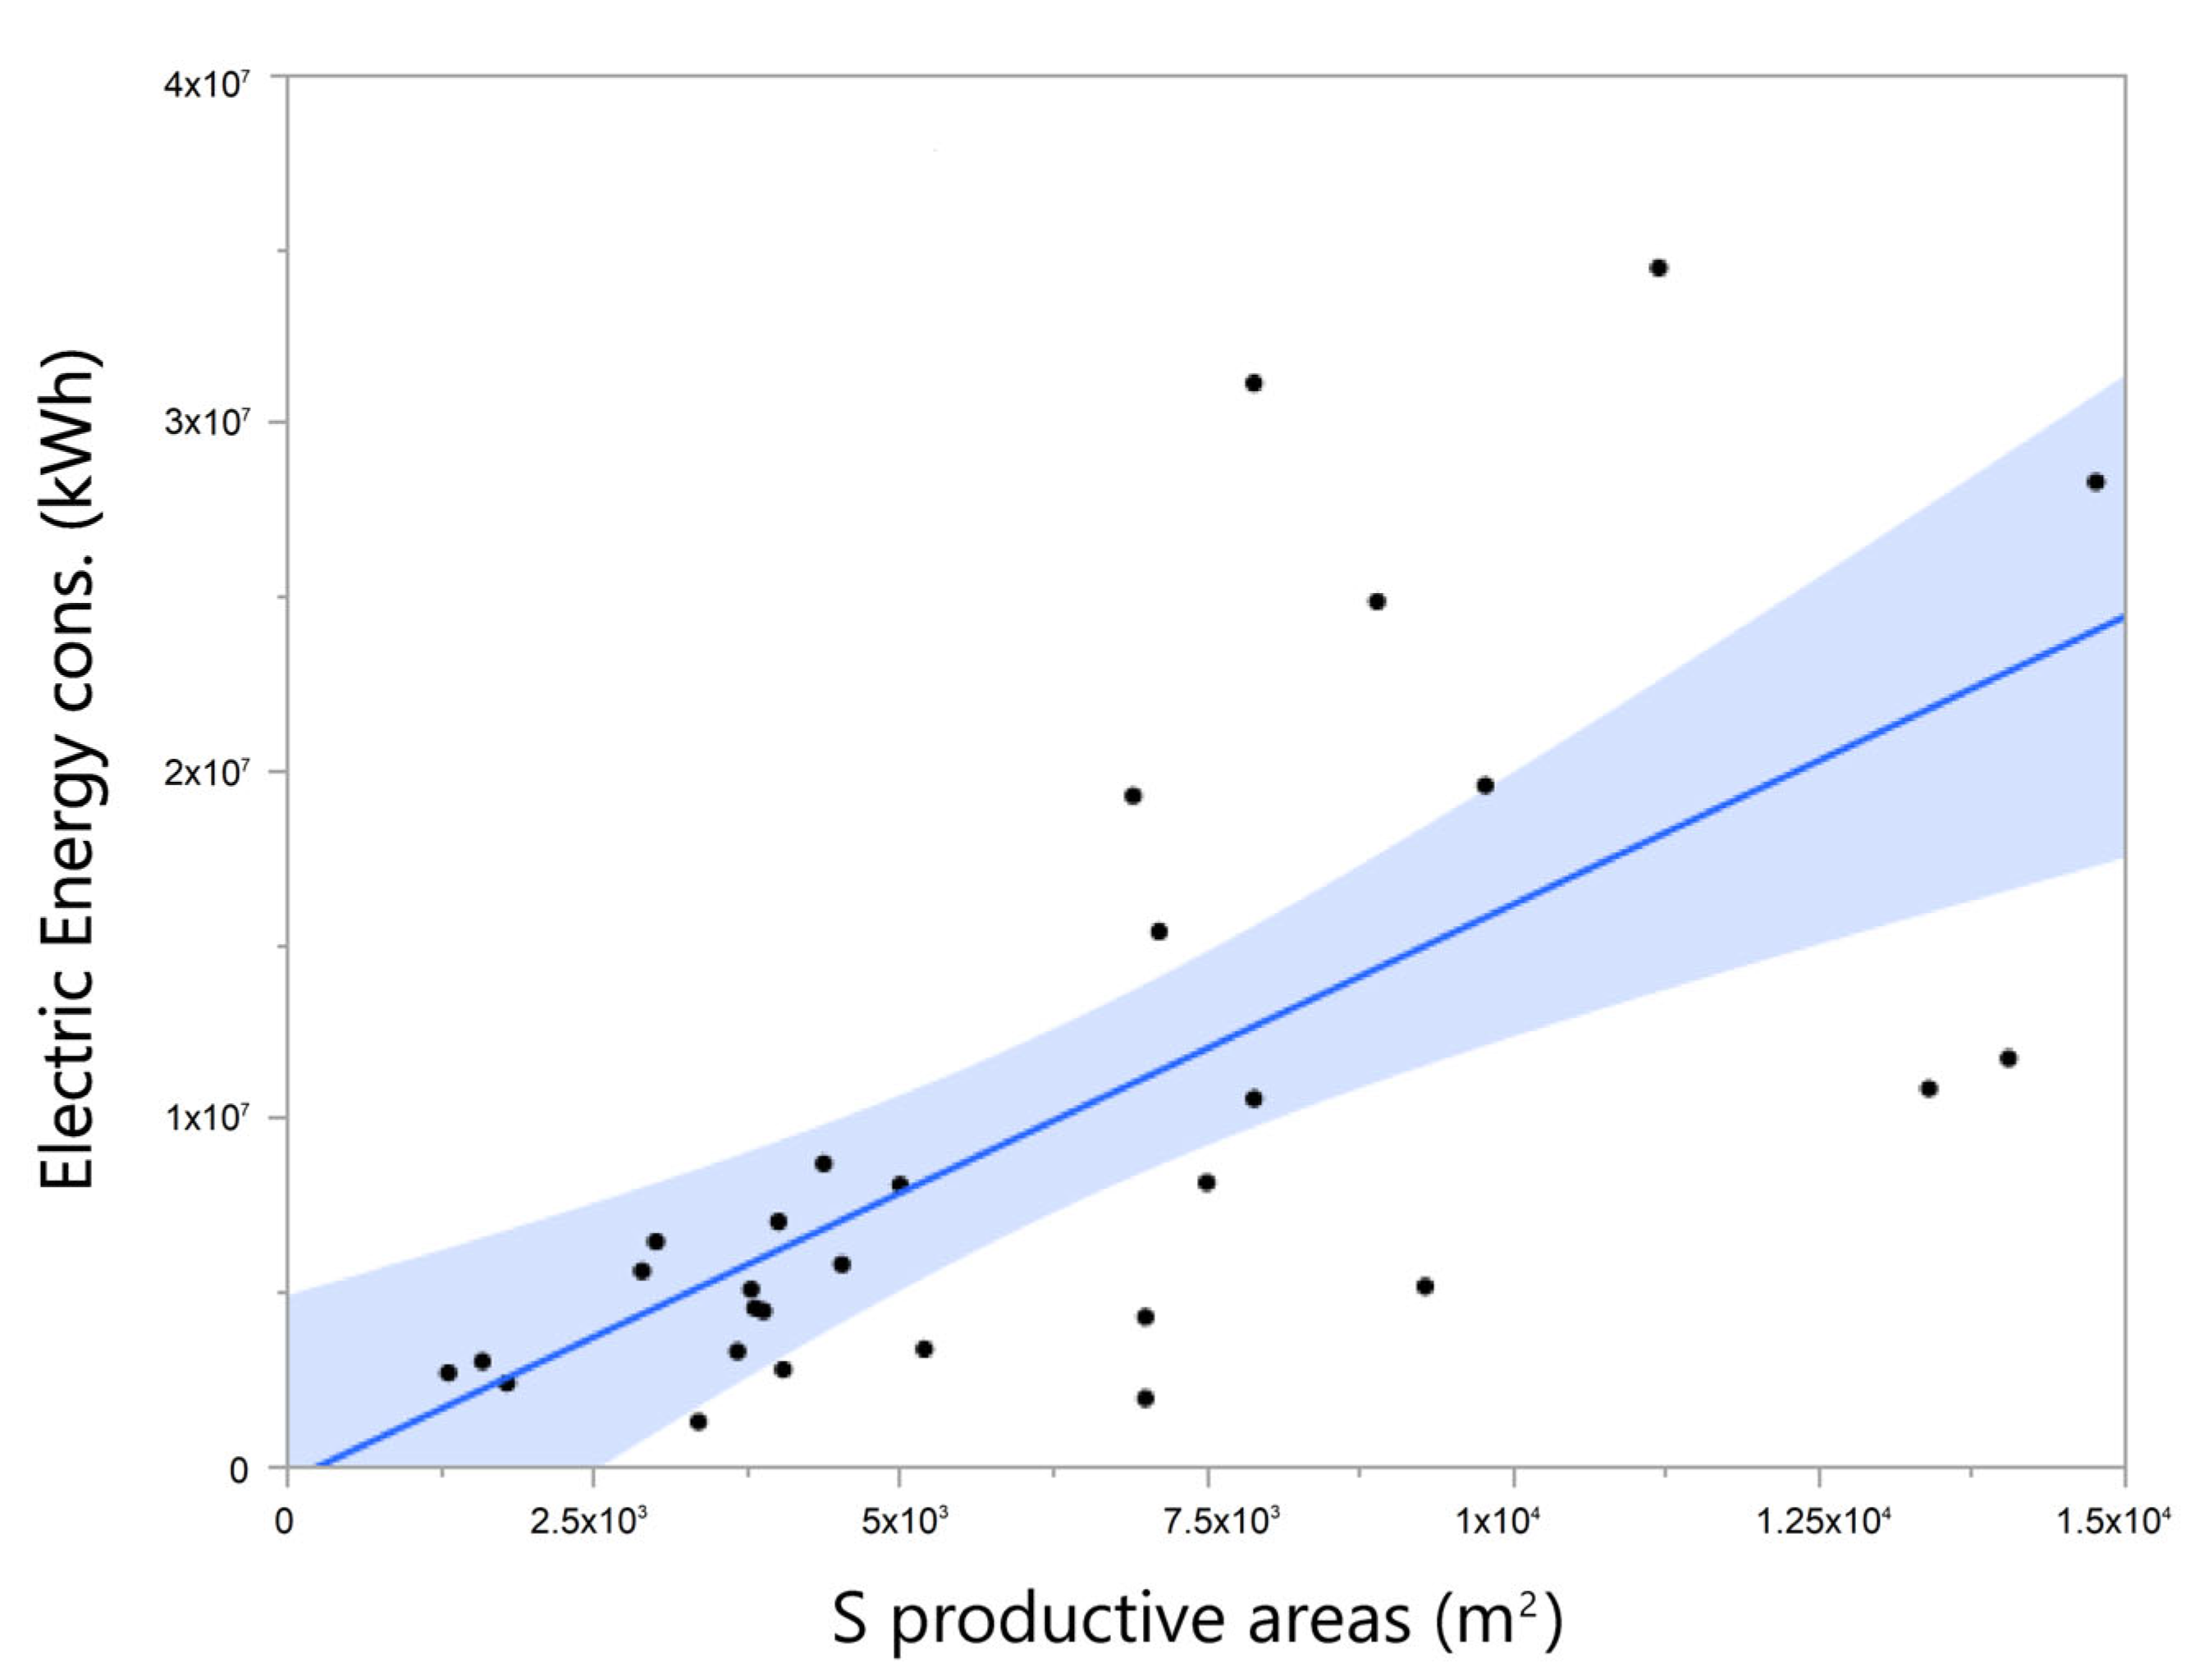
Table 4 resumes the results of the statistical parameters used to identify the strength and representativeness of the correlations, while
Figure 6 and
Figure 7 show the graphs of the total energy consumption [MJ] vs. mass production [kg] and electric energy consumption [kWh] vs. productive surface area [m
2], respectively.
Of the two energy drivers, mass production clearly shows no correlation with energy consumption: values of R2 are lower than 0.5, confirming that, due to the great amount of energy used in the auxiliary services, an EnPI referring to mass production would not be representative of the behavior of the sector.
The correlation between the surface of the production areas and the energy consumption is stronger, yet not enough to search for an EnPIm that would represent the behavior of the EnPI based on the variation of the energy driver. This result is somehow expected due to the significant amount of energy used in the HVAC field.
The results of the first-level EnPIs allow us to state that an EnPI devoted to measuring energy performance in pharmaceutical plants should use the size of the plant rather than mass production as an energy driver. In this sense, using the size of productive areas is reasonable since a large amount of the consumed energy is needed to ensure the environmental conditions required by the GMP standards.
3.3. Primary Energy EnPI
Due to the results obtained in the Final Energy EnPI calculation, the surface areas were used to compute an EnPI that relates to the primary energy consumption (P_EnPI). The available data allowed the calculation of the specific primary energy consumption in terms of toe/m
2:
Table 5 shows the statistical parameters of the P_EnPI, while
Figure 8 shows the distribution of such values in terms of frequency and cumulative frequency. In the distribution picture, each group is identified for having the P_EnPI lower than the value reported in the picture, apart from the last class, which identifies the frequency of plants having P_EnPI higher than 1 toe/m
2.
3.4. Second Level EnPIs
The study also tried to investigate the correlation between energy consumption at the process level and their energy drivers. Particularly, due to the great amount of energy used in the HVAC systems, the study focused on the correlation between the energy used in the AHUs and the size of the productive areas. Only the electrical energy used in HVAC systems was considered since the audits did not report on the amount of thermal energy used for HVAC purposes.
Figure 9 shows the correlation between the electrical energy used in the AHUs and the surface of the production areas assessed over a sample of 28 sites. The results reported in
Table 6 indicate that the correlation is discrete (R
2 = 0.43), and it has the same strength as the site energy consumption vs. surface areas correlation, with the same high representativeness (
p-value < 0.0001). Here, again, no EnPI
m could be calculated.
The above-mentioned results show that the relationship between electric energy consumption and the size of the rooms is robust.
A similar result is obtained while trying to relate the cold energy for HVAC uses [kWh] and the volume [m
3] of the productive areas; in this case, the data came from a single site: the areas are grouped based on their Good Manufacturing Process (GMP) classification, whereas A and B areas are production rooms with high purity air requirements, while C and D allow have lower quality air requirements; CNC defines Clean Not Classified areas while NC defines Not Classified areas. The data in
Table 7 show that the cold energy for HVAC usage is not necessarily related to the size of the areas. The correlation is relatively strong for the A and B and C areas, wherein it was possible to calculate the EnPI
m equation. However, these data are related to a small number of rooms for each group (5 for A and B, 5 for C and 6 for D areas), thus showing that this result would need to be confirmed with a higher sample in order to have a higher
p-value.
4. Statistical Analysis of EPIAs Data
In this section, the results of the methodological approach adopted in the analysis of the EPIAs of NACE sector C21.2.0—Manufacture of pharmaceutical preparations are presented. The statistical approach used to analyze EPIAs proposed by the energy audits of obligated parties has already been used for other branches of Italian productive sectors, namely glass [
36] and foundries [
37].
Table 8 provides a non-exhaustive list of EPIA examples in different production phases, intervention areas and typologies observed in the Audit102 database for the pharmaceutical sector. Clearly, different intervention areas and typologies imply differences in saving values and in their composition by the energy carrier; the characteristics of production sites also have a relevant impact. Similarly, cost-effectiveness, namely the cost of saving a toe of energy and PBT, will likely differ across different areas and typologies.
Interventions in the area of “Monitoring, training, EMS” have relatively good values for both cost-effectiveness and PBT and, more importantly, they allow for the better planning of interventions in other areas. For example, after having adopted an intervention of introducing or improving the monitoring system, technical solutions for improving energy efficiency, such as those on compressed air systems or production lines, could be better identified. In general, cost-effectiveness and PBT also have interesting values for technical/managerial and managerial interventions, not only for technical ones.
Finally, the distribution of EPIAs among different areas and typologies clearly should be consistent with the sectorial structure of energy consumption; for example, given that in the NACE sector C21.2.0, more than 60% of the energy is consumed in the auxiliary services, many EPIAs are likely to be referred to that area. For example, looking at electricity consumption, less than 20% refers to the production lines compared to high values for auxiliary services, namely around 29% are derived from the cold production units and 21% from the air production and treatment units; consistently, energy savings of electricity are likely to be referred to these two areas.
In the NACE sector C21.2.0, 233, the implemented EPIAs were listed in the analyzed EAs. The achieved energy savings are equal to 3750 toe/year, and thermal power plant/heat recovery systems determine the largest energy savings (42% of the total), followed by cold production units (21% of the total). The final energy saving is almost equally distributed between savings of electricity (50%) and thermal energy (48%), with other savings accounting for a negligible share (2%). Cogeneration/Trigeneration covers almost the total savings of primary energy, equal to 4212 toe/year. Overall, it is the first area in terms of total investment, with 32% of the total. Both results show that Cogeneration/Trigeneration is a key intervention area in the sector. A cost-effectiveness indicator was calculated for each intervention, measured as Euro invested per toe of energy saved. Production lines and machines, Monitoring, training, EMS, and Electric systems show advantageous values of the indicator, around 2300 Euro/toe on average.
A total of 450 suggested measures with quantitative information were identified. Potential savings of final energy are 11,270 toe/year with HVAC and cold production units, each with 20% of the total, followed by thermal power plant/Heat recovery (17%). In terms of composition by energy carrier, the savings of electricity cover the highest share (51%), followed by those of thermal energy (38%), transport fuels (7%) and other (4%). Investment is most significant for the Cogeneration/Trigeneration area, which covers 63% of the total, confirming the relevance of this area in the examined sector. Production from renewable sources is in the second position, with 8% of the total. The savings of primary energy are 65,394 toe/year, and, as already observed for implemented interventions, most of them (95%) are associated with Cogeneration/Trigeneration. Similarly, to the implemented EPIAs, production lines and machines and monitoring training, EMSs areas are in the best positions according to the cost-effectiveness indicator together with Industrial hoods and ventilation. For all these areas, the cost-effectiveness is between 3000 and 3500 Euro/toe.
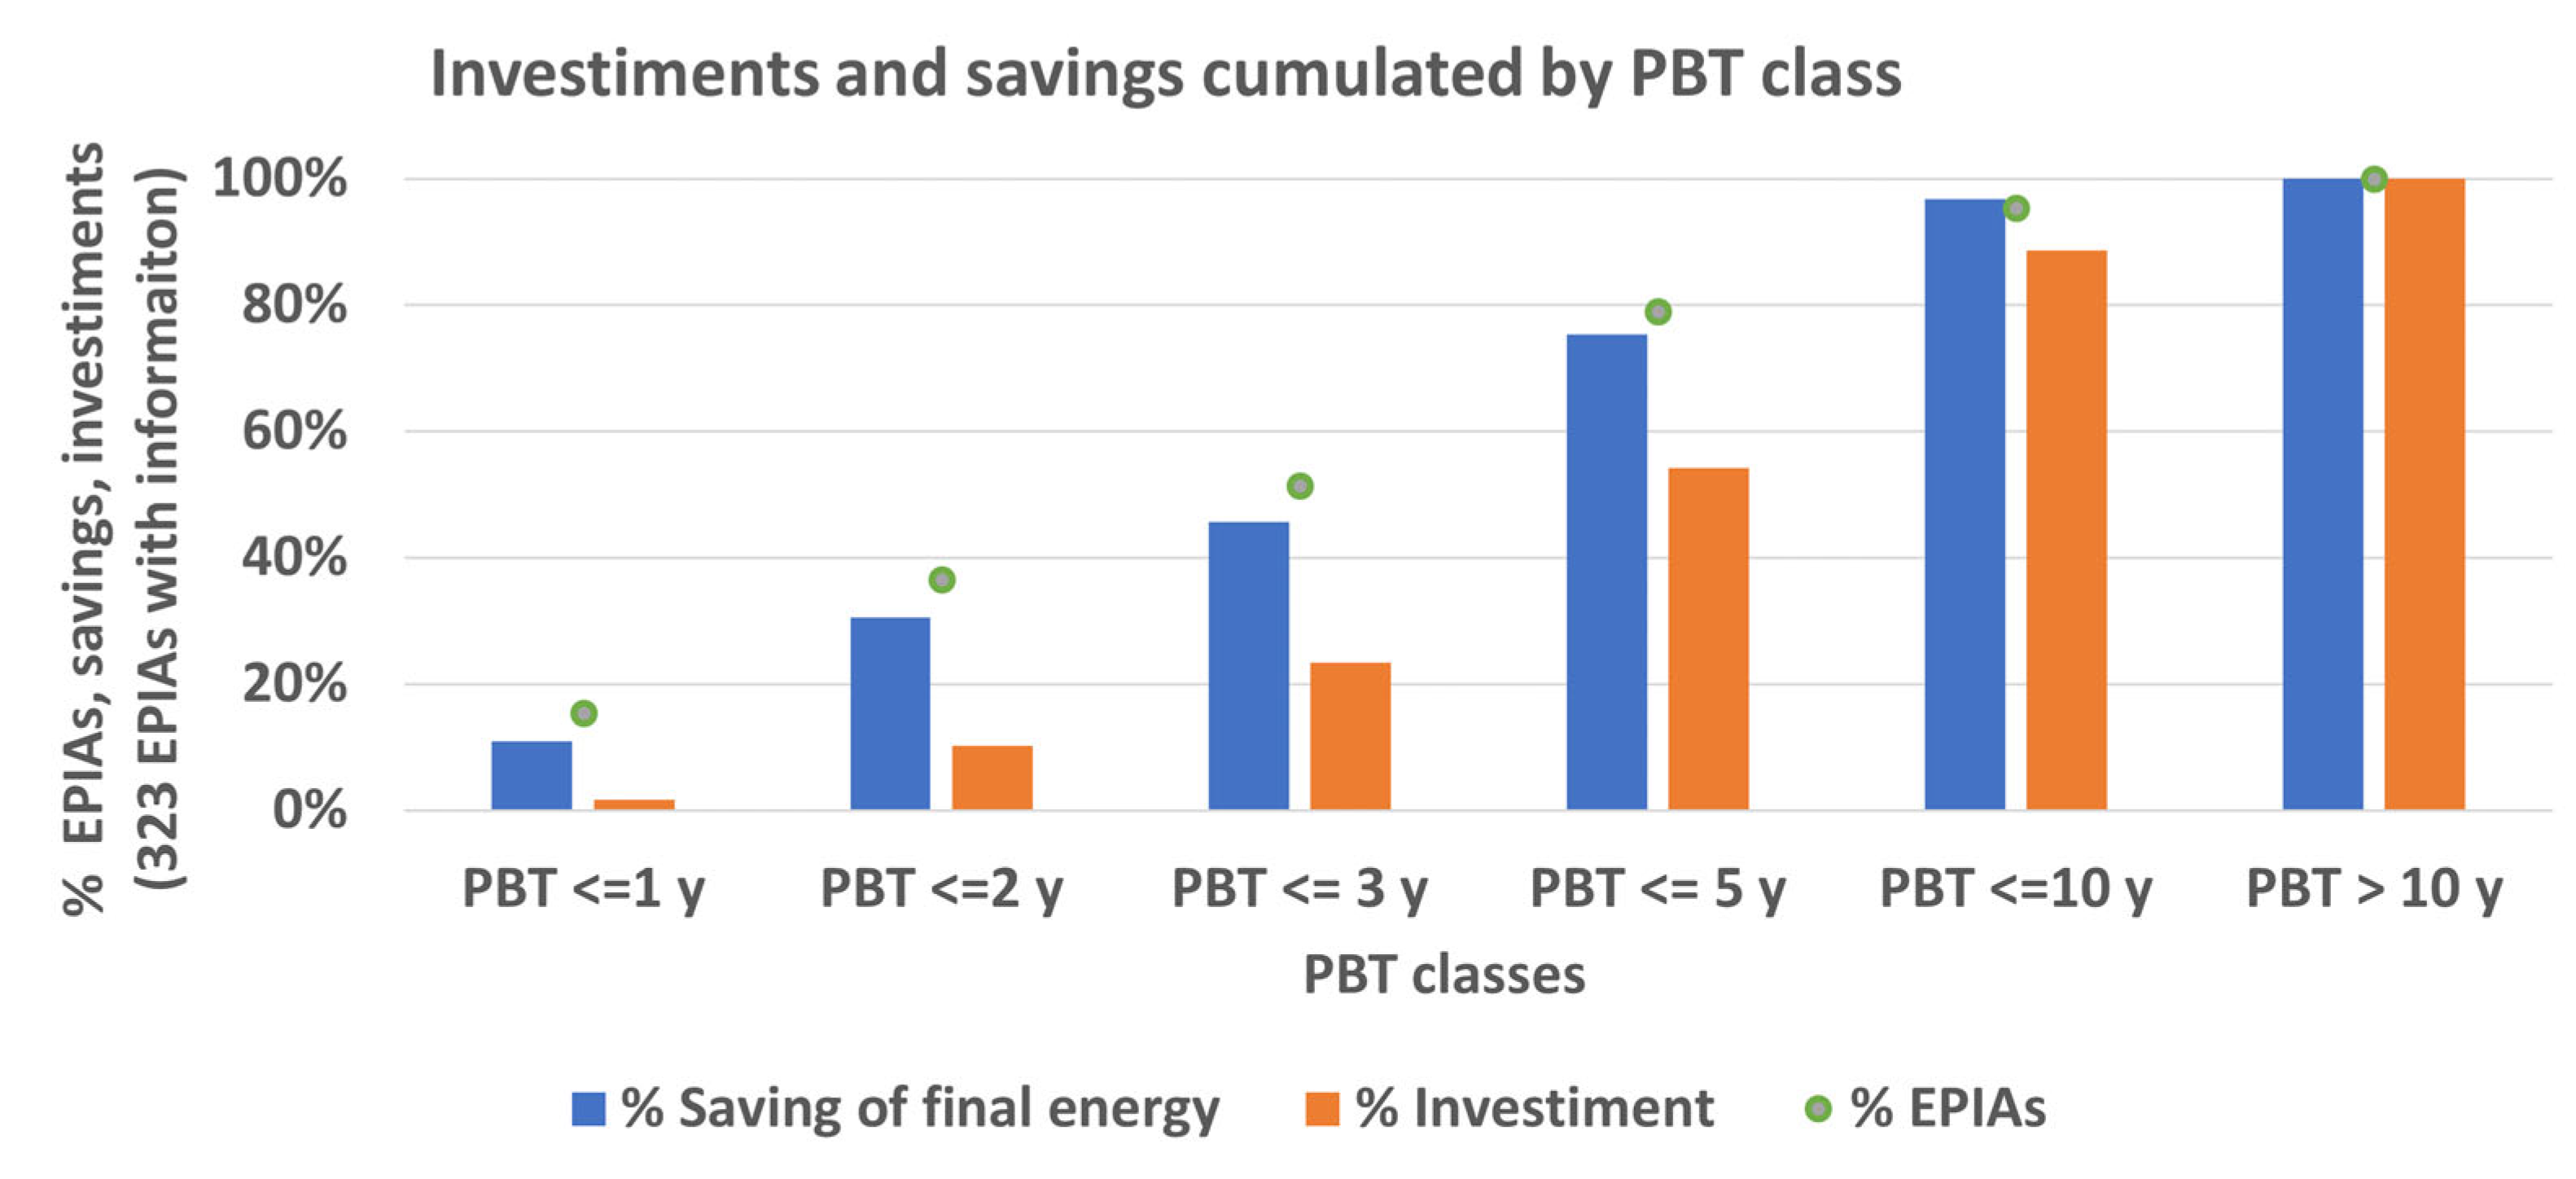
Suggested measures can also be distinguished by the PBT class. In this case, 323 EPIAs report quantitative information (88% of the total): measures with PBT between 3 and 5 years represent 28% of the total and 30% of total annual potential savings (
Figure 10). Almost half of the potential savings (around 5 ktoe/year) can be achieved by adopting measures with PBT lower than 3 years and by mobilizing 46% of the total investment, which were associated with the suggested measures (around 8.7 million Euro). This highlights that relatively less expensive measures are associated with a high saving potential, and such a trend appears even more significant when considering that existing incentive mechanisms are not included in the PBT calculation.
After the overview of the sector in terms of the achieved and potential savings, a subsample of suggested EPIAs is defined for a more detailed analysis (122 observations). It includes measures with a PBT lower than four years and covers four intervention areas identified as relevant for the energy consumption profile of the examined sector or as strategic intervention areas. These are represented by HVAC, cold production units, thermal power plant/heat recovery and monitoring and training EMS. The sub-sample includes 139 proposed EPIAs, almost evenly distributed among the four areas: cold production units and thermal power plant/heat recovery have slightly higher shares (28–29%), whereas HVAC and Monitoring, training, and EMS, have lower ones (21–22%).
Figure 11 shows the distribution of EPIAs by cost-effectiveness indicator, highlighting that its values are lower than 2000 Euro/toe in more than half of the distribution: the indicator is lower than 1.000 Euro/toe for 28% of the total EPIAs, and it is included between 1000 and 2000 Euro/toe for 26%. EPIAs from all areas are included in these parts of the distribution, with the highest share for thermal power plant/heat recovery, followed by Monitoring, training, and EMS. The average cost-effectiveness is 2500 Euro/toe, and in only 7% of the distribution is the indicator higher than 6000 Euro/toe; in this part of the distribution, the prevailing area is HVAC.
The distribution of the cost-effectiveness indicator can also be examined relative to PBT:
Figure 12 shows an interesting saving potential (red zones), with a high number of EPIAs having good values both in terms of the cost-effectiveness indicator (lower than 2000) and PBT (less than 2 years).
Additionally, in this case, describing which intervention areas are more relevant in each zone could provide useful insights. In the rectangular section of the heatmap highlighted with (A), where the PBT is less than 1 year, and cost-effectiveness is lower than 2000 Euro/toe, two specific EPIAs cover the total number of interventions, except for one in the Monitoring, training, and EMS area. They are represented by the introduction of Variable Speed Drive (VSD) on water ring pumps, included in the cold production units’ area, and the introduction of toothed double-helical drive belts vs. trapezoidal, included in the HVAC area. The rectangle indicated with (B), where the PBT is between 1 and 2 years and the cost-effectiveness is lower than 2000 Euro/toe, includes mostly technical/managerial interventions in Thermal power plant/Heat recovery and HVAC areas. The rectangular section indicated with (C) covers a group of very profitable EPIAs, having a PBT between 1 and 2 years and a cost-effectiveness lower than 1000 Euro/toe. It includes mostly technical intervention in the HVAC area. It is interesting to note that one EPIA in the Monitoring, training, EMS area is included in both (B) and (C) areas, confirming that this intervention type also may be promising depending on its characteristics and the site in which it is implemented.
Table 9 provides an overview of the main sub-categories in the three technical intervention areas. For each sub-category, the information is made available in terms of the average savings of the toe of final energy, the average PBT and the average cost-effectiveness. The table shows a high range of average values. Indeed, average annual saving changes from a minimum of around 2 (HVAC-Belts) up to a maximum of 115 (Cold production units—Substitution of refrigerator unit) toe of final energy per year. The range of cost-effectiveness is 885–7400 Euro per toe of final energy, with Heat recovery from the Air-Handling Unit (AHU) and the Substitution of a boiler or Air-Handling Unit having, respectively, the best and worst values, both in the HVAC area. The PBT is never higher than 3 years, with most intervention sub-areas having a value in the range of 1.5–2.5.
In
Figure 13, each EPIA is represented in terms of the cost-effectiveness indicator (
y-axis) and savings/consumption ratio (
x-axis). Three clusters are observed, and they can be described as follows:
Red cluster: average saving/consumption ratio equal to 1.2%, an average cost-effectiveness equal to 5385 Euro/toe, medium density of EPIAs;
Blue cluster: average saving/consumption ratio equal to 0.8%, an average cost-effectiveness equal to 1497 Euro/toe, high density of EPIAs;
Green cluster: average saving/consumption ratio equal to 8.1%, an average cost-effectiveness equal to 1242 Euro/toe, low density of EPIAs.
In terms of EPIA composition, the blue cluster (good cost-effectiveness, relatively low saving/consumption ratio) is characterized by a greater share of Monitoring, training, EMS higher than the other two clusters. In the red cluster, having a better saving/consumption ratio but a relatively worst cost-effectiveness, more than half of the interventions are in the Cold production unit area and one-third in HVAC. The green cluster, which is the best one for both examined indicators, is less populated, and almost all interventions except one are in the Thermal power plant/Heat recovery area.
Figure 14 includes a matrix showing EPIAs in each area and intervention type, namely Managerial, Technical and Technical/Managerial. The
y-axis refers to cost-effectiveness, while the
x-axis refers to the saving/consumption ratio. Such information completes the overview previously provided by the clusters: indeed, it allows the identification of EPIAs, with the best values for both cost-effectiveness and saving/consumption ratio. Thermal power plant/Heat recovery, in the Technical intervention typology, seems to provide good solutions, with most EPIAs having interesting values of both cost-effectiveness and saving indicators. In the same area, Technical/Managerial interventions also have good values of both indicators, as shown in the map. Additionally, Monitoring, training, and EMS seem to be an interesting intervention area. Cold production units and HVAC have higher cost-effectiveness values but, at the same time, higher saving potential; thus, options worth considering are also available in these areas. A similar matrix representing electrical or thermal savings can be drafted, showing the saving potential of each area by the energy carrier. In the current period of increasing energy prices, such information could be extremely useful for company decision makers if combined with a benchmark analysis of the energy consumption of their production processes. It is worth mentioning that current high energy prices are likely to affect the PBT of the examined three technical intervention areas, lowering them. By contrast, the impact of current prices would be mixed and more likely to result in an increase in PBT in the Cogeneration/Trigeneration area.
5. Discussion
The results obtained from the EnPI analysis allow us to draw some considerations.
The most important conclusion is certainly the evidence that the final energy consumption of the pharmaceutical plant cannot be related to pharmaceutical production: pharmaceutical plants use Equivalent Units of Product when it comes to determining the amount of yearly production since they often manufacture different products. Due to the great amount of energy used to ensure the proper environmental conditions, the surface area is probably the proper denominator for the plant EnPI: in this sense, we suggest focusing only on the surface area of the production departments since they generally share the largest part of the plants, and they are the area which is subject to the stricter environmental conditions required by GMP standards.
The data available allowed establishing that, in terms of final energy consumption, the EnPI can change depending on the size of the plant: as the size of the plant increases, the EnPI lowers, but it can increase in the case where the plant includes more complex processes and a greater need for cold energy production. For plants with a productive surface area lower than 7100 m2, the mean EnPI drops from 16,420 to 8420 MJ/m2 depending on the surface area size. Plants with a productive surface area higher than 7100 m2 have, as a mean, around 14,080 MJ/m2 of final energy consumption. It is also possible to say that there is quite a large variation around such mean values, depending on the different production processes used at the site.
Another important conclusion regards the second-level indexes. The results suggest that energy consumption in the HVAC area may be related to the size of the conditioned departments, but with a weak correlation.
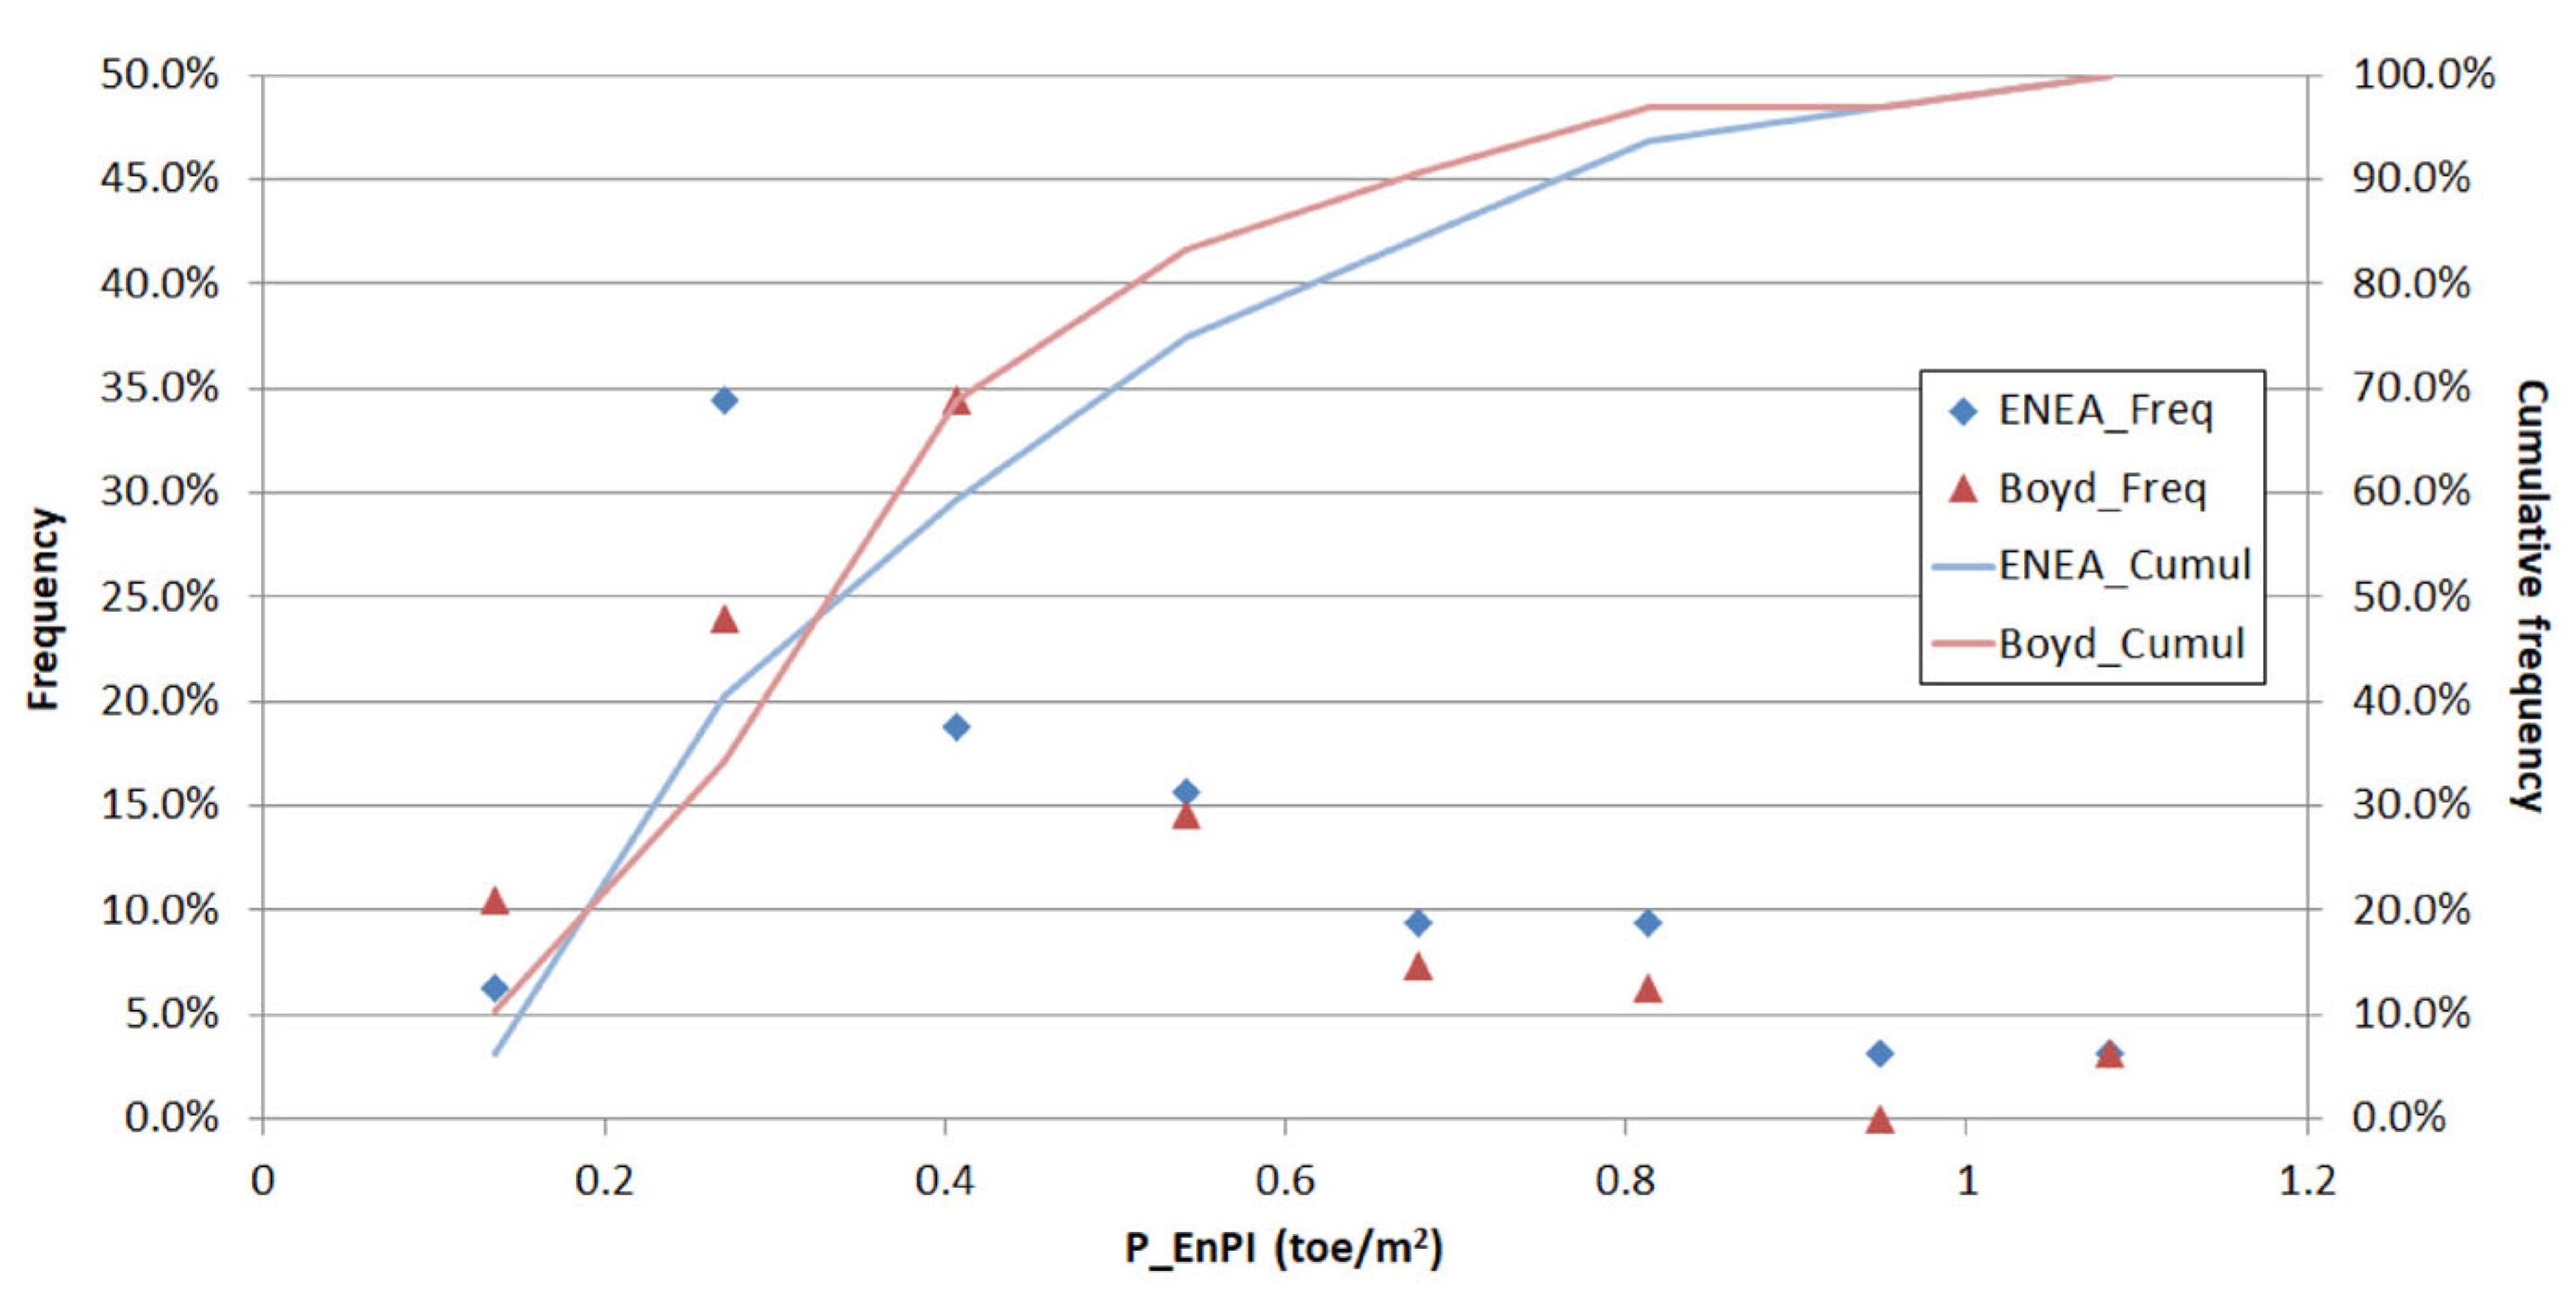
The data regarding primary energy consumption can be compared with the performances of this recent database with the data shown by Boyd [
17]; the Italian dataset is divided into the same classes as the American dataset, as shown in
Figure 15. The behavior of the pharmaceutical production sites is similar between the two groups of plants, with the difference of the peak of the Italian dataset, which is displaced a bit more left on the graph.
Table 10 compares the mean performances of the two groups in terms of specific primary energy consumption mean, median, standard deviation and 75% percentile: the performances of the two datasets are similar.
What can be concluded from this comparison is that the mean performance in terms of specific primary energy consumption in a generic pharmaceutical manufacturing plant can be set at around 0.35 and toe/m2, with a standard deviation of around 0.22 toe/m2, both values being the mean of the respective ENE and Boyd parameters.
It is useful here to remember that the Italian data shown in the previous table are referred to the surface area of the productive departments, while in the case of [
17], to the whole surface of the plant. The difference in the approach between the two datasets, however, is nearly negligible: the Italian mean would correspond to the American mean in case the production area is around 85% of the whole covered surface area of the plant. In this sense, it is also worth considering that the [
17] dataset was based on 95 pharmaceutical sites, obtained by excluding sites whose share in manufacturing areas was too low: thus, it can be said that the above-mentioned values refer to sites whose share in manufacturing areas is prevalent.
Several considerations can also be drawn from the EPIAs analysis, based both on the whole sample and on the subsample.
On the whole sample, Thermal power plant/Heat recovery systems are associated with the highest share of achieved savings and the second higher share of potential savings. Cold production is an important area both for achieved and potential savings: it is in second position for achieved savings and in first position for potential ones, together with HVAC. Both results are in line with the findings of [
19,
20], which show the key relevance in the pharmaceutical sector of ensuring the proper environmental conditions required for the processes. Indeed, the existing literature contributions focused on the possible savings associated with the management and retrofitting of HVAC systems [
22] and demand-controlled filtration systems in cleanrooms [
23]. Both contributions included an assessment of the savings of these EPIAs, showing interesting values at the facility level. Finally, the results on more important intervention areas explain why they have been included in the subsample.
The achieved final energy savings are equally distributed between electricity and thermal energy, whereas a prevalence of electricity is observed for potential savings (51% vs. 38% of thermal energy). This last result is consistent with the distribution by energy carriers of final energy consumption, with electricity accounting for 60% of the total. Cogeneration/Trigeneration covers almost the total of both achieved and potential primary energy savings, showing a key role of this technology in the sector, also when compared to production from renewable sources.
The comparison of cost-effectiveness for several areas shows advantageous values for Monitoring, training, EMS, both for achieved and potential savings, with values between 2000 and 3500 Euro/toe. The energy efficiency benefits of this area, as also shown by [
20,
21], are twofold: EPIAs imply energy savings and, at the same time, allow for the better identification of effective EPIAs thanks to the monitoring of energy consumption.
Almost half of the potential savings can be achieved by adopting measures with a PBT of less than 3 years. The analysis in the subsample, covering HVAC, Cold production units, Thermal power plant/Heat recovery and Monitoring, training, EMS areas, is focused on EPIAs having a PBT equal to or lower than 4 years to be even more exhaustive.
On the subsample, the values of cost-effectiveness are lower than 2000 Euro/toe in more than half of the distribution. In this portion of the distribution, Thermal power plant/Heat recovery has the highest share, followed by Monitoring, training, EMS.
A combination of PBT and cost-effectiveness information (
Figure 3) shows the most interesting values for both indicators in the HVAC area; furthermore, Thermal power plant/Heat recovery appears to be a promising area. Ref. [
23] analysed the PBT of EPIAs in the pharmaceutical sector and identified a heat recovery system and a demand-controlled filtration system as being economically attractive, with a PBT of around 4 years and lower than 1 year, respectively.
The overall picture allows us to identify interventions in all of the four examined areas having profitable values for both PBT and cost-effectiveness. This confirms that it is difficult to define the best intervention area without considering specific intervention characteristics as well as the site in which it is implemented.
The analysis of EPIAs relative to cost-effectiveness and CE and saving/consumption ratio shows that the share of EPIAs in Monitoring, training, and EMS area is higher in the cluster with good cost-effectiveness and a relatively low saving/consumption ratio. The best cluster in terms of examined indicators is populated almost exclusively by the Thermal power plant/Heat recovery area.
EPIAs are finally investigated to map cost-effectiveness and saving by intervention area and typology. Additionally, in this case, Thermal power plant/Heat recovery is associated with good solutions according to the examined indicators, both in Technical and Technical/Managerial intervention typologies. Monitoring, training, EMS confirms its role as a promising area. Cold production units and HVAC have less favorable cost-effectiveness values, but the saving potential is also higher than for other areas. Once again, it seems that a univocal and most suitable intervention area could not be defined: companies would be enabled to choose from a relatively wide range of effective technical and managerial solutions. Available EPIAs can be described at the aggregate level by energy efficiency cost curves, describing the cost-effectiveness and saving of each technological solution [
8]. Certainly, at the facility level, the precondition to developing effective intervention strategies is awareness and knowledge about company energy consumption.
Despite the available data and the large sample, the main limitation of this study is related to how energy is monitored in the pharmaceutical sector. Energy audits, in fact, are mainly based on energy bills and electricity or natural gas monitoring. However, a large amount of such vectors is converted into the plant and provided to the final users as heat or cold energy. This allows us to state that there is a hidden improvement potential in the pharmaceutical sector that must be addressed, and that could be the object of possible dedicated policies. Being a high value-added industry but, at the same time, having a large environmental impact [
10], in fact, the pharmaceutical sector could be the target of incentives or obligations aimed at increasing the monitoring of final energy uses and eliminating the low value-added energy uses. The reader should also consider, as shown in
Section 4, that the monitoring-EMS intervention area is characterized by a relatively good cost-effectiveness and that, despite the low estimated savings, increased monitoring of final uses could reveal new savings not estimated in the audits. It is pointless to say that larger monitoring is to the companies’ advantage since it could improve the knowledge of the energy conversion and final uses efficiency, consistently with the results achieved in [
21] for other sectors. Finally, increased and prolonged monitoring could be the basis for long-term sectoral observation and EnPI calculation, which could then provide solid sectoral benchmarks and energy consumption baselines.
Our policy suggestion, therefore, is to introduce incentive or obligation schemes to increase the amount of final energy monitoring in the sector, with the aim of improving the knowledge of the actual energy consumption and helping to exploit the existing energy-saving potential.
6. Conclusions
This work is devoted to investigating energy use and energy-saving potential in the pharmaceutical sector. As already highlighted, the energy intensity of the sector is high, as well as the CO2 emission intensity. For both reasons, the attention on sustainability and on the improvement in the energy efficiency of the pharmaceutical sector has risen in recent years.
The results presented in this work are the outcome of a collaboration between ENEA and the Italian Pharmaceutical Industry Association aimed at exploiting the energy audit data. The collaboration had several objectives, among which: determining EnPIs for the pharmaceutical sector using the methodology developed in [
33]; calculating the sectoral energy-saving potential; identifying the most promising energy-saving strategies.
Contributions on these research topics are scarce and present work adds several conclusions to the existing literature.
The first set of results is associated with the energy consumption analysis and EnPI calculation, allowing the identification of different sectoral characteristics:
Auxiliary services are particularly important in the pharmaceutical sector, which in this aspect is quite different from other industrial sectors. Indeed, more than two-thirds of the final energy consumption in pharmaceutical plants is used in auxiliary services, i.e., heat and cold energy production, AHUs, water purification, air compression and water pumping.
A significant role is played by the size of the plant, which is a stronger energy driver than plant production. For this reason, the EnPI of a pharmaceutical plant should refer to the size of the plant. Due to the way energy is used, the surface of the production areas is more suitable for this aim.
The EnPI of a plant strongly depends on the processes: the scale effect can be nullified in the case where energy-intensive processes are included. This also means that sectoral EnPIs have large variability due to the several different processes that may be included in the plants. Calculated with respect to the plant surface area, the EnPI of the generic pharmaceutical plant changes between 8420 ± 5320 and 16,420 ± 3660 MJ/m2, depending on the size of the plant itself.
The EnPIs provide useful benchmarking information for pharmaceutical sites; for example, in terms of primary energy consumption, the mean EnPI is around 0.35 ± 0.22 toe/m2.
A second set of conclusions is related to EPIAs analysis:
It is very important to combine the description of energy savings with the analysis of sectoral consumption in order to be able to better understand and characterize the sectoral energy efficiency potential.
Given the key importance of knowing the consumption structure at the facility level, an energy audit could be a very useful tool for planning EPIAs in an effective and sound manner.
The mandatory obligation to perform an energy audit can become an opportunity for firms aiming to understand their energy consumption profile and identify the better ways to improve their energy efficiency.
When investigating savings and EPIAs’ cost-effectiveness, it is key to consider the peculiarities of productive sites.
Both managerial and technical interventions have a good potential in the pharmaceutical sector, being associated with savings equal to 3750 toe/year of final energy and to 4212 toe/year of primary energy (additional to the previous savings).
The limitations of this study relate to the lack of data concerning the final uses of heat and cold energy, which is also a great weakness of the sector in terms of energy management. This limitation, however, does not depend on the methodology used but on the energy use of the sector, and it cannot be overcome in any way unless broader monitoring of final energy use is implemented in the plants. Our policy suggestion is to introduce incentives and/or obligations with the aim of increasing the monitoring of final energy uses, especially cold energy and heat.
Further research directions could be devoted to the analysis of the employment of specific technologies; for example, Cogeneration/Trigeneration appears to be widely used in the sample of pharmaceutical plants examined. Similarly, EPIAs in the Cogeneration/Trigeneration area could be further investigated both in terms of energy savings and decarbonization impacts. It could be interesting also to perform a sensitivity analysis of the impact of rising electricity and natural gas prices on the adoption of EPIAs in different areas. Finally, the access to existing incentive mechanisms and their effects on the PBT and cost-effectiveness could also be investigated.
To conclude, it seems that both policy makers and sectoral operators could learn useful insights from sectoral analyses such as the one developed here for the pharmaceutical sector.


