Article

Characteristics of Hydrocarbon-Generating Pressurization in Shale Series of Fengcheng Formation in the West and South of Mahu Sag, the Junggar Basin, China

1
Faculty of Petroleum, China University of Petroleum-Beijing at Karamay, Karamay 834000, China
2
State Key Laboratory of Petroleum Resources and Prospecting, China University of Petroleum-Beijing, Beijing 102249, China
3
Xinjiang Oilfield Company, PetroChina, Karamay 834000, China
*
Author to whom correspondence should be addressed.
Processes 2023, 11(10), 2847; https://doi.org/10.3390/pr11102847
Submission received: 8 September 2023 / Revised: 23 September 2023 / Accepted: 25 September 2023 / Published: 27 September 2023

Abstract

:
Formation overpressure is an important controlling factor for the formation of high-yield oil reservoirs in the shale series of the Permian Fengcheng Formation in the west and south of Mahu Sag, the Junggar Basin. Hydrocarbon-generating pressurization (HGP) is an important cause of overpressure in the shale series of Fengcheng Formation, but the evidence for this viewpoint is insufficient. There is still no systematic study on the quantitative calculation and distribution characteristics of HGP in the Fengcheng Formation shale series. The control effect of HGP on the formation of high-pressure and high-yield reservoirs is still unclear. Therefore, by using the data of mudstone logging and measured formation pressure, the causes of overpressure in the Fengcheng Formation shale series are clarified. The predicted organic matter abundance, the predicted maturity and thickness of source rocks, and the statistical ratios of mudstone thickness to formation thickness in each section of Fengcheng Formation are used for HGP of shale series. Combined with the physical characteristics of reservoir rocks and the geochemical characteristics of oil, the control effect of HGP on the formation of high-pressure and high-yield reservoirs is analyzed. The results indicate the following: (1) The organic matter abundance and the thickness of source rocks predicted by the logging data gradually decrease from the eastern lake basin area to the western slope area. (2) The HGP of shale series in Fengcheng Formation is related to the hydrocarbon generation capacity and the overpressure preservation conditions of the source rocks. The HGP can be quantitatively predicted by comprehensively using the organic matter abundance, the maturity, the thickness of source rocks, and the ratios of mudstone thickness to formation thickness. (3) The HGP in the Fengcheng Formation shale series also gradually decreases in distribution characteristic from the eastern lake basin area to the western slope area. (4) The oil accumulation mode of the Fengcheng Formation shale series is that, with the drive of overpressure, the oil migrates slightly within the layer, and finally accumulates to form the oil reservoir. The research results are helpful to understand the distribution characteristics of HGP and the formation mechanism of high-pressure and high-yield reservoirs in the shale series of Fengcheng Formation in the west and south of Mahu Sag, and are of great significance to guide the exploration and development of shale oil and tight oil.

1. Introduction

The fan delta lake sedimentary system was developed in Fengcheng Formation of the Lower Permian in the west and south of Mahu Sag [1,2], and its fan delta front subfacies are favorable areas for exploration, with a cumulative area of over 2000 km2. The shale source rocks in fan delta front subfacies, the tight sandstone reservoir rocks, and the tight siltstone reservoir rocks of Fengcheng Formation are frequently interbedded [3,4,5], forming the shale series of Fengcheng Formation, and developing shale and tight sandstone–siltstone reservoirs. It was found in the research by PetroChina Xinjiang Oilfield Company that the production of shale series in oil reservoirs of Fengcheng Formation is closely related to formation overpressure, which is a favorable condition for the formation of high-yield oil reservoirs. Therefore, the study on the origin, distribution, and reservoir relationship of overpressure in Fengcheng Formation in the west and south of Mahu Sag is helpful to understand the formation mechanism of the shale series reservoirs in this area, and is of great significance for guiding the exploration and development of shale oil and tight oil in Fengcheng Formation of Mahu Sag.
The rocks within the shale series are generally dense, and the formation overpressure replaces buoyancy as the main driving force for oil migration. There are many causes of formation of overpressure in shale series, including under compaction, tectonic compression, hydrocarbon generation, fluid thermal expansion, mineral transformation and dehydration, etc. However, only when there is a pressure difference between the source rock and the reservoir rock in the shale series, the reservoir rock adjacent to the source rocks can better capture oil and become a favorable location for oil accumulation [6,7]. Because the reservoir rocks are located in the shale series and are adjacent to the source rocks, their burial temperature evolution histories and their tectonic evolution histories are the same, which results in the approximate pressurization of formation mechanisms with some abnormal high pressure, such as tectonic compression and fluid thermal expansion. However, due to the overall compactness of shale series, other formation mechanisms of abnormal high pressure, such as the effect of fluid density contrast and water head difference, cannot be the main factors for the formation of abnormal high pressure. The hydrocarbon generation of source rocks increases the volume of pore fluid, which becomes the key factor for the formation of strong overpressure [8,9,10,11]. At the same time, with the migration of oil, overpressure must also be transmitted from source rocks to reservoir rocks, which is conducive to the formation of high-pressure and high-yield reservoirs [7,12,13,14]. However, the genetic mechanism of abnormal overpressure in Fengcheng Formation in the study area is still controversial [15,16]. The normal compaction of the Fengcheng Formation in the study regions proves that undercompaction and tectonic compression are not the main factors contributing to the abnormally high formation pressure. The Fengcheng Formation is an important source rock. Is hydrocarbon generation the main genetic mechanism of abnormally high pressure? The current prediction methods for formation pressure are mostly based on undercompaction. How to establish the relationship between hydrocarbon generation and overpressure, and then quantitatively predict HGP? The exploration practice of the Fengcheng Formation has found a close relationship between shale oil sweet spots and abnormally high pressure. Accurately characterizing the distribution characteristics of abnormal high pressure in the Fengcheng Formation and clarifying the relationship between abnormal high pressure and sweet spots are key practical problems to be solved in the exploration practice of shale oil in the Fengcheng Formation.
In order to quantitatively calculate the amount of HGP, and then analyze the relationship between the HGP and the formation of high yield reservoirs in the shale series of Fengcheng Formation, it is necessary to analyze the origin of formation of overpressure in the shale series of Fengcheng Formation in the west and south of Mahu Sag, establish the relationship between the HGP and the hydrocarbon generation capacity of the source rocks and the overpressure preservation capacity of the shale series, and calculate the amount of HGP. Finally, a microdistance migration and accumulation model of oil in the shale series of Fengcheng Formation under the control of HGP was established, providing theoretical support for searching for high-pressure and high-yield oil reservoirs.

2. Geological Condition

Mahu Sag is located in the northwest of Junggar Basin, with a total exploration area of about 5000 km2. It is one of the sags with the most abundant oil and gas resources in Junggar Basin [17,18,19,20]. The research area is located in the western and southern regions of Mahu Sag (Figure 1b), with sedimentary strata including the Carboniferous, Permian, Triassic, Jurassic, and Cretaceous sediments. Fengcheng Formation of the Lower Permian is the target layer for this study. Fengcheng Formation can be further divided into the first section (P1f1), the second section (P1f2), and the third section (P1f3) from bottom to top (Figure 1d) [3,21,22,23].
During the sedimentary period of the Early Permian Fengcheng Formation, Mahu Sag had a sedimentary environment of an alkaline lake [21,24,25], and Fengcheng Formation extensively developed dolomitic rocks [26,27,28]. The alkaline lacustrine shales of Fengcheng Formation deposited in semi-deep lake and deep lake environments are the main source rocks in this region, and most source rocks are mature, i.e., highly mature oil source rocks with high organic matter abundance and good types [29,30,31]. A series of fan deltas were developed around the alkali lake in Fengcheng Formation of Mahu Sag (Figure 1c), including the Zhongguai fan and Baqu fan in the southern slope of Mahu Sag, the Huangyangquan fan in the western slope of Mahu Sag, and the Xiazijie fan in the northern slope of Mahu Sag. Among them, the Zhongguai fan and Baqu fan in the southern slope of Mahu Sag are distributed in contiguous areas with the Huangyangquan fan in the western slope of Mahu Sag. Each fan can be divided into fan delta plain subface and fan delta front subface, but the identification of the front fan delta subface is not clear. The subface of the fan delta front can be further divided into the inner side of fan delta front near the sediment source and the outer side of fan delta front far from the sediment source.
Under the background of alkaline lake sedimentary environment in Fengcheng Formation, fan deltas were widely developed around the lake basin, and volcanic activity is strong during the same period. This results in both endogenous carbonate deposits and terrigenous clastic material deposits in Fengcheng Formation of the Mahu Sag, as well as volcanic material inclusions, forming a mixed sedimentary body with multiple sediment sources. The lithology of Fengcheng Formation is diverse, including conglomerate, sandstone, dolomite, mudstone, tuff, salt rock, and other types (Figure 1d) [3,19].
There are various types of reservoirs in Fengcheng Formation, including conventional reservoirs developed near the fracture zone, tight oil and shale oil developed in the slope area and inside the sag. Among them, in the fan delta front subfaces environment, shale source rocks are frequently interbedded with sandstone and siltstone tight reservoirs [3,4,5], and shale series tight oil reservoirs and shale oil reservoirs are formed by micro migration or in situ retention of oil.

3. Methods

3.1. Method for Obtaining Shale Compaction Curve

The overall density of the rocks in the shale series is prone to be undercompacted. The porosity of undercompacted shale is abnormally large, which is characterized by abnormally large acoustic time difference and abnormally low density on the logging curve. In order to determine whether undercompaction is the main factor contributing to the formation of overpressure in the shale series of Fengcheng Formation, the following three steps of research were carried out: (1) Five wells with normal formation pressure in Fengcheng Formation at the edge of the sag were selected (wells JL17, B25, B22, K891, and MH33 in Figure 1c). The acoustic time difference data of mudstone were screened, and the normal compaction curve of mudstone in the study area was obtained. (2) By comparing the normal compaction curve characteristics of mudstone in the study area and the compaction curve characteristics of drilling wells with abnormally high formation pressure in Fengcheng Formation inside the sag (wells B25, MH7, MH49, and MH54 in Figure 1c), and by combining the measured formation pressure with the formation pressure calculated by the equilibrium depth method (wells MH39, MH54, MH48, MH52, MH57, MH106, and FY1 in Figure 1c), the relationship between undercompaction and the overpressure in Fengcheng Formation has been analyzed. (3) The vertical effective stress of mudstone using the Bowers method is calculated [32,33], and the cause of overpressure in Fengcheng Formation based on the relationship between acoustic time difference and vertical effective stress is further analyzed.

3.2. Experiments and Prediction Method of Total Organic Carbon

A total of 29 shale samples from Fengcheng Formation were considered for experiments of total organic carbon (TOC), which were obtained from wells MH39, MH52, MH54, FY1, and MY2. The TOC experimental process is as follows: Weigh approximately 0.1 g of the shale sample, and fully react it with 12.5% HCl and carbonate in the sample, and then wash the sample with distilled water every half an hour for a total of three days. Wash the reaction product thoroughly before drying. Place the dried sample into the Leco CS-230 analyzer to measure TOC.
Using the logging data to predict the TOC of the Fengcheng Formation shale in the study area, a total of 17 wells were predicted, including wells AK1, BQ1, FY1, JL35, K892, MH26, MH28, MH33, MH39, MH48, MH49, MH52, MH54, MH57, MH085, MH106, and MY2. The prediction process is as follows: (1) Using multiple regression analysis, establish a relationship between the logging data and the measured TOC of the Fengcheng Formation shales. (2) Use this relationship to predict the TOC value of the Fengcheng Formation shales in the key drilling wells.

3.3. Prediction Method of HGP

The amount of HGP is related to both the amount of hydrocarbon generation and the preservation conditions. On the premise that the organic matter types of source rocks in the west and south of Mahu Sag are the same, the amount of hydrocarbon generated in the shale series is related to the thickness, the average TOC, and the maturity of source rocks, and the preservation conditions are related to the ratios of mudstone thickness to formation thickness (r). The parameters affecting the hydrocarbon generation pressurization amount are obtained as follows: (1) The shales of Fengcheng Formation with TOC greater than 0.5% are predicted as source rocks, and the thickness of the source rocks are accumulated from each sub layer of the source rocks in Fengcheng Formation. (2) The average TOC is the average value of predicted TOC of Fengcheng Formation source rocks. (3) The relationship between Vitrinite reflectance (Ro) and depth was established by Basin modelling method. The Basin modelling results were verified by the measured Ro data of source rocks in Fengcheng Formation from PetroChina Xinjiang Oilfield Company, and the maturity of the source rocks were predicted according to the burial depth. (4) Based on the statistics and calculations of rock debris logging and logging GR data, the r of each member of Fengcheng Formation was obtained. The relationship equations between the hydrocarbon generation pressurization amount of Fengcheng Formation shales and the thickness (Hs), the average TOC, the average Ro of source rocks, and the r were established, respectively. With reference to these relationships, the calculation model of the hydrocarbon generation pressurization amount of Fengcheng Formation shales was regressed using SPSS25 software, and the hydrocarbon generation pressurization amount of each member of Fengcheng Formation in the west and south of Mahu Sag was finally obtained.

4. Results and Discussion

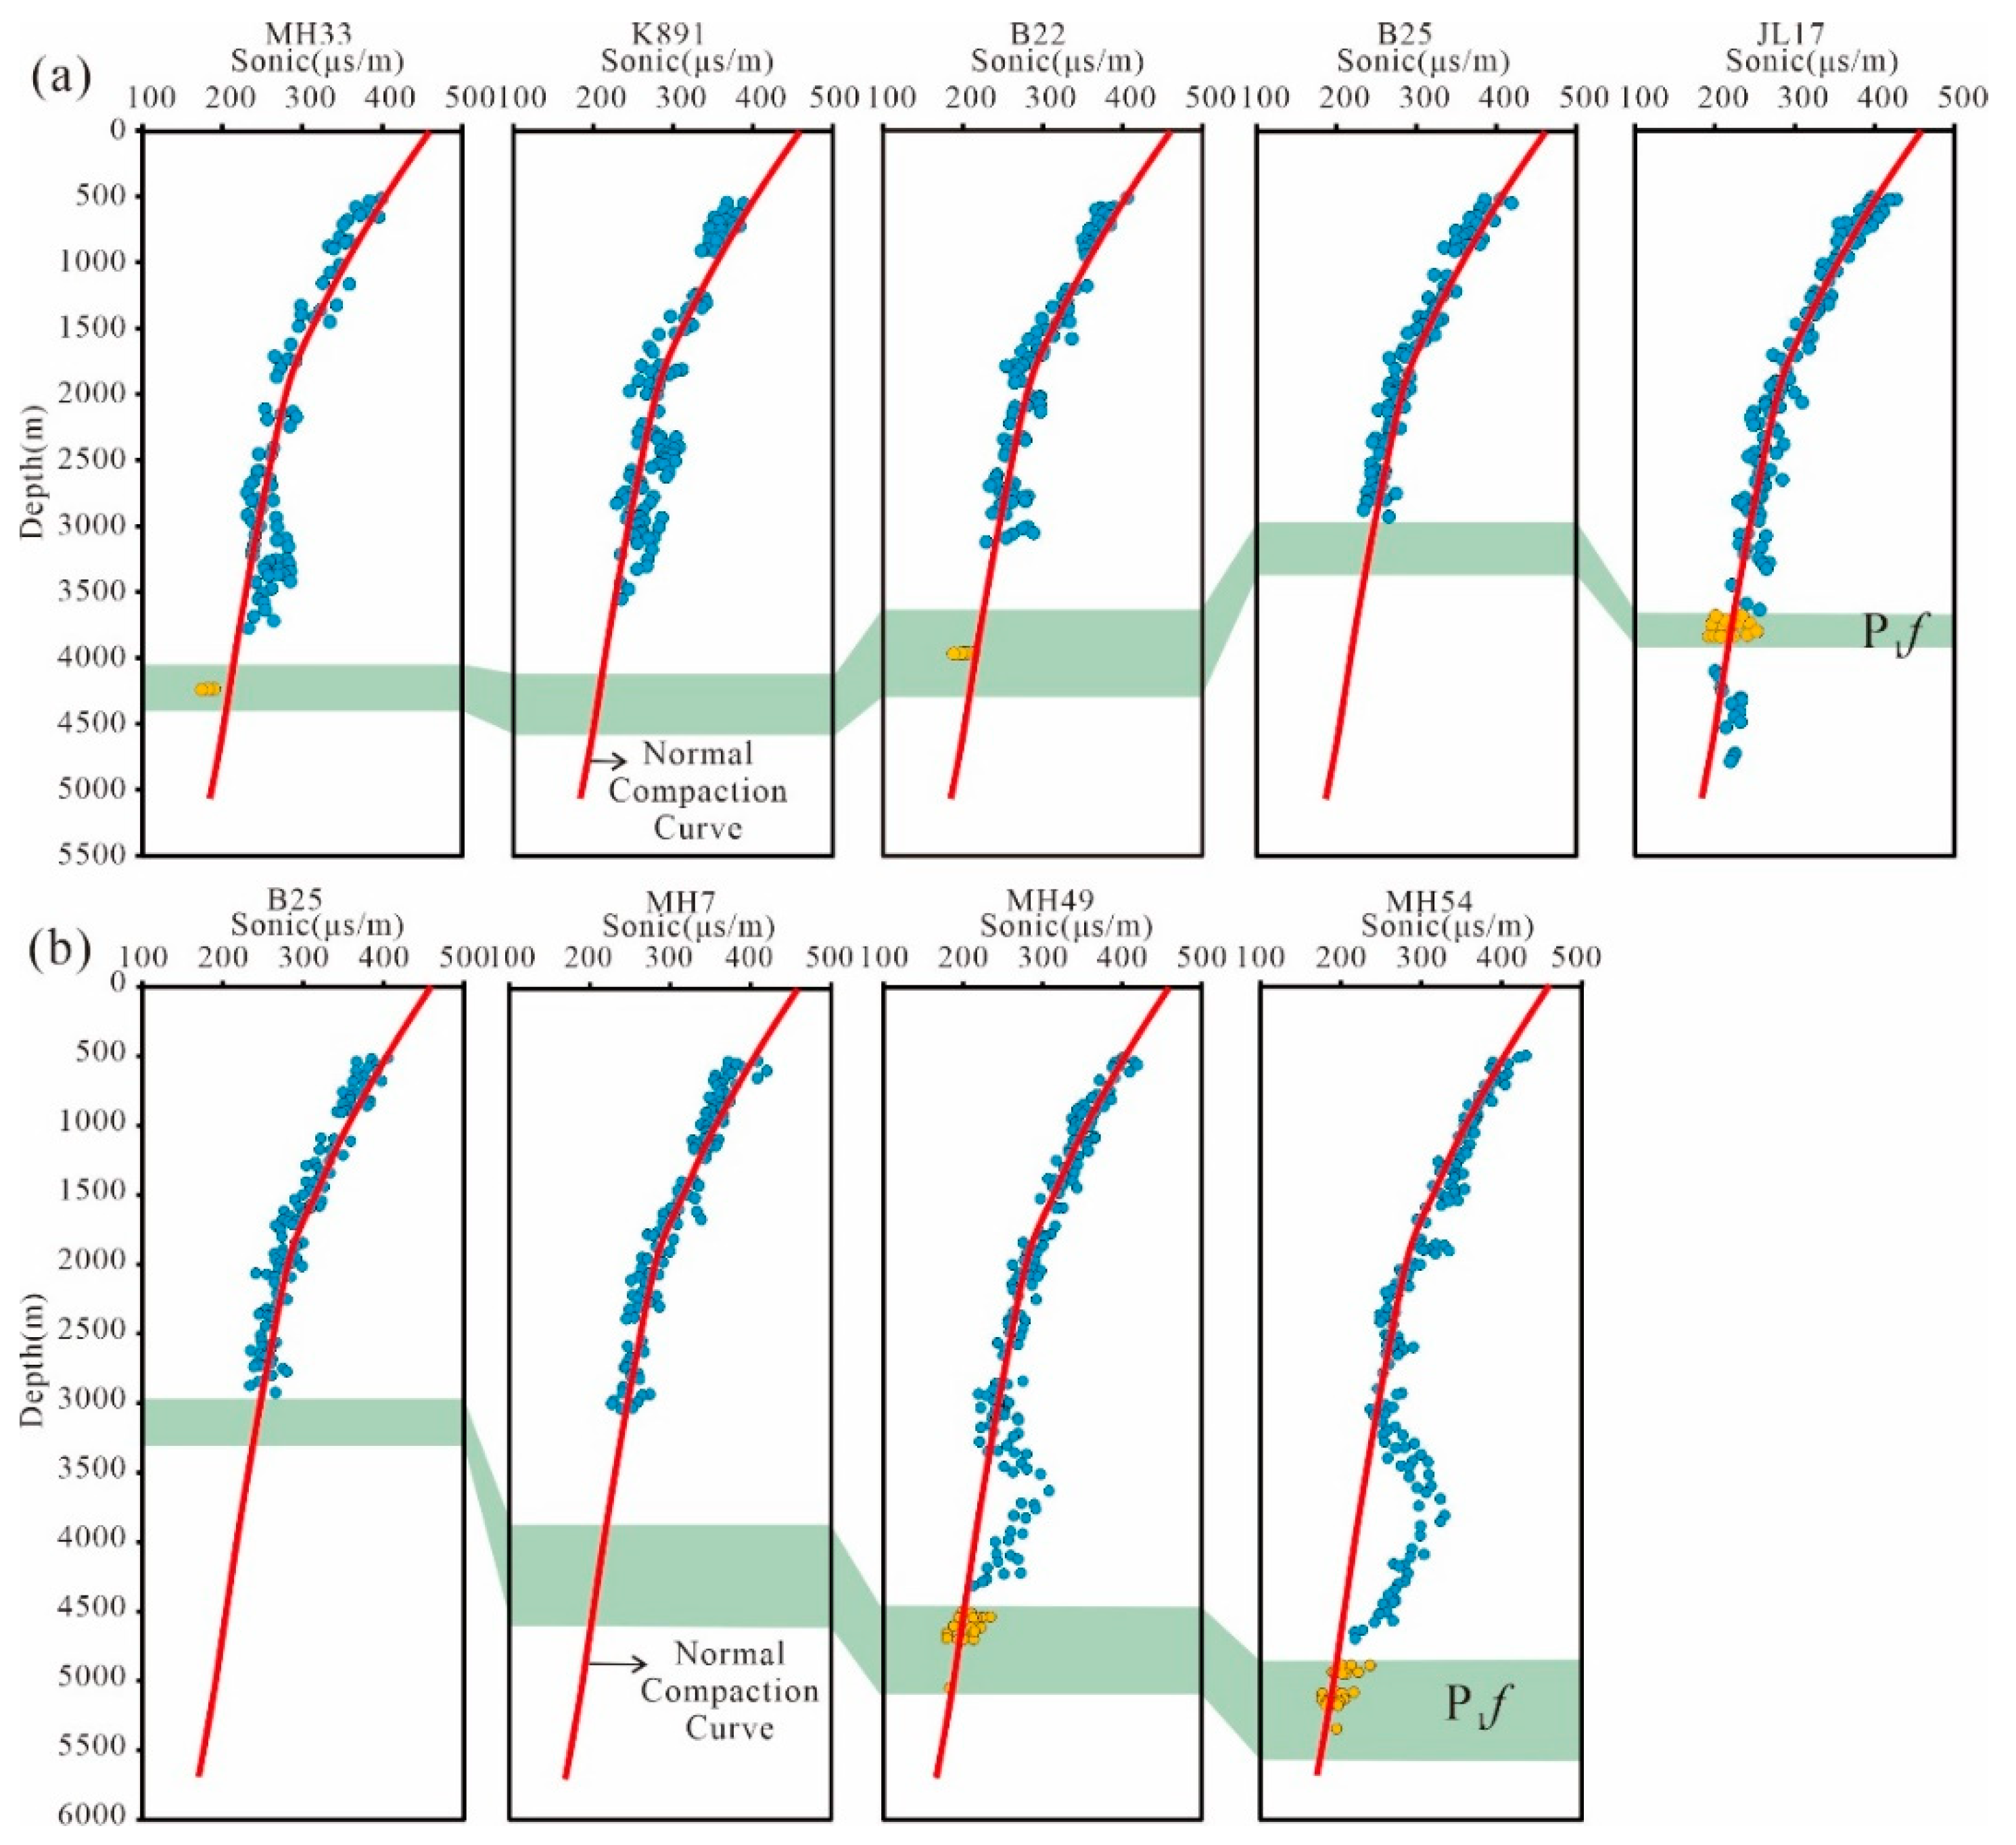
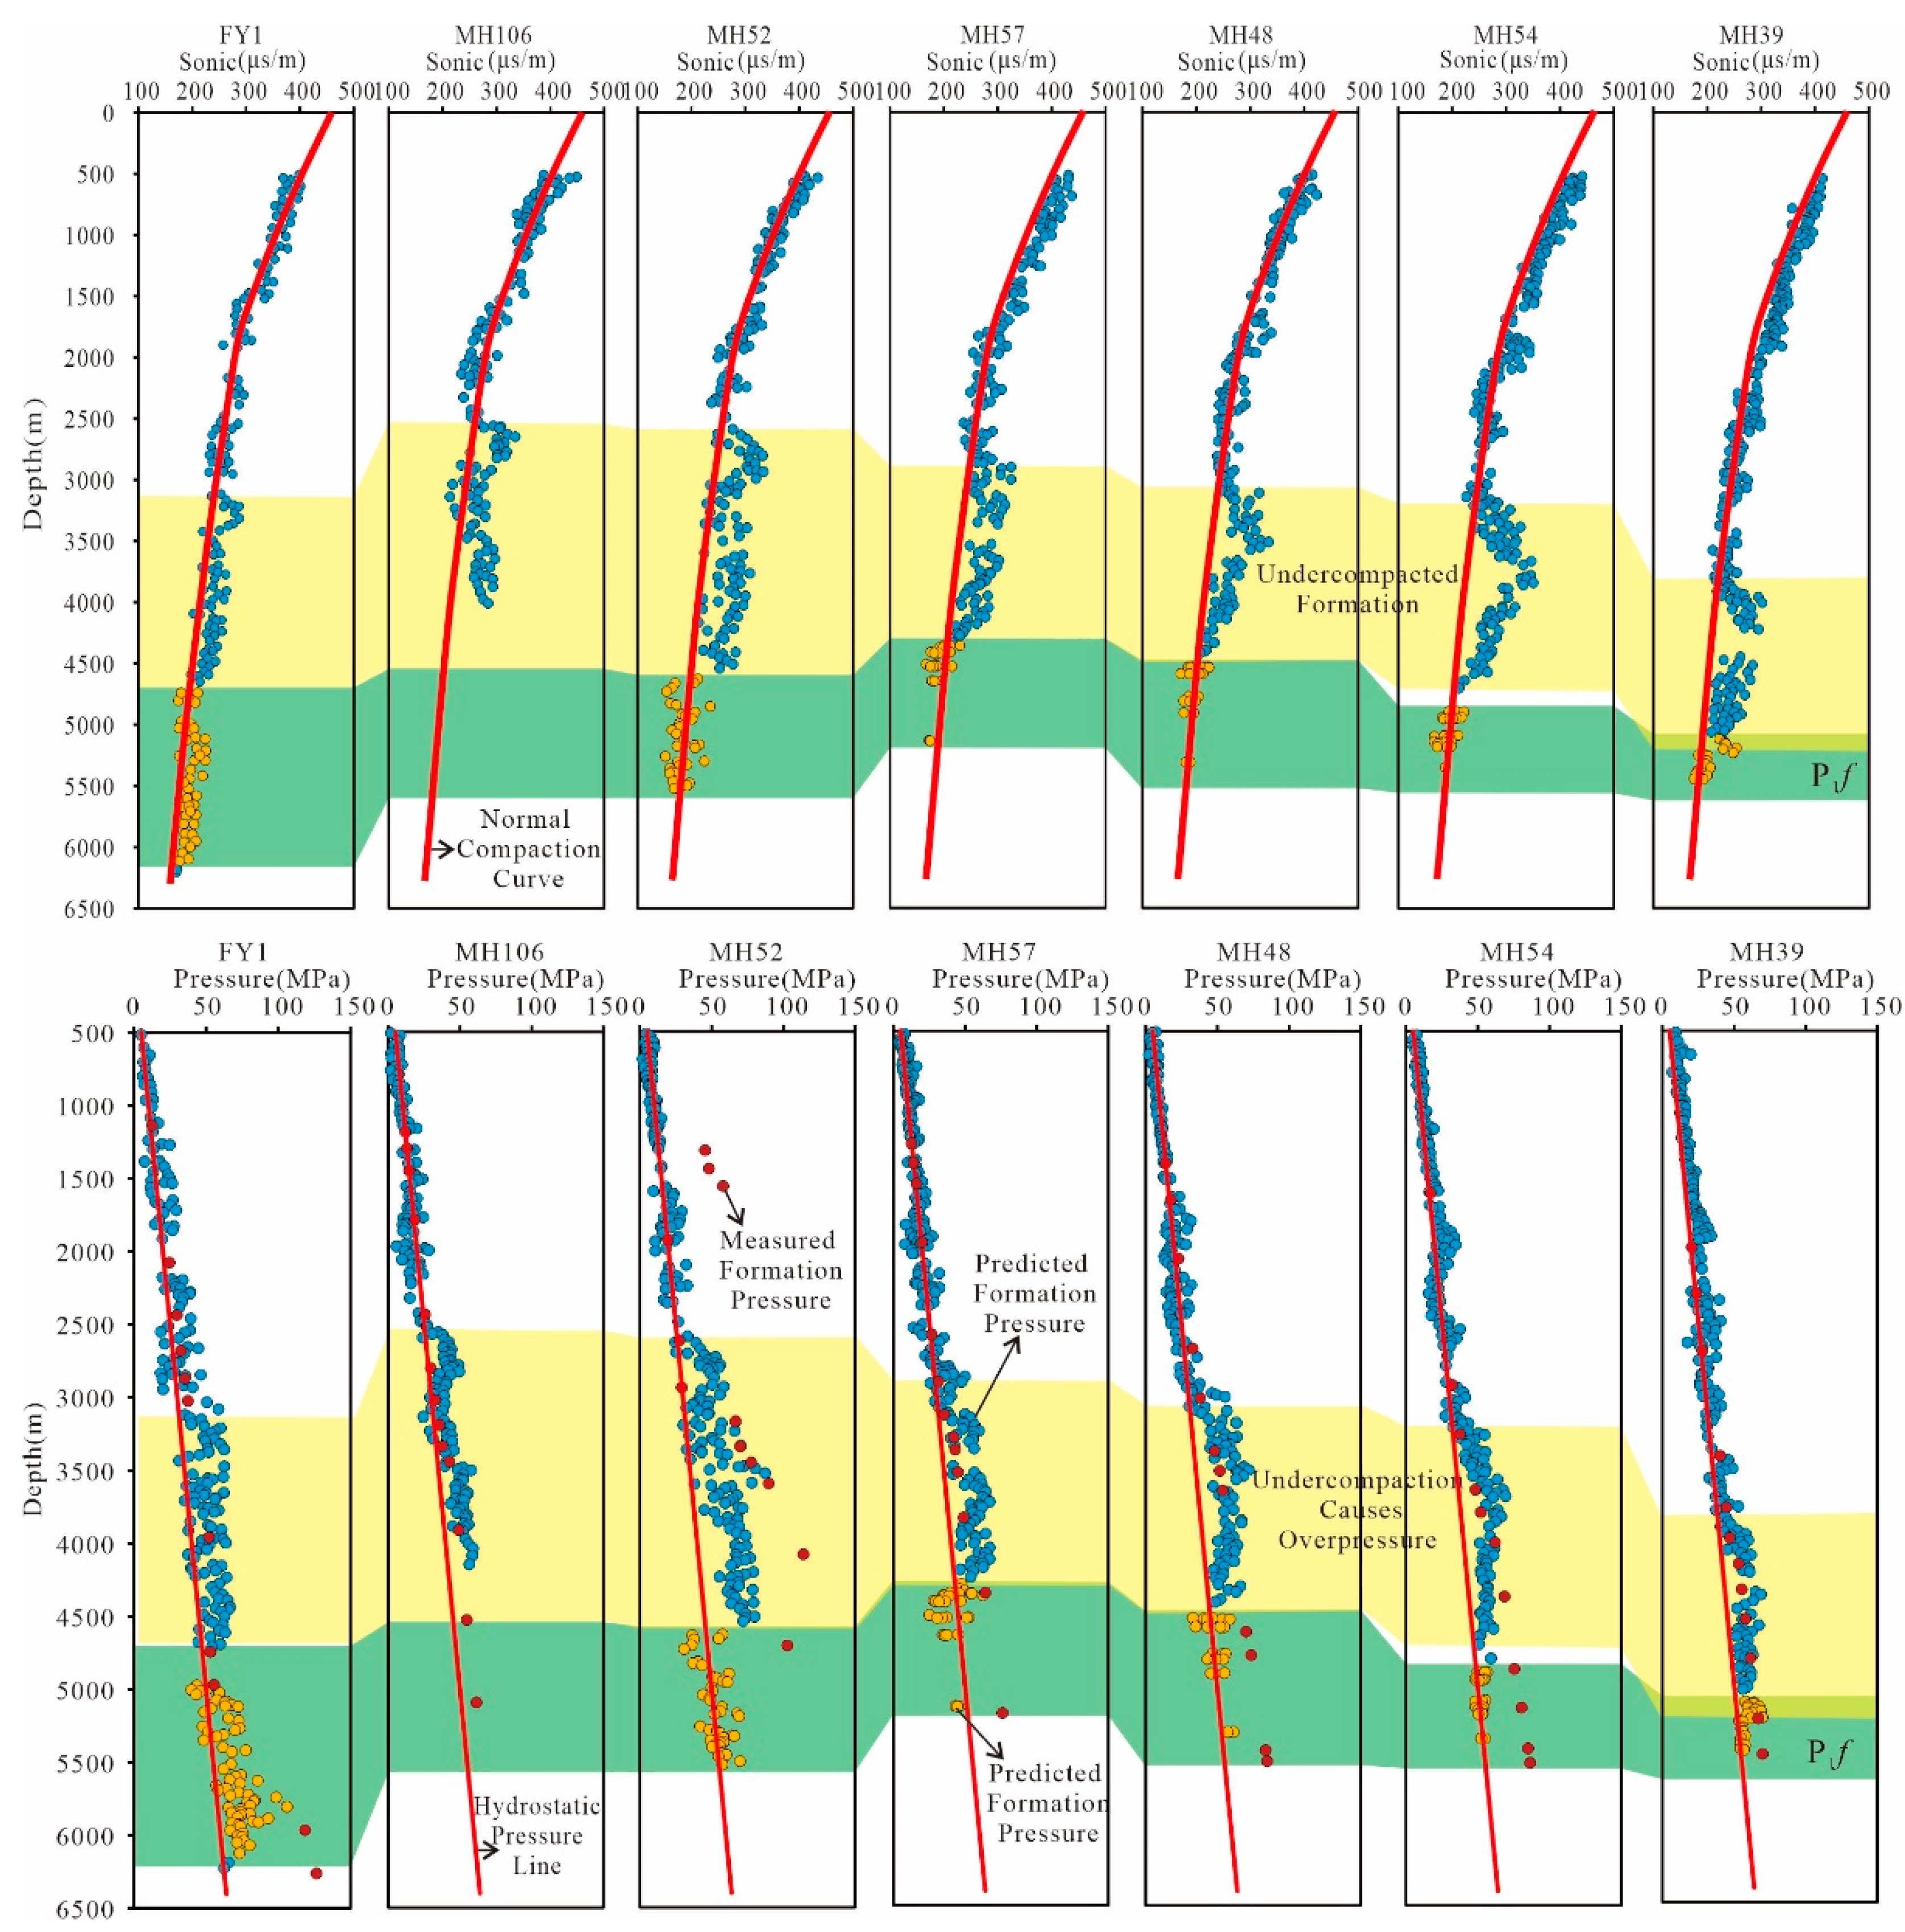
4.1. Shale Compaction Curve and Formation Pressure Characteristics

The variation trend of shale acoustic time difference with depth is used to reflect the characteristics of shale compaction curve in the study area. MH33-K891-B22-B25-JL17 is located at the edge of the study area (well locations are shown in Figure 1c), and the lithology of Fengcheng Formation is mainly sandstone and conglomerate, with a small proportion of shale. The shales deposited in this area were easily able to discharge their pore fluid into adjacent high permeability sandstone and conglomerate, and the shales were in a normal compacted state. By using these five wells, the normal compaction curve of shale in the study area can be obtained. Comparing the normal compaction curve characteristics of shales from these five wells, it was found that the shale in the study area had a unified normal compaction curve (Figure 2a). This means the following: (1) in shallow formations less than 1800 m, the relationship between shale acoustic time difference (AC) and depth (H) is H = 140e(−0.00026AC) and (2) in deep formations greater than 1800 m, the normal compaction curve is H = 110e(−0.00013AC).
B25-MH7-MH49-MH54 is an east–west connected well section (see Figure 1c for well locations). From the well B25 at the edge of the sag to the well MH54 inside the sag, the shale content in Fengcheng Formation gradually increases; the burial depth of the formation also gradually increases; the rock gradually becomes denser, and the drainage capacity gradually weakens. The Fengcheng Formation shales of well MH54 are more prone to be undercompacted, and the shale acoustic time difference should be larger than the normal value. However, compared to the normal compaction curve of shales in Figure 2a, it can be seen that the acoustic time difference of wells MH49 and MH54 inside the sag in Fengcheng Formation shales is normal, and there is no undercompaction (Figure 2b).
The equilibrium depth method can calculate the abnormal high pressure formed by shale undercompaction. The selected wells are shown in Figure 3 (well locations are shown in Figure 1c), all of which are located inside the sag, and the shales are prone to be undercompacted, resulting in abnormally high pressure in the formation. The results show that a majority of the formation pressure calculated by the equilibrium depth method for Fengcheng Formation is normal formation pressure, and the measured formation pressure is significantly greater than the formation pressure calculated by the equilibrium depth method. It can be seen that the equilibrium depth method cannot accurately calculate the formation pressure of Fengcheng Formation. The main cause of abnormally high formation pressure in Fengcheng Formation is not undercompaction, but may be HGP.
The vertical effective stress of well MH48 was calculated using the Bowers method, and the acoustic velocity of shales was calculated using the logging acoustic time difference. A scatter plot of the vertical effective stress and acoustic velocity of shales was established (Figure 4). From Figure 4, it can be seen that the acoustic velocities of the Fengcheng Formation shales are relatively high, reflecting the characteristics of overpressure caused by fluid expansion, which may be caused by hydrocarbon generation [34,35,36].

4.2. Shale Organic Matter Abundance and Source Rock Distribution

4.2.1. Organic Matter Abundance of Shale

The measured TOC data of the Fengcheng Formation shales show (Table 1) that the TOC ranges from 0.27% to 3.85%, with an average value of 1.50%. Through multiple regression, the relationship between TOC and the logging parameters of the Fengcheng Formation shales is established and is as follows:
TOC′ = −7.053DEN − 0.031AC − 0.012GR − 0.0000017RI − 0.004SP + 0.01RXO − 0.177CALI − 0.004RT + 0.063CNL + 22.97 (R2 = 0.68)
In Equation (1), TOC′ is the predicted total organic carbon content (%). DEN is the rock density logging data (g/cm3). AC is the logging data of rock acoustic time difference (μm/ft). GR is the rock natural gamma logging data (API). RI represents shallow resistivity logging data (Ω•m). SP represents natural potential logging data (mv). RXO represents flushing charged resistivity logging data (Ω•m). CALI represents caliper logging data (cm). RT represents deep resistivity logging data (Ω•m), and CNL represents neutron porosity logging data (v/v).
Using Equation (1), TOC′ of the Fengcheng Formation rocks is predicted based on logging data. The results showed that the TOC′ of the samples ranged from 0.01% to 3.14%, with an average value of 1.54% (Table 1). Comparing the TOC and TOC′ values of the samples (Figure 5), it was found that both TOC and TOC′ peaks appeared in the range of 1.00% to 2.00%, indicating that most samples had higher organic matter abundance. Both TOC and TOC′ scatter points are distributed near Y = X ray, indicating that using logging data can better predict TOC values.
According to the TOC prediction results of single well shales, consider TOC′ greater than 0.5% as source rocks, calculate the average TOC′ value of source rocks in each member of Fengcheng Formation, and draw the average TOC′ contour maps of the first, second, and third members of Fengcheng Formation (Figure 6). It can be seen from Figure 6 that the average TOC′ of the first member of Fengcheng Formation is between 0.7% and 1.5%, the average TOC′ of the second member of Fengcheng Formation is between 0.5% and 3.5%, and the average TOC′ of the third member of Fengcheng Formation is between 0.8% and 2.0%. The average TOC′ change trend of each member is gradually increasing from west to east and southeast. The average TOC′ of each member is closely related to sedimentary subfacies, which is from fan delta plain subfacies at the edge of the sag to semi-deep lake, deep lake subfacies inside the sag, and the average TOC′ of source rocks gradually increases. In the semi-deep lake, i.e., deep lake subfacies environment, the average TOC′ of the second member is the highest, reaching a maximum of 3.5%, while the average TOC′ of the first member is the lowest.

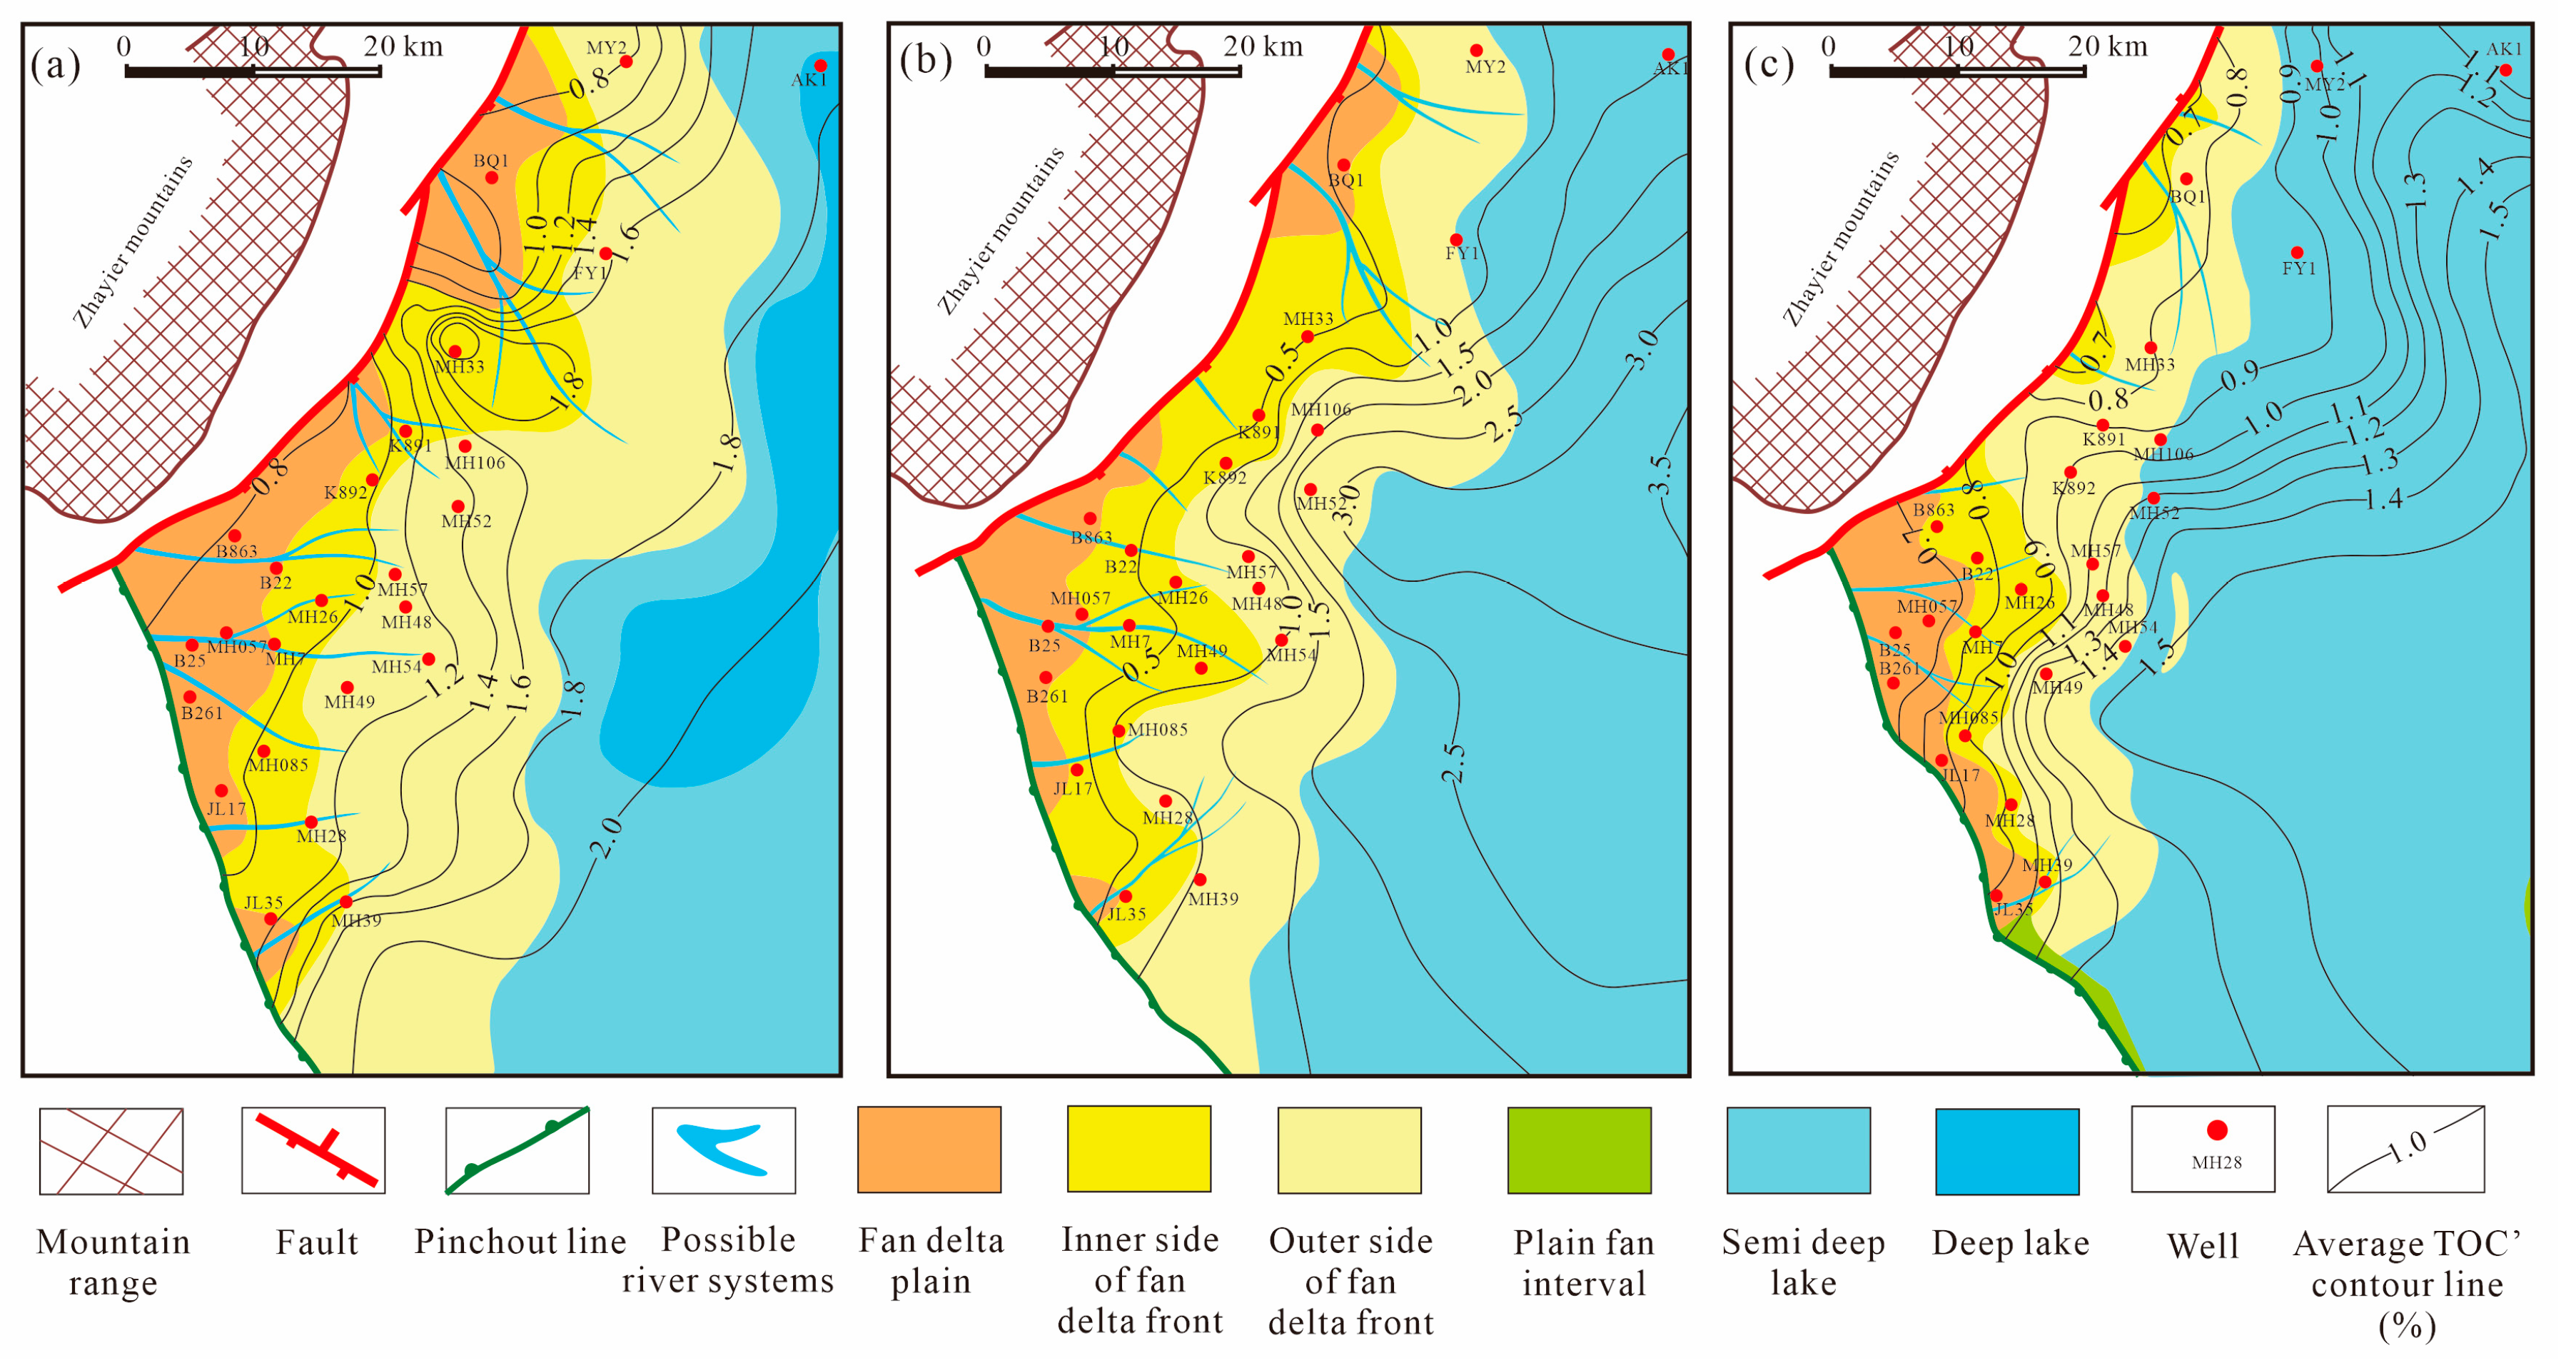
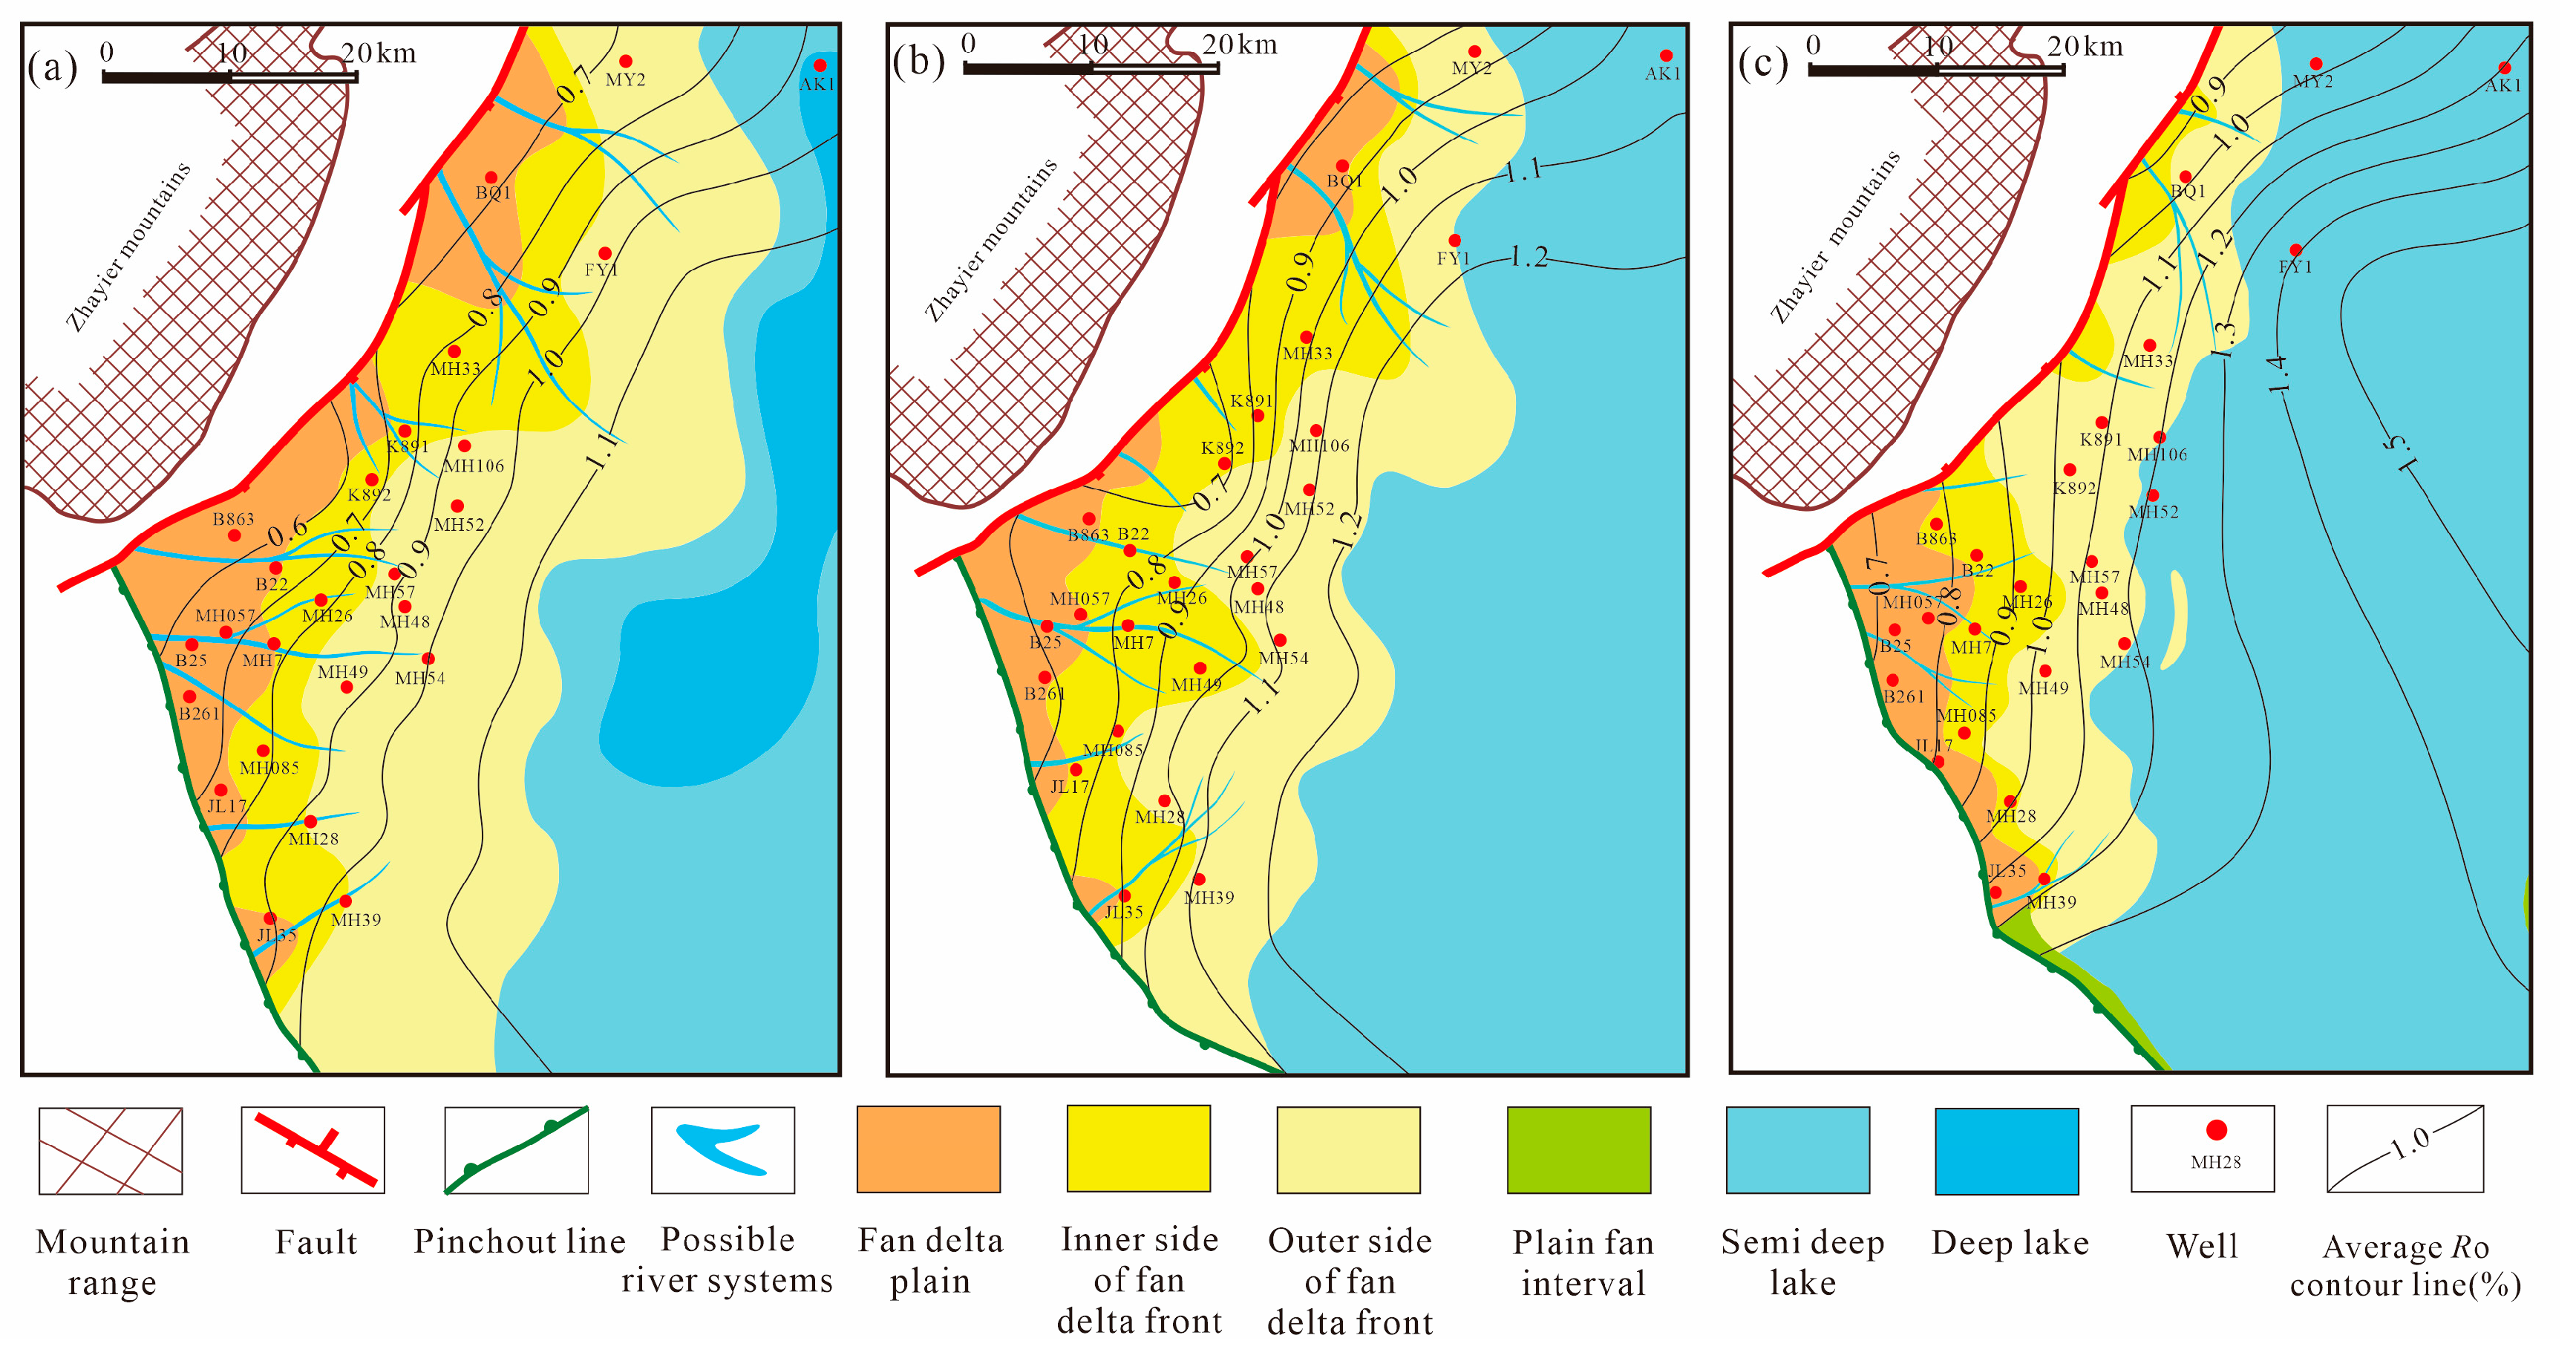
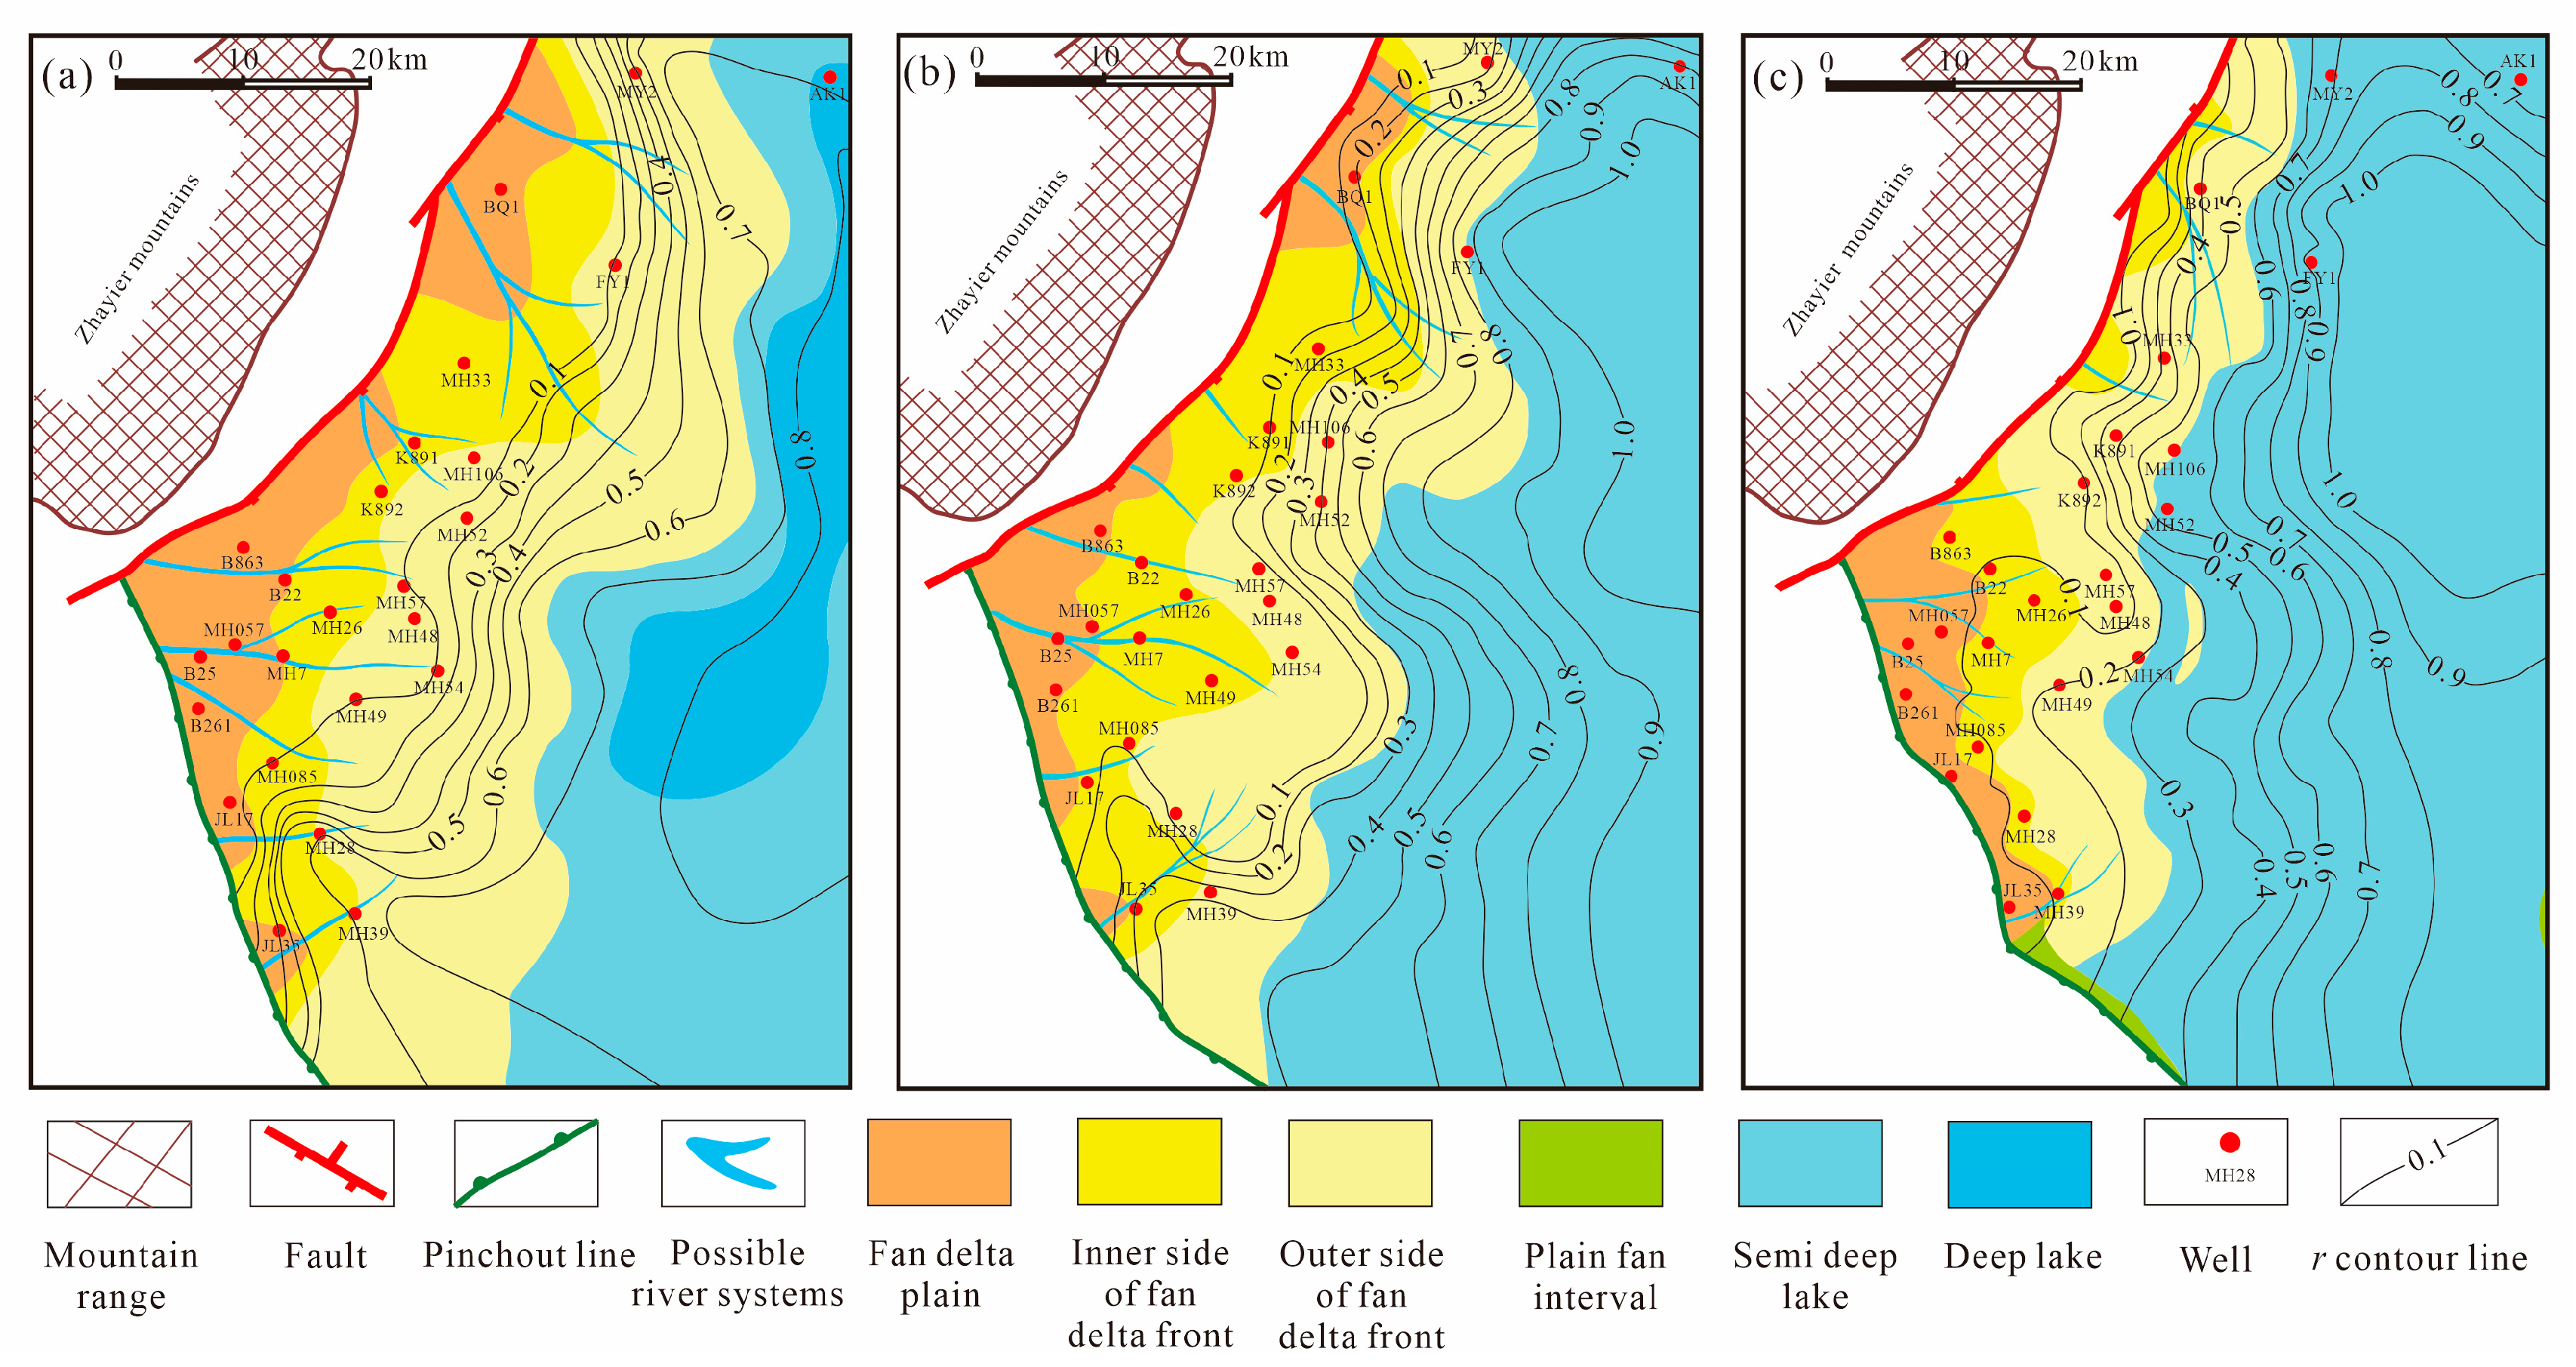
4.2.2. Distribution Characteristics of Source Rocks

According to the shales’ TOC prediction results of a single well, the shales with TOC′ greater than 0.5% were considered as the source rocks. The thickness of each sub source rock layer is accumulated to calculate the source rock thickness of each member. According to the single well’s source rock thickness, the contour maps of source rock thickness from the first, second, and third members of Fengcheng Formation have been drawn, respectively (Figure 7). It can be seen from Figure 7 that the source rock thickness of the first and second members of Fengcheng Formation is between 0~300 m, the source rock thickness of the third member of Fengcheng Formation is between 0~240 m, and the source rock thickness of each member gradually increases from the west to the east and southeast of the sag.

4.3. HGP Characteristics of the Shale Series in Fengcheng Formation

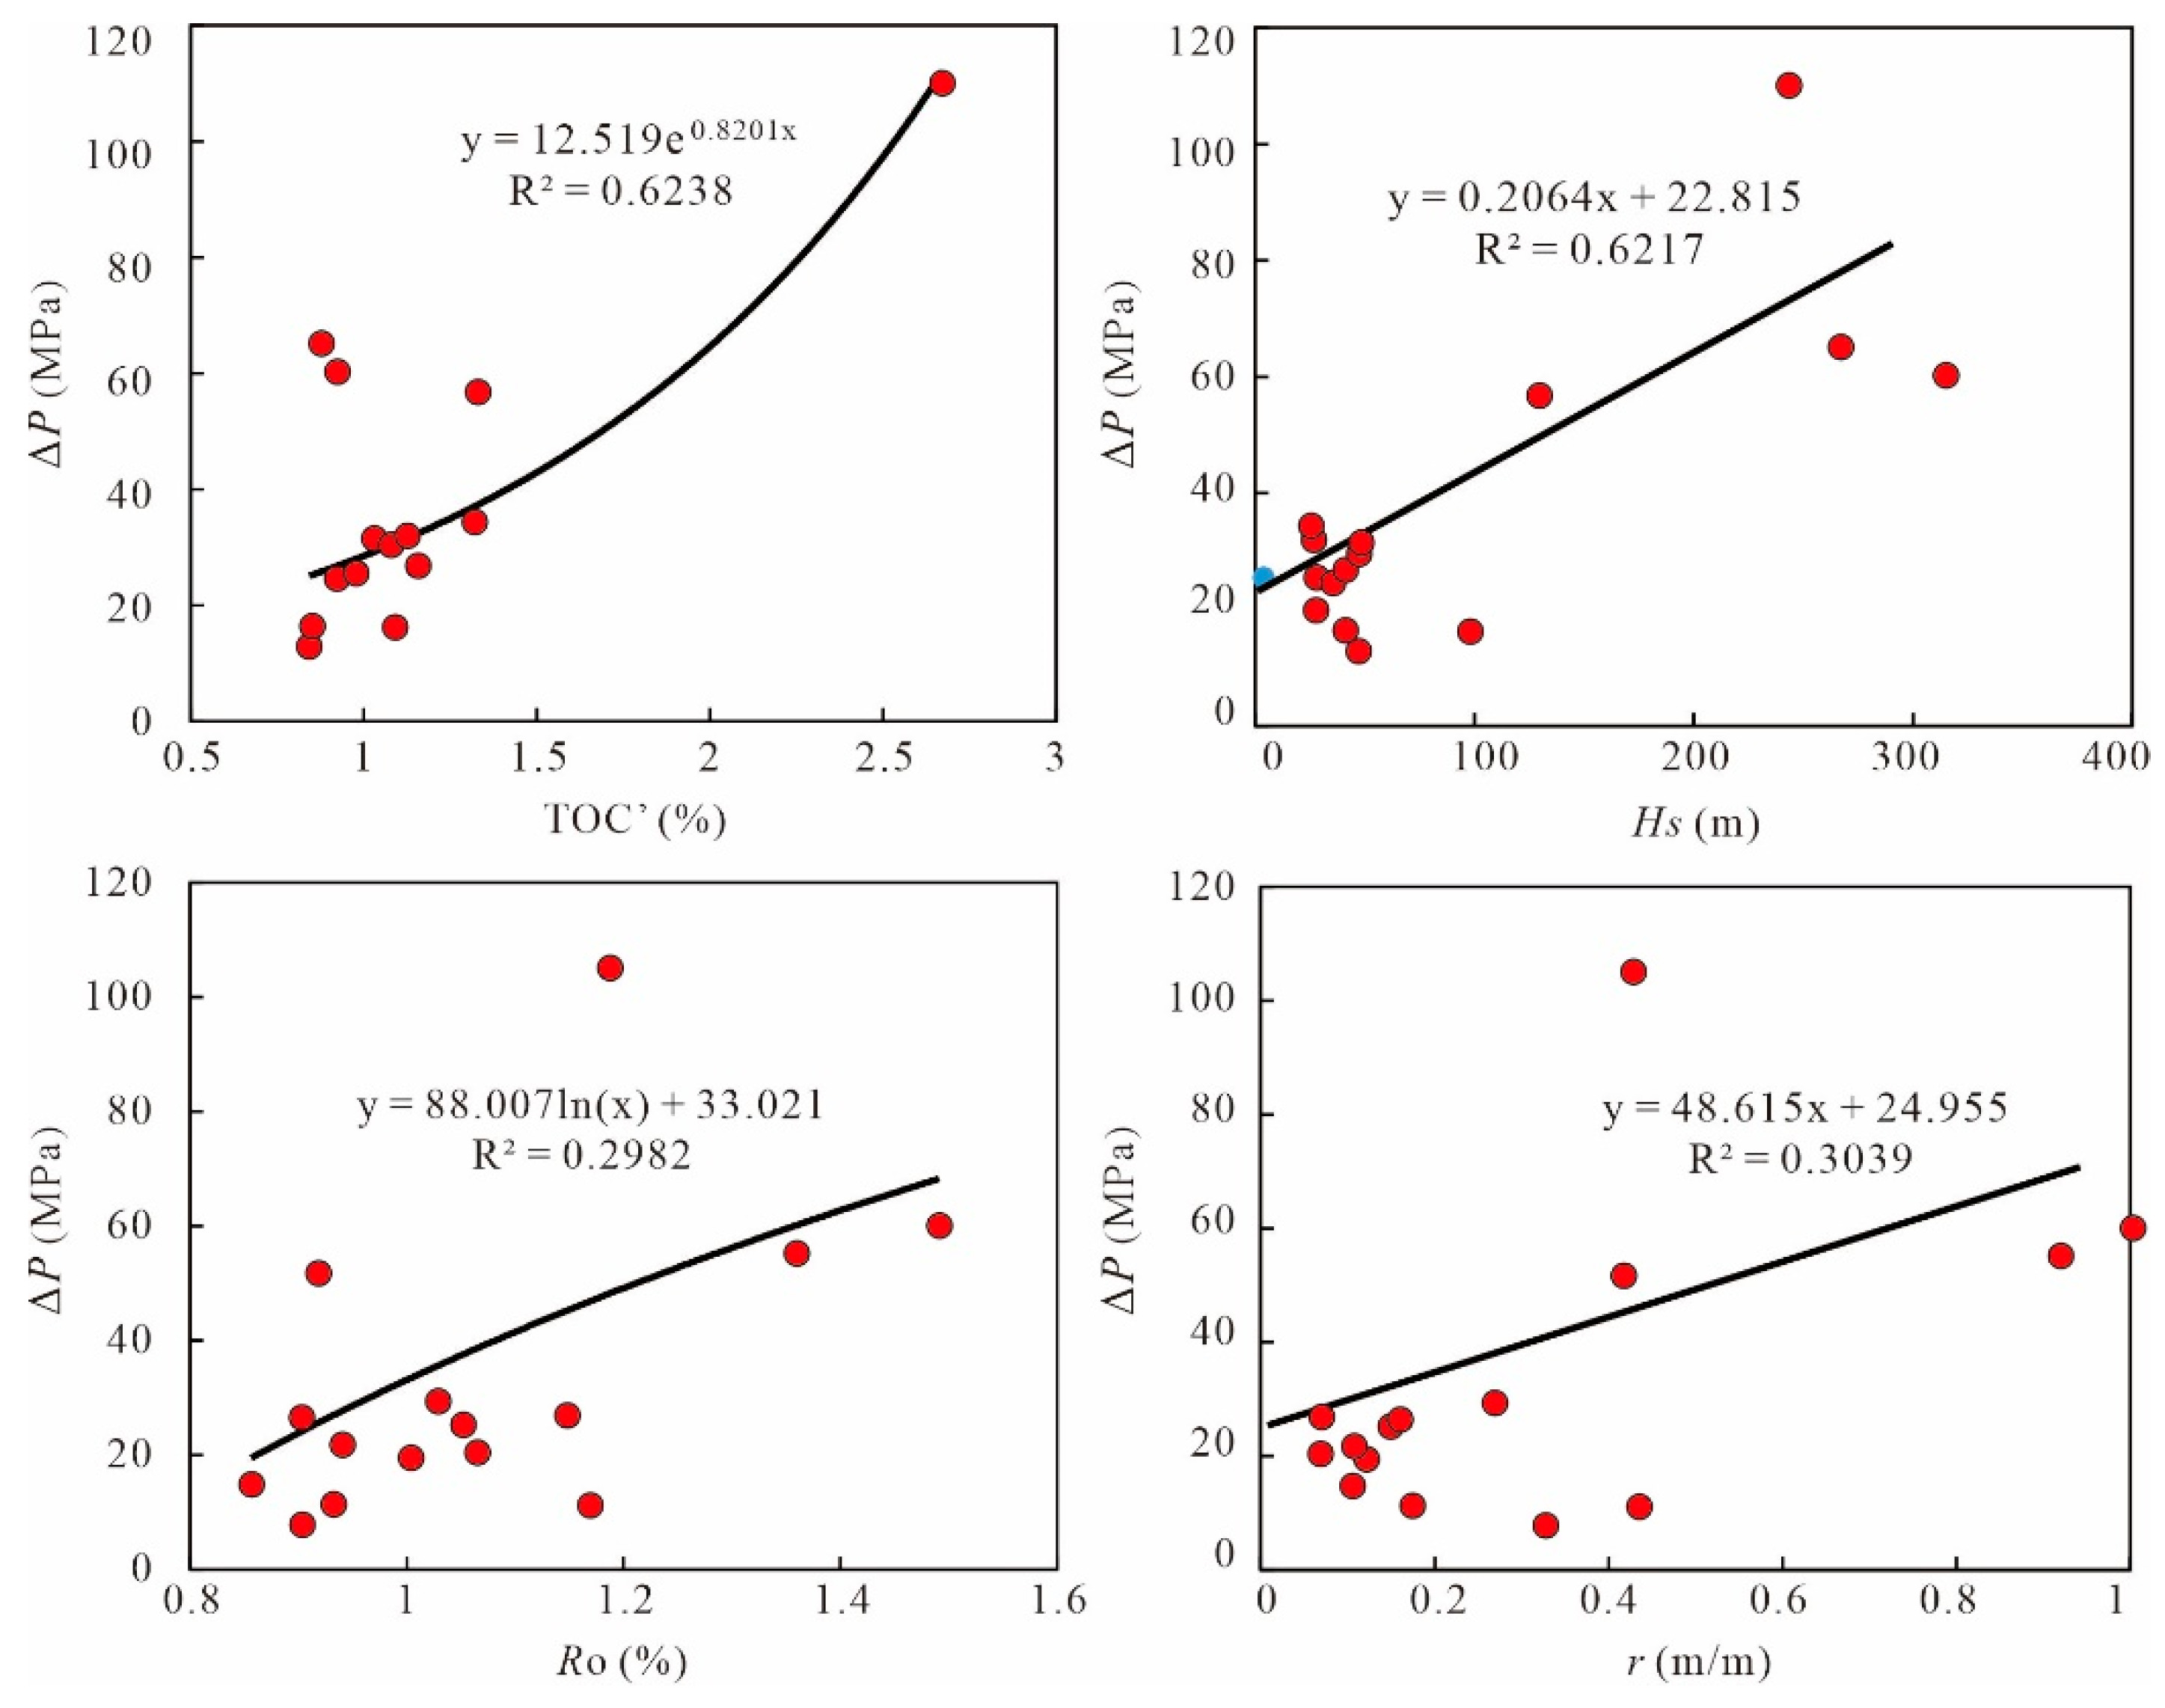
4.3.1. The Relationship between Key Parameters and HGP

According to the average TOC′ of source rocks, the average Ro of source rocks, the thickness of source rocks (Hs), the ratios of mudstone thickness to member thickness (r), and the measured HGP (ΔP) of each member in Fengcheng Formation (Figure 8), the relationship between the average TOC′ of source rocks and the ΔP is an exponential relationship, the relationship between the average Ro of source rocks and the ΔP is a logarithmic relationship, the relationship between the Hs and the ΔP is a linear relationship, and the relationship between the r and the ΔP is also a linear relationship. Among them, the average TOC′ of source rocks and the Hs are most closely related to ΔP, with R2 of 0.6238 and 0.6217, respectively.
Referring to the relationships between the average TOC′ of source rocks, the average Ro of source rocks, the Hs, the r, and the ΔP of each member in Fengcheng Formation, the calculation Formula (2) of HGP was established by using multiple regression method:
ΔP = 0.0000068e0.41TOC′·(ln(Ro) − 106.974)·(Hs + 148.497)·(r − 139.963)·(R2 = 0.894)
In Equation (2), ΔP is the HGP (MPa); TOC′ is the average total organic carbon content of source rocks (%); Ro is the reflectance of Vitrinite (%); Hs is the thickness of source rocks (m); and r is the ratio of mudstone thickness to member thickness (m/m).
The R2 in Equation (2) is 0.894. It can be seen that according to Equation (2), the HGP can be accurately calculated.

4.3.2. Characteristics of Key Parameters

The basin model method of single well was used to simulate the Ro of well MH39. The measured Ro data of shales was used to correct the results, and finally, the variation curve of Ro with depth was obtained (Figure 9). According to the burial depth at the top and bottom of each member of Fengcheng Formation, the average Ro of each member was calculated, and the average Ro contour maps of each member were drawn (Figure 10). On the flat surface, the average Ro values of each member of Fengcheng Formation gradually decrease from east to west. Vertically, the biggest average Ro value of the deepest source rocks in the first member reaches 1.5%, and most of the source rocks formed in the semi-deep lake environment are in the highly mature evolution stage. The biggest average Ro value of the moderately buried source rocks in the second member is about 1.2%, and the source rocks formed in the semi-deep lake environment are in the mature to highly mature evolution stage. The biggest average Ro value of the shallowest source rocks in the third member is about 1.1%, and the source rocks formed in the semi-deep–deep lake environment is in the mature evolution stage.
Based on the lithology logging data, shales are selected and the cumulative shale thickness of each member in Fengcheng Formation is calculated. The shale cumulative thickness is divided by the member thickness to obtain the r of each member. Finally, the r contour maps of each member in Fengcheng Formation are drawn (Figure 11). From Figure 11, it can be seen that the r of each member in Fengcheng Formation gradually increases from the west to the east. The r is related to the sedimentary subfacies. The main rock types of fan delta plain and inner fan delta front subfacies sedimentation are sandstones and conglomerates, while the main rock type of semi-deep–deep lake subfacies sedimentation is shale, indicating that the r of semi-deep–deep lake subfacies is the highest.

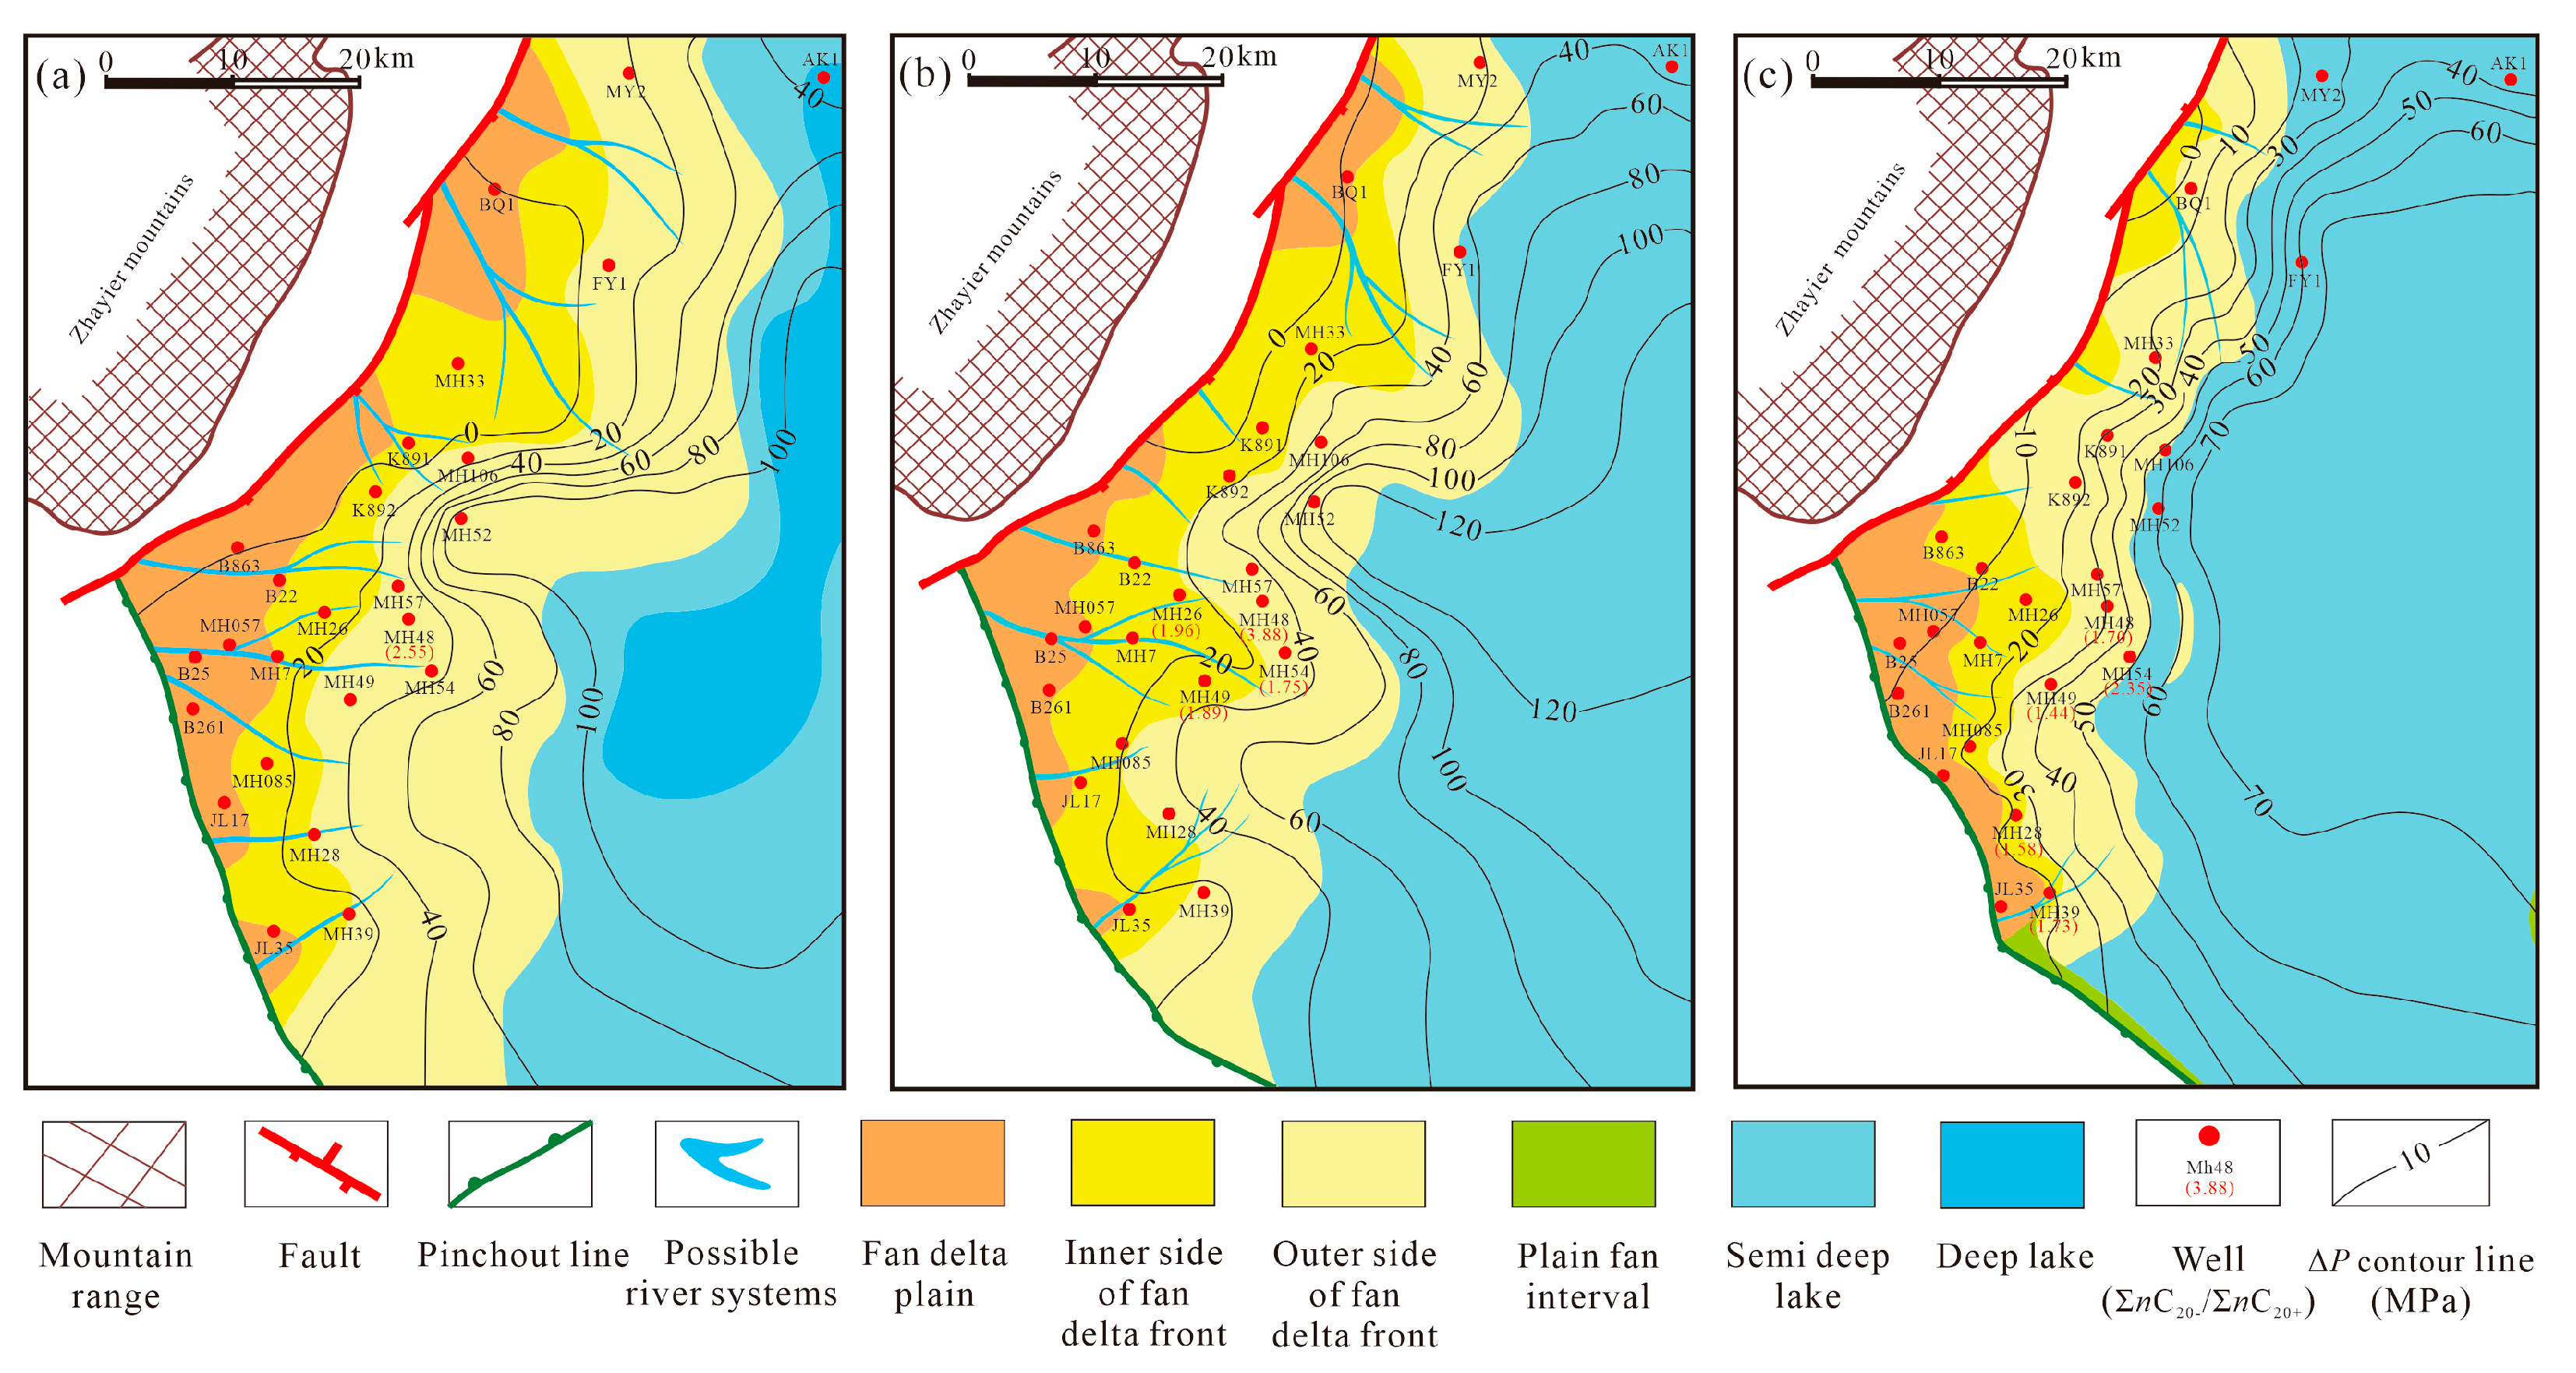
4.3.3. HGP Characteristics

Using formula (2) to calculate the ΔP, combined with the measured ΔP of single wells, the ΔP contour maps of each member in Fengcheng Formation have been obtained (Figure 12). From Figure 12, it can be seen that the ΔP of the first member is between 0 and 70 MPa, the ΔP of the second member is between 0 and 120 MPa, and the ΔP of the third member is between 0 and 100 MPa. The ΔP of each member in Fengcheng Formation gradually increases from the west to the east. The maximum ΔP of each member in Fengcheng Formation are distributed in the semi-deep–deep lake subfacies environment. It can be seen that the semi-deep–deep lake subfacies develop high-quality source rocks and thick shale, which have both good hydrocarbon generation conditions and favorable pressure preservation conditions. The ΔP is the largest in this environment.

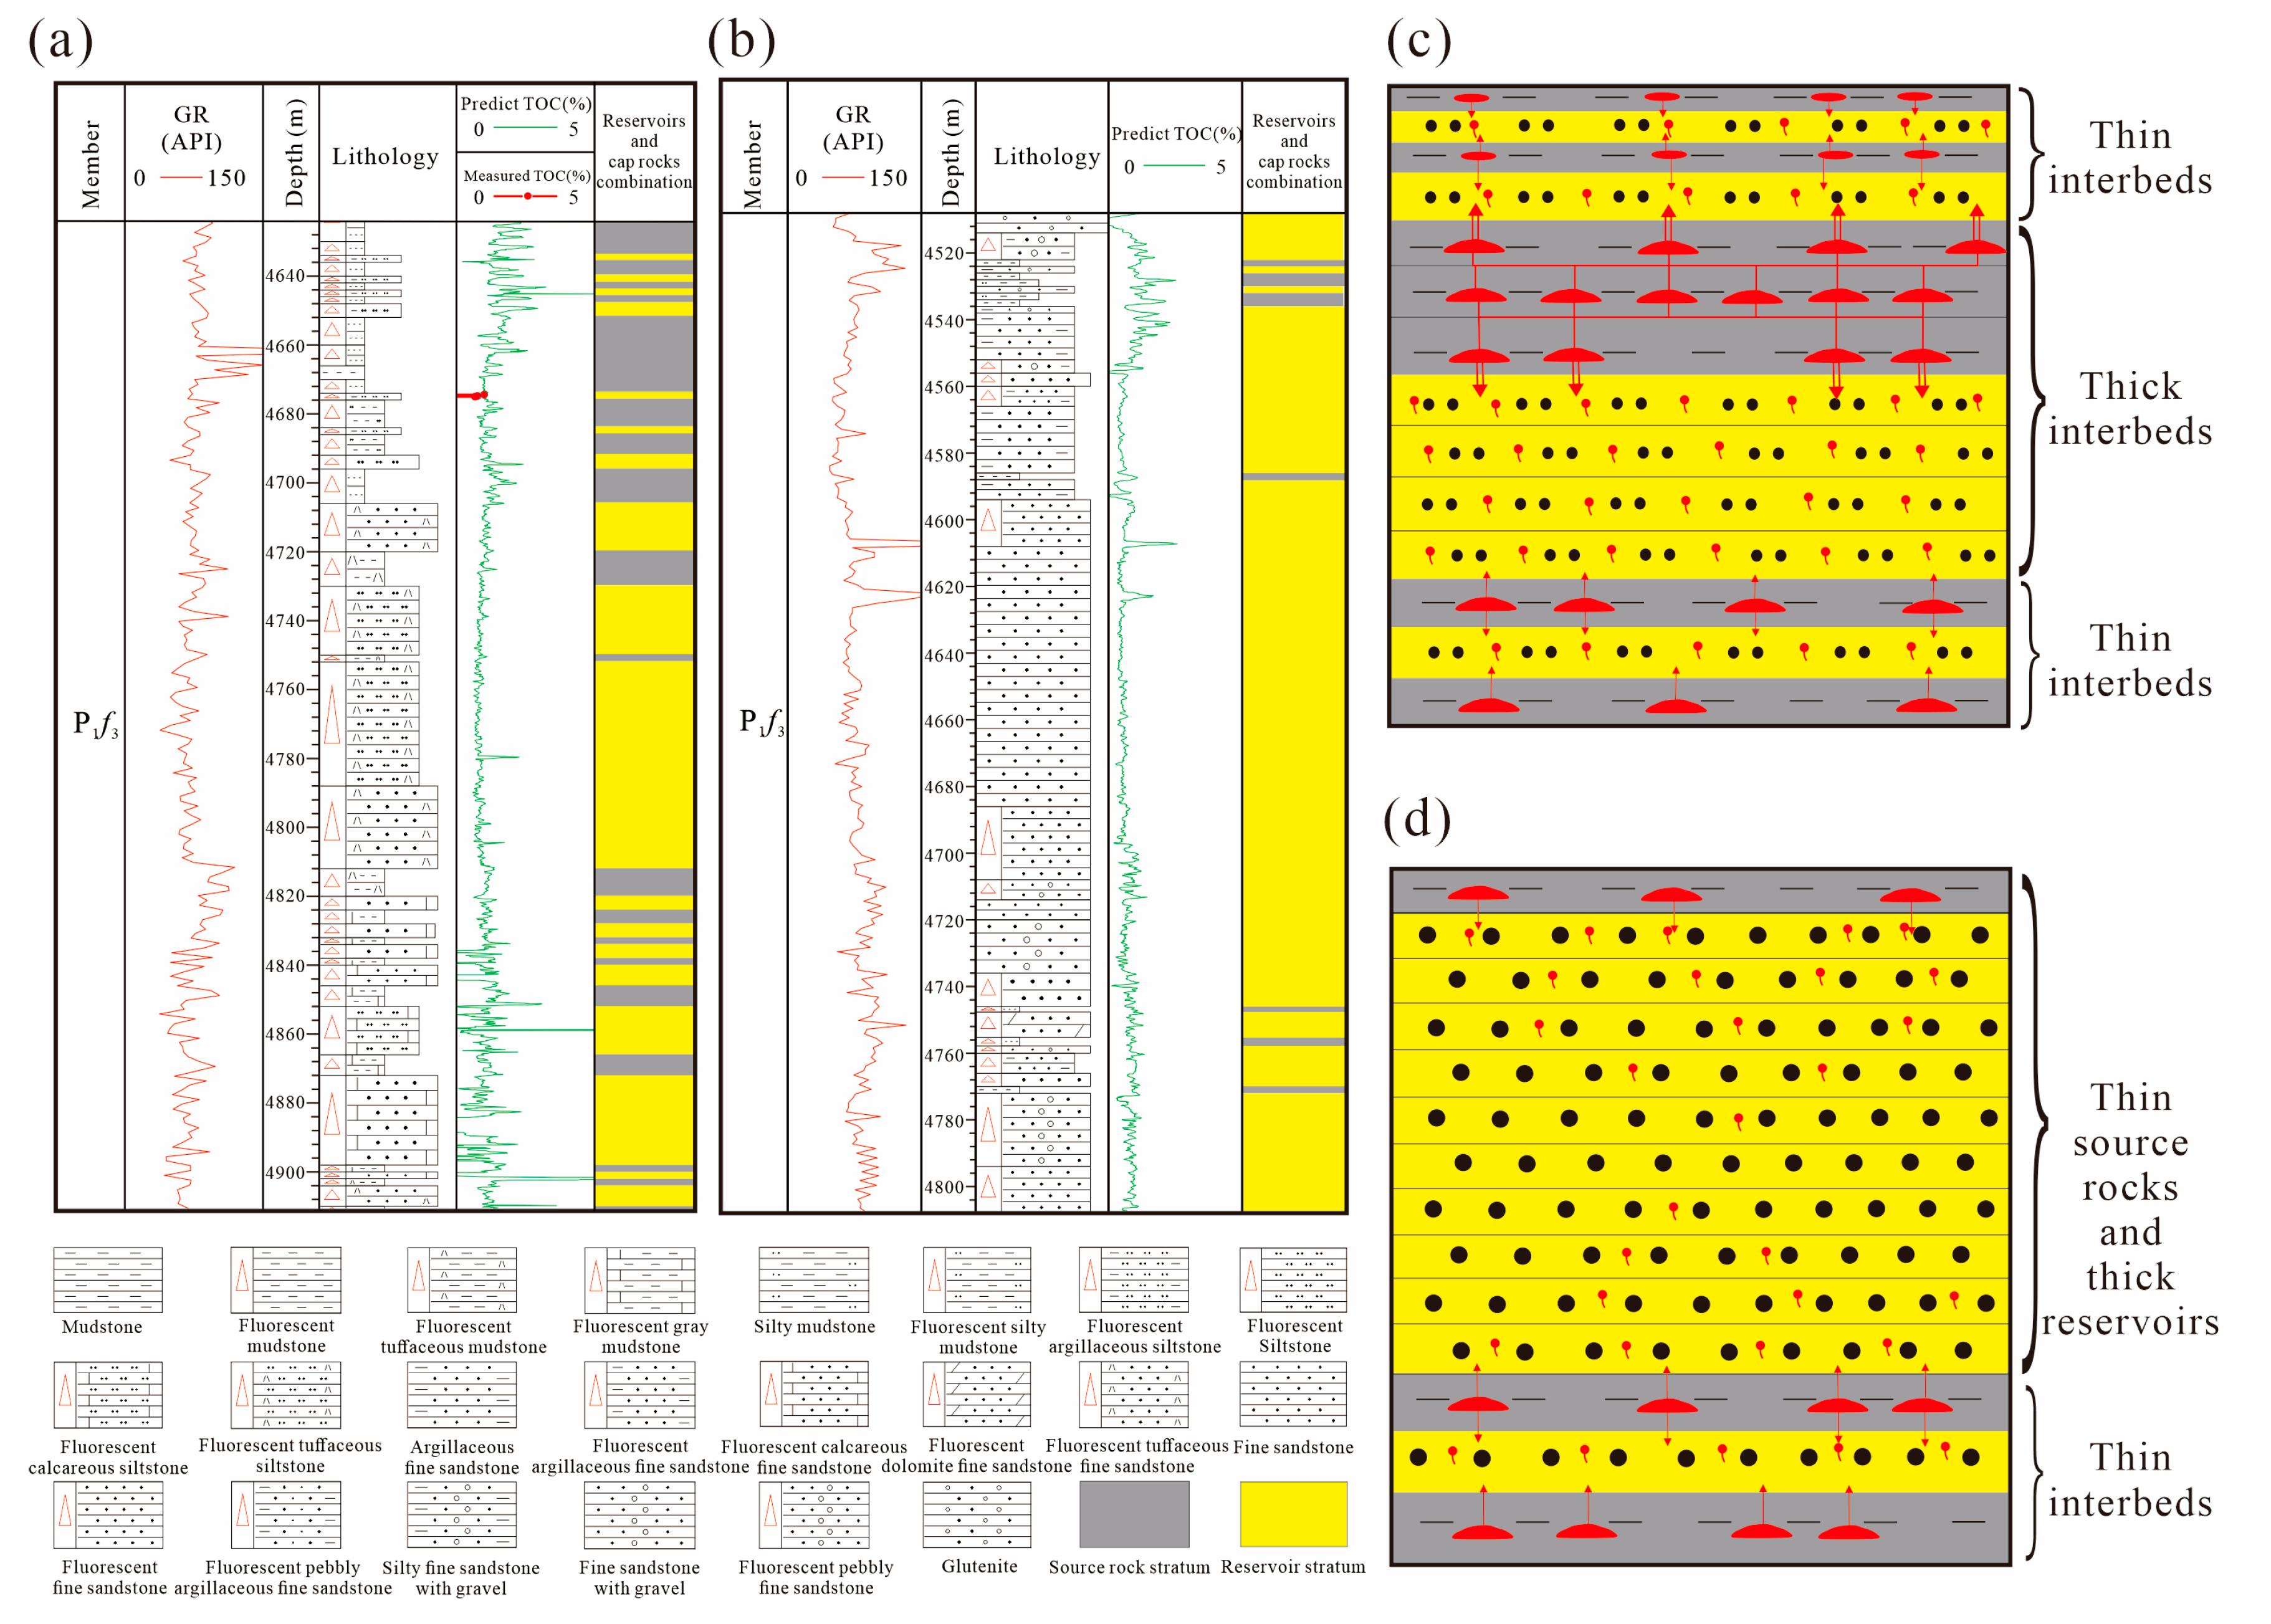
4.4. Microdistance Migration and Accumulation Model of Oil in the Fengcheng Formation Shale Series

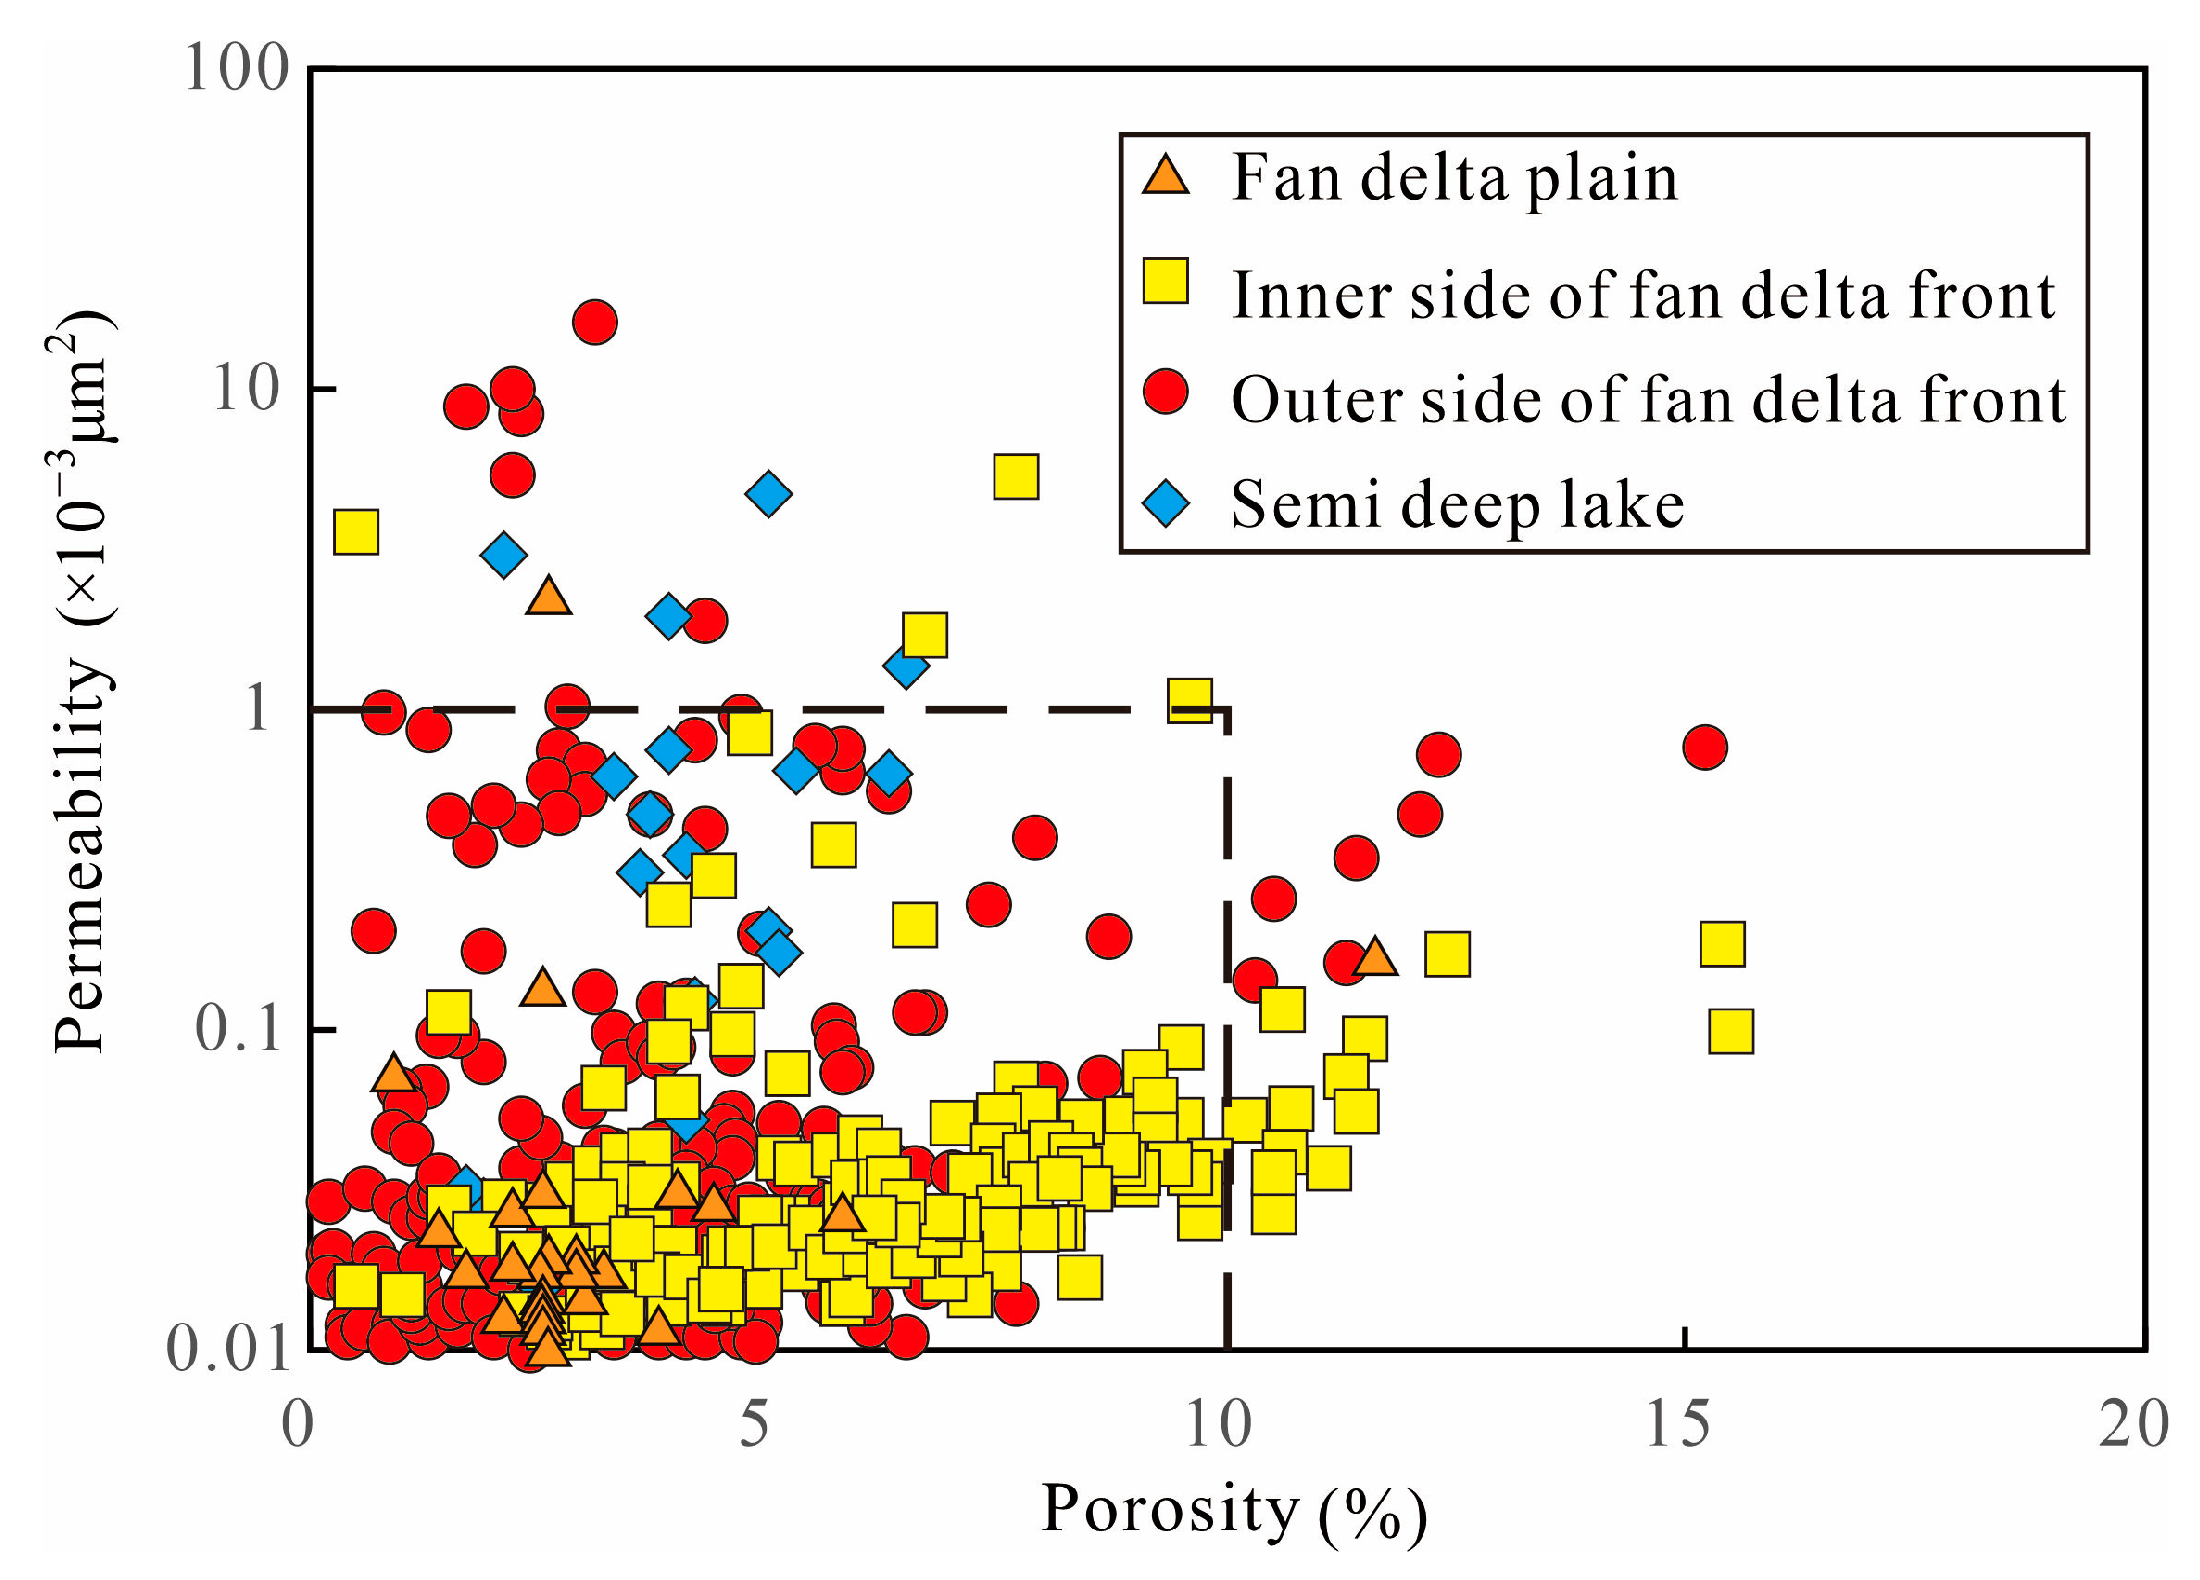
4.4.1. Reservoir Physical Characteristics

The reservoir rocks in the shale series of Fengcheng Formation mainly include glutenite, sandstone, siltstone, and shale. According to the statistical tables (Table 2) and the scattered plots (Figure 13) of porosity and permeability of reservoir rocks in different sedimentary subfacies, it can be concluded that (1) The overall porosity and permeability of Fengcheng Formation reservoir rocks in the west and south of Mahu Sag are very low. (2) Tight reservoir rocks are defined as those with a porosity of less than 10% or a permeability of less than 1 × 10⁻³ μm2. The reservoir rocks of Fengcheng Formation in the west of Mahu Sag are all tight reservoir rocks, while the majority reservoir rocks of Fengcheng Formation in the south of Mahu Sag are tight reservoir rocks. (3) From the distribution range and average values of porosity and permeability of reservoir rocks, it can be seen that the correlation between porosity and permeability of reservoir rocks and sedimentary facies types is not significant. Almost all the reservoir rocks of each sedimentary facies in Fengcheng Formation are tight reservoir rocks.

4.4.2. Geochemical Characteristics of Oil

During the migration of oil, its compound composition will change. In deep formations, under the influence of chromatography, light hydrocarbons in oil easily migrate, while heavy hydrocarbons with high molecular weights migrate with relative difficulty. Therefore, as the migration distance increases, the relative content of light hydrocarbons in oil gradually increases. Based on the results of gas chromatography–mass spectrometry (GC-MS) analysis of saturated hydrocarbons, the light hydrocarbon content (ΣnC20−, sum of contents of n-alkanes with a carbon number less than or equal to 20) and the heavy hydrocarbon content (ΣnC20+, sum of contents of n-alkanes with a carbon number more than 20) of oil from Fengcheng Formation was statistically analyzed, and the relative content of light and heavy hydrocarbons (ΣnC20−nC20+) was calculated. The results are shown in Figure 12. From Figure 12, it can be seen that the ΔP of MH48 in the second member of Fengcheng Formation is significantly greater than its adjacent wells MH26 and MH49, and the well MH48 is closer to the center of the sag, indicating a trend of oil migration from the well MH48 to the wells MH26 and MH49. However, the oil ΣnC20−nC20+ of well MH48 from the second member of Fengcheng Formation is 3.88, which is significantly higher than 1.96 of well MH26 and 1.89 of well MH49, indicating that there is no significant lateral migration of oil in Fengcheng Formation nearby the well MH48. Similar evidence also appears between the wells MH54 and MH48 and the wells MH54 and MH49 in the third member of Fengcheng Formation. Comparing the ΔP of each member in Fengcheng Formation of well MH48, it can be seen that the ΔP of the second member is about 34.5 MPa, and the ΔP of the first and third members are about 30.4 MPa and 29.0 MPa, respectively. The oil from well MH48 of Fengcheng Formation shows a trend of migration from the second member to the first and third members. However, the oil ΣnC20−nC20+ of well MH48 from the second member of Fengcheng Formation is 3.88, significantly higher than the oil ΣnC20−nC20+ from the first and third members (2.55 and 1.70, respectively), which indicates that the oil of well MH48 did not migrate from the second member to the first and third members of Fengcheng Formation. According to the physical properties of the reservoir rocks in Fengcheng Formation, although there is a difference in formation pressure within Fengcheng Formation, it is still difficult for oil to migrate laterally and vertically in tight rocks, and the oil generated from the source rocks can only migrate to its adjacent reservoirs.

4.4.3. Microdistance Migration and Accumulation Model of Oil

In the shale series of fan delta front subfacies in Fengcheng Formation of Mahu Sag, shale source rocks are interbedded with tight sandstone and siltstone reservoir rocks. According to the exploration results of Xinjiang Oilfield Company, the daily production of a single well in the shale series of Fengcheng Formation is linearly and positively correlated with the formation pressure coefficient, and exponentially and positively correlated with the TOC of source rock (Figure 14). Through analysis, it is believed that shale source rocks produce formation overpressure in the process of hydrocarbon generation. In addition to meeting their own storage requirements, excess hydrocarbons are discharged under the action of formation overpressure, and then, they migrate through a small distance into the adjacent tight sandstone and siltstone reservoir rocks. With the transmission of overpressure, overpressure reservoirs were formed. High quality source rocks have a large amount of hydrocarbon expulsion and a large amount of HGP, thus forming an overpressure and high-yield reservoir.
According to the thickness ratios of shale source rocks and tight sandstone–siltstone reservoir rocks in the formation, it can be further divided into: (1) Oil reservoirs’ forming mode of weak overpressure and low production (Figure 14d). The shale source rocks in the formation have a small thickness ratio, low organic matter abundance, and a small total amount of hydrocarbon generated. When the hydrocarbons are discharged into thick sandstone and siltstone reservoirs, the sandstones with unit thickness obtain less hydrocarbons, and the pore fluid volume of reservoir rocks do not increase significantly. Weak formation overpressure is developed in the reservoir rocks, forming the weak overpressure and low production oil reservoirs, For example, in the third member of well MH48 (Figure 14b), the r is 0.05; the average TOC′ value of source rocks is 0.906%; the ΔP is 29 MPa, and the daily oil production is 12.59 t. (2) Oil reservoirs’ have forming mode of strong overpressure and high production (Figure 14c). The shale source rocks in the formation have a large thickness ratio, high organic matter abundance, and a large amount of generated hydrocarbon. When the hydrocarbons are discharged into thin sandstone and siltstone reservoirs, the sandstones with unit thickness obtain more hydrocarbons, and the pore fluid volume of reservoir rocks increases significantly. Strong formation overpressure is developed in the reservoir rocks, forming the strong overpressure and high production oil reservoirs. For example, in the third member of well MH52 (Figure 14a), the r is 0.36; the average TOC′ value of source rocks is 0.937%; the ΔP is 104 MPa, and the daily oil production is 23.37 t.

5. Conclusions

(1)
The Permian Fengcheng Formation shale in the west and south of Mahu Sag does not exhibit obvious undercompaction characteristics, and HGP should be the main cause of overpressure in the Fengcheng Formation shale series.
(2)
The logging data of Fengcheng Formation is related to the measured organic matter abundance of the shale source rocks and can be used to predict the organic matter abundance of the shale source rocks. The predicted organic matter abundance and thickness of the source rocks gradually decrease from the east to the west.
(3)
The ΔP of shale series in Fengcheng Formation is related to the hydrocarbon generation capacity and overpressure preservation conditions. The ΔP can be quantitatively predicted by comprehensively using the TOC′, Ro, Hs, and r. The ΔP of the shale series in Fengcheng Formation also has a distribution characteristic of gradually decreasing from the east to the west.
(4)
The oil reservoirs’ forming mode of the Fengcheng Formation shale series is the microdistance migration and accumulation model driven by the overpressure. It can be further divided into the oil reservoirs’ forming mode of weak overpressure and low production and the oil reservoirs’ forming mode of strong overpressure and high production.

Author Contributions

Conceptualization, C.F.; Methodology, C.F.; Software, X.W. (Xin Wang); Validation, C.F.; Formal analysis, C.F. and X.W. (Xin Wang); Investigation, C.F. and X.W. (Xin Wang); Data curation, X.W. (Xin Wang), S.B., Y.B., J.Z., M.L., Q.Z. and X.W. (Xun Wang); Writing—original draft, C.F.; Writing—review & editing, C.F.; Supervision, C.F.; Project administration, C.F. All authors have read and agreed to the published version of the manuscript.

Funding

This research was supported by the first scientific and technological innovation talents in Karamay, Xinjiang Uygur Autonomous Region, backbone scientific and technological innovation talents.

Data Availability Statement

All data can be found in the text.

Conflicts of Interest

The authors declare no conflict of interest.

References

  1. Zhang, Y.; Li, W.; Tang, W. Tectonic setting and environment of alkaline lacustrine source rocks in the lower permian Fengcheng Formation of Mahu sag. Xinjing Pet. Geol. 2018, 39, 48–54. [Google Scholar]
  2. Zhang, Z.; Yuan, X.; Wang, M.; Zhou, C.; Cheng, D. Alkaline-lacustrine deposition and paleoenvironmental evolution in permian Fengcheng Formation at the Mahu sag, Junggar Basin, NW China. Petrol. Explor. Dev. 2018, 45, 1036–1049. [Google Scholar] [CrossRef]
  3. Zhi, D.; Tang, Y.; He, W.; Guo, X.; Zheng, M.; Huang, L. Orderly coexistence and accumulation models of conventional and unconventional hydrocarbons in lower permian Fengcheng Formation, Mahu sag, Junggar Basin. Petrol. Explor. Dev. 2021, 48, 43–59. [Google Scholar] [CrossRef]
  4. Zhi, D.; Tang, Y.; Zheng, M.; Xu, Y.; Cao, J.; Ding, J.; Zhao, C. Geological characteristics and accumulation controlling factors of shale reservoirs in Fengcheng Formation, Mahu sag, Junggar Basin. China Petrol. Explor. 2019, 24, 615–623. [Google Scholar]
  5. Kuang, L.; Tang, Y.; Lei, D.; Chang, Q.; Ouyang, M.; Hou, L.; Liu, D. Formation conditions and exploration potential of tight oil in the Permian saline lacustrine dolomitic rock, Junggar Basin, NW China. Petrol. Explor. Dev. 2012, 39, 657–667. [Google Scholar] [CrossRef]
  6. Liu, B.; Shi, J.; Fu, X.; Lv, Y.; Sun, X.; Gong, L.; Bai, F. Petrological characteristics and shale oil enrichment of lacustrine fine-grained sedimentary system: A case study of organic-rich shale in first member of Cretaceous Qingshankou Formation in Gulong Sag, Songliao Basin, NE China. Petrol. Explor. Dev. 2018, 45, 828–838. [Google Scholar] [CrossRef]
  7. Zheng, M.; Li, J.; Wang, W.; Li, P.; Yang, H.; Wu, X.; Yu, J. Analysis of Oil Charging and Accumulation Processes in Tight Reservoir Beds: A Case Study of Lucaogu Formation in Jimsar Sag of Junggar Basin, NW China. Earth Sci. 2018, 43, 3719–3732. [Google Scholar]
  8. Guo, X.; He, S.; Liu, K.; Song, G.; Wang, X.; Shi, Z. Oil generation as the dominant overpressure mechanism in the Cenozoic Dongying Depression, Bohai Bay Basin, China. AAPG Bull. 2010, 94, 1859–1881. [Google Scholar] [CrossRef]
  9. Song, M.; Liu, H.; Wang, Y.; Liu, Y. Enrichment rules and exploration practices of Paleogene shale oil in Jiyang Depression, Bohai Bay Basin, China. Petrol. Explor. Dev. 2020, 47, 225–235. [Google Scholar] [CrossRef]
  10. Xue, Y.; Ranjith, P.G.; Gao, F.; Zhang, Z.; Wang, S. Experimental investigations on effects of gas pressure on mechanical behaviors and failure characteristic of coals. J. Rock. Mech. Geotech. Eng. 2023, 15, 412–428. [Google Scholar] [CrossRef]
  11. Wang, L.Y.; Chen, W.Z.; Zhang, Y. Investigating Effects of Heterogeneity and Fracture Distribution on Two-Phase Flow in Fractured Reservoir with adaptive time strategy. Transp. Porous Media 2023, 149, 175–203. [Google Scholar] [CrossRef]
  12. Liu, H.; Yu, B.; Xie, Z.; Han, S.; Shen, Z.; Bai, C. Characteristics and implications of micro-lithofacies in lacustrine-basin organic-rich shale: A case study of Jiyang depression, Bohai Bay Basin. Acta Pet. Sin. 2018, 39, 1328–1343. [Google Scholar]
  13. Yang, H.; Liang, X.; Niu, X.; Feng, S.; You, Y. Geological conditions for continental tight oil formation and the main controlling factors for the enrichment: A case of Chang 7 Member, Triassic Yan chang Formation, Ordos Basin, NW China. Petrol. Explor. Dev. 2017, 44, 12–20. [Google Scholar] [CrossRef]
  14. Fu, S.; Fu, J.; Niu, X.; Li, S.; Wu, Z.; Zhou, X.; Liu, J. Accumulation conditions and key exploration and development technologies in Qingcheng oilfield. Acta Pet. Sin. 2020, 41, 777–795. [Google Scholar]
  15. Li, J.; Tang, Y.; Wu, T.; Zhao, J.; Wu, H.; Wu, W.; Bai, Y. Overpressure origin and its effects on petroleum accumulation in the conglomerate oil province in Mahu Sag, Junggar Basin, NW China. Petrol. Explor. Dev. 2020, 47, 679–690. [Google Scholar] [CrossRef]
  16. Feng, C.; Lei, D.W.; Qu, J.H.; Huo, J.Z. 2019. Controls of paleo-overpressure, faults and sedimentary facies on the distribution of the high pressure and high production oil pools in the lower Triassic Baikouquan Formation of the Mahu Sag, Junggar Basin, China. J. Pet. Sci. Eng. 2019, 176, 232–248. [Google Scholar]
  17. Dewen, L.E.; Abulimiti, T.; Jing, C.H.; Jian, C.A. Controlling factors and occurrence prediction of high oil-gas production zones in Lower Triassic Baikouquan Formation of Mahu Sag in Junggar Basin. Xinjiang Pet. Geol. 2014, 35, 495–499. [Google Scholar]
  18. Liu, G.; Chen, Z.; Wang, X.; Gao, G.; Xiang, B.; Ren, J.; Ma, W. Migration and accumulation of crude oils from Permian lacustrine source rocks to Triassic reservoirs in the Mahu depression of Junggar Basin, NW China: Constraints from pyrrolic nitrogen compounds and fluid inclusion analysis. Org. Geochem. 2016, 101, 82–98. [Google Scholar] [CrossRef]
  19. Liang, Y.; Zhang, Y.; Chen, S.; Guo, Z.; Tang, W. Controls of a strike-slip fault system on the tectonic inversion of the Mahu depression at the northwestern margin of the Junggar Basin, NW China. J. Asian Earth Sci. 2020, 198, 104229. [Google Scholar] [CrossRef]
  20. Hu, T.; Pang, X.; Yu, S.; Wang, X.; Pang, H.; Guo, J.; Jiang, F.; Shen, W.; Wang, Q.; Xu, J. Hydrocarbon generation and expulsion characteristics of Lower Permian P1f source rocks in the Fengcheng area, northwest margin, Junggar Basin, NW China: Implications for tight oil accumulation potential assessment. Geol. J. 2016, 51, 880–900. [Google Scholar] [CrossRef]
  21. Cao, J.; Xia, L.; Wang, T.; Zhi, D.; Tang, Y.; Li, W. An alkaline lake in the Late Paleozoic Ice Age (LPIA): A review and new insights into paleoenvironment and petroleum geology. Earth Sci. Rev. 2020, 202, 103091. [Google Scholar] [CrossRef]
  22. Wang, T.; Cao, J.; Carroll, A.R.; Zhi, D.; Tang, Y.; Wang, X.; Li, Y. Oldest preserved sodium carbonate evaporite: Late Paleozoic Fengcheng Formation, Junggar Basin, NW China. GSA Bull. 2020, 133, 1465–1482. [Google Scholar] [CrossRef]
  23. Xiang, B.; Ma, W.; He, D.; Pan, Y. Heterogeneity of alkaline lacustrine source rocks of the lower Permian Fengcheng Formation in the Mahu Sag, Junggar Basin, northwestern China. Energy Explor. Exploit. 2023, 41, 370–390. [Google Scholar] [CrossRef]
  24. Yu, K.; Cao, Y.; Qiu, L.; Sun, P. Depositional environments in an arid, closed basin and their implications for oil and gas exploration: The lower Permian Fengcheng Formation in the Junggar Basin, China. AAPG (Am. Assoc. Pet. Geol.) Bull. 2019, 103, 2073–2115. [Google Scholar] [CrossRef]
  25. Cao, J.; Lei, D.; Li, Y.; Tang, Y.; Wang, T. Ancient high-quality alkaline lacustrine source rocks discovered in the lower permian Fengcheng Formation, Junggar Basin. Acta Pet. Sin. 2015, 36, 781–790. [Google Scholar]
  26. Xia, L.; Cao, J.; Stüeken, E.E.; Zhi, D.; Wang, T.; Li, W. Unsynchronized evolution of salinity and pH of a Permian alkaline lake influenced by hydrothermal fluids: A multi-proxy geochemical study. Chem. Geol. 2020, 541, 119581. [Google Scholar] [CrossRef]
  27. Wang, J.; Liu, Y.; Wan, C.; Zhu, X.; Wang, X.; Ge, J.; Zhang, X. Characteristics and origin of dolomitic tuff in the Permian Fengcheng Formation in Wu-Xia area of Junggar Basin. J. Palaeogeogr. 2014, 16, 157–168. [Google Scholar]
  28. Lei, D.; Abulimit, I.; Qin, Z.; Cao, J.; Chen, G.; Yang, H.; Bian, B.; Zhao, L.; Yao, A. Origin and Occurrence of the Light Oil and Gas in the Alkaline Lake of Mahu Sag, Junggar Basin; China Science Publishing & Media Ltd.: Beijing, China, 2017. [Google Scholar]
  29. Feng, C.; Li, T.; He, W.; Zheng, M. Organic geochemical traits and paleodepositional conditions of source rocks from the Carboniferous to Permian sediments of the northern Mahu Sag, Junggar Basin, China. J. Petrol. Sci. Eng. 2020, 191, 107117. [Google Scholar] [CrossRef]
  30. Chen, G.; Wang, D.; Yang, F.; Tang, Y.; Zou, X.; Ma, W.; Li, M. Organic geochemistry and controlling factors of alkaline source rocks within sequence stratigraphic framework in the Fengcheng Formation, Mahu sag, Junggar Basin, NW China. Energy Explor. Exploit. 2022, 40, 1057–1077. [Google Scholar] [CrossRef]
  31. Yu, K.; Cao, Y.; Qiu, L.; Sun, P.; Jia, X.; Wan, M. Geochemical characteristics and origin of sodium carbonates in a closed alkaline basin: The Lower Permian Fengcheng Formation in the Mahu Sag, northwestern Junggar Basin, China. Palaeogeogr. Palaeoclimatol. Palaeoecol. 2018, 511, 506–531. [Google Scholar] [CrossRef]
  32. Bowers, G.L. Detecting high overpressure. Lead. Edge 2002, 21, 174–177. [Google Scholar] [CrossRef]
  33. Bowers, G.L. Pore pressure estimation from velocity data: Accounting for overpressure mechanisms besides under compaction. SPE 1995, 10, 27488. [Google Scholar] [CrossRef]
  34. Tingay, M.R.; Morley, C.K.; Laird, A.; Limpornpipat, O.; Krisadasima, K.; Pabchanda, S.; Macintyre, R. Evidence for overpressure generation by kerogen-to-gas maturation in the northern Malay Basin. AAPG Bull. 2013, 97, 639–672. [Google Scholar] [CrossRef]
  35. Lahann, R.W.; Swarbrick, R.E. Overpressure generation by load transfer following shale framework weakening due to smectite diagenesis. Geofluids 2011, 11, 362–375. [Google Scholar] [CrossRef]
  36. Gao, G.; Liu, S.J.; Jin, J. A new discovery of physical property evolution of crude oil and insights into shale oil exploration. Acta Geol. Sin. 2023, 97, 1561–1575. [Google Scholar]
Figure 1. The research area and lithology: (a) location of Junggar Basin; (b) location of the research area; (c) sedimentary characteristics and well location; and (d) lithological histogram of Fengcheng Formation.
Processes 11 02847 g001
Figure 2. Compaction curve characteristics of shales in Fengcheng Formation. The locations of the sections are shown in Figure 1. (a) A cross-section in the north-south direction; (b) A cross-section in the east-west direction.
Processes 11 02847 g002
Figure 3. Comparison between the measured formation pressure of Fengcheng Formation and the predicted shale formation pressure using the equilibrium depth method.
Processes 11 02847 g003
Figure 4. Identification of formation overpressure genesis in well MH48 by the Bowers method: (a) scattered plot of sonic and depth of shale and (b) scattered plot of vertical effective stress and acoustic velocity of shales.
Processes 11 02847 g004
Figure 5. (a) Comparison of the distribution range of measured TOC and predicted TOC′ in Fengcheng Formation shales. (b) Correlation between measured TOC and predicted TOC′ in Fengcheng Formation shales.
Processes 11 02847 g005
Figure 6. Average TOC′ contour map of source rocks in Fengcheng Formation: (a) first member of Fengcheng Formation; (b) second member of Fengcheng Formation; and (c) third member of Fengcheng Formation.
Processes 11 02847 g006
Figure 7. Thickness contour map of source rocks in Fengcheng Formation: (a) first member of Fengcheng Formation; (b) second member of Fengcheng Formation; and (c) third member of Fengcheng Formation.
Processes 11 02847 g007
Figure 8. The relationship between key parameters and HGP of Fengcheng Formation.
Processes 11 02847 g008
Figure 9. Relationship between Ro and depth of well MH39 in Mahu Sag.
Processes 11 02847 g009
Figure 10. Average Ro contour maps of source rocks in Fengcheng Formation: (a) first member of Fengcheng Formation; (b) second member of Fengcheng Formation; and (c) third member of Fengcheng Formation.
Processes 11 02847 g010
Figure 11. The r contour maps of each member in Fengcheng Formation: (a) first member of Fengcheng Formation; (b) second member of Fengcheng Formation; and (c) third member of Fengcheng Formation.
Processes 11 02847 g011
Figure 12. The ΔP contour maps of each member in Fengcheng Formation: (a) first member of Fengcheng Formation; (b) second member of Fengcheng Formation; and (c) third member of Fengcheng Formation.
Processes 11 02847 g012
Figure 13. Scattered plot of porosity and permeability of reservoir rocks in the Fengcheng Formation shale series.
Processes 11 02847 g013
Figure 14. Microdistance migration and accumulation model of oil in shale series of Fengcheng Formation: (a) combination of reservoir forming elements of well MH52 in the third member of Fengcheng Formation; (b) combination of reservoir forming elements of well MH48 in the third member of Fengcheng Formation; (c) the oil reservoirs’ forming mode of weak overpressure and low production; and (d) the oil reservoirs’ forming mode of strong overpressure and high production.
Processes 11 02847 g014
Table 1. Measured TOC and predicted TOC of the Fengcheng Formation shales.
WellDepth
(m)
LithologyMeasured TOC
(%)
Predict TOC (%)Absolute ErrorRelative
Error
(%)
DEN (g/cm3)AC
(μm/ft)
GR
(API)
RI
(Ω•m)
SP
(mv)
RXO
(Ω•m)
CALI
(cm)
RT
(Ω•m)
CNL
(v/v)
MH395119.14Mudstone3.342.560.7823.262.4873.51488.22715.197−37.24713.858.36514.55726.566
MH395119.2Mudstone3.082.560.5216.942.48175.82686.62411.783−37.28911.4128.35111.2827.571
MH395119.52Mudstone3.852.261.5941.252.48184.17799.63812.219−37.45914.0198.43111.88829.291
MH395119.85Mudstone2.132.360.2310.632.49183.48489.55111.5−37.78610.5418.50711.58830.374
MH395120.01Mudstone1.942.350.4121.022.5181.22981.09212.368−37.9499.9488.38912.50929.454
MH395120.34Mudstone1.551.710.1610.542.5878.69684.65413.586−38.15211.9028.39313.8526.427
MH395120.64Mudstone1.021.430.4139.942.61275.15877.57215.56−38.39413.1258.43416.08922.428
MH395121.93Mudstone0.921.650.7379.302.57879.61485.4169.235−38.9497.5428.5169.93126.525
MH395122Mudstone1.11.640.5449.342.58280.10983.8969.313−39.0027.5558.5239.98726.837
MH395340Tuffaceous mudstone0.971.300.3334.442.60358.6177.0166.842−64.2157.4468.3017.4319.553
MH395341.4Tuffaceous mudstone0.881.200.3236.702.59964.00284.1866.99−65.0283.9288.3268.09112.138
MH395342Tuffaceous mudstone1.181.180.000.182.60466.43597.9454.138−65.6243.7568.3264.88415.904
MH395343.81Tuffaceous mudstone1.381.710.3323.722.5866.29280.693.843−67.7753.1288.3964.73418.414
MH525286.93Calcareous mudstone0.870.870.000.202.69956.63989.119201.977−514.4945.1478.856298.0420.161
MH525287.65Calcareous mudstone3.013.130.123.902.51157.04788.46295.924−514.19262.9948.717113.2040.106
MH525287.82Calcareous mudstone1.793.141.3575.392.53357.9986.685132.886−514.13494.1238.669149.5640.123
MH525288.17Calcareous mudstone2.482.670.197.512.55857.8987.46309.97−513.461151.9958.568370.7230.129
MH545138.95Tuffaceous mudstone1.361.190.1712.822.66759.96379.6718.459−315.918.6658.72517.8490.102
MH545139.3Tuffaceous mudstone1.141.200.064.932.67856.58483.03220.883−314.97422.3218.7220.1410.088
MH545139.5Tuffaceous mudstone0.851.320.4755.812.67255.26482.77431.361−314.76530.788.7230.4460.078
MH545139.6Tuffaceous mudstone1.571.490.085.212.6754.72379.39757.54−314.48950.4998.7256.3080.075
MH545139.98Tuffaceous mudstone2.991.691.3043.452.66453.27361.63990.252−313.62354.7858.7390.1220.076
FY15230.96Calcareous mudstone0.720.930.2129.072.564.83867.8598.035−17.6252.6529.3549.1110.177
FY15232.71Calcareous mudstone1.060.700.3633.972.5566.00964.1435.578−27.5882.5118.9936.1540.19
MY24430.14Calcareous mudstone0.270.010.2697.862.50360.69953.49946.3−44.48240.4519.126707.9417.108
MY24430.48Calcareous mudstone0.510.810.3059.002.43864.78254.1447.144−44.70530.26411.171581.63124.07
MY24430.79Calcareous mudstone0.440.530.0920.572.36167.87339.45515.458−45.071.56818.614602.836.51
MY24432.02Calcareous mudstone0.470.520.0510.922.36862.85876.50741.666−48.04545.53721.402461.52733.433
MY24432.13Calcareous mudstone0.560.630.0712.882.3961.64182.50670.567−48.20543.66120.999330.75529.052
Table 2. Statistical table for measured porosity and permeability of Fengcheng Formation reservoir rocks.
RegionSedsedimentary Facies
(N = Number of Samples)
Porosity
(%)
Average Porosity
(%)
Porosity < 10%
(%)
Permeability
(×10−3 μm2)
Average Permeability
(×10−3 μm2)
Permeability < 1 × 10⁻³ μm2
(%)
SouthFan delta plain subfacies
(N = 6)
2.6~11.65.37830.012~2.2500.4283
Inner side of fan delta front subfacies
(N = 186)
0.5~15.56.28920.011~0.3500.10898
Outer side of fan delta front subfacies
(N = 184)
0.2~15.24.14960.010~16.1000.20599
WestFan delta plain subfacies
(N = 21)
0.9~3.22.411000.010~0.1370.026100
Inner side of fan delta front subfacies
(N = 14)
0.2~2.30.91000.020~0.2000.05100
Outer side of fan delta front subfacies
(N = 39)
0.4~4.72.461000.012~10.0000.90787
Semi-deep lake subfacies
(N = 22)
1.7~6.53.951000.016~4.6900.70882
Disclaimer/Publisher’s Note: The statements, opinions and data contained in all publications are solely those of the individual author(s) and contributor(s) and not of MDPI and/or the editor(s). MDPI and/or the editor(s) disclaim responsibility for any injury to people or property resulting from any ideas, methods, instructions or products referred to in the content.

