
Co-Pyrolysis Behavior, Kinetic and Mechanism of Waste-Printed Circuit Board with Biomass

 , , ,
, , ,  and
and 
Abstract
1. Introduction
2. Kinetic Modeling
2.1. Model-Free Methods
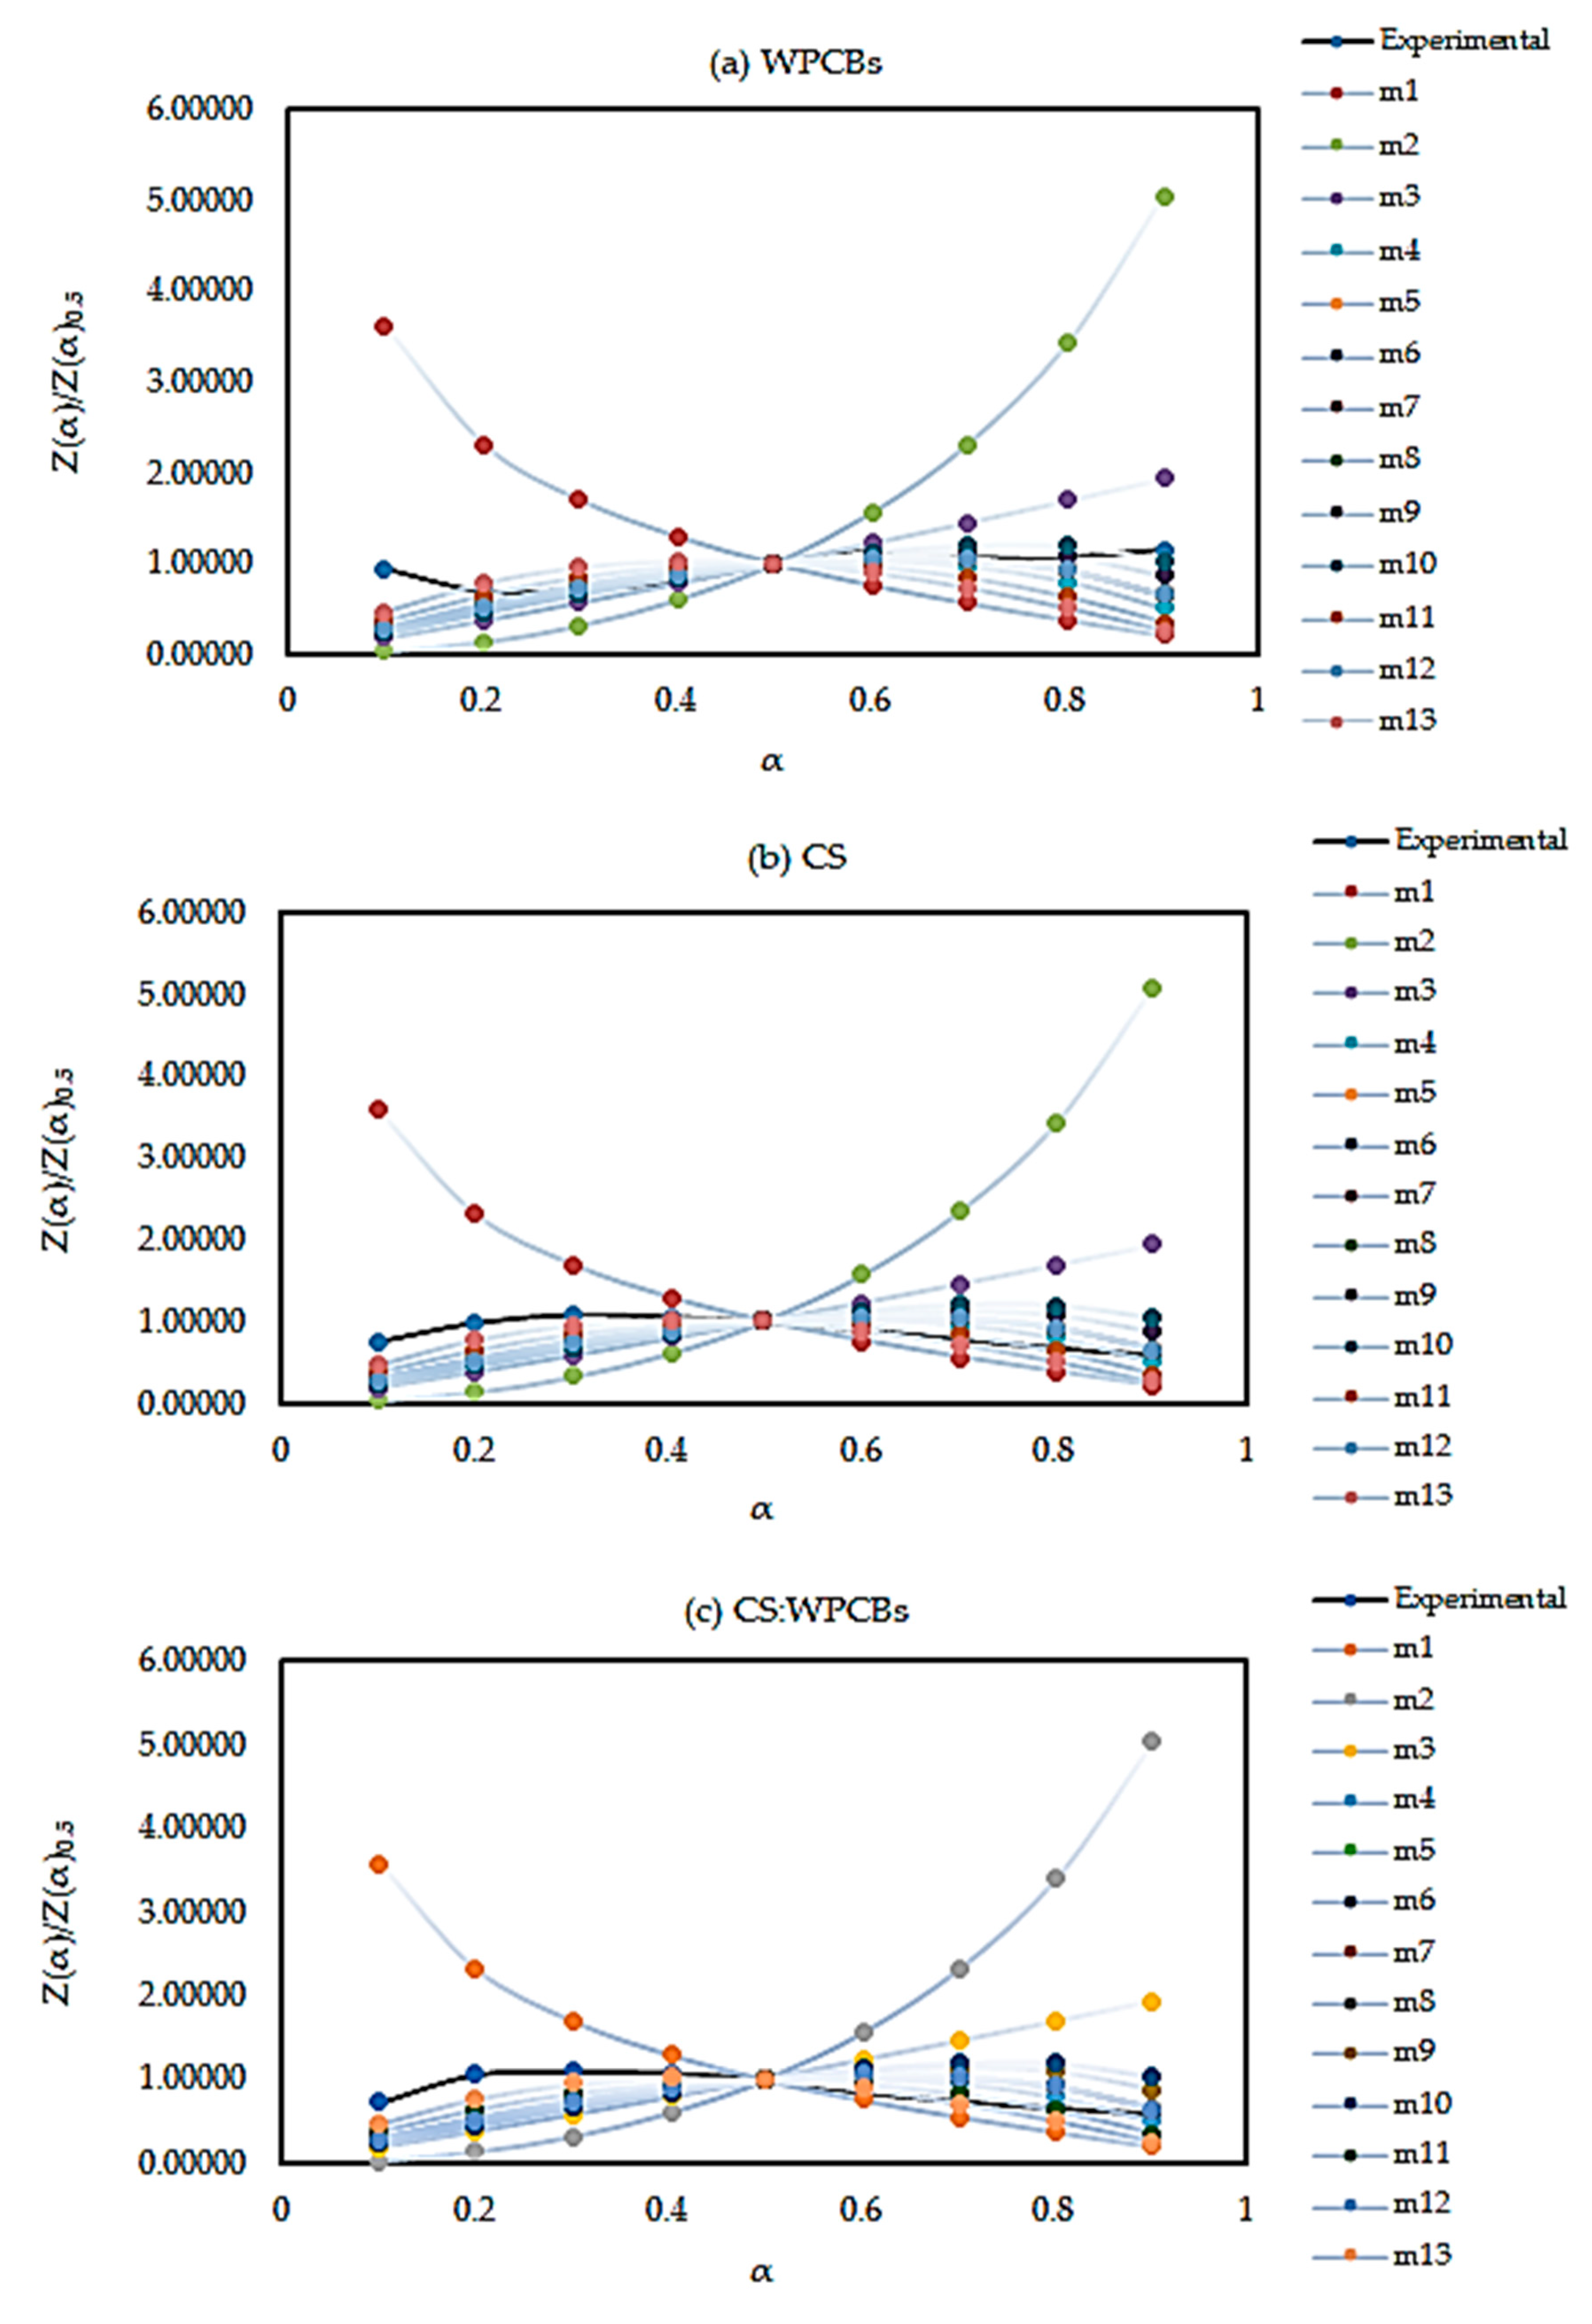
2.2. Criado Method

| No. | Function Name | Mechanisms | f(α) | g(α) |
|---|---|---|---|---|
| m1 | Jander equation | Diffusion, 3D (spherical symmetry) | 3/2(1 − α)2/3[1 − (1 − α)1/3]−1 | [1 − (1 − α)1/3]1/2 |
| m2 | G–B equation | Diffusion, 3D (column symmetry) | 3/2[(1 − α)−1/3 − 1]−1 | 1 − 2α/3 − (1 − α)2/3 |
| m3 | Anti–Jander equation | Diffusion, 3D | 3/2(1 + α)2/3[(1 + α)1/3 −1]−1 | [(1 + α)1/3 − 1]2 |
| m4 | Z–L–T equation | Diffusion, 3D | 3/2(1 − α)4/3[(1 − α)−1/3 − 1]−1 | [(1 − α)−1/3 − 1]2 |
| m5 | Avrami–Erofeev Equation | Random nucleation and nuclei growth, n = 3 | 3(1 − α) [−ln (1 − α)]2/3 | [−ln (1 − α)]1/3 |
| m6 | Avrami–Erofeev Equation | Random nucleation and nuclei growth, n = 2 | 2(1 − α) [−ln (1 − α)]1/2 | [−ln (1 − α)]1/2 |
| m7 | Avrami–Erofeev Equation | Random nucleation and nuclei growth, n = 3/2 | 3/2(1 − α) [−ln (1 − α)]1/3 | [−ln (1 − α)]2/3 |
| m8 | Avrami–Erofeev Equation | Random nucleation and nuclei growth, n = 4/3 | 4/3(1 − α) [−ln (1 − α)]1/4 | [−ln (1 − α)]3/4 |
| m9 | Geometrical contraction | Shrinkage geometric shape (column symmetry) | 3(1 − α)2/3 | 1 − (1 − α)1/3 |
| m10 | Geometrical contraction | Shrinkage geometric shape, (spherical symmetry) | 2(1 − α)1/2 | 1 − (1 − α)1/2 |
| m11 | Reaction order n = 2 | Chemical reaction | (1 − α)2 | (1 − α)−1 −1 |
| m12 | Reaction order n = 1 | Chemical reaction | (1 − α) | −ln(1-α) |
| m13 | Reaction order n = 3 | Chemical reaction | (1 − α)3 | ((1 − α)−2 −1)/2 |
3. Materials
4. Experimental
5. Results and Discussion
5.1. Thermogravimetric Analysis
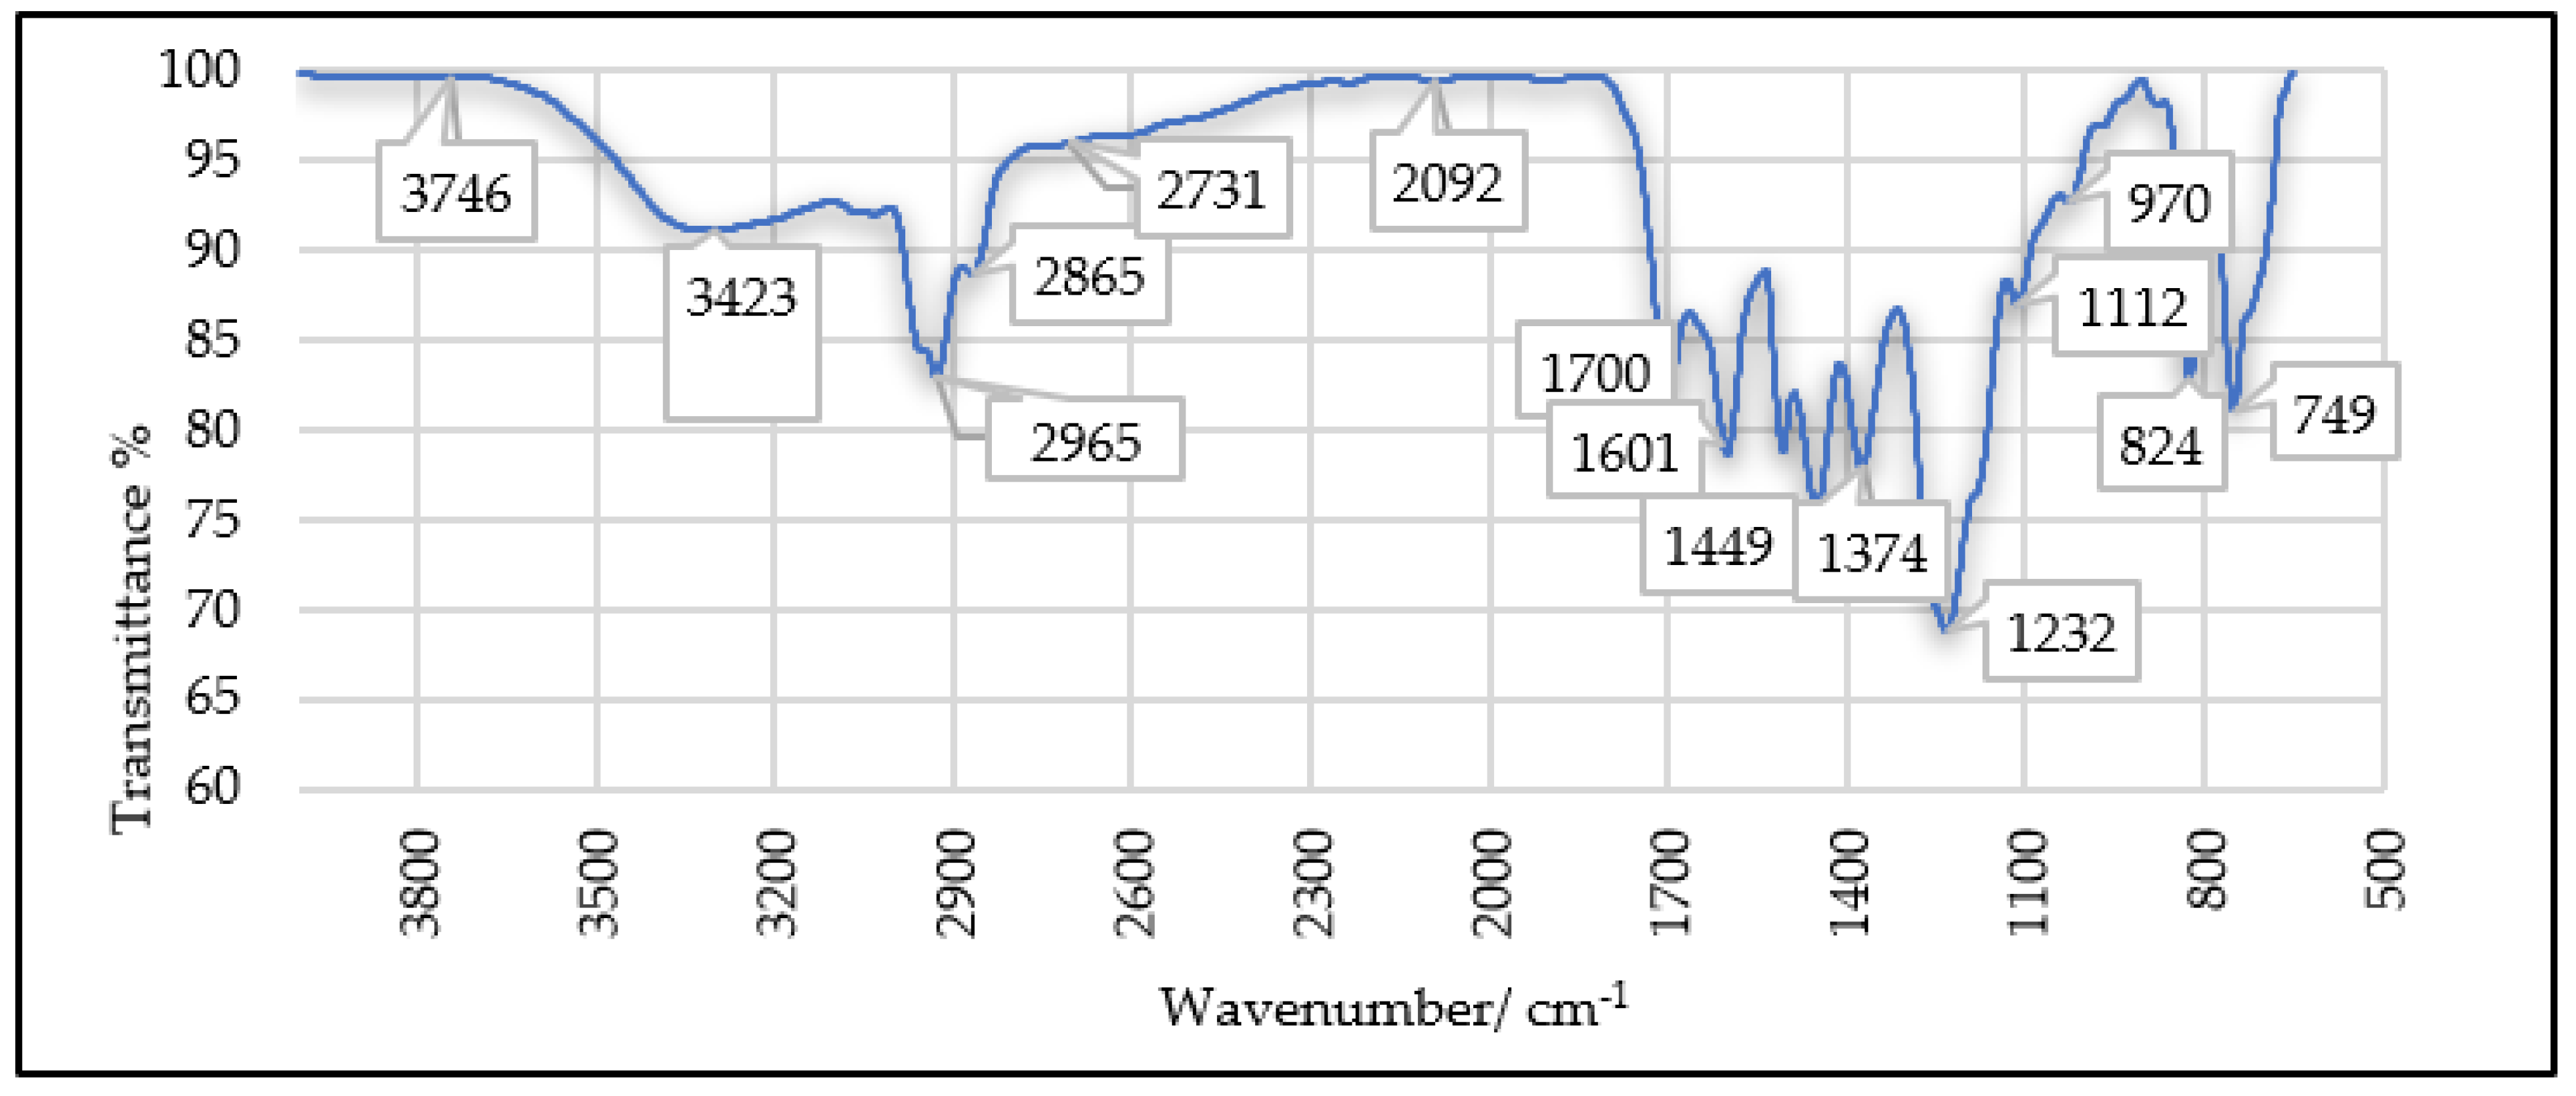
5.2. FTIR Analysis
5.3. Kinetic Analysis
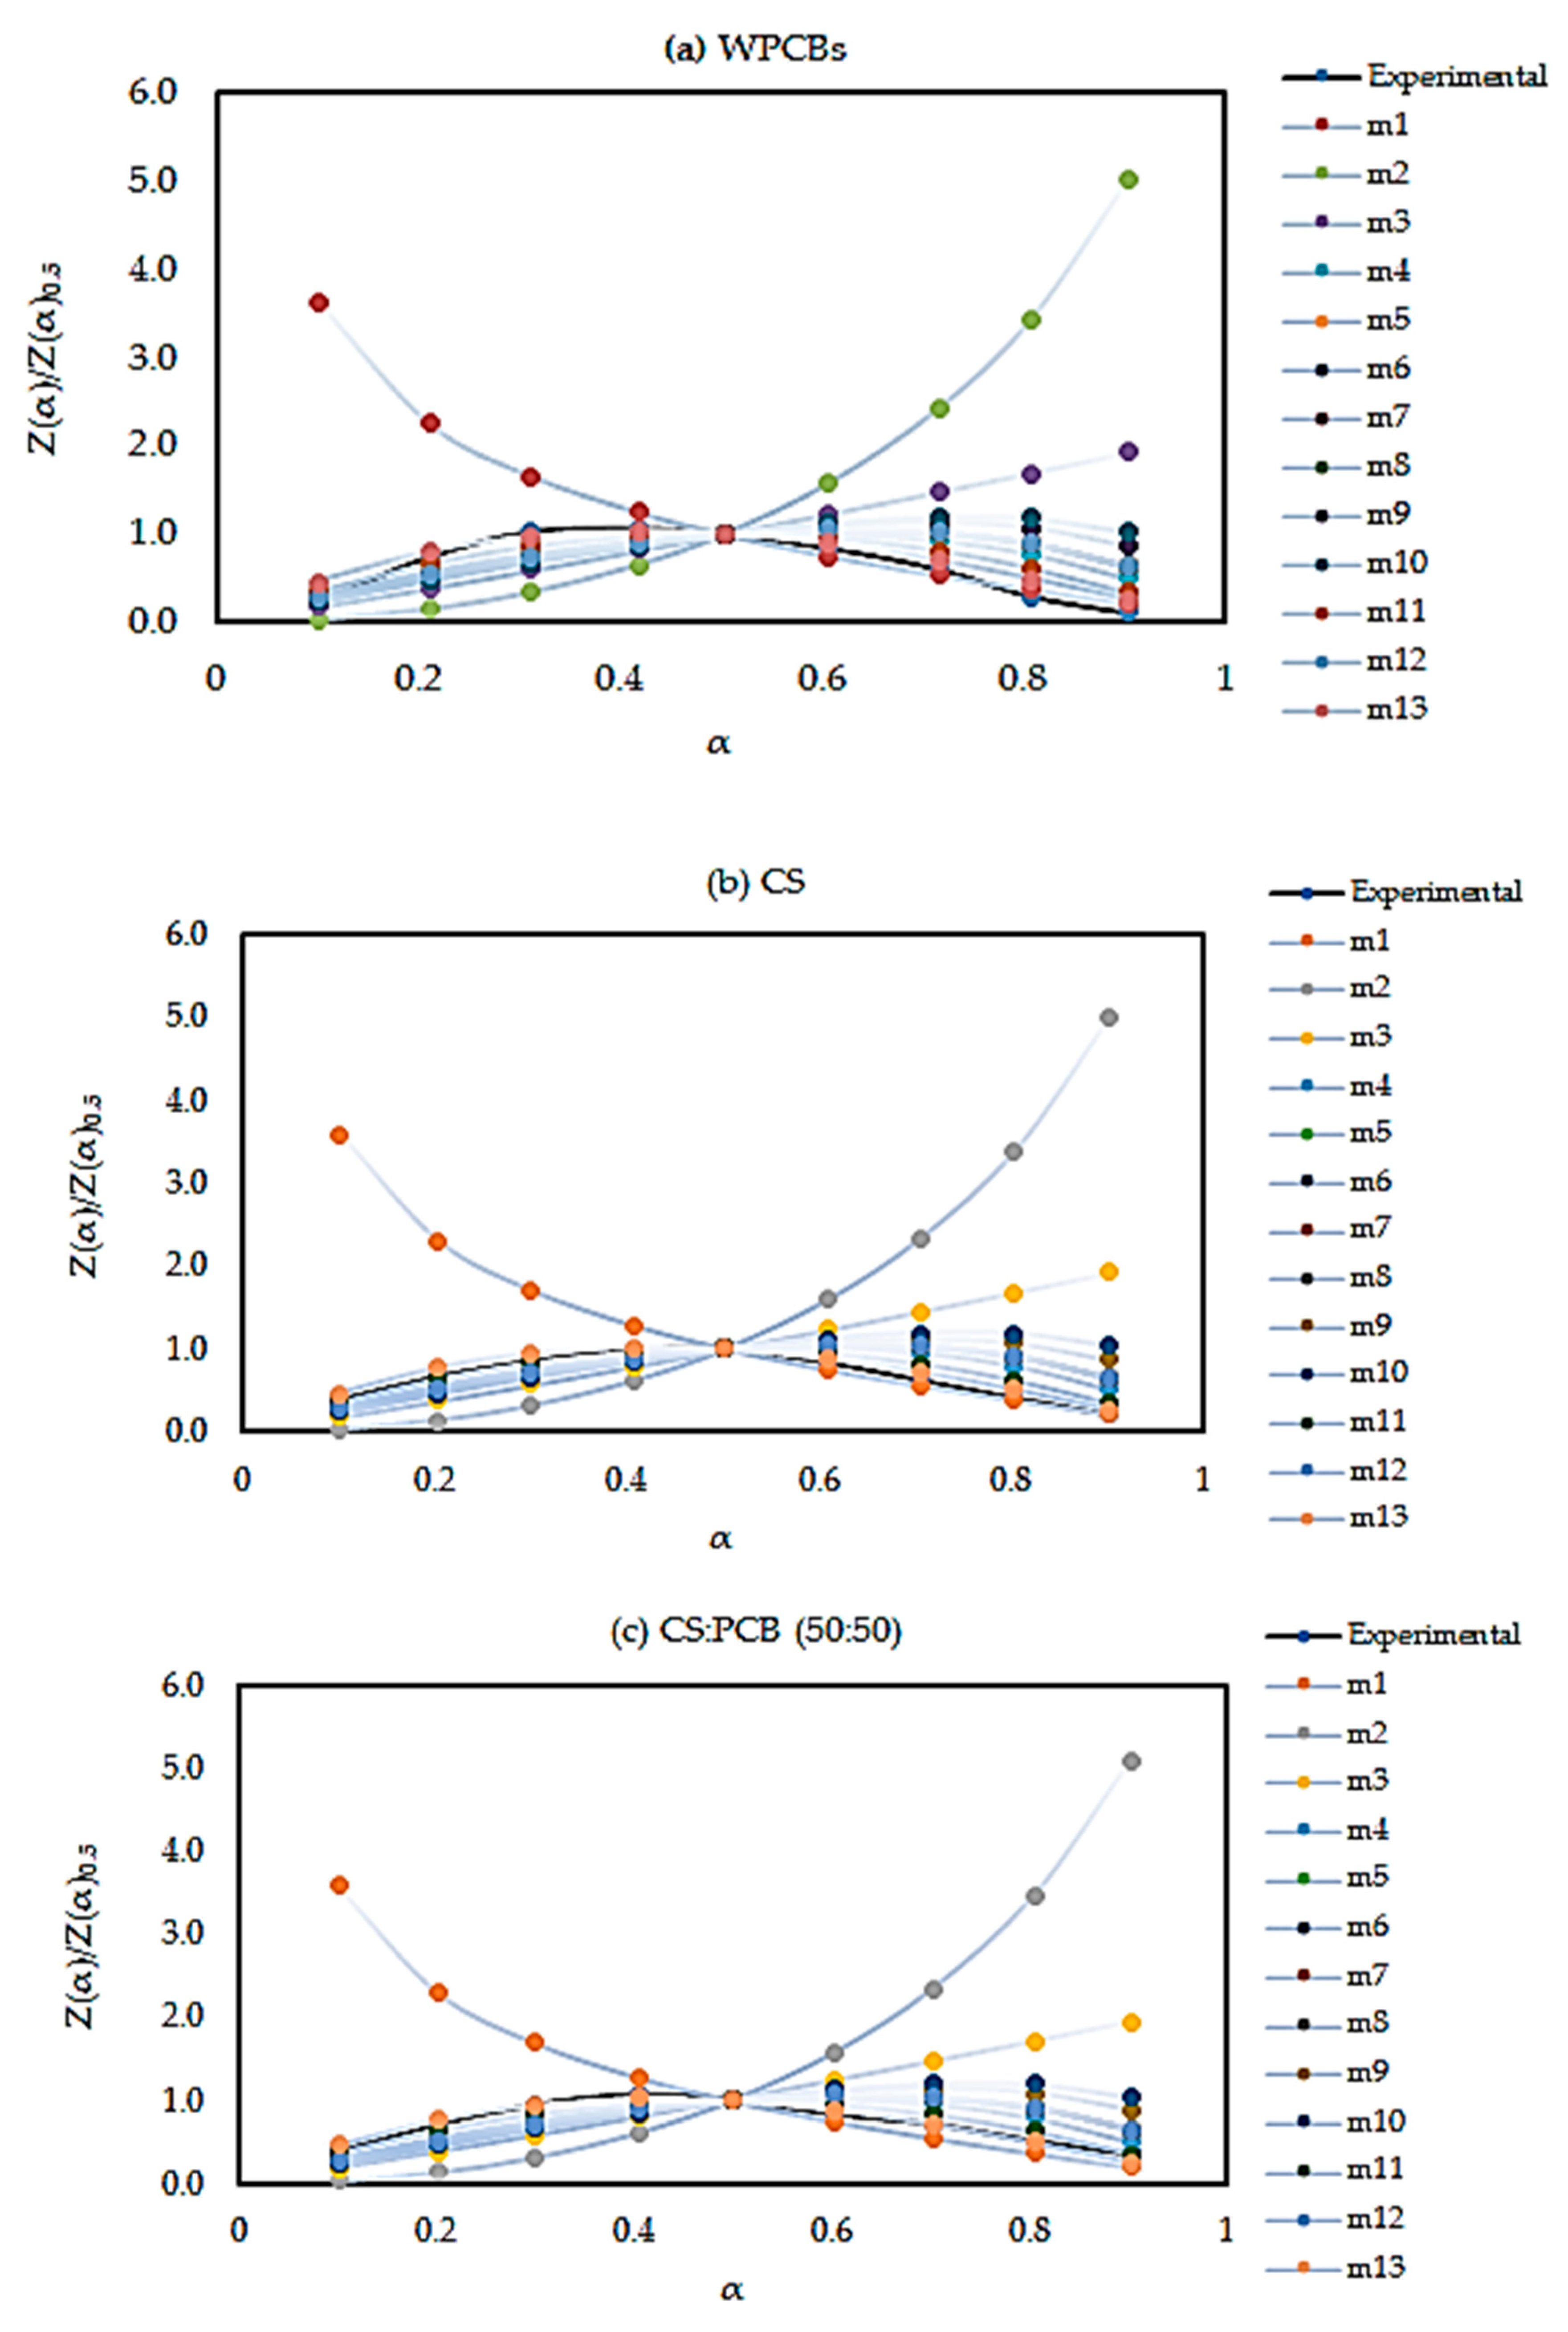
5.4. Reaction Mechanism
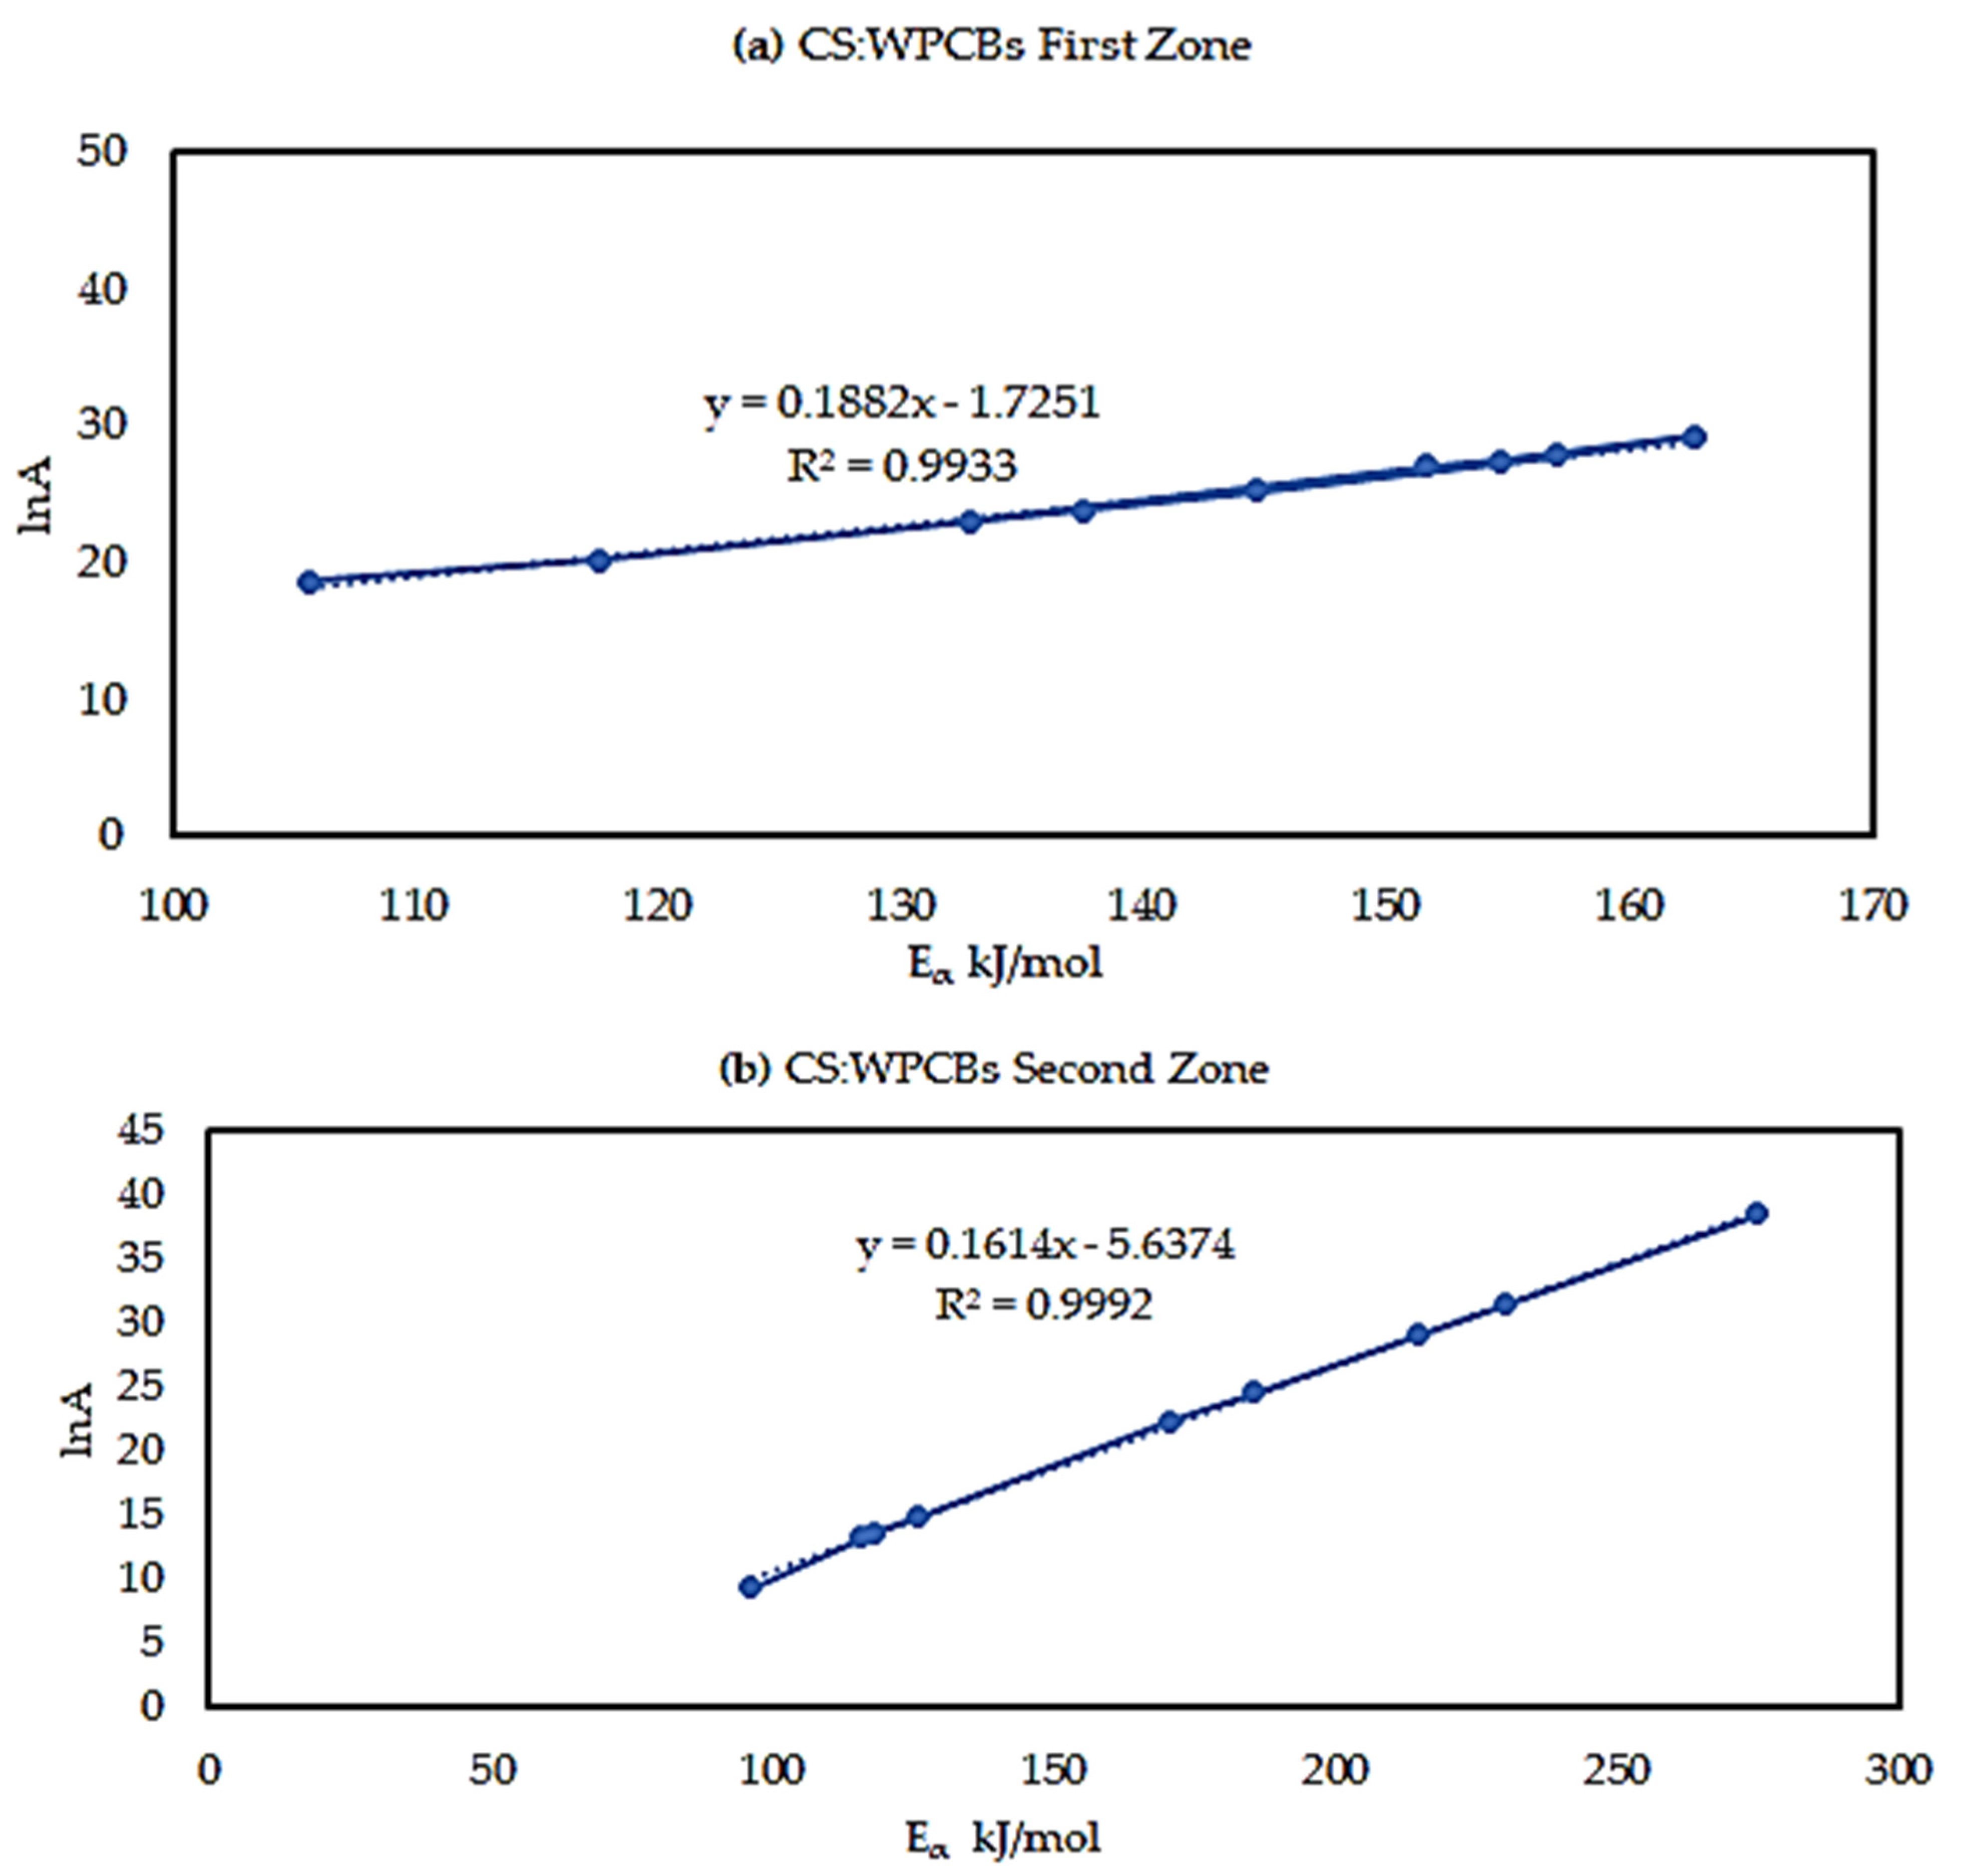
5.5. Kinetic Compensation Effects
6. Conclusions
Supplementary Materials
Author Contributions
Funding
Data Availability Statement
Acknowledgments
Conflicts of Interest
References
- Cucchiella, F.; D’Adamo, I.; Lenny Koh, S.C.; Rosa, P. Recycling of WEEEs: An economic assessment of present and future e-waste streams. Renew. Sustain. Energy Rev. 2015, 51, 263–272. [Google Scholar] [CrossRef]
- Abalansa, S.; El Mahrad, B.; Icely, J.; Newton, A. Electronic waste, an environmental problem exported to developing countries: The good, the bad and the ugly. Sustainability 2021, 13, 5302. [Google Scholar] [CrossRef]
- Wang, Z.; Zhang, B.; Guan, D. Take responsibility for electronic-waste disposal. Nature 2016, 536, 23–25. [Google Scholar] [CrossRef] [PubMed]
- Kumar, A.; Holuszko, M.; Espinosa, D.C.R. E-waste: An overview on generation, collection, legislation and recycling practices. Resour. Conserv. Recycl. 2017, 122, 32–42. [Google Scholar] [CrossRef]
- Turaga, R.M.R.; Bhaskar, K.; Sinha, S.; Hinchliffe, D.; Hemkhaus, M.; Arora, R.; Chatterjee, S.; Khetriwal, D.S.; Radulovic, V.; Singhal, P.; et al. E-Waste Management in India: Issues and Strategies. Vikalpa 2019, 44, 127–162. [Google Scholar] [CrossRef]
- Chatterjee, S.D. Electronic Waste and India. Department of Information Technology Electronics Niketan. 2012. Available online: http://meity.gov.in/writereaddata/files/EWaste_Sep11_892011.pdf (accessed on 27 December 2022).
- Williams, P.T. 6.2 Pyrolysis. In Waste Treatment and Disposal; John Wiley & Sons: New York, NY, USA, 2005; pp. 326–337. Available online: http://www.znrfak.ni.ac.rs/serbian/010-studije/oas-3-2/PREDMETI/IIIGODINA/316-KOMUNALNISISTEMIIZIVOTNASREDINA/SEMINARSKIRADOVI/2014/S105-S150.pdf (accessed on 27 December 2022).
- Williams, P.T. Valorization of printed circuit boards from waste electrical and electronic equipment by pyrolysis. Waste Biomass Valorization 2010, 1, 107–120. [Google Scholar] [CrossRef]
- Rosenberg, C.; Hämeilä, M.; Tornaeus, J.; Säkkinen, K.; Puttonen, K.; Korpi, A.; Kiilunen, M.; Linnainmaa, M.; Hesso, A. Exposure to flame retardants in electronics recycling sites. Ann. Occup. Hyg. 2011, 55, 658–665. [Google Scholar]
- Sepúlveda, A.; Schluep, M.; Renaud, F.G.; Streicher, M.; Kuehr, R.; Hagelüken, C.; Gerecke, A.K. A review of the environmental fate and effects of hazardous substances released from electrical and electronic equipments during recycling: Examples from China and India. Environ. Impact Assess. Rev. 2010, 30, 28–41. [Google Scholar] [CrossRef]
- Salhofer, S. E-waste collection and treatment options: A comparison of approaches in Europe, China and Vietnam. In Source Separation and Recycling. The Handbook of Environmental Chemistry; Springer: Cham, Switzerland, 2018; Volume 63, p. 227. [Google Scholar]
- Quan, C.; Li, A.; Gao, N. Research on pyrolysis of PCB waste with TG-FTIR and Py-GC/MS. J. Therm. Anal. Calorim. 2012, 110, 1463–1470. [Google Scholar] [CrossRef]
- Kim, Y.; Kim, S.; Lee, J.; Park, Y. Pyrolysis Reaction Pathways of Waste Epoxy-Printed Circuit Board. Environ. Eng. Sci. 2013, 30, 706–712. [Google Scholar] [CrossRef]
- Ankit; Saha, L.; Kumar, V.; Tiwari, J.; Sweta; Rawat, S.; Singh, J.; Bauddh, K. Electronic waste and their leachates impact on human health and environment: Global ecological threat and management. Environ. Technol. Innov. 2021, 24, 102049. [Google Scholar] [CrossRef]
- Dhaundiyal, A.; Singh, S.B.; Hanon, M.M.; Rawat, R. Determination of Kinetic Parameters for the Thermal Decomposition of Parthenium hysterophorus. Environ. Clim. Technol. 2018, 22, 5–21. [Google Scholar] [CrossRef]
- Diaz, F.; Flerus, B.; Nagraj, S.; Bokelmann, K.; Stauber, R.; Friedrich, B. Comparative Analysis About Degradation Mechanisms of Printed Circuit Boards (PCBs) in Slow and Fast Pyrolysis: The Influence of Heating Speed. J. Sustain. Metall. 2018, 4, 205–221. [Google Scholar] [CrossRef]
- Abdou, T.R.; Botelho, A.B., Jr.; Espinosa, D.C.R.; Tenório, J.A.S. Recycling of polymeric composites from industrial waste by pyrolysis: Deep evaluation for carbon fibers reuse. Waste Manag. 2021, 120, 1–9. [Google Scholar] [CrossRef] [PubMed]
- Liu, W.J.; Tian, K.; Jiang, H.; Zhang, X.S.; Yang, G.X. Preparation of liquid chemical feedstocks by co-pyrolysis of electronic waste and biomass without formation of polybrominated dibenzo-p-dioxins. Bioresour. Technol. 2013, 128, 1–7. [Google Scholar] [CrossRef]
- Abnisa, F.; Wan Daud, W.M.A. A review on co-pyrolysis of biomass: An optional technique to obtain a high-grade pyrolysis oil. Energy Convers. Manag. 2014, 87, 71–85. [Google Scholar] [CrossRef]
- Radojević, M.; Janković, B.; Jovanović, V.; Stojiljković, D.; Manić, N. Comparative pyrolysis kinetics of various biomasses based on model-free and DAEM approaches improved with numerical optimization procedure. PLoS ONE 2018, 13, e0206657. [Google Scholar] [CrossRef]
- Shen, Y.; Chen, X.; Ge, X.; Chen, M. Thermochemical treatment of non-metallic residues from waste printed circuit board: Pyrolysis vs. combustion. J. Clean. Prod. 2018, 176, 1045–1053. [Google Scholar] [CrossRef]
- Conesa, J.A.; Soler, A. Decomposition kinetics of materials combining biomass and electronic waste. J. Therm. Anal. Calorim. 2017, 128, 225–233. [Google Scholar] [CrossRef]
- Holba, P. Temperature dependence of activation energy of endothermic processes and related imperfections of non-isothermal kinetic evaluations. J. Therm. Anal. Calorim. 2017, 129, 609–614. [Google Scholar] [CrossRef]
- Criado, J.M.; Pérez-Maqueda, L.A.; Sánchez-Jiménez, P.E. Dependence of the preexponential factor on temperature: Errors in the activation energies calculated by assuming that A is constant. J. Therm. Anal. Calorim. 2005, 82, 671–675. [Google Scholar] [CrossRef]
- Vyazovkin, S. Kinetic concepts of thermally stimulated reactions in solids: A view from a historical perspective. Int. Rev. Phys. Chem. 2000, 19, 45–60. [Google Scholar] [CrossRef]
- Vyazovkin, S. A time to search: Finding the meaning of variable activation energy. Phys. Chem. Chem. Phys. 2016, 18, 18643–18656. [Google Scholar] [CrossRef] [PubMed]
- Šimon, P. Isoconversional methods: Fundamentals, meaning and application. J. Therm. Anal. Calorim. 2004, 76, 123–132. [Google Scholar] [CrossRef]
- Guida, M.Y.; Hannioui, A. Evaluation of Reliability of Coats-Redfern and Criado Methods for Kinetics Analysis of Olive Mill Solid Waste and Olive Mill Wastewater. Int. J. Sci. Eng. Res. 2016, 7, 193–203. [Google Scholar]
- Hammani, H. Investigation on the Pyrolysiskinetics and Mechanism of Date Stone Using Thermogravimetric Analysis. Eng. Technol. J. 2018, 3, 366–375. [Google Scholar] [CrossRef]
- Starink, M.J. The determination of activation energy from linear heating rate experiments: A comparison of the accuracy of isoconversion methods. Thermochim. Acta 2003, 404, 163–176. [Google Scholar] [CrossRef]
- Hu, Y.; Wang, Z.; Cheng, X.; Ma, C. Non-isothermal TGA study on the combustion reaction kinetics and mechanism of low-rank coal char. RSC Adv. 2018, 8, 22909–22916. [Google Scholar] [CrossRef] [PubMed]
- Koga, N. Ozawa’s kinetic method for analyzing thermoanalytical curves: History and theoretical fundamentals. J. Therm. Anal. Calorim. 2013, 113, 1527–1541. [Google Scholar] [CrossRef]
- Venkatesh, M.; Ravi, P.; Tewari, S.P. Isoconversional kinetic analysis of decomposition of nitroimidazoles: Friedman method vs Flynn-Wall-Ozawa method. J. Phys. Chem. A 2013, 117, 10162–10169. [Google Scholar] [CrossRef]
- Criado, J.M.; Málek, J.; Ortega, A. Applicability of the master plots in kinetic analysis of non-isothermal data. Thermochim. Acta 1989, 147, 377–385. [Google Scholar] [CrossRef]
- Pistor, V.; Ornaghi, F.G.; Ornaghi, H.L.; Zattera, A.J. Degradation kinetic of epoxy nanocomposites containing different percentage of epoxycyclohexyl-POSS. Polym. Compos. 2012, 33, 1224–1232. [Google Scholar] [CrossRef]
- Aboulkas, A.; El Harfi, K. Study of the kinetics and mechanisms of thermal decomposition of Moroccan Tarfaya oil shale and its kerogen. Oil Shale 2008, 25, 426–443. [Google Scholar] [CrossRef]
- Kissinger, R. Reaction Kinetics in Differential Thermal Analysis. Anal. Chem. 1957, 303, 1702–1706. [Google Scholar] [CrossRef]
- Guida, M.Y.; Bouaik, H.; El Mouden, L.; Moubarik, A.; Aboulkas, A.; El Harfi, K.; Hannioui, A. Utilization of Starink Approach and Avrami Theory to Evaluate the Kinetic Parameters of the Pyrolysis of Olive Mill Solid Waste and Olive Mill Wastewater. J. Adv. Chem. Eng. 2017, 7, 1–8. [Google Scholar]
- Yao, Z.; Xiong, J.; Yu, S.; Su, W.; Wu, W.; Tang, J.; Wu, D. Kinetic study on the slow pyrolysis of nonmetal fraction of waste printed circuit boards (NMF-WPCBs). Waste Manag. Res. 2020, 38, 903–910. [Google Scholar] [CrossRef] [PubMed]
- Prajapati, S.B.; Gautam, A.; Gautam, S. Debromination and improved phenol content in fuel oil generated from co-pyrolysis of non-metallic PCB and biomass. Biomass Convers. Biorefin. 2022, 1–17. [Google Scholar] [CrossRef]
- Bizzo, W.A.; Figueiredo, R.A.; De Andrade, V.F. Characterization of printed circuit boards for metal and energy recovery after milling and mechanical separation. Materials 2014, 7, 4555–4566. [Google Scholar] [CrossRef] [PubMed]
- Barontini, F.; Marsanich, K.; Petarca, L.; Cozzani, V. Thermal degradation and decomposition products of electronic boards containing BFRs. Ind. Eng. Chem. Res. 2005, 44, 4186–4199. [Google Scholar] [CrossRef]
- Barontini, F.; Marsanich, K.; Petarca, L.; Cozzani, V. The Thermal Degradation Process of Tetrabromobisphenol A. Ind. Eng. Chem. Res. 2004, 43, 1952–1961. [Google Scholar] [CrossRef]
- Grause, G.; Furusawa, M.; Okuwaki, A.; Yoshioka, T. Pyrolysis of tetrabromobisphenol-A containing paper laminated printed circuit boards. Chemosphere 2008, 71, 872–878. [Google Scholar] [CrossRef] [PubMed]
- Luda, M.P.; Balabanovich, A.I.; Zanetti, M.; Guaratto, D. Thermal decomposition of fire retardant brominated epoxy resins cured with different nitrogen containing hardeners. Polym. Degrad. Stab. 2007, 92, 1088–1100. [Google Scholar] [CrossRef]
- Chen, D.; Shuang, E.; Liu, L. Analysis of pyrolysis characteristics and kinetics of sweet sorghum bagasse and cotton stalk. J. Therm. Anal. Calorim. 2018, 131, 1899–1909. [Google Scholar] [CrossRef]
- Siddiqui, M.N.; Redhwi, H.H.; Antonakou, E.V.; Achilias, D.S. Pyrolysis mechanism and thermal degradation kinetics of poly(bisphenol A carbonate)-based polymers originating in waste electric and electronic equipment. J. Anal. Appl. Pyrolysis 2018, 132, 123–133. [Google Scholar] [CrossRef]


| Sample | Calorific Value (Cal gm−1) | LOD (%) | Proximate Analysis | Ultimate Analysis | |||||
|---|---|---|---|---|---|---|---|---|---|
| Ash (%) | Volatile Material (%) | Fixed C (%) | C (%) | H (%) | n (%) | S (%) | |||
| PCB | 2788 | 14.05 | 43.95 | 41.87 | 0.13 | 26.73 | 2.39 | 1.93 | 0.19 |
| CS | 3411 | 23.93 | 5.49 | 70.51 | 0.07 | 32.52 | 4.12 | 2.15 | 0.16 |
| CS:PCB (50:50) | 3065 | 12 | 23.73 | 64.2 | 0.07 | 29.76 | 5.45 | 2.86 | 0.148 |
| Sample | Cu | Zn | Ni | Cr | Mn | Pb | Fe |
|---|---|---|---|---|---|---|---|
| WPCBs | 3937 | 25 | 22 | 4 | 44 | 18 | 1304 |
| Samples | |||||||||
|---|---|---|---|---|---|---|---|---|---|
| Ti | Tmax | Tf | Mass Loss % | Ti | Tmax | Tf | Mass Loss % | ||
| WPCBs | 5 | 180.9 | 297.1 | 359.5 | 22 | 360.3 | 494.4 | 577.1 | 14 |
| 10 | 207.6 | 312.0 | 369.6 | 19 | 370.4 | 402.2 | 577.1 | 13 | |
| 15 | 207.4 | 319.3 | 377.3 | 24 | 378.0 | 410.3 | 577.1 | 16 | |
| CS | 5 | 147.9 | 279.2 | 350.7 | 48 | 351.4 | 434.0 | 571.6 | 34 |
| 10 | 172.0 | 292.3 | 374.5 | 50 | 375.3 | 436.0 | 577.1 | 27 | |
| 15 | 173.5 | 300.2 | 376.5 | 50 | 377.3 | 433.1 | 577.7 | 30 | |
| CS:WPCBs (50:50) | 5 | 121.3 | 297.3 | 341.3 | 36 | 342.1 | 387.9 | 577.4 | 33 |
| 10 | 152.2 | 289.7 | 371.7 | 42 | 372.5 | 430.3 | 576.8 | 28 | |
| 15 | 152.2 | 317.3 | 366.1 | 36 | 366.8 | 489.9 | 577.7 | 27 | |
| Sample | De-Moisturization | Char Generation | Overall Mass Loss % | Residue % | |
|---|---|---|---|---|---|
| Mass Loss % | Mass Loss % | ||||
| WPCBs | 5 | 1 | 5 | 42 | 58 |
| 10 | 1.5 | 6.5 | 40 | 60 | |
| 15 | 1.5 | 8.5 | 50 | 50 | |
| CS | 5 | 11 | 1 | 94 | 6 |
| 10 | 11 | 6 | 94 | 6 | |
| 15 | 10 | 5 | 95 | 5 | |
| CS:WPCBs (50:50) | 5 | 5 | 2 | 76 | 24 |
| 10 | 8 | 6 | 84 | 16 | |
| 15 | 6 | 4 | 73 | 27 |
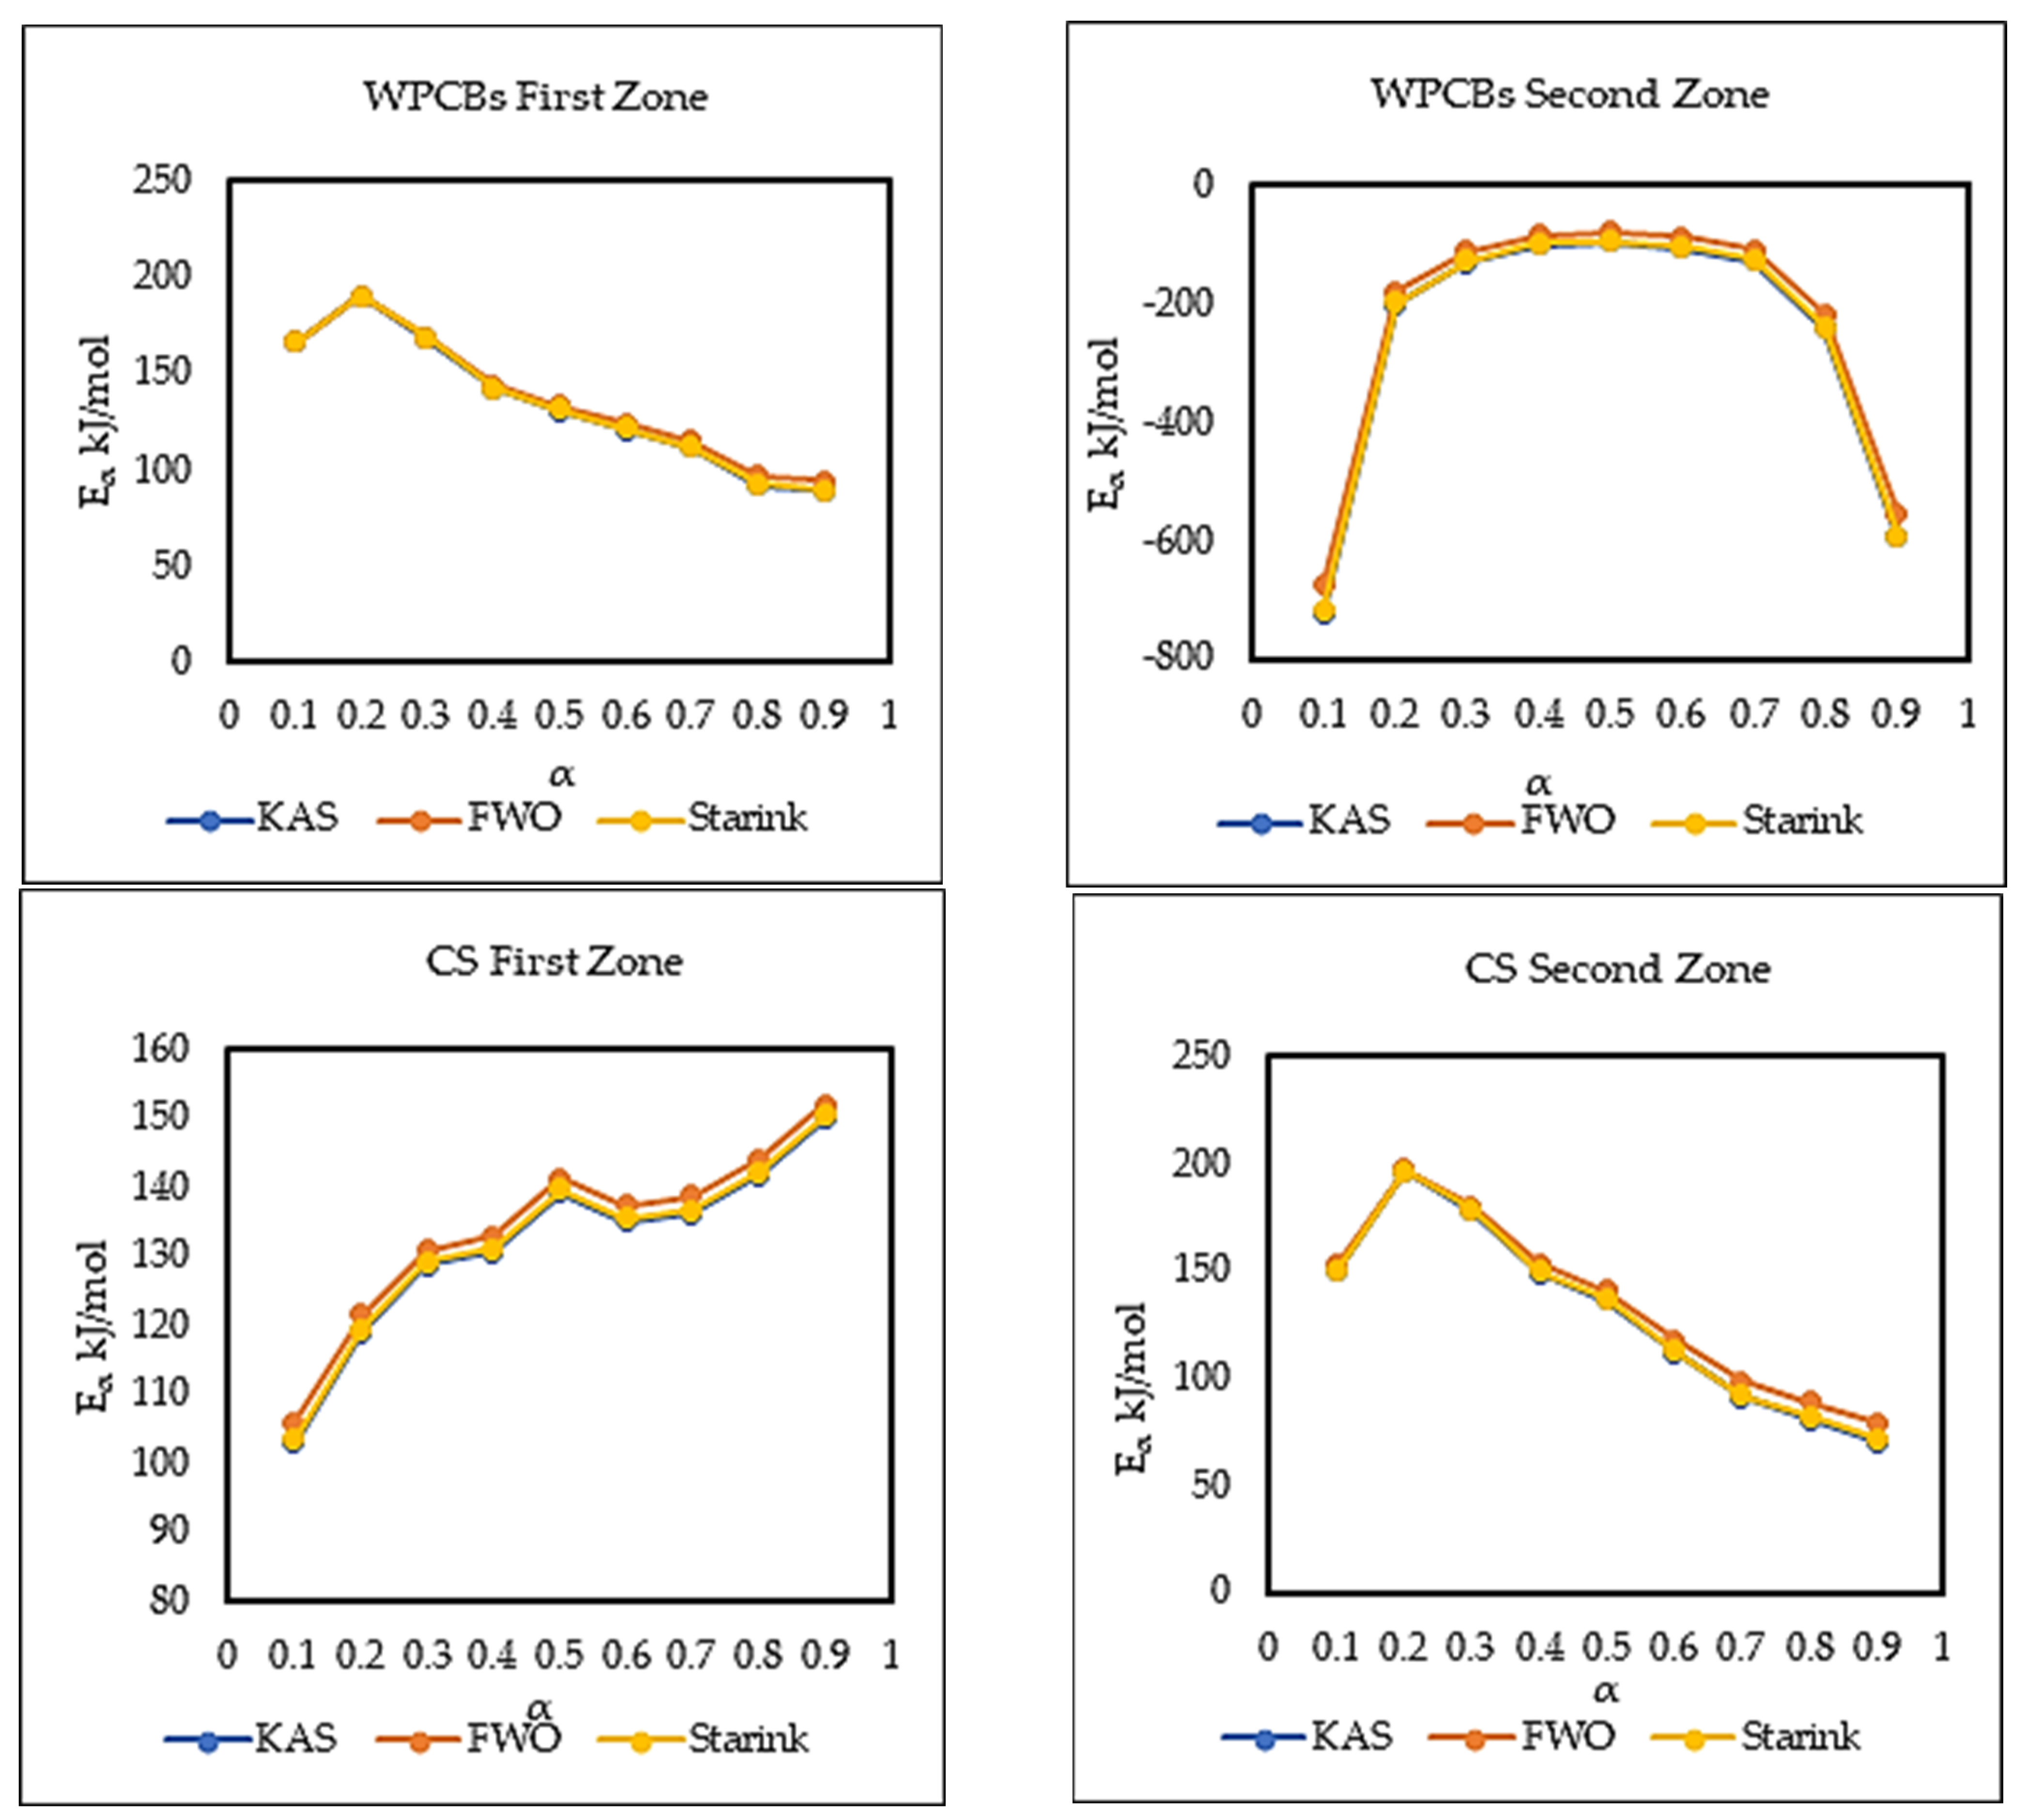
| First Zone | Second Zone | |||||||||||
|---|---|---|---|---|---|---|---|---|---|---|---|---|
| KAS | FWO | Starink | KAS | FWO | Starink | |||||||
| Eα (kJ mol−1) | R2 | Eα (kJ mol−1) | R2 | Eα (kJ mol−1) | R2 | Eα (kJ mol−1) | R2 | Eα (kJ mol−1) | R2 | Eα (kJ mol−1) | R2 | |
| 0.1 | 165.98 | 0.57 | 166.57 | 0.59 | 166.29 | 0.57 | −724.18 | 0.88 | −677.79 | 0.88 | −720.40 | 0.88 |
| 0.2 | 190.61 | 0.77 | 190.21 | 0.79 | 190.85 | 0.77 | −202.37 | 0.95 | −181.41 | 0.94 | −200.47 | 0.95 |
| 0.3 | 168.27 | 0.97 | 169.06 | 0.97 | 168.60 | 0.97 | −131.06 | 0.98 | −113.41 | 0.97 | −129.41 | 0.98 |
| 0.4 | 141.89 | 0.99 | 144.05 | 0.99 | 142.33 | 0.99 | −101.62 | 0.90 | −85.21 | 0.87 | −100.05 | 0.89 |
| 0.5 | 130.58 | 0.99 | 133.37 | 0.99 | 131.07 | 0.99 | −97.11 | 0.83 | −80.65 | 0.79 | −95.53 | 0.83 |
| 0.6 | 120.59 | 0.99 | 123.94 | 0.99 | 121.12 | 0.99 | −106.57 | 0.79 | −89.36 | 0.75 | −104.93 | 0.79 |
| 0.7 | 111.12 | 0.99 | 115.02 | 0.99 | 111.70 | 0.99 | −128.65 | 0.80 | −110.03 | 0.76 | −126.90 | 0.79 |
| 0.8 | 91.42 | 0.94 | 96.42 | 0.95 | 92.08 | 0.94 | −242.42 | 0.76 | −217.76 | 0.74 | −240.20 | 0.76 |
| 0.9 | 88.55 | 0.92 | 93.88 | 0.94 | 89.24 | 0.93 | −596.35 | 0.70 | −553.80 | 0.69 | −592.79 | 0.70 |
| Avg.(0.2–0.9) | 130.38 | 133.24 | 130.87 | −200.77 | −179.95 | −198.78 | ||||||
| First Zone | Second Zone | |||||||||||
|---|---|---|---|---|---|---|---|---|---|---|---|---|
| KAS | FWO | Starink | KAS | FWO | Starink | |||||||
| Eα (kJ mol−1) | R2 | Eα (kJ mol−1) | R2 | Eα (kJ mol−1) | R2 | Eα (kJ mol−1) | R2 | Eα (kJ mol−1) | R2 | Eα (kJ mol−1) | R2 | |
| 0.1 | 102.82 | 0.89 | 105.90 | 0.91 | 103.30 | 0.9 | 149.96 | 0.95 | 153.04 | 0.96 | 150.50 | 0.96 |
| 0.2 | 118.88 | 0.93 | 121.43 | 0.94 | 119.33 | 0.93 | 195.91 | 0.96 | 197.06 | 0.96 | 196.33 | 0.96 |
| 0.3 | 128.57 | 0.96 | 130.81 | 0.96 | 129.00 | 0.96 | 177.49 | 0.93 | 179.77 | 0.94 | 178.00 | 0.93 |
| 0.4 | 130.40 | 0.96 | 132.7 | 0.97 | 130.84 | 0.96 | 149.04 | 0.92 | 152.92 | 0.93 | 149.68 | 0.93 |
| 0.5 | 139.12 | 0.96 | 141.11 | 0.96 | 139.54 | 0.96 | 135.95 | 0.93 | 140.65 | 0.94 | 136.64 | 0.93 |
| 0.6 | 134.81 | 0.96 | 137.15 | 0.97 | 135.26 | 0.96 | 111.55 | 0.91 | 117.64 | 0.92 | 112.36 | 0.91 |
| 0.7 | 136.10 | 0.98 | 138.50 | 0.98 | 136.55 | 0.98 | 90.66 | 0.87 | 98.00 | 0.90 | 91.56 | 0.88 |
| 0.8 | 141.63 | 0.99 | 143.94 | 0.99 | 142.09 | 0.99 | 80.86 | 0.87 | 88.95 | 0.90 | 81.83 | 0.87 |
| 0.9 | 149.72 | 0.94 | 151.88 | 0.95 | 150.17 | 0.94 | 70.26 | 0.84 | 79.22 | 0.88 | 71.30 | 0.84 |
| Avg.(0.2–0.9) | 134.90 | 137.19 | 135.35 | 126.47 | 131.78 | 127.21 | ||||||
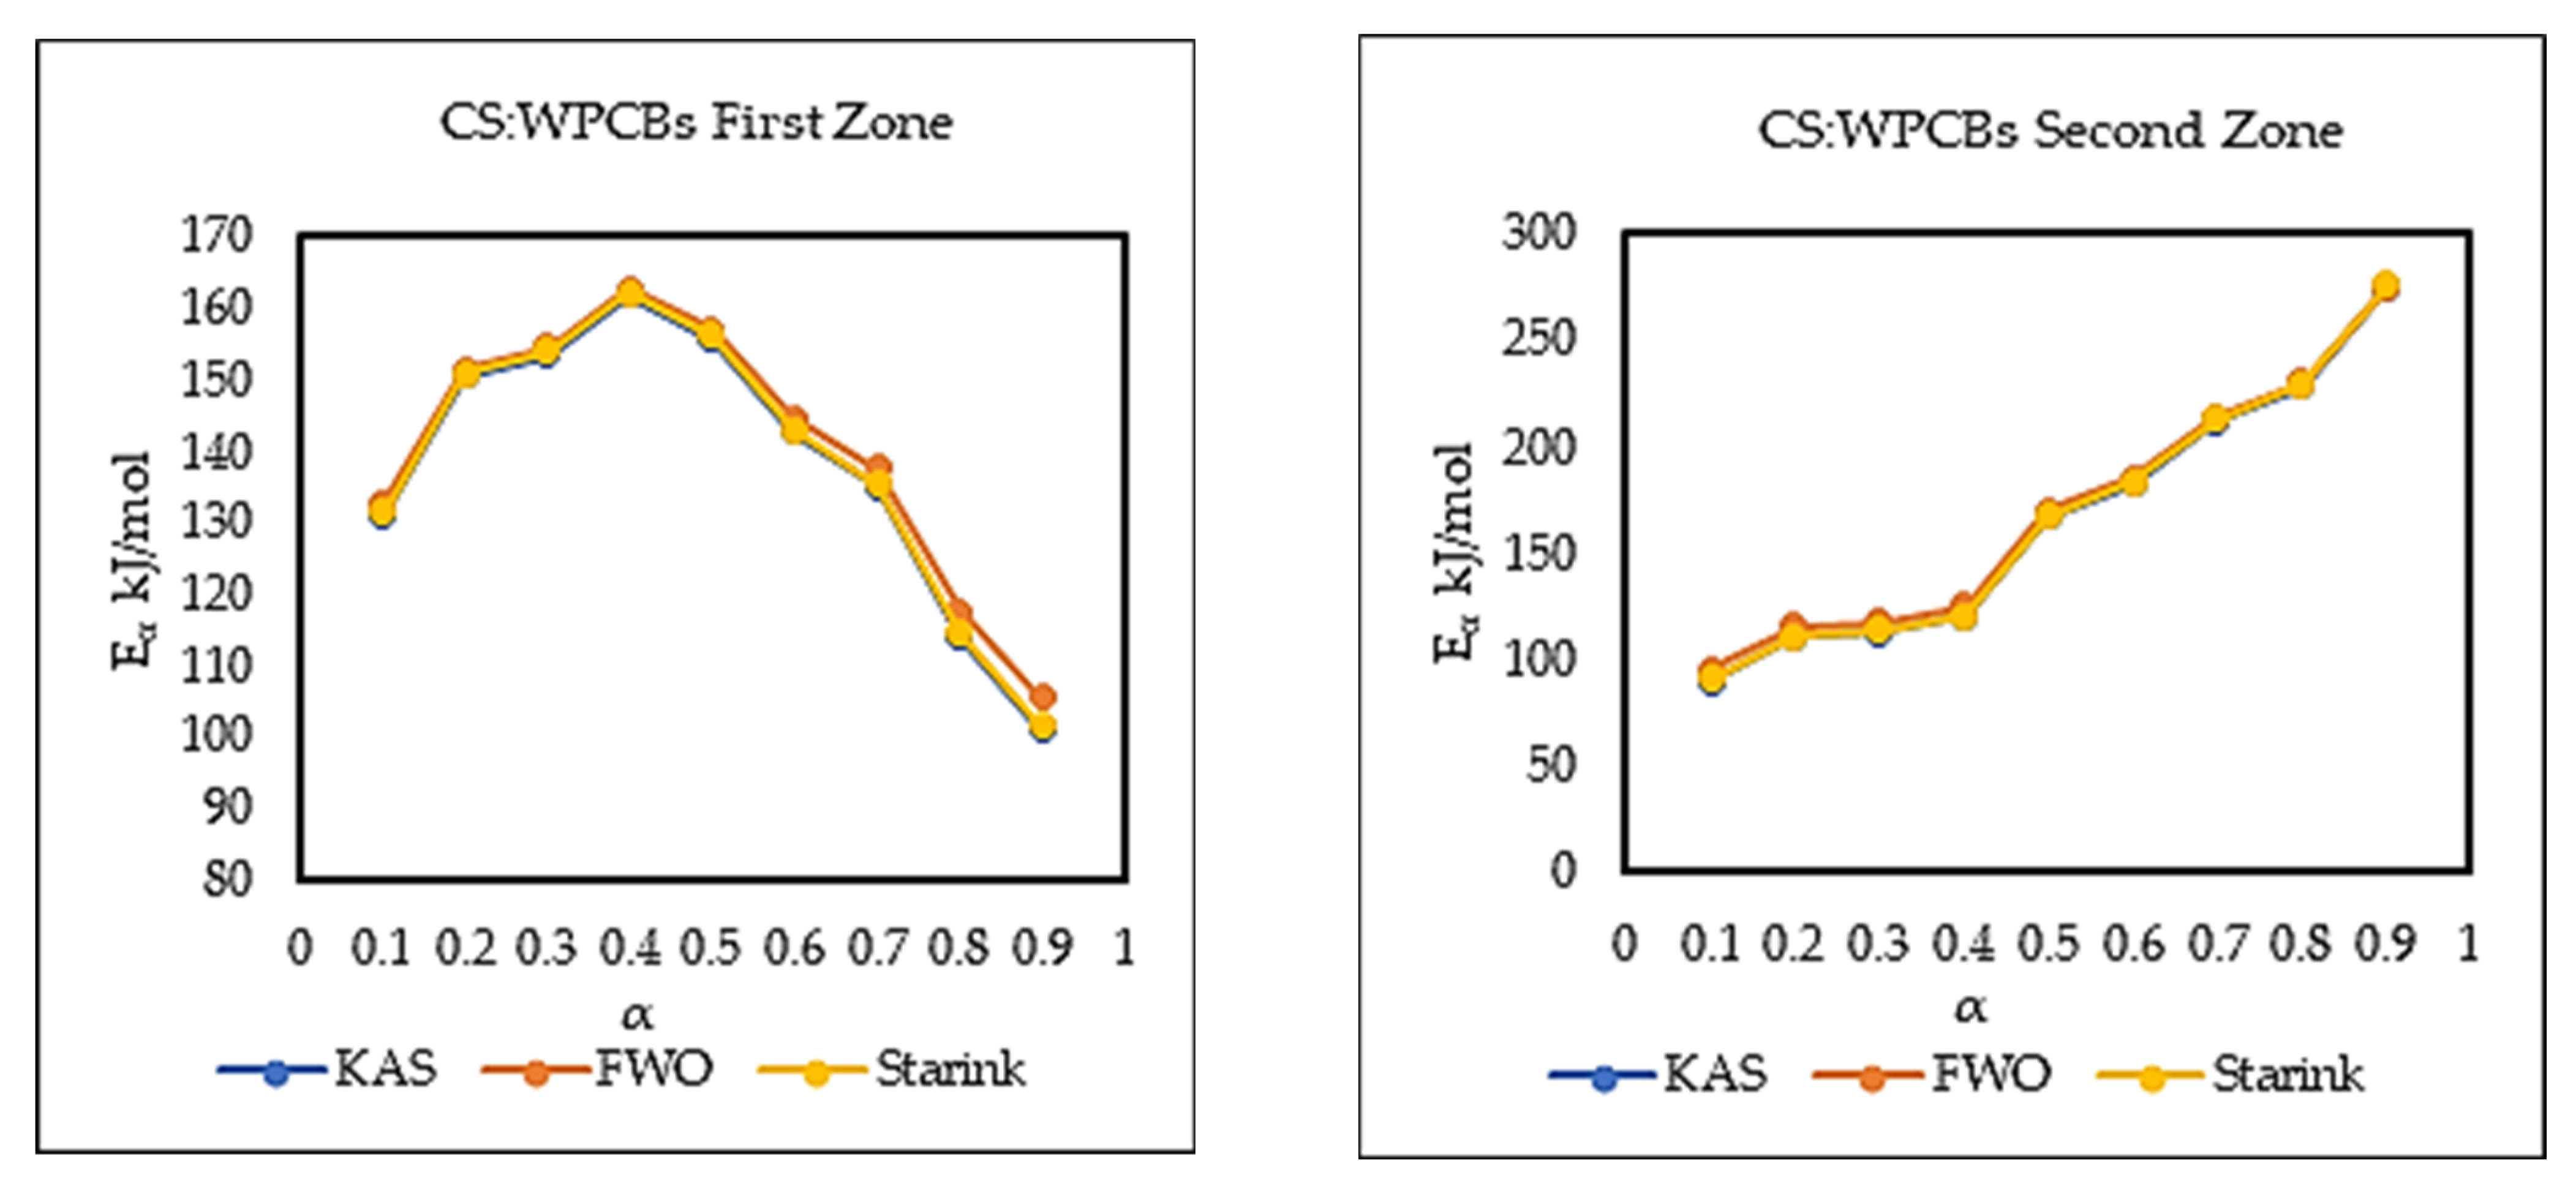
| First Zone | Second Zone | |||||||||||
|---|---|---|---|---|---|---|---|---|---|---|---|---|
| KAS | FWO | Starink | KAS | FWO | Starink | |||||||
| Eα (kJ mol−1) | R2 | Eα (kJ mol−1) | R2 | Eα (kJ mol−1) | R2 | Eα (kJ mol−1) | R2 | Eα (kJ mol−1) | R2 | Eα (kJ mol−1) | R2 | |
| 0.1 | 131.22 | 0.99 | 132.89 | 0.99 | 131.60 | 0.99 | 90.20 | 0.64 | 96.06 | 0.69 | 90.95 | 0.65 |
| 0.2 | 150.59 | 0.99 | 151.60 | 0.99 | 150.92 | 0.99 | 110.74 | 0.73 | 115.90 | 0.76 | 111.44 | 0.73 |
| 0.3 | 153.60 | 0.98 | 154.67 | 0.98 | 153.94 | 0.98 | 112.84 | 0.80 | 118.16 | 0.83 | 113.57 | 0.81 |
| 0.4 | 161.96 | 0.98 | 162.77 | 0.98 | 162.29 | 0.98 | 120.41 | 0.93 | 125.65 | 0.94 | 121.14 | 0.93 |
| 0.5 | 155.81 | 0.95 | 157.08 | 0.95 | 156.18 | 0.95 | 167.41 | 0.99 | 170.68 | 0.99 | 168.00 | 0.99 |
| 0.6 | 142.63 | 0.99 | 144.68 | 0.99 | 143.06 | 0.99 | 182.74 | 0.97 | 185.58 | 0.97 | 183.31 | 0.97 |
| 0.7 | 135.01 | 0.96 | 137.56 | 0.97 | 135.49 | 0.96 | 212.89 | 0.96 | 214.51 | 0.96 | 213.37 | 0.96 |
| 0.8 | 113.92 | 0.86 | 117.63 | 0.88 | 114.48 | 0.86 | 229.06 | 0.99 | 230.15 | 0.99 | 229.52 | 0.99 |
| 0.9 | 101.10 | 0.73 | 105.67 | 0.76 | 101.73 | 0.73 | 275.90 | 0.91 | 275.06 | 0.92 | 276.22 | 0.91 |
| Avg. (0.2–0.9) | 139.33 | 141.46 | 139.76 | 176.50 | 178.64 | 177.08 | ||||||
| First Zone | Second Zone | |
|---|---|---|
| lnA | lnA | |
| 0.1 | 23.00 | 9.27 |
| 0.2 | 26.99 | 13.14 |
| 0.3 | 27.49 | 13.55 |
| 0.4 | 29.21 | 14.80 |
| 0.5 | 27.87 | 22.24 |
| 0.6 | 25.20 | 24.47 |
| 0.7 | 23.86 | 28.98 |
| 0.8 | 20.20 | 31.42 |
| 0.9 | 18.66 | 38.51 |
| Avg (0.2–0.9) | 24.94 | 23.39 |
Disclaimer/Publisher’s Note: The statements, opinions and data contained in all publications are solely those of the individual author(s) and contributor(s) and not of MDPI and/or the editor(s). MDPI and/or the editor(s) disclaim responsibility for any injury to people or property resulting from any ideas, methods, instructions or products referred to in the content. |
© 2023 by the authors. Licensee MDPI, Basel, Switzerland. This article is an open access article distributed under the terms and conditions of the Creative Commons Attribution (CC BY) license (https://creativecommons.org/licenses/by/4.0/).
Share and Cite
Prajapati, S.B.; Gautam, A.; Gautam, S.; Yao, Z.; Tesfaye, F.; Lü, X. Co-Pyrolysis Behavior, Kinetic and Mechanism of Waste-Printed Circuit Board with Biomass. Processes 2023, 11, 229. https://doi.org/10.3390/pr11010229
Prajapati SB, Gautam A, Gautam S, Yao Z, Tesfaye F, Lü X. Co-Pyrolysis Behavior, Kinetic and Mechanism of Waste-Printed Circuit Board with Biomass. Processes. 2023; 11(1):229. https://doi.org/10.3390/pr11010229
Chicago/Turabian StylePrajapati, Sonalben B., Alok Gautam, Shina Gautam, Zhitong Yao, Fiseha Tesfaye, and Xiaoshu Lü. 2023. "Co-Pyrolysis Behavior, Kinetic and Mechanism of Waste-Printed Circuit Board with Biomass" Processes 11, no. 1: 229. https://doi.org/10.3390/pr11010229
APA StylePrajapati, S. B., Gautam, A., Gautam, S., Yao, Z., Tesfaye, F., & Lü, X. (2023). Co-Pyrolysis Behavior, Kinetic and Mechanism of Waste-Printed Circuit Board with Biomass. Processes, 11(1), 229. https://doi.org/10.3390/pr11010229