Article

Identification of Cell Culture Factors Influencing Afucosylation Levels in Monoclonal Antibodies by Partial Least-Squares Regression and Variable Importance Metrics

1
Biologics Development, Global Product Development and Supply, Bristol Myers Squibb, Devens, MA 01434, USA
2
Graduate School for Pharmaceutical Sciences, Duquesne University, Pittsburgh, PA 15282, USA
3
Duquesne Center for Pharmaceutical Technology, Duquesne University, Pittsburgh, PA 15282, USA
*
Author to whom correspondence should be addressed.
These authors contributed equally to this work.
Processes 2023, 11(1), 223; https://doi.org/10.3390/pr11010223
Submission received: 30 November 2022 / Revised: 4 January 2023 / Accepted: 5 January 2023 / Published: 10 January 2023

Abstract

:
Retrospective analysis of historic data for cell culture processes is a powerful tool to develop further process understanding. In particular, deploying retrospective analyses can identify important cell culture process parameters for controlling critical quality attributes, e.g., afucosylation, for the production of monoclonal antibodies (mAbs). However, a challenge of analyzing large cell culture data is the high correlation between regressors (particularly media composition), which makes traditional analyses, such as analysis of variance and multivariate linear regression, inappropriate. Instead, partial least-squares regression (PLSR) models, in combination with machine learning techniques such as variable importance metrics, are an orthogonal or alternative approach to identifying important regressors and overcoming the challenge of a highly covariant data structure. A specific workflow for the retrospective analysis of cell culture data is proposed that covers data curation, PLS regression, model analysis, and further steps. In this study, the proposed workflow was applied to data from four mAb products in an industrial cell culture process to identify significant process parameters that influence the afucosylation levels. The PLSR workflow successfully identified several significant parameters, such as temperature and media composition, to enhance process understanding of the relationship between cell culture processes and afucosylation levels.

Graphical Abstract

1. Introduction

The modern cell culture process for the production of therapeutic monoclonal antibodies (mAbs) is a complex affair, featuring multiple culture parameters and over fifty media components. Variations in each of these parameters and media can directly affect cellular metabolism, and therefore potentially compromise any of the many quality attributes of the final mAb product [1,2]. A systematic comparison between bioreactor runs performed during normal process development with intentional variations in their process parameters is necessary to identify which parameters may affect a particular critical quality attribute (CQA). One method of generating these large datasets is by compiling historic data from previously completed investigations and experiments for retrospective analysis. The simplest and most frequently used method of comparison is to analyze a single variable at a time (i.e., univariate analysis), but this is highly inefficient and may result in the use of a small number of samples to the exclusion of the majority of the dataset. Furthermore, univariate analysis does not allow consideration of the simultaneous contributions of other variables. These limitations result in difficulties with generalizing the findings or even incorrect conclusions.
Instead of univariate analysis, statistical analysis of the dataset utilizing multivariate model-based approaches enables an improved and deeper understanding of the relevant variables. The standard method is to utilize multivariate linear regression (MLR) with appropriate analyses, such as analysis of variance (ANOVA), to identify the most important variables. MLR specifically models the correlation between the predictive independent variables (regressors) and the dependent variable. The application of MLR is limited when there is a high correlation between individual regressors. MLR is unable to separate these correlated regressors in the model, resulting in ambiguous empirical models and meaningless model interpretations. The presence of highly correlated regressors becomes more common as the dataset size increases, particularly when the data are compiled for retrospective analyses where there is a lack of calibration design [3]. The use of partial least-squares regression (PLSR) is a favorable modelling strategy as an orthogonal or alternative approach to MLR with ANOVA [4]. The issue of correlation is bypassed in PLSR via the mathematical treatment of the data to induce independence in the regressors, known as orthogonalization [5]. Beyond this, PLSR is also a dimensional reduction technique, enabling the analysis of datasets with more predictive regressors than samples, and can identify unusual samples via model diagnostics.
To identify the relevant regressors from a PLSR model, the machine learning technique of variable importance metrics, also referred to as ‘filter’ variable selection methods, is commonly utilized. Generally speaking, these metrics summarize the contribution of individual regressors to predicting the dependent variable. The metrics can be utilized to rank order the contributions of the predictive regressors, while the most statistically important/significant regressors are identified utilizing a significance threshold. Variable importance in projection (VIP) scores is the most widely utilized variable importance metric in PLSR, but the lack of a statistically defined significance threshold for VIP scores inhibits the ability to appropriately identify the most significant regressors [6]. To address this concern, other metrics, such as selectivity ratio (SR) and significance multivariate correlation (sMC), which utilize statistically defined significance thresholds, have been proposed [7,8,9]. As a method, PLSR with variable importance metrics sees widespread use in spectroscopic analysis, including the identification of key biomarkers from spectra in omics research. However, the application of PLSR for the analysis of non-spectral variables’ (temperature, pH, media components, etc.) effects on bioprocess outputs is more limited [10,11].
In the presented work, the authors describe a workflow of utilizing PLSR modelling in combination with the variable importance metrics to retrospectively identify important regressors. The workflow follows these general stages: data curation, PLS regression, model analysis, and further steps. As a case study, the PLSR-model-based workflow was applied to identify the upstream culture levers that significantly influenced the afucosylation levels of mAbs from historic experimental data. As part of the workflow development, the different variable importance metrics (VIP-scores, SR, and sMC) were compared to determine the most appropriate metric for identifying the influential regressors. The presence of a core fucose residue in the N-glycosylation of mAbs is known to affect therapeutic efficacy. The lack of a core fucose residue (afucosylation) is known to increase the antibody-dependent cell-mediated cytotoxicity of mAbs [12,13]. Therefore, there is a motivation to characterize and modulate the total afucosylation of a particular mAb. The analysis is focused on four different IgG1 molecules, where afucosylation is a presumptive CQA, with historic data compiled from multiple experiments. The appropriateness of the individual variable importance metrics and interpretation for the identified influential parameters are additionally discussed.

2. Theory

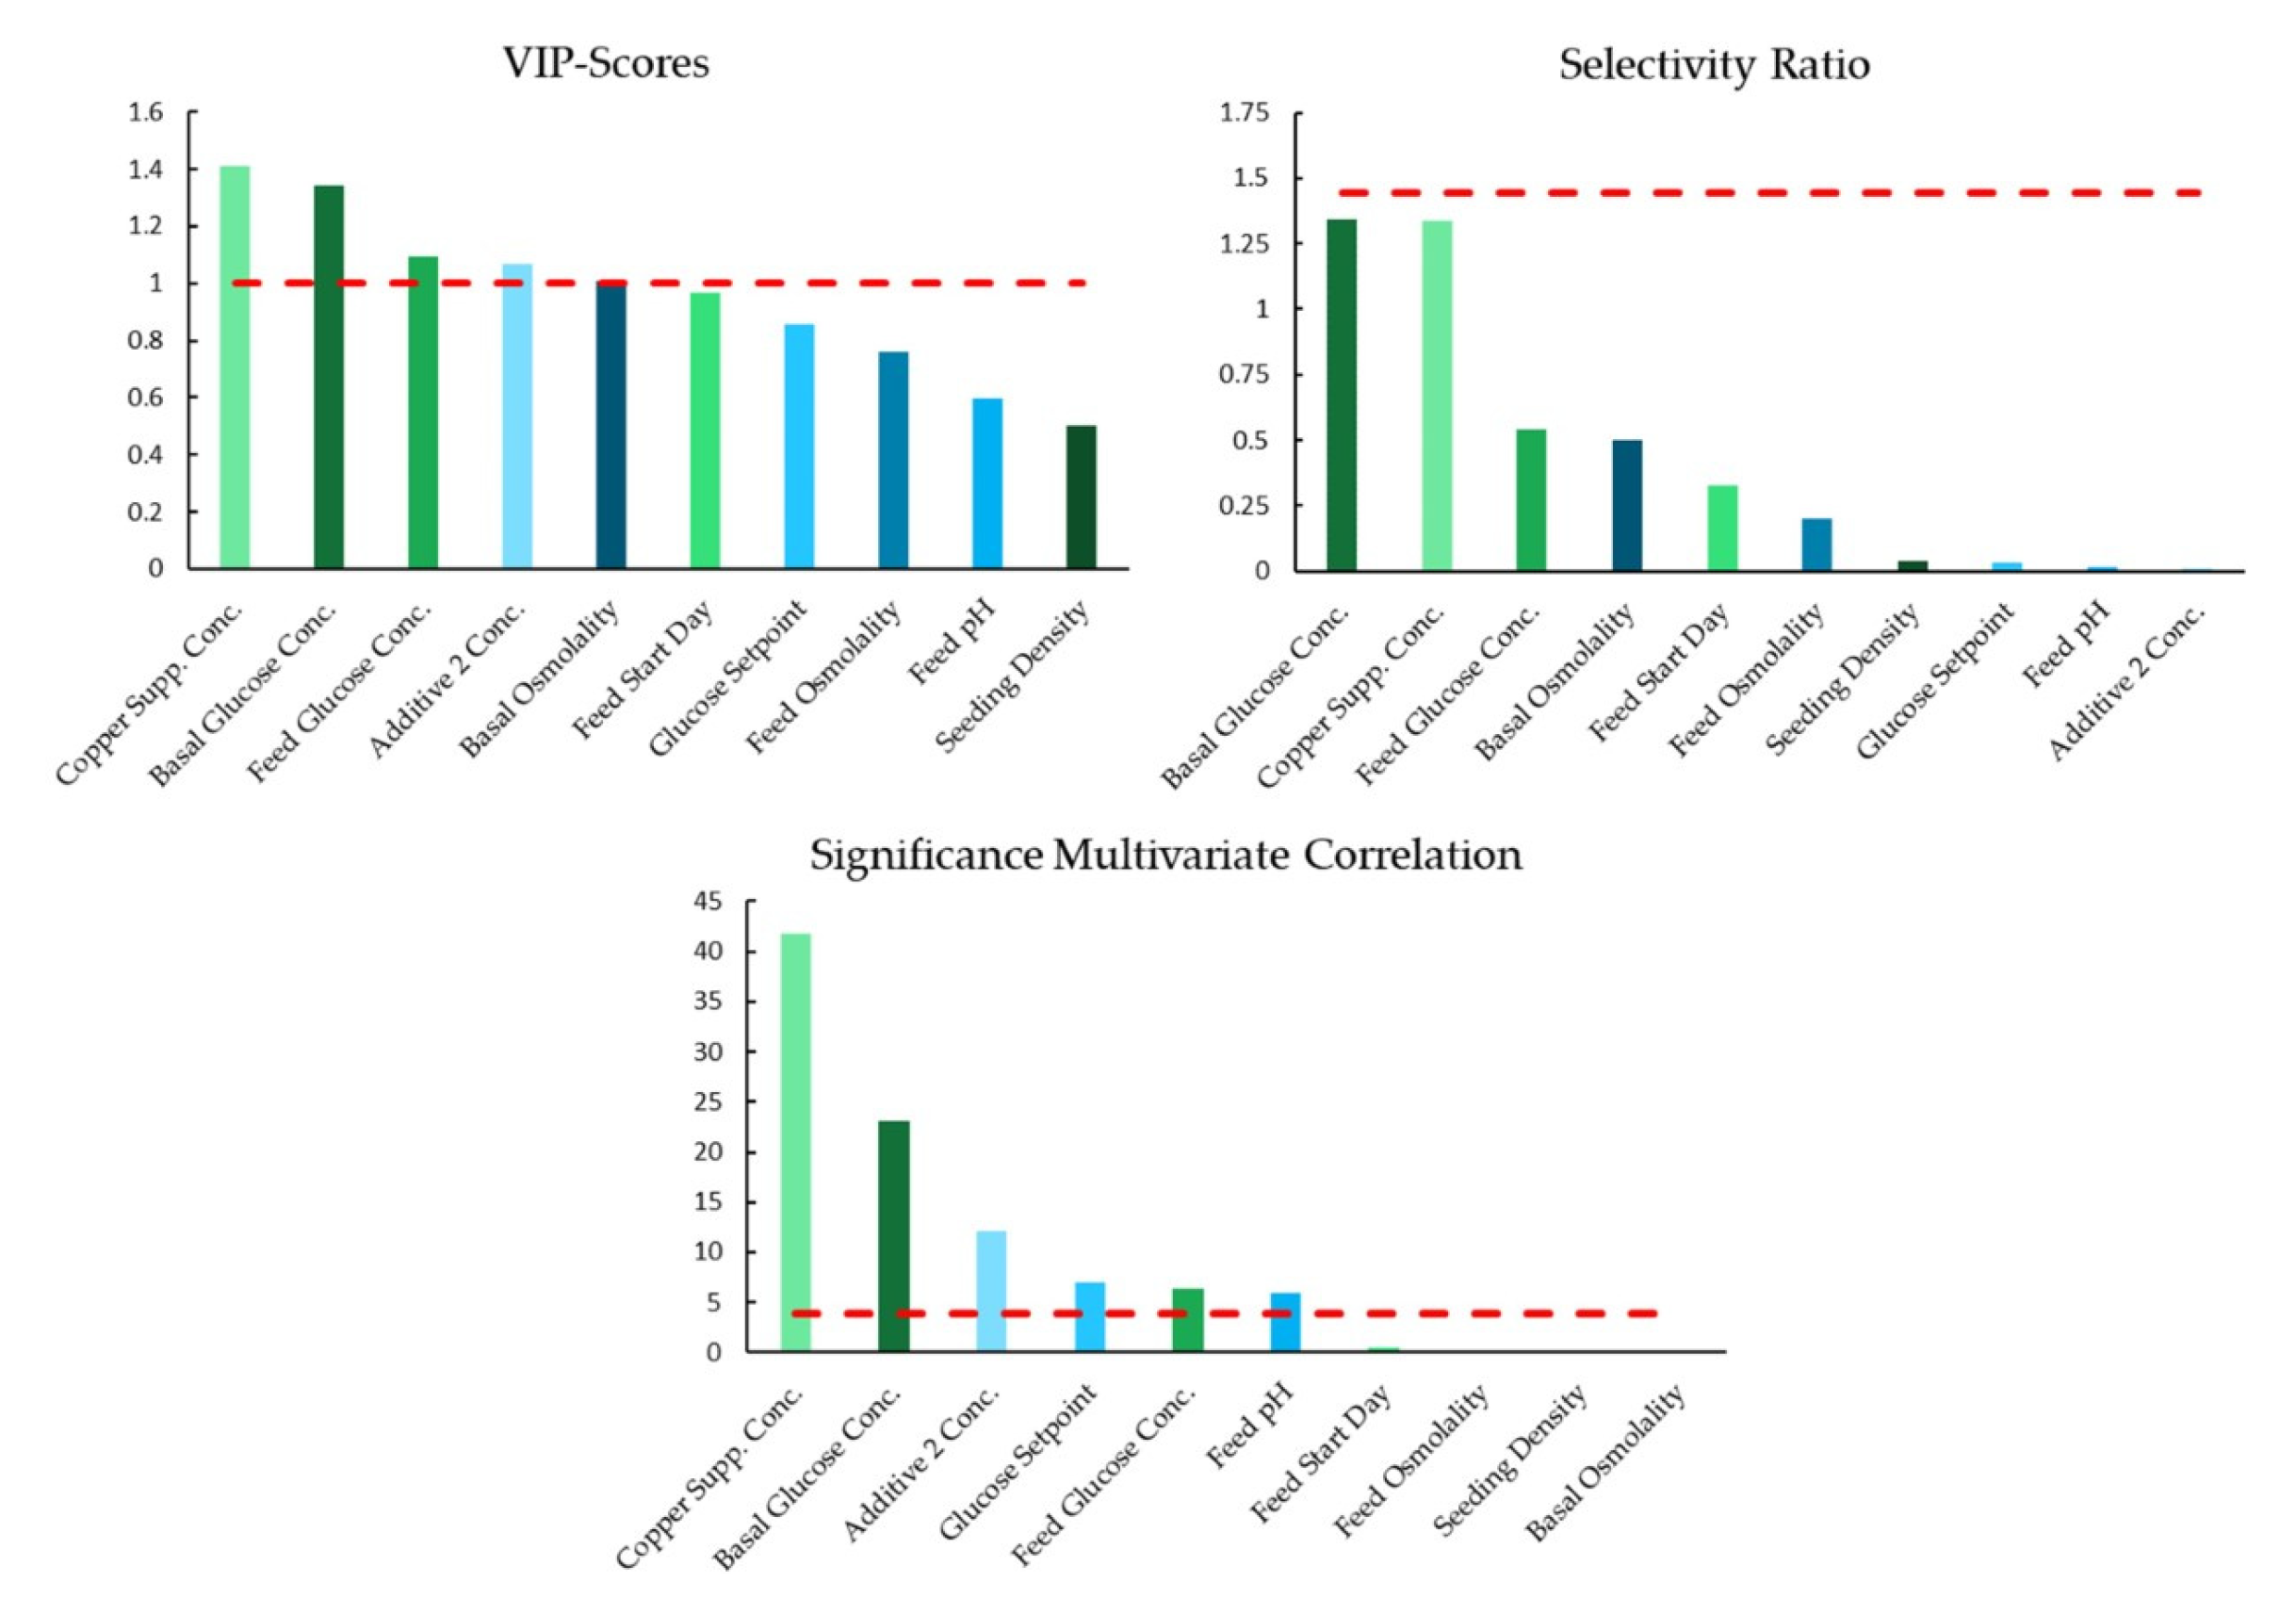
2.1. Variable Importance in Projection Scores (VIP-Scores)

The VIP score for a particular i independent regressor estimates the contribution of the given regressor to a PLSR model [5]. The VIP score is calculated according to Equation (1) from the PLSR weights (w) that capture the amount of explained dependent variable variance in each f latent variable:
VIP i = f = 1 F ( w i f 2 S S Y f I ) S S Y t o t a l F
where F is the total number of latent variables, I is the total number of regressors, and SSY is the sum of squares of explained variance for the dependent variable. The significance threshold for the VIP score is generally taken to be one, based on the mean of the squared VIP scores being equal to one.

2.2. Selectivity Ratio (SR)

The SR is defined as the ratio between the explained and unexplained variance for an independent regressor in the target projection vector [9,10]. The target projection (TP) defines the best predictive axis for the PLSR model by incorporating both the predictive and explanatory abilities of the regressors. Target projection is accomplished by projecting the regressors (X) onto the normalized PLSR model coefficients (bPLS) according to Equation (2). From the resulting scores of the target projection (tTP), the target projection loadings (pTP) are determined (Equation (3)) in order to calculate the residuals (ETP) of the target projection (Equation (4)). Both the target projection scores and loadings are directly proportional to the predicted dependent variables ( y ^ ) of the PLSR model, as shown in Equation (2).
t T P = X b P L S b P L S = y ^ b P L S
p T P = X t T P t T P T t T P
E T P = X X T P = X t T P p T P T
With scores, loadings, and residuals of the target projection, the SR for a particular i independent regressor can be determined from the explained and unexplained variances (νexplained and νunexplained, respectively) as shown in Equation (5):
SR i = ν e x p l a i n e d ,   i ν u n e x p l a i n e d ,   i = t T P , i p T P , i T 2 e T P , i 2
The significance threshold for SR is based on the F-distribution using a critical F value of F(α, N − 2, N − 3), where N is the sample size and α is the significance level [10]. If the calculated SR for a particular independent regressor is greater than the critical F value, the regressor is considered significant.

2.3. Significance Multivariate Correlation (sMC)

The sMC was developed to attempt to correct for the apparent biases in the variances obtained by SR that result from the rotation step when calculating the TP loadings in Equation (3) [9]. The calculation of sMC removes the orthogonalization step to account for this. Since it does not contain a complete rotation, the explained variance is not necessarily orthogonal to the unexplained variance as it is with SR. The loadings (psMC) and scores (tsMC) for sMC are calculated according to Equations (6) and (7), respectively, using the PLSR model coefficients (bPLS) and regressors (X).
p s M C = b P L S / b P L S
t sMC = X p sMC
The explained and unexplained variances (νexplained and νunexplained, respectively) for sMC are calculated in an equivalent manner to SR using the appropriate scores, loadings, and residuals. The significance threshold for sMC, like SR, is based on an F-distribution, but utilizes different degrees of freedom for the critical F value of F(α, 1, N − 2) based on ANOVA. With this basis, the sMC for a particular i independent regressor is calculated according to Equation (8):
sMC i = ν e x p l a i n e d ,   i ν u n e x p l a i n e d ,   i / ( N 2 )

3. Methods

3.1. Dataset Description

Upstream process conditions and glycosylation data were compiled for four different therapeutic IgG1 molecules, referred to as mAb-α, mAb-β, mAb-γ, and mAb-δ, produced by four separate K1 GS Chinese hamster ovarian (CHO) cells, all from the same parental CHO K1 GS cell line. Details for each mAb dataset are presented in Table 1, with precise definitions for each considered culture parameter given in Table S1. Additives 1 and 2 represent Bristol Myers Squibb proprietary media supplements. The experiments represented in the datasets were compiled from historic experiments previously completed during initial investigations for the mAb process development in 5L fed-batch bioreactors. Within the dataset, there were gaps in the media condition data for some of the samples. This can occur in large datasets due to difficulties and limitations within data collection. In these cases, the missing data were replaced by the target/specification values for the media. Models were generated to each describe three separate categorizations of afucosylation level: total afucosylation, high mannose, and complex afucosylation. The total afucosylation is the summation of the high mannose (Man5 thru Man9) and complex afucosylation (biantennary glycoforms such as G0, G1, G2, and G0–GN) levels. The afucosylation levels are defined as the percentage of glycoforms present in the product that are categorized as that type of afucosylation. The distributions of the afucosylation levels for each IgG1 molecule are provided in Figure S1.

3.2. Models and Software

Modeling and calculations were completed using JMP (Version 15.2.0, SAS Institute Inc., Cary, NC, USA) and MATLAB (R2017b, The MathWorks Inc., Natick, MA, USA) via the Statistics and Machine Learning Toolbox (The MathWorks Inc., Natick, MA, USA). The PLSR models were assessed using the coefficient of determination (R2) and the root mean squared error of calibration (RMSEC). The relative RMSEC, where the RMSEC is divided over the range of the dependent variables, was additionally considered.

4. Results

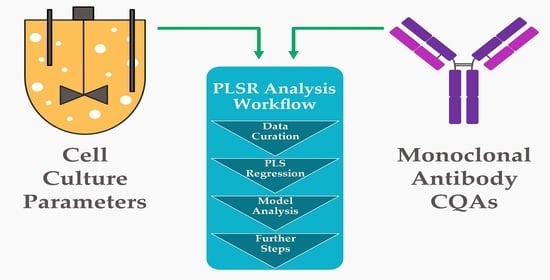
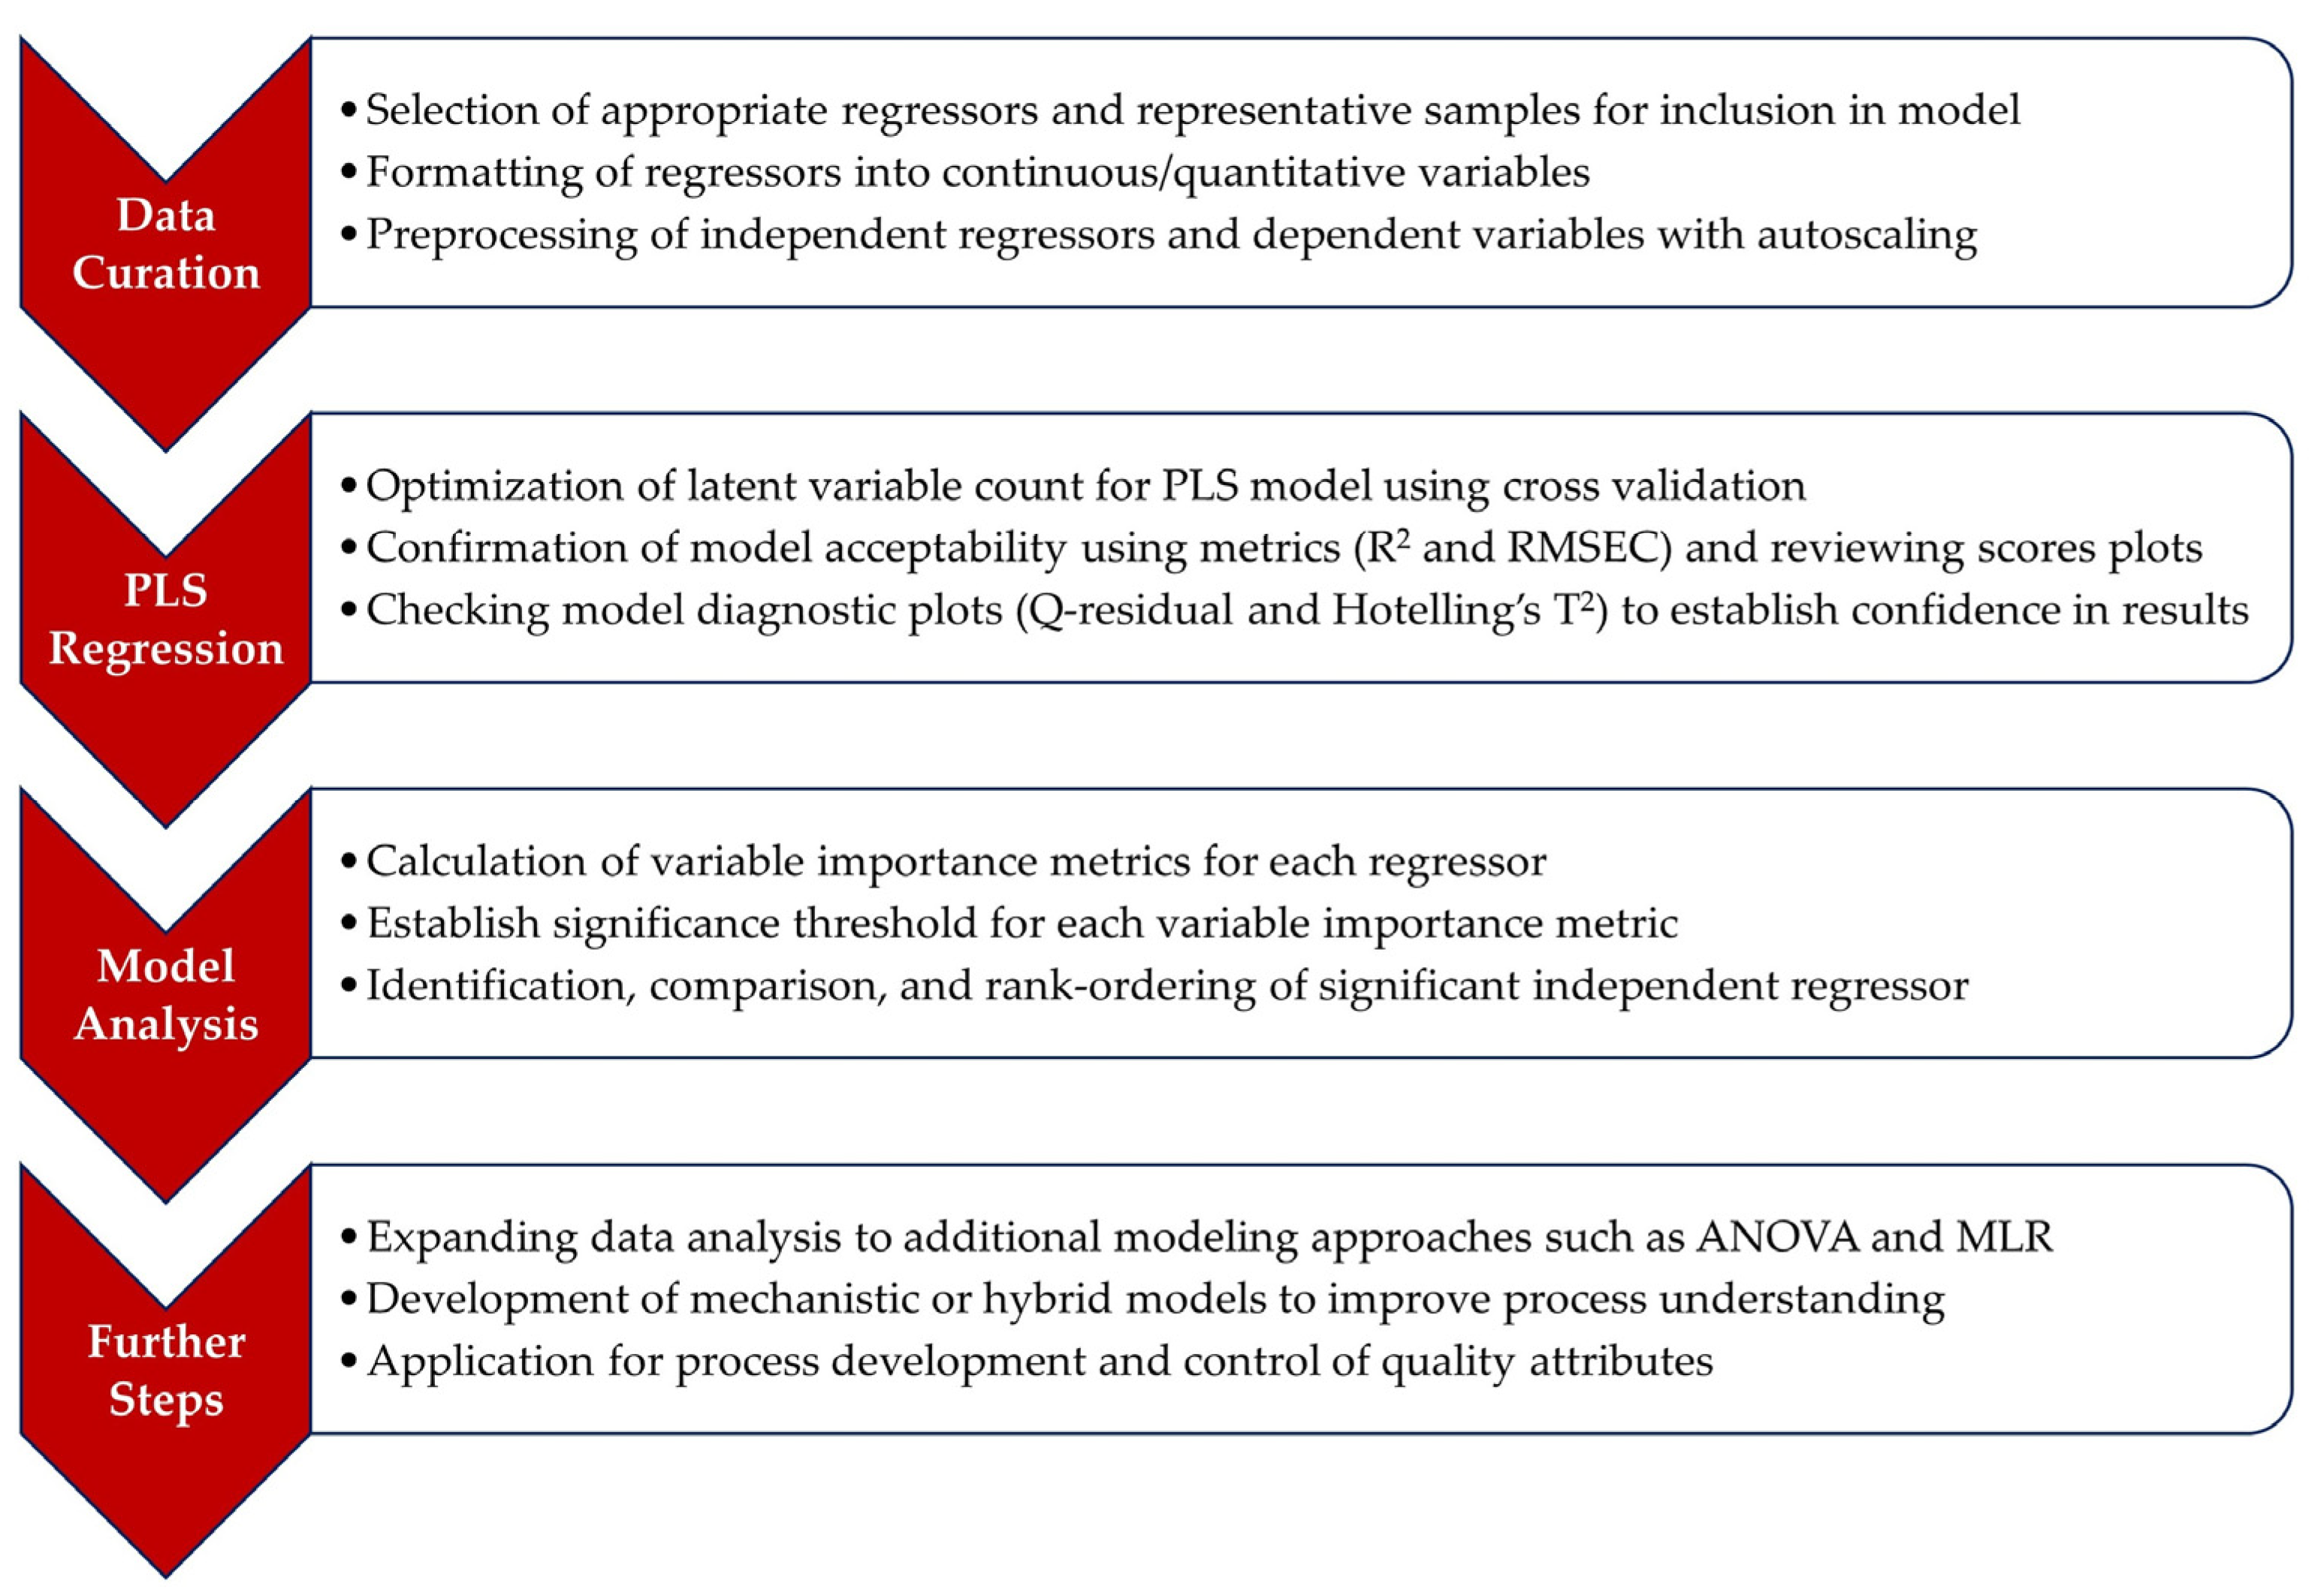
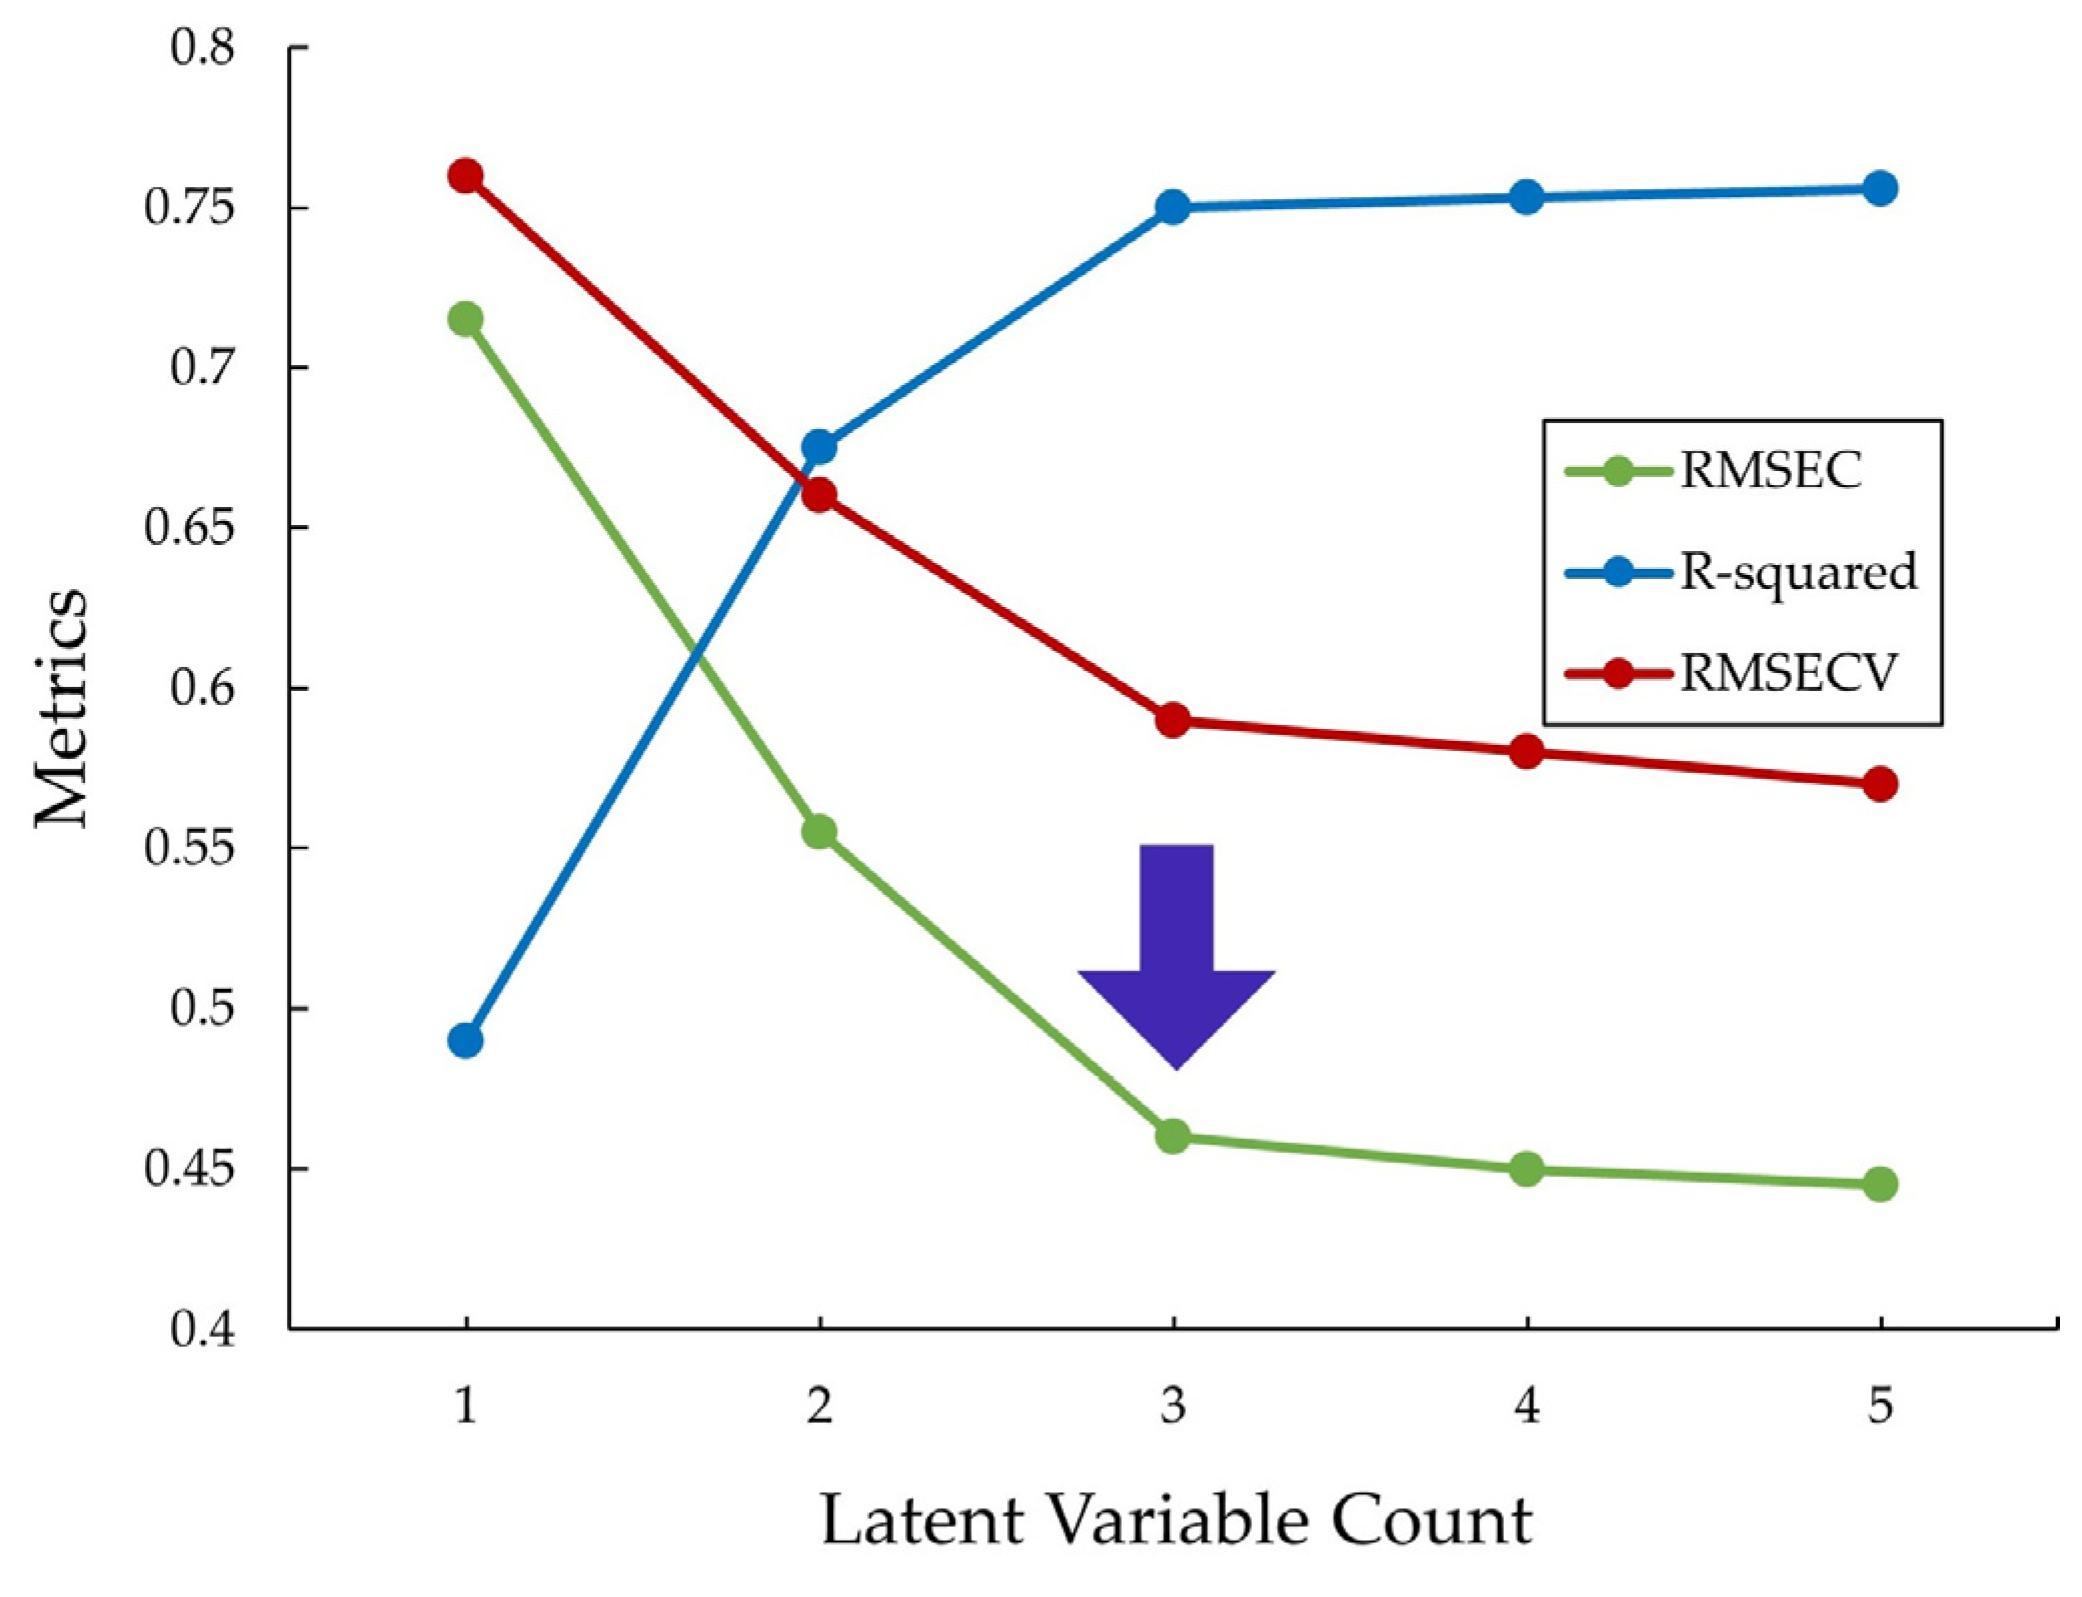
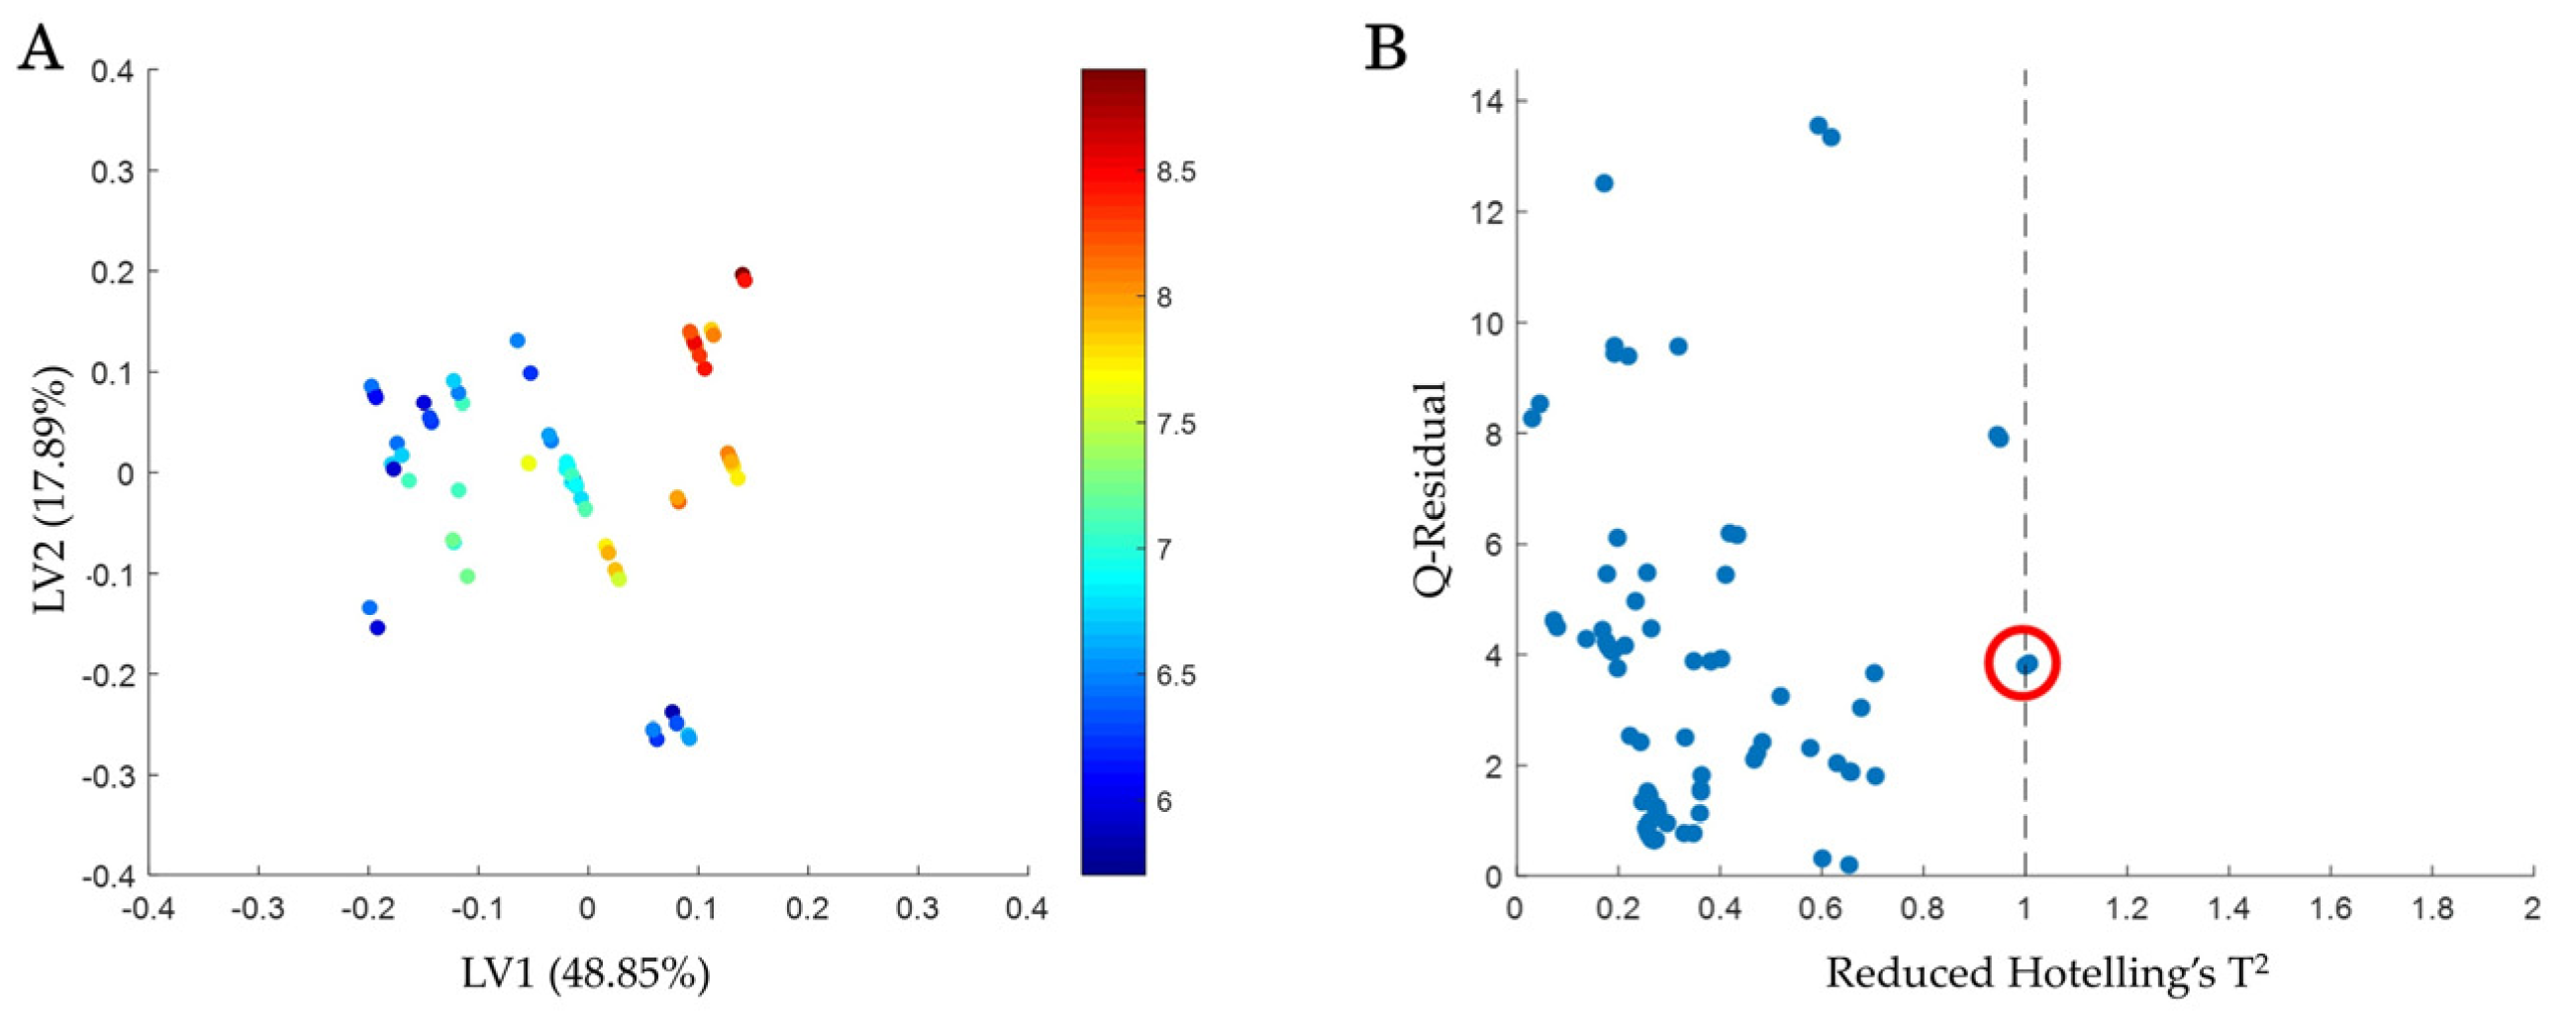
4.1. PLSR-Model-Based Workflow

The investigation of influential regressors by PLSR was accomplished using the proposed workflow that consists of four general stages: data curation, PLS regression, model analysis, and further steps. The data curation stage is focused on organizing and formatting the data appropriately. During the PLS regression stage, the desired PLSR model is optimized and finalized so that it has an appropriate performance. The variable importance metrics are calculated and analyzed during the model analysis stage. Based on the results, further steps are conducted to expand understanding and justify results in the final stage.
As with any modelling approach, the quality of the model is dependent on the quality and quantity of the dataset utilized in calibration. In the data curation stage, there are a few considerations prior to building the PLSR model. The dataset should be reviewed for missing data points that would inhibit the modelling and accounted for appropriately. The distributions for the regressors should be reviewed to ensure there is sufficient variation in order that regressors with minimal or no variance are not considered in the model. All remaining regressors should be formatted as continuous/quantitative variables, as the PLSR algorithm requires continuous variables to accurately interpret the variable importance metrics [14]. For example, rather than formatting culture media differences between runs as “media A”, “media B”, etc., the media differences should be described in terms of continuous variables, such as glucose concentration and osmolality. For categorical/qualitative variables, specialized variations of the PLS algorithm are required [14,15].
Regressors that have perfect covariance with one another, where the joint variability between the two regressors is equivalent, should be reviewed to see if it is appropriate to include them in the model. Since the PLSR is based on identifying the covariance between the regressors and the dependent variable, the regressors with the perfect covariance describe the same information in the model and will produce equivalent variable importance metric values. This will also affect the values and ranking of the variable importance metric values for other regressors, as the variable importance metrics are sensitive to the number of regressors included in the model. An example is when all the samples in a given dataset have a set pH range of ±0.2 units around the pH setpoint. This results in the pH setpoint varying in sync with the pH lower and upper bounds, indicating perfect covariance between these regressors. The samples for PLSR calibration should also be organized in such a way that the included samples are representative of the modeling goal. For example, in this study, all the bioreactor runs considered in a single model by the authors utilized the same cell line and produced the same molecule. Once the data are reviewed, applying autoscaling to the regressors and dependent variables as a preprocessing treatment is helpful. This converts the variable to have a mean of zero and standard deviation of one, enabling the variable importance metrics to have an equivalent scale to enable rank ordering of the regressors.
The key consideration in calibration during the PLS regression stage is the selection of the number of latent variables. Too few latent variables result in poor model performance, while too many latent variables produce overfitting and poor generalization of the results. The number of latent variables is selected by examining the relationship between latent variables maintained in the model and the model performance metrics R2, describing the percent variance of the dependent variable captured by the model, and RMSEC, describing the accuracy of the model predictions. The optimal PLSR model should achieve the highest percent variance explained with the inclusion of the fewest latent variables. The use of cross-validation techniques during calibration to calculate a root mean squared error of cross-validation (RMSECV) is also helpful in identifying the appropriate number of latent variables. When these performance metrics (R2, RMSEC, RMSECV) cease changing significantly with an increasing number of latent variables, the model should cease including latent variables. In other words, stabilization of the performance metrics indicates the number of latent variables. The guideline used here for defining stabilization is when the change in percent variance explained (R2) is less than 3%.
After selecting the number of latent variables, the final R2 and RMSEC should be checked to determine if the PLSR model is acceptable. If the R2 is too low or RMSEC is too high, the PLSR is not of sufficient quality. This indicates several potential issues, such as poor data, unusual samples, and the absence of relevant regressors. While the most appropriate acceptance threshold for these metrics depends on the model application, a reasonable rule of thumb is an R2 greater than 0.70 and/or the relative RMSEC being less than 10% [16,17]. To further ensure the model is appropriate, the sample scores can be plotted against one another to identify relevant patterns related to the dependent variable.
Consultation of the model diagnostics can provide additional confidence in the model results and interpretation of the variable importance metrics. The primary diagnostics considered for PLSR are the Q-residual and Hotelling’s T2. The Q-residual provides an indication of how well the latent variables capture the variance for a particular sample. Hotelling’s T2 describes the difference between a given sample and the distribution of calibration samples. Both diagnostics have a statistically defined threshold that can be utilized to identify the unusual sample, including potential outliers. For the purposes of these analyses, the authors regard Hotelling’s T2 as the most appropriate diagnostic for unusual sample detection. Once identified, they may be retained in the final model or discarded to improve model performance.
Following selection of the final model, the model analysis stage begins by calculating the variable importance metrics to identify the influential regressors. The most appropriate metric will depend on the application and analyst preferences, but it may be helpful to consider multiple variable importance metrics. Significant regressors are indicated by the significance threshold, determined as previously described in the Section 2. The regressor can be either positively or negatively correlated with the predicted dependent variable and is indicated by the sign on the model coefficients. If appropriate preprocessing was applied (i.e., autoscaling), the regressors can be rank-ordered in terms of significance.
In the further steps stage, following the identification of the influential regressors, additional data analysis and process learning is possible. For supplemental modeling, it may be advantageous to use MLR with ANOVA to explore interactions between the most influential regressors. The PLSR analysis can assist in prioritizing what variables should be maintained or discarded for such explorations. Since PLSR is a statistical approach, expanding the investigation to further experiments to confirm the effects or development of mechanistic/hybrid models can lend confidence to the conclusions. The ultimate goal of all these analyses is to develop process learning for applications to improve and control the process.
The complete PLSR model workflow, including all four stages, is summarized in Figure 1 (data curation, PLS regression, model analysis, and further steps). An example of this workflow utilizing the mAb-δ data to identify the influential bioprocess upstream levers that affect the complex afucosylation of mAb-δ is presented in the following section.

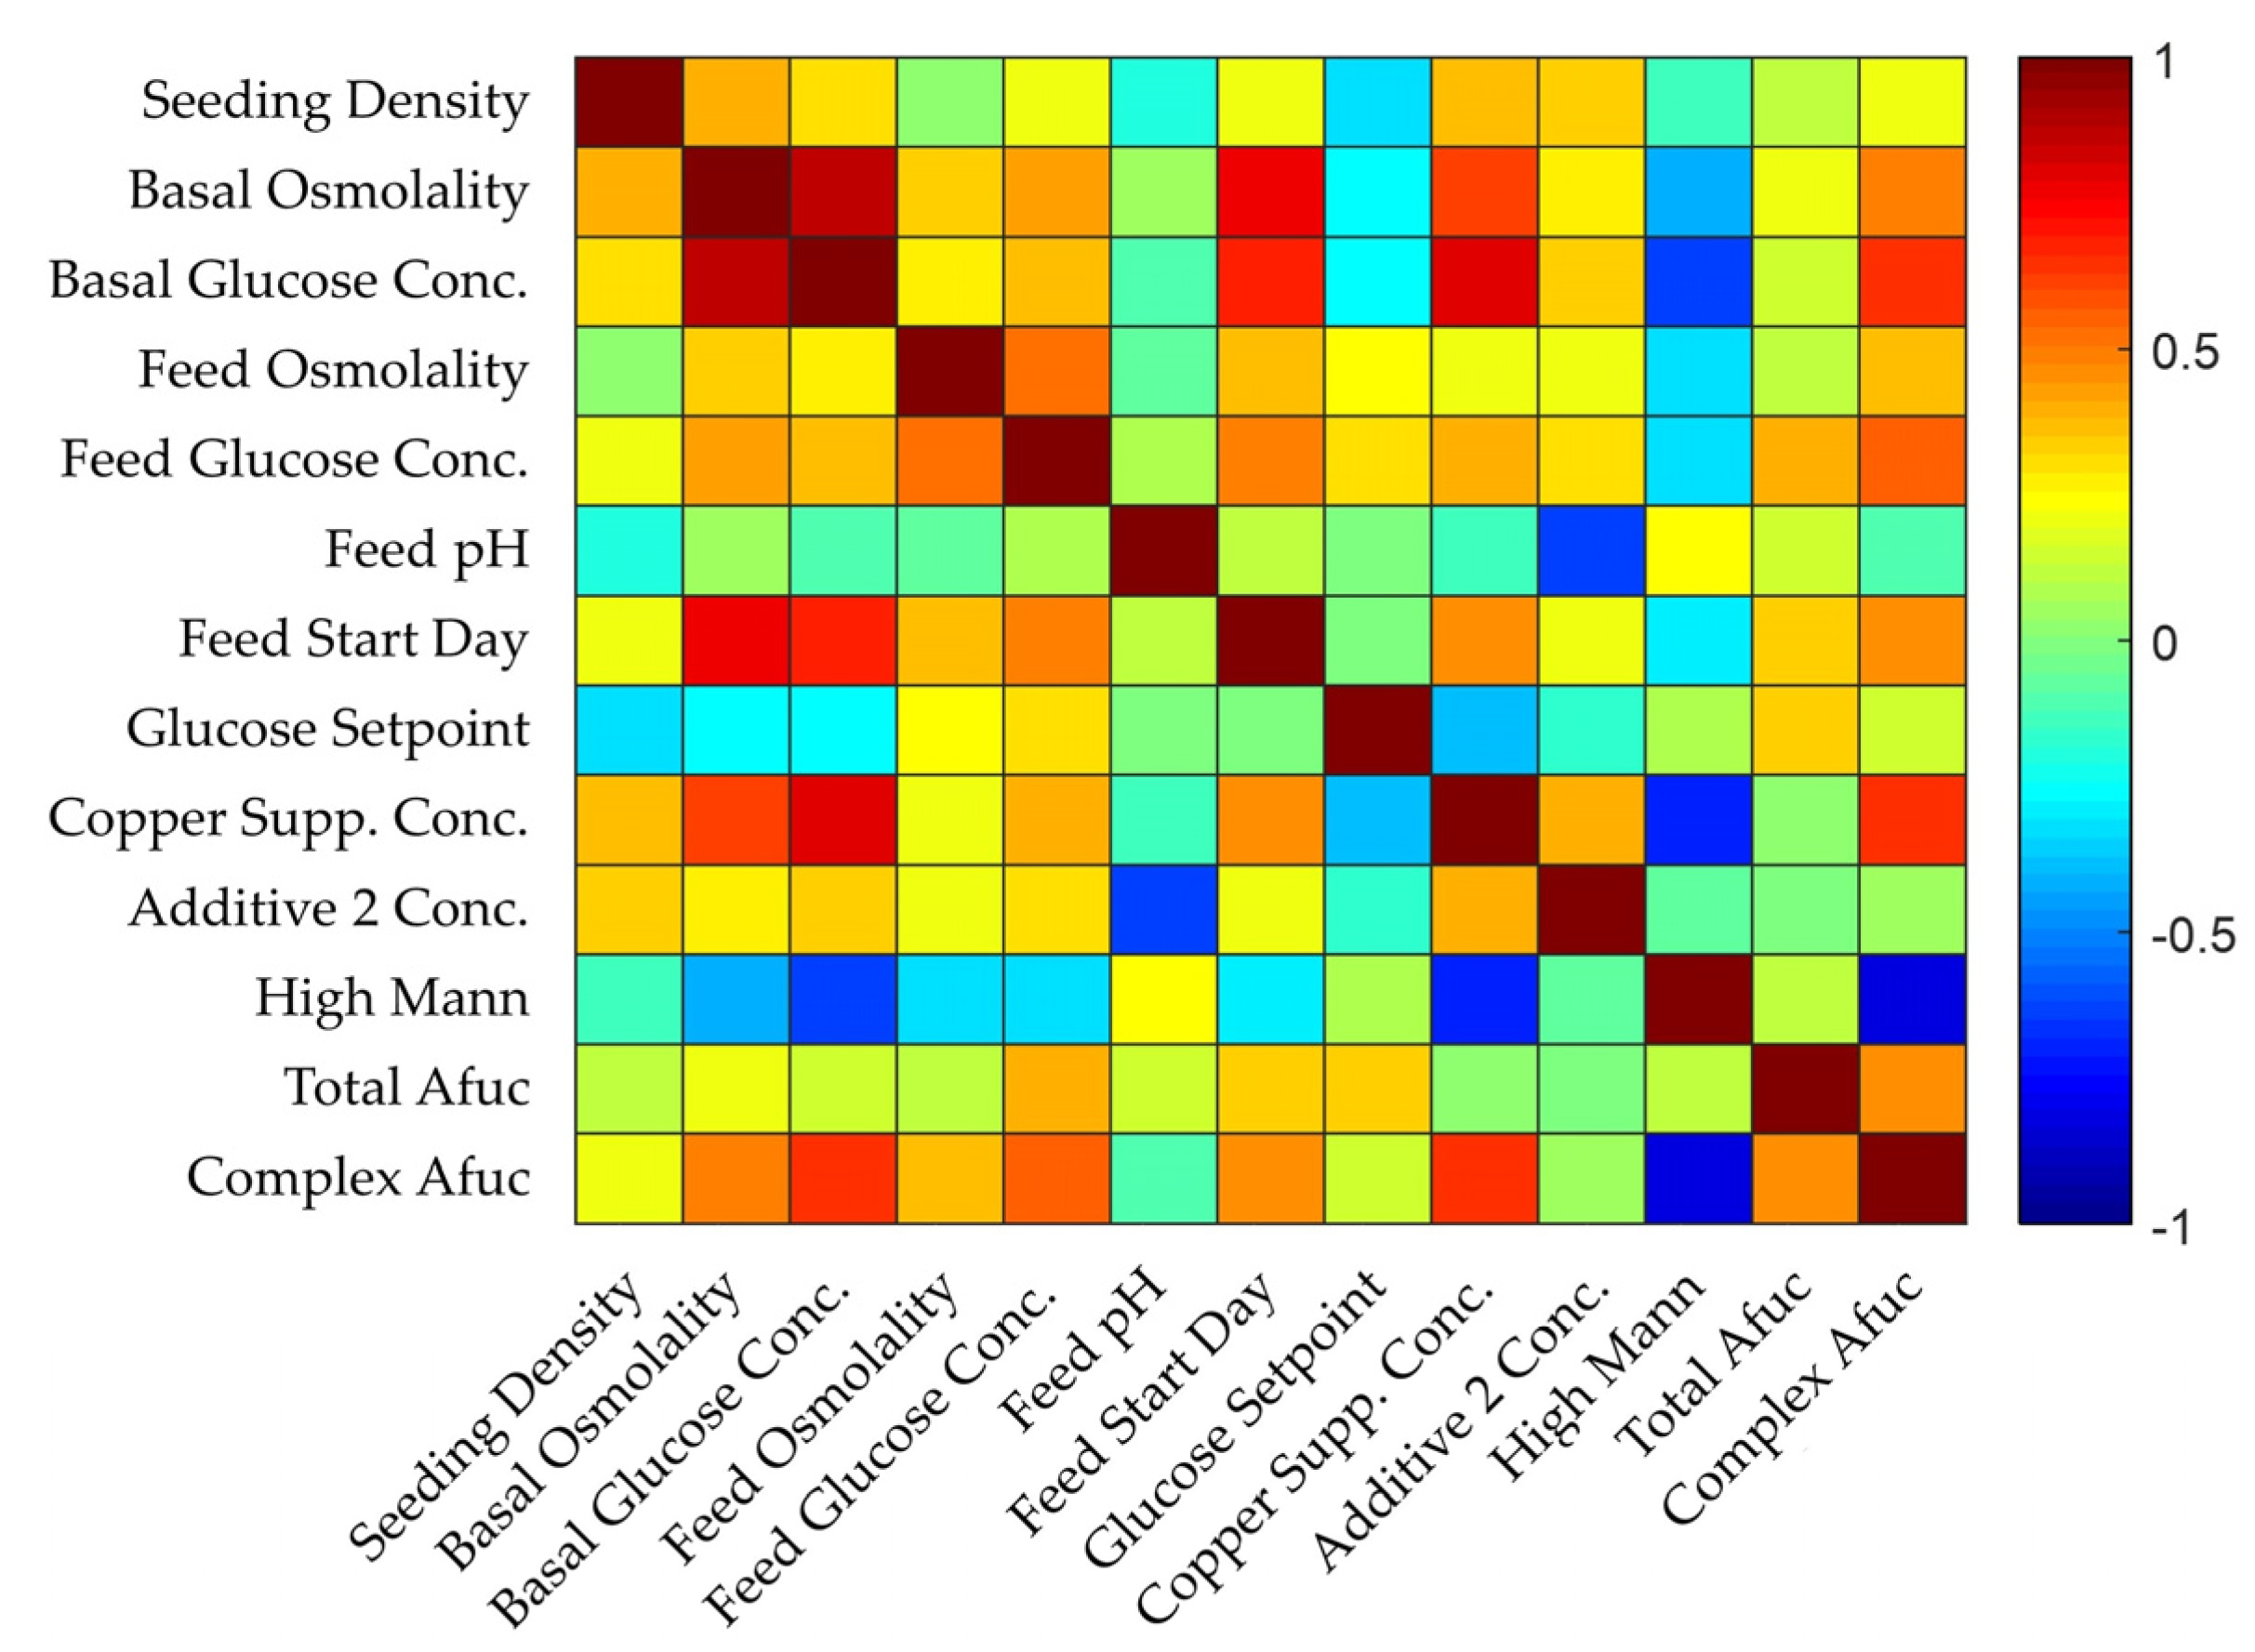
4.2. Application of Workflow: Complex Afucosylation of mAb-δ

Prior to any modeling considerations, the distributions of the parameters for mAb-δ were inspected to select the relevant regressors. Inspection of the parameters showed that several parameters lacked any variance and could not be considered in the model. Particular variables that were excluded from analysis include temperature setpoint and pH parameters. From here, the table of correlation coefficients (Figure 2) was inspected in preparation for preliminarily identifying important parameters. However, several independent variables were found to be highly correlated (|r| ≥ 0.70) with one another, most notably copper supplementation and basal glucose concentration. These were the most significantly correlated parameters with the complex afucosylation, as well as with each other. The other parameters to show undesired correlations were basal osmolality with both basal glucose and feed start day. The high correlation makes it more difficult to identify which parameter was more important by using MLR with ANOVA. Therefore, PLSR modeling was pursued to better understand the multicollinear influential regressors.
Following data curation, the construction of the PLSR model was initiated. The appropriate number of latent variables was selected by comparing the trends in R2, RMSEC, and RMSECV as the number of latent variables in the model increased (Figure 3). The cross-validation was conducted using a K-fold approach, with two groups generated using random subsets and iteratively repeated until convergence of the RMSECV. When the metrics stopped changing significantly with increasing latent variables and stabilized, the preferred latent variable number was selected.
The final model selected utilized three latent variables for predicting complex afucosylation to give a calibration R2 of 0.75 and relative RMSEC of 12.36%. Given the R2, the model was deemed acceptable. The plot of the scores for the first two latent variables was examined to ensure effective modelling of the complex afucosylation (Figure 4A). A clear trend was identifiable of increasing complex afucosylation level along both the first and second latent variable axes. With the model selected, the plot of Q-residuals vs. (reduced) Hotelling’s T2 were compared to identify unusual samples (Figure 4B). Two samples were identified as unusual from the diagnostics due to having a Hotelling’s T2 greater than the significance threshold. These unusual samples were actual replicates of one another within the same experimental group. A review of the data revealed that the samples had slightly different feed media compared to other samples in the experimental group, but the feed media was not unusual compared to the remainder on the full dataset. The samples were left in the model and the variable importance metrics were compared.
The VIP scores, SR values, and sMC values were calculated and organized in rank order of significance, as illustrated in Figure 5. The variable importance metrics between the individual regressors are directly comparable due to the autoscaling applied prior to modeling. Both the VIP scores and sMC identified the copper supplement as more significant over the basal glucose concentration. In contrast, neither variable was considered statistically significant by SR according to the threshold, but the basal glucose concentration was closer to the threshold compared to copper supplementation. With this in mind, the copper supplement was considered the more relevant influential parameter for additional consideration. Using a similar approach, the basal osmolality was selected as preferable over basal glucose concentration and feed start day.
With the influential parameters identified, MLR with ANOVA was conducted (data not shown) to identify any interaction between the cell culture parameters and further the understanding of the afucosylation data. Based on the findings of the PLSR model, the basal glucose concentration and feed start variables were excluded from the follow-up analysis, given their lower significance rank compared to copper supplementation and basal osmolality. The seeding density was found to be a significant parameter when in interaction with additive 2 and glucose setpoint. Both additive 2 and glucose setpoint were previously identified as influential parameters by the PLSR model.

4.3. Summary of Models and Influential Parameters

The influential parameters for afucosylation identified for each of the IgG1 molecules generated using the proposed PLSR workflow are summarized in Table 2. The correlation between the parameter and afucosylation is also indicated, whether positively or negatively associated. In other words, if the parameter is positively associated, an increase in the parameter will produce an increase in the afucosylation. The major influential parameters identified are discussed in further detail in the Section 5. Details for the final PLSR models utilized to generate the variable importance metrics are summarized in Table S2 of the Supplementary Material.

5. Discussion

Using sMC as the preferred variable importance metric, several process parameters were identified as statistically significant for influencing afucosylation levels. In this section, the performance of the variable importance metrics and potential mechanistic explanations for the identified parameters are presented.

5.1. Variable Importance Metrics

The purpose of the variable importance metrics is to identify the regressors that contribute significantly relative to the other regressors for the prediction of the dependent variables in the PLSR model. The VIP scores and sMC were able to consistently identify relevant regressors to afucosylation levels, but the SR rarely identified any regressors as statistically significant in the model, resulting in false negatives. The previous literature has shown that SR is less reliable with large datasets compared to VIP scores [18]. The proposed degrees of freedom for the SR significance threshold have also been criticized as inappropriate, which results in more conservative estimates of important regressors [13]. Both of these issues may account for the poor performance of SR on these datasets. If it is desirable to only consult a single variable importance metric, the authors recommend the use of sMC. While VIP scores can consistently identify regressors as significant, the calculation of VIP scores combined with the non-statistically defined significance threshold will force at least a single regressor to be significant, regardless of the model, and result in false positives. The use of sMC is the most analogous to the traditional MLR analysis, as it is functionally a coefficient analysis method and utilizes ANOVA to test for regressor significance [19]. However, it may be most appropriate to consult all three metrics when identifying the significant regressors.

5.2. Influential Parameters to Afucosylation

With the exception of the total afucosylation of the mAb-δ model, all the PLSR models satisfied at least one of the criteria (R2 greater than 0.70 or relative RMSEC less than 10%) to be considered acceptable. The influential parameters for total afucosylation are difficult to interpret with a mechanistic explanation, as the total afucosylation represents two classes of glycoforms (high mannose and complex bi-antennary) that are synthesized by related but separate mechanisms [20]. The high mannose species are the less processed glycoforms, resulting from incomplete clipping of the branched mannose residues by mannosidases in the Golgi apparatus. The complex afucosylated species are the more processed glycoforms that are not acted upon by the fucosyltransferases FUT8, which would attach a fucose residue, during the assembly of the complex glycan structure by other glycosyltransferases [21]. The complex glycoforms only form following the complete trimming of the branching mannose species. Therefore, the total afucosylation has influential parameters that are a combination of the influential parameters for the high mannose and complex afucosylation models. This produces misleading results, as several parameters have opposite effects on the high mannose and complex afucosylation that cancel out or minimize their influence on the total afucosylation. For example, the poor performance of the total afucosylation of the mAb-δ model can likely be partially attributed to the most significant parameter for both high mannose and complex afucosylation being copper supplementation, but they were affected in opposite ways. The total afucosylation of the mAb-δ model as a result did not identify copper supplementation as an influential parameter.
All of the parameters identified as influential to afucosylation differed amongst the mAbs. This was not unexpected, given the complexities of glycosylation that are influenced by both cellular and culture parameters [22,23]. Furthermore, it is well understood that there is considerable variation and complexity in the phenotypic expression between individual cells and cell lines across bioreactors, even when all cells are derived from the same clonal origin [24,25]. However, several individual parameters were consistently identified as significant across multiple molecules.
Temperature parameters were significant for both the high mannose and complex afucosylated species of both mAb-α and mAb-β. The trend of lower temperatures (lower temperature setpoint and larger temperature shift difference) being associated with higher complex afucosylation, but lower high mannose, was equivalent between mAb-α and mAb-β. The negative association between temperature and complex afucosylation agrees with the previous literature [26,27,28]. Sou et al. (2014) have reported that lower temperatures are associated with reduced metabolic activity and lower expression of the fucosyltransferase responsible for the formation of fucosylated complex glycoforms, leading to higher complex afucosylation [27]. In contrast, the positive association between temperature setpoint and high mannose may be related to the residence time of the antibody within the Golgi apparatus. Since high-mannose species represent less-processed glycoforms, shorter residence times would be expected to be associated with increased high-mannose species. Previous work has demonstrated temperature sensitivity in the transport of secretory proteins [29]. An increase of high-mannose species has also been correlated with increased cell specific productivity, which in turn is associated with reduced residence times of the product mAbs [28,30]. However, studies related to the residence time of mAbs in CHO cells are largely lacking.
The media composition and conditions have a significant effect on the afucosylation levels. This was most strongly highlighted by the modeling results for mAb-γ, where the most significant parameters were largely related to the media. The basal osmolality and related basal Na+ concentration were the most significant media parameters for mAb-γ, being positively associated with both high mannose and complex afucosylation. This may be related to unfavorable osmolality stressing the cells and reducing the function of glycosylation-related enzymes [31]. The complex afucosylation of the mAb-γ model requires careful interpretation, as even though it met the acceptable model qualifications, it required more latent variables compared to the other models, and its performance was lower compared to the total afucosylation or high-mannose mAb-γ models. This may be an indication that the regressors in the model were not entirely appropriate for describing the complex afucosylation of mAb-γ and the inclusion of additional parameters may be more appropriate.
A trend of note from the mAb-δ models was the contrary relationship between the copper sulfate and additive 2 supplementation, both of which were significant in the high-mannose and complex afucosylation models. The supplementation with copper produced higher complex afucosylation and lower high-mannose species, while the inclusion of additive 2 decreased complex afucosylation and increased the fraction of high-mannose species. A possible explanation for the copper effect is that it behaves similarly to manganese, another divalent ion commonly added to cell cultures to increase complex afucosylation [31,32,33,34]. However, supplementation with the divalent ions of nickel and cobalt did not produce an appreciable effect on afucosylation [35]. This may be a function of the overall size of the atom as it relates to binding, as copper and manganese possess larger covalent radii compared to nickel or cobalt [36]. The exact mechanism behind the manganese effect has not been fully elucidated yet to draw further comparisons between the effect of manganese and copper on afucosylation. It should also be noted that a previous study by Luo et al. (2020) found a negative association between copper supplementation and the glycoform G0 and a positive association between copper supplementation and Man5, the opposite of the results uncovered in this analysis [37]. The method of copper addition was different in both the studies, as this study used a bolus addition while Luo et al. (2020) incorporated it into the feed media [37]. This suggests that the copper effect may be cell-line-, molecule-, and/or process-dependent, which has also been observed for manganese.
Parameters related to glucose availability in the culture (basal glucose concentration, feed glucose concentration, glucose setpoint, etc.) were frequently identified as significant across all the IgG1 molecules. This is not surprising, as glucose is the primary carbon source that drives cellular metabolism and is the direct metabolic precursor to the nucleotide sugars GDP-mannose and GDP-fucose utilized by the cell for glycosylation. However, it is worth noting that the association of these glucose availability parameters differed between the mAbs. For example, glucose concentration in the feed media was identified as significant for complex afucosylation for both mAb-β and mAb-δ, but with opposite associations (negative and positive, respectively).
In summary, the most significant parameters affecting high mannose and complex afucosylation levels across the considered mAb datasets were temperature and media conditions. These findings can inform future mAb process development efforts to explain variation or generate control strategies for afucosylation.

6. Conclusions

A workflow based on PLSR models for retrospective analysis of large historic datasets is proposed. This workflow is particularly valuable for cell culture process data, where high correlation between regressors limits the use of MLR approaches. The proposed workflow is described according to four general steps: data curation, PLS regression, model analysis, and further steps. Using PLSR modelling, cell culture parameters for four different monoclonal antibodies were investigated to detect the significant culture parameters that affect the total afucosylation, high-mannose species, and complex afucosylation levels. The identified parameters showed good agreement with literature examples and mechanistic understanding of cellular metabolism as it relates to glycosylation. It is interesting to note that some of the significant parameters, such as temperature and copper supplementation, had an inverse effect between high mannose and complex afucosylation.
Based on the results of the PLSR models, future investigations will focus on further modelling to enhance process understanding. ANOVA and MLR will be utilized to search for interactions between significant parameters. Additional PLSR modeling may be leveraged to investigate more complex data, specifically the process and metabolite profiles over the time course of the culture. The use of profiles for multiple variables may exceed the number of samples in the dataset. While this is an issue for MLR with ANOVA, it is not for PLSR and takes advantage of the unique qualities of the approach. An example application is the use of the PLSR diagnostic to detect unusual bioreactor trends. The results also provide an impetus for future experiments, such as further investigating the mechanistic explanation behind the temperature effect on afucosylation. The proposed PLSR workflow has been effectively leveraged to deepen the process understanding of afucosylation and guide future investigations.

Supplementary Materials

The following supporting information can be downloaded at: https://www.mdpi.com/article/10.3390/pr11010223/s1, Figure S1: Distribution for the different afucosylation categories for the molecules (A) mAb-α, (B), mAb-β, (C) mAb-γ, and (D) mAb-δ. Table S1: List of definitions for upstream culture levers considered in the PLSR models. Table S2: Summary of the final PLSR model metrics for each of the molecules.

Author Contributions

Conceptualization, A.J.R., Z.H., K.S. and J.X; methodology, A.J.R. and Z.H.; software, A.J.R.; formal analysis, A.J.R., Z.H. and K.S.; investigation, A.J.R. and K.S.; curation, K.S. and J.X.; writing—original draft preparation, A.J.R. and Z.H.; writing—review and editing, K.S., J.X., C.A.A., M.C.B. and A.K.; visualization, A.J.R.; supervision, J.X., M.C.B. and A.K.; project administration, M.C.B. and A.K. All authors have read and agreed to the published version of the manuscript.

Funding

This research received no external funding.

Institutional Review Board Statement

Not applicable.

Informed Consent Statement

Not applicable.

Data Availability Statement

The data presented in this study are available on request from the corresponding author.

Acknowledgments

The authors wish to extend their gratitude to Johanna Santos and Yashika Singh for their assistance in compiling the historic experimental data utilized in these analyses.

Conflicts of Interest

The authors declare no conflict of interest.

References

  1. Fan, Y.; Jimenez Del Val, I.; Müller, C.; Wagtberg Sen, J.; Rasmussen, S.K.; Kontoravdi, C.; Weilguny, D.; Andersen, M.R. Amino acid and glucose metabolism in fed-batch CHO cell culture affects antibody production and glycosylation. Biotechnol. Bioeng. 2015, 112, 521–535. [Google Scholar] [CrossRef] [Green Version]
  2. Rish, A.J.; Drennen, J.K.; Anderson, C.A. Metabolic trends of Chinese hamster ovary cells in biopharmaceutical production under batch and fed-batch conditions. Biotechnol. Prog. 2022, 38, e3220. [Google Scholar] [CrossRef]
  3. Fan, J.; Han, F.; Liu, H. Challenges of big data analysis. Natl. Sci. Rev. 2014, 1, 293–314. [Google Scholar] [CrossRef] [PubMed] [Green Version]
  4. de Micheaux, P.L.; Liquet, B.; Sutton, M. Pls for big data: A unified parallel algorithm for regularised group pls. Stat. Surv. 2019, 13, 119–149. [Google Scholar] [CrossRef]
  5. Wold, S.; Sjöström, M.; Eriksson, L. PLS-regression: A basic tool of chemometrics. Chemom. Intell. Lab. Syst. 2001, 58, 109–130. [Google Scholar] [CrossRef]
  6. Chong, I.-G.; Jun, C.-H. Performance of some variable selection methods when multicollinearity is present. Chemom. Intell. Lab. Syst. 2005, 78, 103–112. [Google Scholar] [CrossRef]
  7. Rajalahti, T.; Arneberg, R.; Berven, F.S.; Myhr, K.-M.; Ulvik, R.J.; Kvalheim, O.M. Biomarker discovery in mass spectral profiles by means of selectivity ratio plot. Chemom. Intell. Lab. Syst. 2009, 95, 35–48. [Google Scholar] [CrossRef]
  8. Rajalahti, T.; Arneberg, R.; Kroksveen, A.C.; Berle, M.; Myhr, K.-M.; Kvalheim, O.M. Discriminating variable test and selectivity ratio plot: Quantitative tools for interpretation and variable (biomarker) selection in complex spectral or chromatographic profiles. Anal. Chem. 2009, 81, 2581–2590. [Google Scholar] [CrossRef]
  9. Tran, T.N.; Afanador, N.L.; Buydens, L.M.; Blanchet, L. Interpretation of variable importance in partial least squares with significance multivariate correlation (sMC). Chemom. Intell. Lab. Syst. 2014, 138, 153–160. [Google Scholar] [CrossRef]
  10. Kirdar, A.O.; Green, K.D.; Rathore, A.S. Application of multivariate data analysis for identification and successful resolution of a root cause for a bioprocessing application. Biotechnol. Prog. 2008, 24, 720–726. [Google Scholar] [CrossRef]
  11. Goldrick, S.; Holmes, W.; Bond, N.J.; Lewis, G.; Kuiper, M.; Turner, R.; Farid, S.S. Advanced multivariate data analysis to determine the root cause of trisulfide bond formation in a novel antibody–peptide fusion. Biotechnol. Bioeng. 2017, 114, 2222–2234. [Google Scholar] [CrossRef] [PubMed] [Green Version]
  12. Shields, R.L.; Lai, J.; Keck, R.; O’Connell, L.Y.; Hong, K.; Meng, Y.G.; Weikert, S.H.; Presta, L.G. Lack of fucose on human IgG1 N-linked oligosaccharide improves binding to human FcγRIII and antibody-dependent cellular toxicity. J. Biol. Chem. 2002, 277, 26733–26740. [Google Scholar] [CrossRef] [Green Version]
  13. Shinkawa, T.; Nakamura, K.; Yamane, N.; Shoji-Hosaka, E.; Kanda, Y.; Sakurada, M.; Uchida, K.; Anazawa, H.; Satoh, M.; Yamasaki, M. The absence of fucose but not the presence of galactose or bisecting N-acetylglucosamine of human IgG1 complex-type oligosaccharides shows the critical role of enhancing antibody-dependent cellular cytotoxicity. J. Biol. Chem. 2003, 278, 3466–3473. [Google Scholar] [CrossRef] [Green Version]
  14. Russolillo, G.; Lauro, C.N. A Proposal for Handling Categorical Predictors in Pls Regression Framework. In Classification and Multivariate Analysis for Complex Data Structures; Springer: Berlin/Heidelberg, Germany, 2011; pp. 343–350. [Google Scholar] [CrossRef]
  15. Trinchera, L.; Russolillo, G.; Lauro, C.N. Using categorical variables in PLS Path Modeling to build system of composite indicators. Stat. Appl. 2008, 20, 309–330. [Google Scholar]
  16. Chin, W.W. The partial least squares approach to structural equation modeling. Mod. Methods Bus. Res. 1998, 295, 295–336. [Google Scholar]
  17. Henseler, J.; Ringle, C.M.; Sinkovics, R.R. The Use of Partial Least Squares Path Modeling in International Marketing. In New Challenges to International Marketing; Emerald Group Publishing Limited: Bradford, UK, 2009. [Google Scholar] [CrossRef] [Green Version]
  18. Farrésa, M.; Platikanova, Y.; Tsakovskib, L.; Taulera, R. Comparison of the variable importance in prediction (VIP) and of the selectivity ratio (SR) variable selection methods in the analysis of three different data sets. J. Chemom. 2015, 29, 528–536. [Google Scholar] [CrossRef]
  19. Kvalheim, O.M. Variable importance: Comparison of selectivity ratio and significance multivariate correlation for interpretation of latent-variable regression models. J. Chemom. 2020, 34, e3211. [Google Scholar] [CrossRef] [Green Version]
  20. Li, W.; Zhu, Z.; Chen, W.; Feng, Y.; Dimitrov, D.S. Crystallizable fragment glycoengineering for therapeutic antibodies development. Front. Immunol. 2017, 8, 1554. [Google Scholar] [CrossRef] [Green Version]
  21. Miyoshi, E.; Noda, K.; Yamaguchi, Y.; Inoue, S.; Ikeda, Y.; Wang, W.; Ko, J.H.; Uozumi, N.; Li, W.; Taniguchi, N. The α1-6-fucosyltransferase gene and its biological significance. Biochim. Et Biophys. Acta (BBA) Gen. Subj. 1999, 1473, 9–20. [Google Scholar] [CrossRef]
  22. Goh, J.B.; Ng, S.K. Impact of host cell line choice on glycan profile. Crit. Rev. Biotechnol. 2018, 38, 851–867. [Google Scholar] [CrossRef]
  23. Thaysen-Andersen, M.; Packer, N.H. Site-specific glycoproteomics confirms that protein structure dictates formation of N-glycan type, core fucosylation and branching. Glycobiology 2012, 22, 1440–1452. [Google Scholar] [CrossRef] [PubMed] [Green Version]
  24. Welch, J.T.; Arden, N.S. Considering “clonality” A regulatory perspective on the importance on the clonal derivation of mammalian cell banks in biopharmaceutical development. Biologicals 2019, 62, 16–21. [Google Scholar] [CrossRef]
  25. Ko, P.; Misaghi, S.; Hu, Z.; Zhan, D.; Tsukuda, J.; Yim, M.; Sanford, M.; Shaw, D.; Shiratori, M.; Snedecor, B.; et al. Probing the importance of clonality: Single cell subcloning of clonally derived CHO cell Lines yields widely diverse clones differing in growth, productivity, and product quality. Biotechnol. Prog. 2018, 34, 624–634. [Google Scholar] [CrossRef] [PubMed]
  26. Agarabi, C.D.; Schiel, J.E.; Lute, S.C.; Chavez, B.K.; Boyne II, M.T.; Brorson, K.A.; Khan, M.; Read, E.K. Bioreactor process parameter screening utilizing a Plackett-Burman design for a model monoclonal antibody. J. Pharm. Sci. 2015, 104, 1919–1928. [Google Scholar] [CrossRef] [PubMed]
  27. Sou, S.N.; Sellick, C.; Lee, K.; Mason, A.; Kyriakopoulos, S.; Polizzi, K.M.; Kontoravdi, C. How does mild hypothermia affect monoclonal antibody glycosylation? Biotechnol. Bioeng. 2015, 112, 1165–1176. [Google Scholar] [CrossRef] [PubMed] [Green Version]
  28. Nam, J.H.; Zhang, F.; Ermonval, M.; Linhardt, R.J.; Sharfstein, S.T. The effects of culture conditions on the glycosylation of secreted human placental alkaline phosphatase produced in Chinese hamster ovary cells. Biotechnol. Bioeng. 2008, 100, 1178–1192. [Google Scholar] [CrossRef] [Green Version]
  29. Saraste, J.; Palade, G.E.; Farquhar, M.G. Temperature-sensitive steps in the transport of secretory proteins through the Golgi complex in exocrine pancreatic cells. Proc. Natl. Acad. Sci. USA 1986, 83, 6425–6429. [Google Scholar] [CrossRef] [Green Version]
  30. Zalai, D.; Hevér, H.; Lovász, K.; Molnár, D.; Wechselberger, P.; Hofer, A.; Párta, L.; Putics, Á.; Herwig, C. A control strategy to investigate the relationship between specific productivity and high-mannose glycoforms in CHO cells. Appl. Microbiol. Biotechnol. 2016, 100, 7011–7024. [Google Scholar] [CrossRef] [Green Version]
  31. Nguyen Dang, A.; Mun, M.; Rose, C.M.; Ahyow, P.; Meier, A.; Sandoval, W.; Yuk, I.H. Interaction of cell culture process parameters for modulating mAb afucosylation. Biotechnol. Bioeng. 2019, 116, 831–845. [Google Scholar] [CrossRef]
  32. Gramer, M.J.; Eckblad, J.J.; Donahue, R.; Brown, J.; Shultz, C.; Vickerman, K.; Priem, P.; van den Bremer, E.T.; Gerritsen, J.; van Berkel, P.H. Modulation of antibody galactosylation through feeding of uridine, manganese chloride, and galactose. Biotechnol. Bioeng. 2011, 108, 1591–1602. [Google Scholar] [CrossRef]
  33. St Amand, M.M.; Radhakrishnan, D.; Robinson, A.S.; Ogunnaike, B.A. Identification of manipulated variables for a glycosylation control strategy. Biotechnol. Bioeng. 2014, 111, 1957–1970. [Google Scholar] [CrossRef]
  34. Surve, T.; Gadgil, M. Manganese increases high mannose glycoform on monoclonal antibody expressed in CHO when glucose is absent or limiting: Implications for use of alternate sugars. Biotechnol. Prog. 2015, 31, 460–467. [Google Scholar] [CrossRef] [PubMed]
  35. Prabhu, A.; Gadgil, M. Nickel and cobalt affect galactosylation of recombinant IgG expressed in CHO cells. Biometals 2019, 32, 11–19. [Google Scholar] [CrossRef] [PubMed]
  36. Cordero, B.; Gómez, V.; Platero-Prats, A.E.; Revés, M.; Echeverría, J.; Cremades, E.; Barragán, F.; Alvarez, S. Covalent radii revisited. Dalton Trans. 2008, 21, 2832–2838. [Google Scholar] [CrossRef] [PubMed]
  37. Luo, Y.; Lovelett, R.J.; Price, J.V.; Radhakrishnan, D.; Barnthouse, K.; Hu, P.; Schaefer, E.; Cunningham, J.; Lee, K.H.; Shivappa, R.B. Modeling the effect of amino acids and copper on monoclonal antibody productivity and glycosylation: A modular approach. Biotechnol. J. 2021, 16, 2000261. [Google Scholar] [CrossRef] [PubMed]
Figure 1. Summary of the proposed PLSR workflow for identifying the influential independent regressors.
Processes 11 00223 g001
Figure 2. Correlation map between the cell culture parameters and afucosylation levels for mAb-δ.
Processes 11 00223 g002
Figure 3. Plot for selection of optimal number of latent variables (LV) for PLSR model predicting mAb-δ complex afucosylation. The arrow indicates the point of stabilization for the RMSEC and RMSECV that was used to select the final number of LVs.
Processes 11 00223 g003
Figure 4. (A) The plot of the scores on LV1 versus the scores on LV2 for the mAb-δ PLSR model. The color represents the complex afucosylation level. (B) The Q-residual vs. Reduced Hotelling’s T2 diagnostic plots for mAb-δ PLSR model. The dashed line represents the significance threshold for the reduced Hotelling’s T2, with unusual samples circled in red.
Processes 11 00223 g004
Figure 5. Plots showing the values of the variable importance metrics calculated from the PLSR model predicting the complex afucosylation level of mAb-δ. The red dashed line indicates the significance threshold of the metric. Each different parameter is represented by a unique colored bar.
Processes 11 00223 g005
Table 1. Dataset details for each of the mAbs considered within this study (conc. means concentration, supp. means supplementation).
MoleculesNumber of Bioreactor RunsCulture Duration (Days)Culture Process Parameters
mAb-α5514Basal Glucose Conc. pH Setpoint
Basal OsmolalitySeeding Density
Daily Feed %Temperature Shift Difference
Feed Glucose Conc.Temperature Setpoint
Feed Osmolality
Feed pH
mAb-β8014Basal Glucose Conc.Feed pH
Basal OsmolalitypH Setpoint
Daily Feed %Seeding Density
Feed Glucose Conc.Temperature Setpoint
Feed Osmolality
mAb-γ6112Additive 1 Bolus Conc.Feed Glucose Conc.
Additive 1 Bolus DayFeed Glutamate Conc.
Additive 1 FeedFeed Glutamine Conc.
Basal AmmoniaFeed Na+ Conc.
Basal Glucose Conc.Feed Glucose Conc.
Basal Glutamate Conc.Feed Osmolality
Basal Glutamine Conc.Feed pH
Basal Na+ Conc.pH Setpoint
Basal OsmolalitypH Lower Bound
Daily Feed %Seeding Density
Feed Ammonia
mAb-δ8114Additive 2 Conc.Feed Osmolality
Basal Glucose Conc.Feed pH
Basal OsmolalityFeed Start Day
Copper Supp. Conc.Glucose Setpoint
Feed Glucose Conc.Seeding Density
Table 2. The significant cell culture parameters influential to afucosylation identified by each of the PLSR model variable importance metrics. The parameters are organized in rank order of significance. The sign of the coefficient indicates either a positive (+) or negative (−) relationship between the parameter and afucosylation.
Total AfucosylationHigh MannoseComplex Afucosylation
mAb-αVIP
  • Temperature Setpoint (+)
  • Basal Glucose Conc. (+)
  • Temperature Setpoint (+)
  • Temperature Shift Diff. (+)
  • Feed pH (−)
  • Feed Glucose Conc. (+)
  • Temperature Setpoint (−)
SR
  • Temperature Setpoint (+)
  • Temperature Setpoint (+)
  • None identified as significant
sMC
  • Temperature Setpoint (+)
  • pH Setpoint (+)
  • Temperature Setpoint (+)
  • Temperature Shift Diff. (+)
  • Feed pH (−)
  • Temperature Setpoint (−)
  • Feed Glucose Conc. (+)
  • Basal Glucose Conc. (+)
mAb-βVIP
  • pH Setpoint (+)
  • Seeding Density (+)
  • Basal Osmolality (+)
  • Seeding Density (+)
  • Temperature Setpoint (+)
  • Basal Glucose Conc. (−)
  • Basal Osmolality (−)
  • Temperature Setpoint (−)
  • pH Setpoint (+)
  • Feed Osmolality (+)
SR
  • None identified as significant
  • Seeding Density (+)
  • None identified as significant
sMC
  • pH Setpoint (+)
  • Seeding Density (+)
  • Basal Glucose Conc. (+)
  • Basal Osmolality (+)
  • Daily Feed % (−)
  • Seeding Density (+)
  • Temperature Setpoint (+)
  • Feed Glucose Conc. (+)
  • Temperature Setpoint (−)
  • Feed Osmolality (+)
  • pH Setpoint (+)
  • Feed Glucose Conc (−)
  • Seeding Density (−)
mAb-γVIP
  • Basal Na+ Conc. (+)
  • Basal Osmolality (+)
  • Feed Na+ Conc. (+)
  • Additive 1 Bolus Day (−)
  • Feed pH (+)
  • Additive 1 Bolus Conc. (+)
  • Basal Osmolality (+)
  • Basal Na+ Conc. (+)
  • Additive 1 Bolus Day (−)
  • Feed Osmolality (+)
  • pH Lower Bound (−)
  • Feed Na+ Conc. (+)
  • Additive 1 Bolus Conc. (+)
  • Basal Glucose Conc. (+)
  • Basal Na+ Conc. (+)
  • Feed Glucose Conc. (+)
  • Basal Ammonia (+)
  • Feed pH (+)
  • Basal Glutamate Conc. (+)
  • Basal Osmolality (−)
SR
  • None identified as significant
  • None identified as significant
  • None identified as significant
sMC
  • Basal Na+ Conc. (+)
  • Basal Osmolality (+)
  • Seeding Density (−)
  • Basal Glucose Conc. (+)
  • Feed Na+ Conc. (+)
  • Daily Feed % (+)
  • Basal Osmolality (+)
  • Additive 1 Bolus Day (−)
  • Basal Glucose Conc. (+)
  • Feed Na+ Conc. (+)
  • Feed Osmolality (+)
  • pH Lower Bound (−)
  • Additive 1 Feed (+)
  • Basal Na+ Conc (+)
  • Basal Ammonia (+)
mAb-δVIP
  • Glucose Setpoint (+)
  • Feed Glucose Conc. (+)
  • Feed Start Day (+)
  • Copper Supp. Conc. (−)
  • Basal Glucose Conc. (−)
  • Additive 2 Conc. (+)
  • Copper Supp. Conc. (+)
  • Basal Glucose Conc (+)
  • Feed Glucose Conc (+)
  • Additive 2 Conc (−)
  • Basal Osmolality (−)
SR
  • None identified as significant
  • Copper Supplement (−)
  • None identified as significant
sMC
  • Glucose Setpoint (+)
  • Feed Glucose Conc. (+)
  • Feed Start Day (+)
  • Seeding Density (+)
  • Feed Osmolality (−)
  • Copper Supp. Conc. (−)
  • Basal Glucose Conc. (−)
  • Additive 2 Conc. (+)
  • Feed pH (+)
  • Copper Supp. Conc. (+)
  • Basal Glucose Conc. (+)
  • Additive 2 Conc (−)
  • Glucose Setpoint (+)
  • Feed Glucose Conc. (+)
  • Feed pH (−)
Disclaimer/Publisher’s Note: The statements, opinions and data contained in all publications are solely those of the individual author(s) and contributor(s) and not of MDPI and/or the editor(s). MDPI and/or the editor(s) disclaim responsibility for any injury to people or property resulting from any ideas, methods, instructions or products referred to in the content.

