Article

Cyclic Production of Galacto-Oligosaccharides through Ultrafiltration-Assisted Enzyme Recovery

1
Department of Food Process Engineering, Hungarian University of Agriculture and Life Sciences, Villányi út 29-43, H-1118 Budapest, Hungary
2
Department of Applied Statistics, Hungarian University of Agriculture and Life Sciences, Villányi út 29-43, H-1118 Budapest, Hungary
*
Author to whom correspondence should be addressed.
Processes 2023, 11(1), 225; https://doi.org/10.3390/pr11010225
Submission received: 8 December 2022 / Revised: 3 January 2023 / Accepted: 5 January 2023 / Published: 10 January 2023

Abstract

:
Galacto-oligosaccharides (GOS) are prebiotics manufactured enzymatically from lactose as substrate. The growing GOS market facilitates the valorization of dairy by-products which represent cheap and abundant sources of lactose. Large-scale GOS production typically employs soluble enzymes in batch reactors that are commonly associated with low enzyme usability and, therefore, high operational expenditures. In this study, we investigate the possibility of recovering enzymes by ultrafiltration (UF) and reusing them in repeated reaction steps. The proposed process scheme included 24 h batch reaction steps with Biolacta N5, a commercial enzyme preparation of Bacillus circulans origin. The reaction steps were followed by UF steps to separate the carbohydrate products from the enzymes by applying a volume concentration factor of 8.6. Then, the collected biocatalysts were reused for repeated cycles by adding fresh lactose. Enzyme losses were quantified with a direct method by analyzing the underlying relationship between reaction rates and enzyme dosage obtained from additional experiments conducted with known enzyme loads. Within five cycles, the enzyme activity declined gradually from 923 to 8307 U·kg−1, and the half-life was estimated as ca. 15.3 h. The outcomes of this study may serve as a basis for further optimization of the reported process scheme with enhanced enzyme usability.

Graphical Abstract

1. Introduction

Galacto-oligosaccharides (GOS) are known to be prebiotic ingredients with a steadily growing market share [1]. They are considered to be GRAS (generally recognized as safe) substances, and their usage is approved for a wide range of general food applications as well as for infant formulations. In terms of structural composition, GOS are non-digestible oligosaccharides consisting of various galactosyl residues (typically ranging from two to nine units) and a terminal glucose linked via glycosidic linkages such as -(β1–2), -(β1–3), -(β1–4), and -(β1–6) [2].
GOS manufacturing involves an enzyme-catalyzed reaction using lactose as a substrate. At large-scale, this can be realized by obtaining lactose from whey [3]. The valorization of whey, as an abundant and cheap source of lactose for GOS manufacturing, may address environmental concerns related to the discharge of whey as wastewater [4]. Enzymatic approaches for GOS production include biocatalysis using whole cells [5,6], and enzymes in free [7,8] or immobilized form [9,10]. Β-galactosidases of various origins, such as bacteria, yeasts, and filamentous fungi, are applicable for GOS biosynthesis [11]. The source of the enzyme is reported to have a significant impact on the final product quality and quantity as far as GOS yield, linkage type, and degree of polymerization (DP) is concerned [12]. In addition to the enzyme origin, the reaction conditions, such as substrate concentration, enzyme concentration, temperature, and pH, may also affect the conversion process [13,14,15].
The current, large-scale manufacturing of GOS is typically carried out in batch fashion using stirred-tank reactors and employing soluble, single-use enzymes. Once the reaction is terminated, the enzymes are inactivated and removed from the GOS product by a sequence of downstream operations. The cost of the biocatalyst and the expenses associated with its removal constitute a substantial portion of the overall operational costs [16]. To overcome this problem, several attempts have recently been made to find technologies that allow the reuse of biocatalysts. These include packed bed reactors (e.g., in [10,17]), and membrane reactors with free (e.g., in [18,19]) and immobilized (e.g., in [20,21,22]) enzymes.
For such processes, the stability of the enzyme is a key factor. Although there is a considerable amount of information available on the effects of various reaction conditions on GOS yields (e.g., in [23,24]), data on enzyme half-life are limited to a few research papers. Available data on the stability of β-galactosidases used for GOS-production are summarized in Table 1.
As indicated in Table 1, measured half-life spans a wide range between 10 2 h and 10 5 h, depending on the source of enzyme, type of application of the selected enzymes (free versus immobilized), and various reaction conditions, such as pH, temperature, and applied substrate concentration.
In order to quantify the stability of GOS-producing β-galactosidases over time, previous investigators have employed the two-stage series mechanism [10,18,22] and its simplified forms [17,21,25].
The two-stage series mechanism of inactivation is represented by the scheme:
E 0   k 1   E 1 α 1 k 2   E 2 α 2
where E 0 , E 1 , and E 2 represent the enzyme activity at initial, intermediate, and final state, respectively, k 1 and k 2 are the deactivation velocity coefficients, and. α 1 and α 2 are the ratio of specific activities of E 1 / E 0 and E 2 / E 0 , respectively.
The relative enzyme activity y at specific time t can be calculated as:
y = 1 + α 1 k 1 α 2 k 2 k 2 k 1 e k 1 t α 1 k 1 α 2 k 2 k 2 k 1 e k 2 t + α 2
If the enzyme is assumed to be completely inactivated at its final state, i.e., α 2 = 0 , then Equation (2) is reduced to
y = 1 + α 1 k 1 k 2 k 1 e k 1 t α 1 k 1 k 2 k 1 e k 2 t
A specific case of the above model is the single-step model with non-zero activity at the final enzyme state, such that k 2 = 0 . In this case, the reaction scheme is reduced to
E 0   k 1   E 1 α 1
and Equation (2) can be simplified to
y = 1 α 1 e k 1 t + α 1
If the native (active) enzyme is assumed to be converted in a one-step reaction into an inactive structure, i.e., α 1 = 0 , then the model can be further reduced to:
y = e k 1 t
This later, simplified model is known as the single-step first-order model, and it has been validated for β-galactosidases of various origins by several studies [17,21,25].
It is worth mentioning that efficient GOS production requires a high substrate concentration (typically above 200 g·L−1) in order to avoid pronounced hydrolysis of lactose into glucose and galactose. Due to the low attainable GOS yields, enzyme stability values determined at low substrate concentrations, i.e., entries [18,21] in Table 1, are less relevant for the scope of this study. As indicated in Table 1, a common practice is to measure the resting stability of enzymes incubated in buffer solutions (e.g., in [17,22]). It should be noted that values obtained in such way may greatly deviate from true operational stability determined under conditions of high substrate concentrations. Additionally, as shown in Table 1, enzyme stability has been commonly evaluated by the oNPG method. Although it is a convenient and rapid method, it provides an indirect measure of the true GOS-producing activity. In fact, the method has been previously criticized by Warmerdam et al. [25] to under- and/or overestimate true activity, and a complex calculation procedure was proposed to correct the oNPG converting activity for the presence of lactose, glucose, galactose, and oligosaccharides in the activity assay.
The conventional GOS production realized in batch reactors using free enzymes is known to result in high GOS yields; however, it suffers from high operational expenditures, mainly due to the high costs of the biocatalysts with low enzyme reusability [26]. In contrast, enzyme membrane reactors (EMRs) utilizing free enzymes offer a continuous GOS production scheme [27,28]. As the ultrafiltered product stream is free of enzymes, they eliminate the need for subsequent downstream purification steps and may allow enzyme usage for extended periods of time. The drawback of continuous EMRs is, however, that they offer lower yields than conventional batch reactors [7]. A possible process alternative could be realized by the combination of batch reaction steps and subsequent ultrafiltration steps for enzyme recovery. Such a processing scheme may combine favorable features of these two technologies in terms of high yield and reduced costs for biocatalysts. To the best of our knowledge, this hybrid method, employing repetitive batch reaction and ultrafiltration steps, has not been investigated previously.
In this study, we investigate the possibility of recovering soluble enzymes by ultrafiltration in the batch production of GOS. The activity decline of enzymes over the consecutive cycles is determined under true operational conditions by a direct method that is based on evaluating the progress curves of individual fractions and comparing those with reference data measured at known enzyme loads.

2. Materials and Methods

2.1. Materials

A β-galactosidase, Biolacta N5 (Amano Enzyme Inc., Nagoya, Japan), isolated from Bacillus circulans, was utilized as a catalyst in all experiments. The activity of the crude enzyme preparation was measured to be 923 to 8307 U·kg−1, as determined by the activity assay described in Section 2.2. Lactochem Fine Powder, a pharmaceutical-grade lactose monohydrate produced by FrieslandCampina Domo B. V. (Amersfoort, The Netherlands), was employed as the substrate.

2.2. Enzyme Activity Assay

The activity of Biolacta N5 was determined by a direct measurement method on lactose as substrate. Lactose was dissolved in deionized water in a concentration of 300 g·kg −1. The pH was set to 6.0 by adding NaOH. The reaction was initiated by dosing Biolacta N5 at a concentration of 0.9 g·kg−1 into the reaction solution. The reaction was carried out in triplicate. After 20 min of incubation at 50 °C, the reaction was terminated by a 30 min heat treatment at 90 °C. High Performance Liquid Chromatography (HPLC) was used to determine the concentration of DP2 as described in Section 2.7. One unit of enzyme activity (U) was defined as the quantity of enzyme that converted 1 μmol of DP2 per minute under the given reaction conditions.

2.3. Enzymatic Conversion in Stirred Tank Reactor (STR)

To investigate the effect of enzyme load on the progress of the reaction, a series of small-scale tests in batch fashion was performed by varying the enzyme activity from 923 to 8307 U·kg−1. In each test, a 300 g reaction solution consisting of 300 g·kg−1 lactose was prepared in a beaker and placed on a C-MAG HS7 (IKA-Werke GmbH & Co. KG, Staufen, Germany) hotplate magnetic stirrer equipped with temperature control unit. The reaction solution was incubated at 50 °C and pH 6.0 under gentle stirring at 60 rpm using a magnetic stirrer. The reaction was monitored for 24–48 h. Samples were taken at regular time intervals and treated at 90 °C for 30 min to inactivate enzymes prior to HPLC analysis.

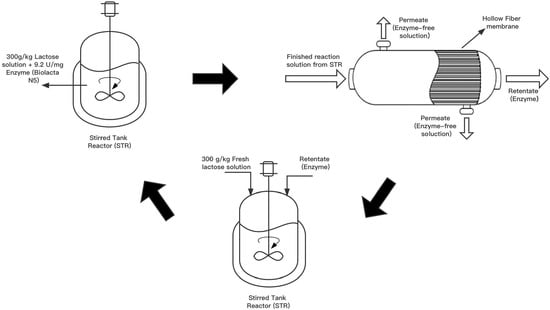
2.4. Cyclic Production of GOS in an Ultrafiltration-Assisted Reactor (Cyclic-EMR)

The enzymatic production of GOS was carried out in a batchwise manner, in multiple cycles, using the lab-scale equipment shown in Figure 1.
The configuration, here referred to as cyclic enzyme membrane reactor (cyclic-EMR), included two main parts: a stirred tank reactor (STR) and an external ultrafiltration (UF) membrane unit.
Lactose was enzymatically converted into GOS in a stainless-steel double jacketed vessel (TK-1) equipped with an overhead stirrer (A-1). The reactor was thermostated at 50 °C using a Julabo 5B waterbath thermostat (Julabo GmbH, Seelbach, Germany). A digital LT101 thermometer (Dostmann GmbH, Wertheim, Germany) was used to monitor the temperature (TI-102).
After completing the reaction step in the STR, the reaction liquid was concentrated by UF. A Hydra-Cell D-10 diaphragm pump (Wanner Engineering, Inc., Minneapolis, MN, USA) was used to recirculate the material retained by the ultrafilter (i.e., retentate) to the reactor. The recirculation flowrate was set to 180 L·h−1 by using a variable frequency drive (VFD). The pressure was adjusted by the retentate control valve (V-1) and monitored by the pressure gauge (PI-101). The membrane unit (M1) included a 0.26 m2, 30 kDa, polyethersulfone hollow-fiber module (type: FB02-CC-FUS-0382) purchased from Microdyn Nadir GmbH (Wiesbaden, Germany). During UF, the permeate was collected in the permeate vessel (TK-2), and its weight was monitored with the scale (SC-1).
The enzymatic conversion was carried out in 5 successive cycles. Each cycle was performed by executing a protocol consisting of 3 operational steps, as follows:
  • In the first step, a traditional STR was employed to carry out a batchwise reaction. A 9.5 kg reaction solution with an initial lactose concentration of 300 g·kg−1 was introduced in the reactor TK-1. The reaction was performed at 50 °C and pH 6.0, using an initial enzyme activity of 8307 U·kg−1. Samples were regularly taken from the reactor and heat-treated at 90 °C for 30 min prior to the saccharides analysis by HPLC.
  • In the second step, the membrane unit M-1 was attached to the reactor, and the reaction liquid was filtered through UF in an inside-out flow configuration at 0.5 bar transmembrane pressure until 8.4 kg of permeate was collected.
  • In the third step, the membrane module M-1 was de-attached from the plant. A total of 8.4 kg of fresh substrate solution consisting of 300 g·kg−1 of lactose was added into the concentrated enzyme solution in the reactor. Then, step 1 of the next cycle was started. The de-attached membrane was subject to a cleaning procedure, as detailed in Section 2.5.

2.5. Membrane Regeneration Procedure

After each filtration step, a membrane cleaning procedure was performed as follows: (1) draining and flushing the UF module with DI water several times; (2) circulating a NaOH solution (pH 9–10) for 1–2 h at 40–50 °C under 0.1–0.2 bar pressure; (3) draining and flushing the module several times with DI water to remove the cleaning agent; and finally (4) measuring the permeability of the cleaned membrane with DI water. Overnight, the module was stored in saturated salt solution to prevent microbial growth and drying out of the membrane material.

2.6. Analysis of Progress Curves

The progress curves of individual saccharides fractions in STR at different enzyme loads were evaluated by the model adopted from [3]. The concentration of generated saccharides fractions (i.e., glucose, galactose, and DP2 to DP6 fractions) as a function of incubation time is described by the saturation model
F t = C 0 + p 1 1 e p 2 t ,
where F is the concentration of individual saccharide fractions, t is the reaction time, C 0 is the initial concentration of saccharides, and p 1 × p 2 is the initial reaction velocity (i.e., slope of the curve at time point t = 0 ). While p 2 > 0 , in the case of DP2 (expressed in g·kg−1), p 1 < 0 ( F is decreasing); in all other cases p 1 > 0 ( F is increasing).
Next, the enzyme activity of various saccharide fractions, depending on the initial reaction velocity ( p 1 × p 2 ), was fitted by a no-intercept linear function.
The normality of the model residuals was checked by their skewness and kurtosis (the absolute values were all below 1). The model accuracy was tested by ANOVA F-test. Moreover, the parameter estimations were also tested by t-test. Finally, the explained variance rates (R2) were calculated and tested for their significance. The statistical assessment was performed with the statistical software IBM SPSS v27 (Armonk, NY, USA) [29].

2.7. High Performance Liquid Chromatography (HPLC) Analysis

The detection of various carbohydrate fractions was performed by the HPLC method as described in [7]. In brief, the HPLC system consists of three main components, (1) Thermo Separation, including an Intersciences SCM1000 degasser, a gradient pump P200, an Autosampler AS100, and a built-in Column Oven, (2) a Shodex R-101 refractive index detector from Showa Denko Europe GmbH, Munich, Germany, (3) and an N2000 Chromatography Data System from Science Technology (Hangzhou) Inc. (Hangzhou, China) for peak detection and integration. The RNM carbohydrate 8% Na+ 300 × 7.8 (Phenomenex, Torrance, CA, USA) analytical column and a guard column were used under the condition of 50 °C at 0.2 mL·min−1 with a mobile phase of pre-filtered (2 µm) DI water. Samples taken from the reactor were subject to deactivation (90 °C, 30 min) prior to HPLC analysis.

3. Results

In this study, a stirred-tank reactor employing soluble enzymes was used to produce GOS from lactose in five consecutive cycles. After each cycle, the enzymes were recycled by ultrafiltration and reused by dosing fresh substrate solution for the repeated cycles. During the cycles, concentrations of the individual saccharides fractions in the reactor were monitored. Additionally, a series of additional tests in STR were performed by varying the enzyme load. The results obtained in STR (as described in detail in Section 3.1.) at known enzyme loads were then compared with the progress curves obtained from the cyclic-EMR (see Section 3.2.), in order to quantify the losses of enzyme activity experienced cycle by cycle.

3.1. STR Performance

Five batch experiments with varying enzyme load were conducted under otherwise identical reaction conditions of 300 g·kg−1 initial lactose concentration, 50 °C, and pH 6.0. Time courses of GOS synthesis in the STR for the different enzyme loads, ranging from 923 to 8307 U·kg−1, are presented in Figure 2.
The lactose in the reactor was converted into GOS (DP3-DP6) and glucose. Although the applied HPLC-RI method restricts us to the measurement of the total amount of DP2 fraction, the literature data suggest that non-lactose dimers with various types of linkages and monomers may also appear during the reaction mixture [30]. The extent of hydrolysis activity, as measured by the amount of generated galactose, was negligible. The galactose concentration has remained typically below 1–3 w/w%. In all cases, the DP3-DP6 fraction increased gradually by the reaction time, then reached a plateau at 35.9 ± 1.8 w/w% on total carbohydrate basis. The highest synthesis rate of GOS occurred at the beginning of the reaction, followed by a gradual stabilization of GOS content. After reaching the plateau, the composition of short-chain oligosaccharides (i.e., the relative amounts of individual GOS fractions) went through some further changes; however, the total amount of GOS remained approximately constant for the rest of the observation period. For example, the GOS content peaked at the end of the reaction (~24 h) in the case of an enzyme load of 923 U·kg−1, whereas it peaked around 6 h for 8307 U·kg−1. The applied enzyme load affected the time of reaching the plateau but did not influence the composition profiles. As expected, higher enzyme loads resulted in higher reaction rates.
The saturation models (Equation (7)) were fitted to the observed concentration profiles. The results of curve fitting procedure, including the estimated parameters, their standard errors and 95% confidence intervals, together with the model accuracy F-tests, the explained variance rates ( R 2 ) and the initial reaction velocity values ( p 1 × p 2 ), are summarized in Table 2. Overall, the observed data correspond well to the assumed models.
The initial reaction velocity, which is the product of parameters p 1 and p 2 , was determined for the individual saccharides fractions. This quantity may serve as a measure of enzyme activity. The underlying relationship between initial reaction velocity and enzyme activity is presented in Figure 3.
Within the investigated range of enzyme load, linear models were found to fit the observed data well in the case of all saccharide fractions (Table 3). All the linear models and their parameters were proved to be significant (p < 0.001).
The slopes of the linear models listed in Table 3 can be employed for calibration purposes, i.e., to quantify unknown enzyme load, if reaction velocity data are available from progress curves.

3.2. Cyclic-EMR Performance

GOS was produced from lactose in a reactor system consisting of a stirred-tank re-actor and an external ultrafiltration module in five consecutive cycles. Each cycle comprised a three-step procedure. First, enzymatic synthesis of GOS was carried out in a conventional stirred-tank reactor using free enzymes. Then, the resulting carbohydrate mixture was separated by an ultrafiltration unit. The enzymes were recovered: fresh lactose was added into the concentrated enzymes, and enzymes were re-used for repeated GOS production in the subsequent cycles.
The observed progress curves of the individual saccharide fractions for the five consecutive cycles are presented in Figure 4. Each reaction step was performed at pH 6.0 and 50 °C for approx. 24 h. The initial lactose concentration and the initial enzyme activity was set to 300 g·kg−1 and 8307 U·kg−1, respectively. During the reaction, lactose was converted into GOS, glucose, and small amounts of galactose. The saturation models listed in Sect. 2.6 were used to model the experimental data. Model parameters p 1 and p 2 were estimated, and initial reaction rates ( p 1 × p 2 ) were determined for the individual saccharides fractions.
After each reaction step, the reaction mixture was challenged by an ultrafiltration procedure. The reaction liquid was concentrated by a volume concentration factor of 8.6. The objective of the filtration was to collect the GOS products in the permeate while recovering the enzymes in the concentrate for repeated reaction steps. For this purpose, a membrane with a molecular weight cut-off of 30 kDa was employed. It is assumed that the low-molecular weight carbohydrates (<1 kDa) can freely pass through the membrane and are collected in the permeate. It has been previously reported that multiple types of β-galactosidases are present in the commercial enzyme preparation originating from Bacillus circulans [31,32]. Molecular weights of the enzyme forms responsible for transgalactosylation range between ca. 90 kDa and 240 kDa [31,32]. Thus, permeation losses of the enzyme through the membrane can be considered to be negligible.
Applying a high-volume concentration factor is required for removing compounds from the reaction mixture that may inhibit the transgalactosylation reaction in the subsequent cycles. Due to the efficient removal by UF, the concentration of glucose and galactose were kept below ca. 7 g·L−1 and ca. 2 g·L−1 at the beginning of each of the reaction steps. At such concentration levels, the inhibitory effect of the residues is reported to be negligible [19,33,34].
During UF, as filtration progressed and enzyme concentration increased in the reaction mixture, a gradual decrease in the permeate flux was observed. After completing the concentration process, the membrane module was de-attached from the reactor system and cleaned, as detailed in Section 2.5. Alkaline cleaning was proved to be efficient in regenerating the original water permeability of the membrane. A mean permeance of 81 ± 6 L·h−1·m−2·bar−1 was measured for the reaction mixture within the UF steps, and a water permeance of 207 ± 16 L·h−1·m−2·bar−1 was observed within the repeated cleaning cycles.

3.3. Quantification of Enzyme Losses

As depicted in Figure 4, both the rate of GOS synthesis and that of lactose conversion deteriorates gradually from cycle one to cycle five. The observed decline is considered to be the consequence of enzyme activity losses. To quantify these losses, we first determined the initial reaction rates of the individual compounds by fitting the saturation models to the progress curves shown in Figure 4. Then, the linear models obtained from STR trials with known enzyme concentrations (Table 3) were used to calculate respective enzyme activity values. These models serve as calibration curves to determine the unknown (remaining) enzyme activity values for the consecutive cycles.
Table 4 shows the (remaining) enzyme activity values for the five consecutive cycles for DP2, DP3, DP3-6, and glucose. The fractions present in low concentrations, such as galactose and individual fractions of oligosaccharides with higher degree of polymerization, have limited predictive power and, thus, they were not used in the estimation procedure. Results suggest that obtained activity values are irrespective of which saccharide fraction was used in the estimation procedure. In other words, all listed compounds return with close approximations of the remaining activity.
Table 4 indicates that enzyme activity decreases with each cycle. In Figure 5, the relative enzyme activity is plotted against the operational time for the five cycles.
Global fittings of the various inactivation models, e.g., Equations (2)–(6), were performed to all available data points by introducing non-negativity constraints on the model parameters. Results of the parameter estimation are shown in Table 5. In general, good overall fittings were achieved for all implemented models; however, the first-order deactivation model, e.g., Equation (6), tends to underestimate activity at the last phases of the investigation period, i.e., for lower activity values. There was no remarkable difference found in the goodness of fit between the single-stage model with non-zero final stage, e.g., Equation (5), and the more complex two-stage models, e.g., Equations (2) and (3), with three and four fitting parameters.
The obtained half-life of 15.3 h is in good agreement with the results reported by Warmerdam et al. [25] for similar operational settings. In their previous study, the half-life of Biolacta N5 at 300 g·L−1 initial lactose concentration was determined to be 29 h, 29 h, and 16 h for temperatures of 20, 40, and 60 °C, respectively.
It should also be highlighted that modeling the observed enzyme activity data with, e.g., Equations (2)–(6), suffers from some limitations. The applied models assume steady operation conditions, resulting in a continuous, gradual decline in the activity of the enzyme in question. In our study, however, a sequence of repeated reaction and filtration steps were carried out. In the filtration step, enzymes were recirculated through the membrane module and concentrated in the retentate. During crossflow filtration, retained enzymes are known to accumulate at the membrane surface, building up a concentration polarization layer that may enhance membrane fouling and may lead to partial inactivation of the biocatalysts [26,35,36,37]. The methods used for this study do not allow us to quantify the extent of the activity decline caused by the filtration procedure and its relation to the stability in STR during the reaction steps. However, it is worth noting that the estimated half-life is consistent with the estimate of Warmerdam et al. [25] obtained for STR under similar reaction conditions. Although this fact may suggest that the filtration steps do not affect enzyme stability to a higher extent, further research is required to investigate the separate effects of reaction and filtration procedures on enzyme stability.

4. Conclusions

In this study, a series of batch trials were conducted in STR at various enzyme loads of a commercially available beta-galactosidase preparation of Bacillus circulans origin. The yield of DP3-DP6 fractions was measured as 35.9 ± 1.8 w/w% on total carbohydrate basis, and hydrolysis activity was found to be negligible (typically below 1–3 w/w%.) under the investigated reaction conditions. The relationships between the observed reaction velocities and applied enzyme dosages were explored by analyzing the time course of the concentration of individual saccharides fractions. Within the investigated regime of applied enzyme load, linear relations were found between the initial reaction rates and enzyme activity. The obtained quantitative models can be used for estimating unknown enzyme load when progress curves are available.
Conventional GOS manufacturing utilizes free enzymes in STR in batch fashion. Although high GOS yields can be attained by this approach, high operational costs occur, mainly due to the high purchase price of the biocatalysts. Enzyme reusability can be enhanced by EMRs using free enzymes. They allow a continuous production of enzyme-free product streams; however, they offer lower yields as compared to STRs.
In this study, the performance of a simple and scalable setup was investigated that may overcome the limitations of the STR and EMR approaches. GOS was produced by free enzymes in a reactor system consisting of a stirred-tank reactor and an external ultrafiltration module. The conversion was performed in a batchwise manner in five consecutive cycles. Each cycle comprised of a three-step procedure. First, lactose was converted into GOS in an STR using soluble enzymes. Then, the obtained saccharides mixture was separated from the biocatalysts by UF. The enzymes were recovered and used for repeated GOS production in the next cycle.
A high-volume concentration factor of 8.6 was successfully applied in order to remove residual saccharides from the reaction mixture which may act as inhibitors in the subsequent reaction steps. Additionally, the ultrafilter was efficiently regenerated by alkaline cleaning in between the consecutive UF concentration steps.
Both the rate of GOS production and that of lactose conversion declined gradually from cycle one to cycle five. The initial velocity rates of the individual saccharides fractions were determined from the progress curves and based on that, enzyme activity losses were estimated for the consecutive cycles. The half-life of the enzyme in the UF-assisted enzyme reactor was estimated as ca. 15 h under the given operational conditions. The obtained value can be seen as an STR-equivalent measure of the stability. Distinguishing between the impacts of the different processing steps on stability, i.e., the reaction step and the determination of the activity losses caused by the UF procedure separately, was out of the scope of our study. Notably, the half-life estimated in our study for a UF-assisted STR is consistent with the half-life reported for STR under similar reaction conditions by previous investigators [29].
The obtained experimental data on progress curves and activity declines might be useful for design considerations of such multi-step processes and may serve as a basis for further studies optimizing process parameters, such as the duration of reaction steps and scheduling enzyme dosage.

Author Contributions

Conceptualization, T.C. and Z.K.; methodology, T.C., Z.K. and M.L.; EMR design, Z.K.; validation, T.C. and M.L.; formal analysis, T.C. and M.L.; investigation, T.C.; writing—original draft preparation, T.C.; writing—review and editing, T.C., M.L. and Z.K.; visualization, T.C.; supervision, Z.K.; project administration, Z.K.; funding acquisition, Z.K. All authors have read and agreed to the published version of the manuscript.

Funding

This research was supported by the National Research, Development and Innovation Office (Project No. TKP2021-NVA-22), the Food Science Doctoral School of the Hungarian University of Agriculture and Life Sciences, and the Tempus Public Foundation for the Stipendium Hungaricum Scholarship.

Data Availability Statement

Not applicable.

Acknowledgments

Cao Teng acknowledges the Food Science Doctoral School of the Hungarian University of Agriculture and Life Sciences and the Tempus Public Foundation for the Stipendium Hungaricum Scholarship.

Conflicts of Interest

The authors declare no conflict of interest.

List of Symbols

F → enzyme activity at initial state (U·kg−1). E 0 → enzyme activity at initial state (U·kg−1). E 1 → enzyme activity at intermediate state (U·kg−1). E 2 → enzyme activity at final state (U·kg−1). k 1 → deactivation velocity coefficient (U·h−1). α 1 → the ratio of the specific activity of E 1 / E 0 .   α 2 → the ratio of the specific activity of E 2 / E 0 .   y → relative enzyme activity(−). k 1 → enzyme deactivation constant (h−1). t → operational time (h). C 0 → initial concentration of saccharides (g·kg−1). p 1 × p 2 → initial reaction rate (g·kg−1·h−1).

Abbreviations

DP → degree of polymerization. EMR → enzymatic membrane reactor. GOS → galacto-oligosachrides. STR → stirred tank reactor. UF → ultrafiltration. GRAS → Generally Recognized As Safe.

References

  1. Galacto-oligosaccharide Market Segmentation By End User (Food & Beverage Industry, Pharmaceutical, Personal Care and Animal Feed)–Global Demand Analysis & Opportunity Outlook 2028. Available online: https://www.researchnester.com/reports/galacto-oligosaccharide-market/2814 (accessed on 1 February 2022).
  2. Illanes, A.; Vera, C. Enzymatic production of galacto-oligosaccharides. In Lactose-Derived Prebiotics: A Process Perspective; Elsevier Inc.: Amsterdam, The Netherlands, 2016; pp. 111–189. [Google Scholar]
  3. Pázmándi, M.; Maráz, A.; Ladányi, M.; Kovács, Z. The impact of membrane pretreatment on the enzymatic production of whey-derived galacto-oligosaccharides. J. Food Process. Eng. 2018, 41, e12649. [Google Scholar] [CrossRef]
  4. Pires, A.F.; Marnotes, N.G.; Rubio, O.D.; Garcia, A.C.; Pereira, C.D. Dairy by-products: A review on the valorization of whey and second cheese whey. Foods 2021, 10, 1067. [Google Scholar] [CrossRef]
  5. Osman, A.; Tzortzis, G.; Rastall, R.A.; Charalampopoulos, D. A comprehensive investigation of the synthesis of prebiotic galactooligosaccharides by whole cells of Bifidobacterium bifidum NCIMB 41171. J. Biotechnol. 2010, 150, 140–148. [Google Scholar] [CrossRef] [PubMed]
  6. Yu, L.; O’sullivan, D. Production of galactooligosaccharides using a hyperthermophilic β-galactosidase in permeabilized whole cells of Lactococcus lactis. J. Dairy Sci. 2014, 97, 694–703. [Google Scholar] [CrossRef] [PubMed] [Green Version]
  7. Cao, T.; Pázmándi, M.; Galambos, I.; Kovács, Z. Continuous production of galacto-oligosaccharides by an enzyme membrane reactor utilizing free enzymes. Membranes 2020, 10, 203. [Google Scholar] [CrossRef] [PubMed]
  8. Das, R.; Sen, D.; Sarkar, A.; Bhattacharyya, S.; Bhattacharjee, C. A comparative study on the production of galacto-oligosaccharide from whey permeate in recycle membrane reactor and in enzymatic batch reactor. Ind. Eng. Chem. Res. 2011, 50, 806–816. [Google Scholar] [CrossRef]
  9. Hackenhaar, C.R.; Spolidoro, L.S.; Flores, E.E.E.; Klein, M.P.; Hertz, P.F. Batch synthesis of galactooligosaccharides from co-products of milk processing using immobilized β-galactosidase from Bacillus circulans. Biocatal. Agric. Biotechnol. 2021, 36, 102136. [Google Scholar] [CrossRef]
  10. Huerta, L.M.; Vera, C.; Guerrero, C.; Wilson, L.; Illanes, A. Synthesis of galacto-oligosaccharides at very high lactose concentrations with immobilized β-galactosidases from Aspergillus oryzae. Process. Biochem. 2011, 46, 245–252. [Google Scholar] [CrossRef]
  11. Pázmándi, M.; Kovács, Z.; Balga, E.; Kovács, M.; Maráz, A. Production of high-purity galacto-oligosaccharides by depleting glucose and lactose from galacto-oligosaccharide syrup with yeasts. Yeast 2020, 37, 515–530. [Google Scholar] [CrossRef]
  12. Gänzle, M.G. Enzymatic synthesis of galacto-oligosaccharides and other lactose derivatives (hetero-oligosaccharides) from lactose. Int. Dairy J. 2012, 22, 116–122. [Google Scholar] [CrossRef]
  13. Fischer, C.; Kleinschmidt, T. Synthesis of galactooligosaccharides in milk and whey: A review. Compr. Rev. Food Sci. Food Saf. 2018, 17, 678–697. [Google Scholar] [CrossRef] [PubMed]
  14. Füreder, V.; Rodriguez-Colinas, B.; Cervantes, F.V.; Fernandez-Arrojo, L.; Poveda, A.; Jimenez-Barbero, J.; Ballesteros, A.O.; Plou, F.J. Selective synthesis of galactooligosaccharides containing β (1 → 3) linkages with β-galactosidase from Bifidobacterium bifidum (Saphera). J. Agric. Food Chem. 2020, 68, 4930–4938. [Google Scholar] [CrossRef] [PubMed]
  15. Wang, G.; Zhu, J.; Liu, L.; Yaqoob, M.U.; Pei, X.; Tao, W.; Xiao, Z.; Sun, W.; Wang, M. Optimization for galactooligosaccharides synthesis: A potential alternative for gut health and immunity. Life Sci. 2020, 245, 117353. [Google Scholar] [CrossRef] [PubMed]
  16. Scott, F.; Vera, C.; Conejeros, R. Technical and economic analysis of industrial production of lactose-derived prebiotics with focus on galacto-oligosaccharides. In Lactose-Derived Prebiotics: A Process Perspective; Elsevier Inc.: Amsterdam, The Netherlands, 2016; pp. 261–284. [Google Scholar]
  17. Albayrak, N.; Yang, S.T. Production of galacto-oligosaccharides from lactose by Aspergillus oryzae β-galactosidase immobilized on cotton cloth. Biotechnol. Bioeng. 2002, 77, 8–19. [Google Scholar] [CrossRef] [PubMed]
  18. Torres, P.; Batista-Viera, F. Improved biocatalysts based on Bacillus circulans β-galactosidase immobilized onto epoxy-activated acrylic supports: Applications in whey processing. J. Mol. Catal. B: Enzym. 2012, 83, 57–64. [Google Scholar] [CrossRef]
  19. Warmerdam, A.; Zisopoulos, F.K.; Boom, R.M.; Janssen, A.E. Kinetic characterization of galacto-oligosaccharide (GOS) synthesis by three commercially important β-galactosidases. Biotechnol. Prog. 2014, 30, 38–47. [Google Scholar] [CrossRef]
  20. Fujimoto, H.; Miyasato, M.; Ito, Y.; Sasaki, T.; Ajisaka, K. Purification and properties of recombinant β-galactosidase from Bacillus circulans. Glycoconj. J. 1998, 15, 155–160. [Google Scholar] [CrossRef]
  21. Huang, J.; Zhu, S.; Zhao, L.; Chen, L.; Du, M.; Zhang, C.; Yang, S.-T. A novel β-galactosidase from Klebsiella oxytoca ZJUH1705 for efficient production of galacto-oligosaccharides from lactose. Appl. Microbiol. Biotechnol. 2020, 104, 6161–6172. [Google Scholar] [CrossRef]
  22. Urrutia, P.; Mateo, C.; Guisán, J.M.; Wilson, L.; Illanes, A. Immobilization of Bacillus circulans β-galactosidase and its application in the synthesis of galacto-oligosaccharides under repeated-batch operation. Biochem. Eng. J. 2013, 77, 41–48. [Google Scholar] [CrossRef]
  23. An, S.M.; Wu, J.H.; Qian, L.F.; Gao, Y.L.; Wu, Y.; Yu, G.P. Applications of Ultrafiltration-nanofiltration Membrane Continuous Combination Technology for Refining of Milk-Derived Oligosaccharides. In Advanced Materials Research; Trans Tech Publications Ltd.: Bäch, Switzerland, 2013; pp. 1429–1434. [Google Scholar]
  24. Matella, N.; Dolan, K.; Lee, Y. Comparison of galactooligosaccharide production in free-enzyme ultrafiltration and in immobilized-enzyme systems. J. Food Sci. 2006, 71, C363–C368. [Google Scholar] [CrossRef]
  25. Warmerdam, A.; Boom, R.M.; Janssen, A.E. β-galactosidase stability at high substrate concentrations. Springerplus 2013, 2, 1–8. [Google Scholar] [CrossRef] [Green Version]
  26. Su, Z.; Luo, J.; Li, X.; Pinelo, M. Enzyme membrane reactors for production of oligosaccharides: A review on the interdependence between enzyme reaction and membrane separation. Sep. Purif. Technol. 2020, 243, 116840. [Google Scholar] [CrossRef]
  27. Córdova, A.; Astudillo, C.; Vera, C.; Guerrero, C.; Illanes, A. Performance of an ultrafiltration membrane bioreactor (UF-MBR) as a processing strategy for the synthesis of galacto-oligosaccharides at high substrate concentrations. J. Biotechnol. 2016, 223, 26–35. [Google Scholar] [CrossRef]
  28. Splechtna, B.; Nguyen, T.-H.; Haltrich, D. Comparison between discontinuous and continuous lactose conversion processes for the production of prebiotic galacto-oligosaccharides using β-galactosidase from Lactobacillus reuteri. J. Agric. Food Chem. 2007, 55, 6772–6777. [Google Scholar] [CrossRef] [PubMed]
  29. IBM SPSS Statistics for Windows; Version 27.0.; IBM Corp.: Armonk, NY, USA, 2020.
  30. Rodriguez-Colinas, B.; Poveda, A.; Jimenez-Barbero, J.; Ballesteros, A.O.; Plou, F.J. Galacto-oligosaccharide synthesis from lactose solution or skim milk using the β-galactosidase from Bacillus circulans. J. Agric. Food Chem. 2012, 60, 6391–6398. [Google Scholar] [CrossRef] [Green Version]
  31. Song, J.; Abe, K.; Imanaka, H.; Imamura, K.; Minoda, M.; Yamaguchi, S.; Nakanishi, K. Causes of the production of multiple forms of β-galactosidase by Bacillus circulans. Biosci. Biotechnol. Biochem. 2011, 75, 268–278. [Google Scholar] [CrossRef] [PubMed]
  32. Vetere, A.; Paoletti, S. Separation and characterization of three β-galactosidases from Bacillus circulans. Biochim. Et Biophys. Acta Gen. Subj. 1998, 1380, 223–231. [Google Scholar] [CrossRef] [PubMed]
  33. Boon, M.; Janssen, A.; Van der Padt, A. Modelling and parameter estimation of the enzymatic synthesis of oligosaccharides by β-galactosidase from Bacillus circulans. Biotechnol. Bioeng. 1999, 64, 558–567. [Google Scholar] [CrossRef]
  34. Palai, T.; Mitra, S.; Bhattacharya, P.K. Kinetics and design relation for enzymatic conversion of lactose into galacto-oligosaccharides using commercial grade β-galactosidase. J. Biosci. Bioeng. 2012, 114, 418–423. [Google Scholar] [CrossRef]
  35. Botelho, V.A.; Mateus, M.; Petrus, J.C.; de Pinho, M.N. Membrane Bioreactor for Simultaneous Synthesis and Fractionation of Oligosaccharides. Membranes 2022, 12, 171. [Google Scholar] [CrossRef]
  36. Córdova, A.; Astudillo, C.; Giorno, L.; Guerrero, C.; Conidi, C.; Illanes, A.; Cassano, A. Nanofiltration potential for the purification of highly concentrated enzymatically produced oligosaccharides. Food Bioprod. Process. 2016, 98, 50–61. [Google Scholar] [CrossRef]
  37. Córdova, A.; Astudillo, C.; Guerrero, C.; Vera, C.; Illanes, A. Assessment of the fouling mechanisms of an ultrafiltration membrane bioreactor during synthesis of galacto-oligosaccharides: Effect of the operational variables. Desalination 2016, 393, 79–89. [Google Scholar] [CrossRef]
Figure 1. Piping and instrumentation diagram of cyclic enzymatic membrane reactor (cyclic-EMR).
Processes 11 00225 g001
Figure 2. Progress curves of saccharides fractions for various enzyme loads ranging from 923 U·kg−1 to 8307 U·kg−1. Mean values and standard deviation of triplicate measurements are shown for 8307 U·kg−1. The solid lines present model predictions (Equation (7)), while symbols represent measured values. Operational conditions: 300 g·kg−1 initial lactose concentration, pH 6.0, 50 °C, 60 rpm.
Processes 11 00225 g002aProcesses 11 00225 g002b
Figure 3. No-intercept linear relationship between enzyme activity and initial reaction velocity (p1 × p2) of various saccharide fractions.
Processes 11 00225 g003
Figure 4. Saccharides composition in the reactor as function of operational time for 5 consecutive cycles. Symbols represent measured values; solid lines are model predictions evaluated by using Equation (7). Operational conditions: 300 g·kg−1 initial lactose concentration, 8307 U·kg−1 initial enzyme load, pH 6.0, 50 °C.
Processes 11 00225 g004aProcesses 11 00225 g004b
Figure 5. Decline of relative enzyme activity over operation time during the five consecutive cycles. Symbols represent data obtained by using different saccharides fractions in the estimation procedure. Predictions obtained by inactivation models are illustrated with lines.
Processes 11 00225 g005
Table 1. Summary of investigations on enzyme stability of β-galactosidases in GOS production.
Enzyme Type/
Microorganism
Reactor
Configuration
Reaction ConditionsHalf-Life (h)Deactivation ModelActivity
Measurement Method
Ref.
Lactose Conc.pHTemp. (°C)
β-galactosidase/Aspergillus oryzaeBatch (FE)0 g·L−14.540399Equation (6)DM *[17]
5049
602
Continuous (IE)200 g·L−14.54010,040
501155
6049
β-galactosidase/Aspergillus oryzaeBatch (FE)0.1 g·L−14.55042Equation (2)oNPG[10]
557.4
600.8
Batch (IE)2% w·v−14.550163–166
559.3–20.5
600.9–1.9
Biolacta N5/Bacillus circulansBatch (FE)30% w·w−162529Equation (6)oNPG[25]
4029
6016
Biolacta N5/Bacillus circulansBatch (FE)4.6% w·w−165012Equation (5)oNPG[18]
Batch (IE)4.6% w·w−165021–387
Biolactasa-NTL CONC X2/Bacillus circulansBatch (FE)0 g·L−1660~0.05Equation (3)oNPG[22]
Batch (IE)0 g·L−16600.25–3
β-galactosidase/Klebsiella oxytoca ZJUH1705Batch (FE) β-gal 140% w·w−1730141.67Equation (6)oNPG[21]
4018.33
500.04
600.01
Batch (FE) β-gal 240% w·w−173088.33
401.17
500.17
600.01
* DM: direct method defining one unit of enzyme activity as the amount of enzyme producing 1 μmol of glucose from lactose under defined conditions; FE: free enzyme; IE: immobilized enzyme.
Table 2. Estimated parameters for the saturation model (Equation (7)) for different enzyme activities (rounded for two digits), their standard errors and 95 % confidence intervals together with the model accuracy F-tests and the explained variance rates ( R 2 ) and the initial reaction velocity values ( p 1 × p 2 ).
Enzyme Activity (U·kg−1)ParametersEstimateStd.
Error
95% Confidence
Interval
F (2; df2) R 2 p1 × p2
( g · kg 1 · h 1 )
Lower BoundUpper Bound
923 p 1 −162.07 *3.11155.30168.8428,504.6 *
df2 = 12
>0.99 *−22.69
p 2 0.14 *0.010.130.15
2307 p 1 −172.91 *2.92166.56179.275352.4 *
df2 = 12
0.99 *−70.03
p 2 0.41 *0.030.350.46
4615 p 1 −180.19 *3.35172.60187.764539.8 *
df2 = 9
0.99 *−134.24
p 2 0.75 *0.060.620.87
6923 p 1 −177.63 *1.64174.07181.206763.6 *
df2 = 12
0.99 *−220.44
p 2 1.24 *0.081.081.41
8307 p 1 −179.05 *1.72175.53182.568630.4 *
df2 = 29
0.99 *−237.95
p 2 1.33 *0.071.201.46
* significant at p < 0.001.
Table 3. The slopes of the no-intercept linear regression functions fitted to the reaction velocity (Y) depending on enzyme activity for different saccharides fractions.
Saccharides CompoundsNo-Intercept
Linear Regression Slopes
R2
DP20.03 *0.997 *
DP30.025 *0.991 *
DP40.004 *0.995 *
DP3-60.024 *0.997 *
Glucose0.007 *0.999 *
* significant at p < 0.001.
Table 4. Enzyme activity values [U·kg−1] for the five consecutive cycles as determined by analyzing the reaction rates of different saccharides fractions.
Cycles
FractionsNo.1No.2No.3No.4No.5
DP270772124846388329
DP379252480890379306
DP3-669992081785355295
Glucose79032588992448400
Mean74762318878392333
STDEV507254874047
Table 5. Estimated parameters of the inactivation models, e.g., Equations (2)–(6).
Modelk1k2α1α2R2SSR
Equation (2)9.692 × 10−14.839 × 10−28.125 × 10−12.977 × 10−20.99747.338 × 10−3
Equation (3)5.947 × 10−29.980 × 10−37.493 × 10−200.99873.535 × 10−3
Equation (5)5.537 × 10−203.651 × 10−200.99863.674 × 10−3
Equation (6)4.891 × 10−20000.99571.194 × 10−2
Disclaimer/Publisher’s Note: The statements, opinions and data contained in all publications are solely those of the individual author(s) and contributor(s) and not of MDPI and/or the editor(s). MDPI and/or the editor(s) disclaim responsibility for any injury to people or property resulting from any ideas, methods, instructions or products referred to in the content.

