Article

Validation of Two Theoretically Derived Equations for Predicting pH in CO2 Biomethanisation

Water and Environmental Engineering Group, Faculty of Engineering and Physical Sciences, University of Southampton, Southampton SO16 7QF, UK
*
Authors to whom correspondence should be addressed.
Processes 2023, 11(1), 113; https://doi.org/10.3390/pr11010113
Submission received: 4 December 2022 / Revised: 22 December 2022 / Accepted: 24 December 2022 / Published: 31 December 2022
(This article belongs to the Special Issue New Frontiers in Anaerobic Digestion (AD) Processes)

Abstract

:
CO2 biomethanisation is a rapidly emerging technology which can contribute to reducing greenhouse gas emissions through the more sustainable use of organic feedstocks. The major technical limitation for in situ systems is that the reaction causes CO2 depletion which drives up pH, potentially leading to instability and even digestion failure. The study aimed to test fundamentally derived predictive equations as tools to manage H2 addition to anaerobic digesters. The methodology used data from the literature and from experimental digesters operated with excess H2 to a point of failure and subsequent recovery. Two equations were tested: the first relating pH to CO2 partial pressure (pCO2), and the second extending this to include the influence of volatile fatty acids and ammonia. The first equation gave good agreement for data from studies covering a wide range of operating conditions and digester types. Where agreement was not good, this could usually be explained, and in some cases improved, using the second equation, which also showed excellent predictive performance in the experimental study. The results validated the derived equations and identified typical coefficient values for some organic feedstocks. Both equations could provide a basis for process control of CO2 biomethanisation using routine monitoring of pH or pCO2 with additional analysis for volatile fatty acids and total ammonia nitrogen when required.

Graphical Abstract

1. Introduction

The ability of certain methanogens to use hydrogen (H2) as a reducing agent for the conversion of carbon dioxide (CO2) into methane (CH4) has been known to science for decades [1]. More recently, the growing realisation of the potential engineering applications has helped to move this process rapidly up through technology readiness levels from the initial laboratory research [2] to larger-scale implementation [3,4]. CO2 biomethanisation can be carried out in various configurations. Ex situ processes are usually defined as operating on gaseous H2 and CO2 in dedicated reactors, with or without defined inocula, and can offer the advantages of high gas transfer rates and volumetric throughput: the main commercial systems currently in use are of this type [3,4,5]. In situ systems use CO2 produced during the anaerobic digestion of organic substrates, with the addition of H2 stimulating parts of the mixed microbial community to carry out the CO2 biomethanisation process. Various hybrids of these two basic concepts are also possible, e.g., where additional exogenous CO2 is provided for conversion within an in situ system [6], or where high-rate reactors are fed with organic substrates for nutrient supply and/or replenishment of the microbial population, rather than as the main source of CO2 [7,8]. Other variants under development include those using syngas [9], zero-valent iron [10], and bioelectrochemical systems [11].
While ex situ systems are furthest along the pathway to full-scale application, all these approaches have specific advantages and features that make them suited to different applications. The urgent need for renewable hydrocarbons and for more sustainable utilisation of organic carbon has recently led to increasing interest in biomethanisation of CO2 from waste feedstocks, as evidenced by a growing number of papers on this topic [12]. The attractions of this approach are firstly that it can enhance CH4 yields from existing AD infrastructure, with potentially low retrofitting costs [13]. Secondly, it increases the scope for the integration of anaerobic digestion with local or grid-based renewables and other on-site technologies [14,15]. Thirdly, it can provide biogas with a high methane content, in some cases equal to that reported for single-pass ex situ reactors [12], from organic carbon inputs.
The main perceived drawback of the in situ approach is that reduction in the headspace CO2 content induces a rise in pH [16], which if uncontrolled can lead to process instability or even digestion failure [17,18]. In full-scale digesters this is expensive and time-consuming to rectify: in the worst case, digester contents may have to be replaced with fresh inoculum, leading to extended downtime, and a digestate disposal problem [19]. As with other process innovations, widespread adoption of CO2 biomethanisation will require companies to have confidence in their ability to control the process and to avoid any risk of instability, or to identify and deal with if for some reason it does occur. This security can be delivered by the development of effective process control tools [20,21], which ideally should be based on experimentally validated relationships that are underpinned by sound science and an in-depth understanding of the factors involved [22]. To be accepted, such relationships must also be demonstrated as robust over a wide range of conditions, including periods of dynamic change and when operations become unstable, e.g., with accumulation of volatile fatty acids (VFA) [20,22].
As a step towards this, Tao et al. [6] suggested a relationship between digester pH and partial pressure of CO2 (pCO2) in the headspace that would allow estimation of the minimum pCO2 for stable operation, and thus by extension, the maximum achievable CH4 content. The strength of this lies in the fact that it is derived from fundamental principles and requires only minimal information (digester operating temperature and a baseline value for pH and pCO2) for calibration and use. It was developed for systems where ammonium-bicarbonate buffering is dominant, as is the case for most real-world organic feedstocks. Although, extension to phosphate, which is usually present when basal media are used, was also demonstrated [6]. However, it did not include consideration of VFA which may accumulate during CO2 biomethanisation for various reasons, e.g., too high a H2 partial pressure and/or too high pH without appropriate acclimatisation. The authors were also unable to explain why the maximum acceptable pH seemed to vary with different substrates, and more work is needed to clarify this.
In the current work, data gathered from an extensive review of published literature was used to investigate how well the original equation derived by Tao et al. [6] was able to predict operating pH from pCO2, and where the fit was poor, to see whether it was possible to understand why. The original equation was modified to include consideration of the effects of total ammonia nitrogen (TAN) and VFA, and where suitable literature data were available these were used to test and compare the performance of the two equations. As the number of studies with suitable data was limited, both equations were also applied to data from a laboratory-scale CO2 biomethanisation trial which was deliberately designed to show VFA accumulation and the onset of process instability.
The results from all parts of this work clearly demonstrated the robustness of the derived equations, and thus their potential suitability for use in process control systems based on pCO2 and/or pH measurements, with additional monitoring of TAN and VFA when required.

2. Materials and Methods

2.1. Equations Relating pH and pCO2

The equation derived by Tao et al. [6] relates pH to the partial pressure of CO2 in the digester headspace
p H = l o g 10 a · p C O 2 + a 2 · p C O 2 2 + 4 · 10 t · a · p C O 2 2
where:
a = 10 p H o 2 10 t + 10 p H o · 1 p C O 2 o
t = 0.90018 + 2729.29 T
and T is the digester operating temperature digester in degrees K.
The superscript o in Equation (1a) represents chosen baseline values. Symbols with this superscript are therefore constants obtained from a control digester or operating period, e.g., from conventional anaerobic digestion without CO2 biomethanisation.
The above relationship can be taken further by considering the effect of VFA. As weak acids, these metabolic products are also capable of donating protons to NH3 in an AD environment. A modified version of Equation A can therefore be obtained, which applies to both baseline conditions and in CO2 biomethanisation.
At equilibrium:
H C O 3 + V F A = N H 4 +
where [ ] represents molar concentration.
Among the terms in Equation (2a)
H C O 3 = K a 1 K H   p C O 2 10 p H
(as in Equation (4) in Tao et al. [6]), and
N H 4 + = 10 p H 10 t + 10 p H T A N
(as in Equation (7) in Tao et al. [6], but with t left as a variable rather than expressed as the constant for operation at 37 °C).
Considering that the pH of anaerobic digestion processes is commonly neutral or slightly in the alkaline range, especially under CO2 biomethanisation:
V F A = V F A
where [VFA] represents total VFA concentration, including both protonated and deprotonated forms.
Equation (2a) can then be converted to:
K a 1 K H   p C O 2 10 p H + V F A = 10 p H 10 t + 10 p H T A N
Therefore:
10 p H 2 K a 1 K H p C O 2 + V F A · 10 t T A N V F A · 10 p H K a 1 K H p C O 2 · 10 t T A N V F A = 0
Solving Equation (2f) gives:
10 p H = b · p C O 2 + V F A · 10 t + b · p C O 2 + V F A · 10 t 2 4 · T A N V F A · b · p C O 2 · 10 t 2 · T A N V F A
where:
b = K a 1 K H = 10 p H 0 10 t + 10 p H 0 T A N 0 V F A 0 · 10 p H 0 p C O 2 0
Therefore, the relationship between pH and pCO2 can be expressed as in Equation B:
p H = log 10 b · p C O 2 + V F A · 10 t + b · p C O 2 + V F A · 10 t 2 4 · T A N V F A · b · p C O 2 · 10 t 2 · T A N V F A
For the remainder of this paper the expressions shown in Equations (1) and (2) are referred to as Equation A and Equation B, respectively. When the VFA concentration is zero, Equation B is identical to Equation A. It should be noted that Equation B does not apply when the molar concentration of VFA is close to or greater than that of TAN as, in this case, the ammonia produced is not sufficient to neutralise both fatty acids and carbonic acid.

2.2. Literature Data

Search terms including ‘CO2 biomethanisation’ or ‘CO2 biomethanation’, ‘in situ biogas upgrading’, and ‘anaerobic digestion’ in conjunction with ‘H2 addition’ were used to identify papers of possible interest. This produced several thousand publications, the majority of which after a brief inspection of the title or abstract were found not to be relevant to the current study. A total of 73 papers, identified either directly in this way or from the reference lists of the selected papers, were examined in more detail. In total, 37 of these were eliminated as they did not directly address in situ conversion of CO2 from organic feedstocks, did not include the required data on pH and pCO2, or for other methodological reasons. Data were then extracted from the remaining 36 peer-reviewed papers and their supporting materials, with additional information obtained from the authors where possible.
The resulting data were in the form of sets of average values from different experimental periods in a study, or individual points from experimental data series. For each study or dataset considered, average values for pH, pCO2, and where available VFA and TAN concentrations from control reactors or baseline periods were used to derive coefficients a or b for Equations A or B. Measured CO2 concentrations were then used to predict pH for each data point, excluding the selected control or baseline period, for comparison with experimental pH values.

2.3. Digester Set-Up and Operation

Experimental work was carried out in eight 1-L digesters (designated D1-8) maintained at 37 °C in a water bath, as described in Tao et al. [23]. The digesters were mixed by 40 mm diameter 3-blade impellers driven at 200 rpm. Each digester initially received 500 mL of inoculum from a mesophilic anaerobic digester at Millbrook Wastewater Treatment Works (WWTW), Southampton, UK. The feed was co-settled primary and secondary sewage sludge collected from Budds Farm WWTW, Portsmouth, UK, in a single batch and frozen in aliquots until required, then stored under refrigeration until use. The average total solids (TS) content of the feed was 6.91% wet weight (WW) with average volatile solids (VS) of 5.69%WW. Feeding and digestate removal were carried out manually once per day to give a Hydraulic Retention Time (HRT) of 14.6 days and an organic loading rate (OLR) of 3.87 g VS L−1 day−1 unless noted. All digesters had been run under these conditions for 70 days before the start of the current trial to ensure stable and replicable operation. From day 0–54, operation of all digesters continued under the same conditions to allow the establishment of robust baseline values.
H2 addition was achieved by dispensing the required volume into a foil-lined gas-impermeable bag using an EL-Flow Prestige mass flow controller (Bronkhorst, UK). The filled gas bag was attached to the digester immediately after the daily addition of organic feed, and the gas was bubbled up through the digestate and recirculated from the headspace at a flow rate of 8 mL min−1. At the end of the daily cycle, the full gas bag was removed for measurement of gas volume and composition
In general, gas production and composition were measured daily throughout the experiment. From day 0–54 pH and VFA concentrations were measured twice a week, with TAN, alkalinity, and solids content measured weekly. pH and VFA were measured daily between days 55–100, covering the period of H2 addition and subsequent stabilisation, while other parameters were measured intermittently. More frequent monitoring was resumed at the end of the experimental period from day 110–125.

2.4. Analytical Methods

TS and VS were determined by Standard Method 2540 G [24]. TAN was measured using a BÜCHI K-350 Distillation Unit, with NaOH addition followed by titration of the distillate in a boric acid indicator with 0.25 N H2SO4. Alkalinity was measured using a SCHOTT titroline system with titration by 0.25 N H2SO4 to endpoints of pH 5.75 and 4.3, to allow calculation of total (TA), partial (PA), and intermediate alkalinity (IA) [25]. VFA concentrations were determined by gas chromatography (Shimadzu GC-2010) using a flame ionisation detector and a capillary column (SGE BP-21) with nitrogen as the carrier gas. Samples were acidified to 10% with formic acid and quantified against mixed standards of 50, 250, and 500 mg L−1 of acetic, propionic, iso-butyric, n-butyric, iso-valeric, valeric, hexanoic, and heptanoic acids. Biogas composition was determined using a MG#5 Gas Chromatograph (SRI Instruments, Torrance, CA, USA) with a thermal conductivity detector (TCD). The instrument had two linked analytical lines with CH4 and CO2 separated by a Porapak Q column (80/100 mesh, 6ft), and H2 by a molecular sieve 5A column (6ft). GC calibration was conducted using standard gases supplied by BOC, UK. Gas volumes were determined in a weight-based water displacement system [26] and are reported as dry gas at a standard temperature and pressure (STP) of 0 °C and 101.325 kPa.

2.5. Performance Assessment and Statistical Analyses

Performance of Equations A and B was assessed by several measures. Heat maps were used to show the absolute value of the difference between experimental and predicted pH for single data points or for average values for an experimental period. For multiple values, in the first instance the Root Mean Square Deviation was calculated, with deviation defined here as the difference between experimental pH and predicted pH value for each point.
Where data points might be expected to show some relationship, e.g., between average values for different sets of conditions within an experiment or between individual points in a data series, regression analysis was carried out. For this purpose, the coefficient of determination (R2) and the Root Mean Square Error (RMSE) were calculated, with error defined as the difference between the predicted pH and the line of best fit for experimental and predicted values, to take account of variation in experimental values. The slope and intercept of regression equations were also considered. T-tests were used to determine the significance of regression statistics and of differences between slopes, with values taken as significant at the 5% level.
For the purposes of assessment, the level of agreement between experimental and predicted pH was defined as good if the difference was <0.1, reasonable between 0.1–0.2, and poor if >0.2 for single data points, or for the RMSD or RMSE of multiple values. Correlation between predicted and experimental pH was defined as poor for R2 < 0.8, reasonable for R2 between 0.8–0.9, and good for R2 > 0.9. These definitions were based on examination of the data and consideration of likely measurement accuracy [24,27]. The studies considered were not specifically designed for the evaluation of the relationship between pH and pCO2 and would therefore not have taken any special steps to ensure accuracy. pH values are affected by temperature and dissolved CO2 content, which may change after removal of the sample from the digester [19], while online in-situ measurement requires frequent calibration for accuracy [19]. As a non-combustible gas, it is also challenging to measure CO2 accurately over the wide range of partial pressures found in CO2 biomethanisation experiments, whether by gas chromatography (GC) or sensor [27]. The precision of the available data was also taken into account, with, e.g., pH values often only reported to 0.1 unit in AD and CO2 biomethanisation studies.

3. Results

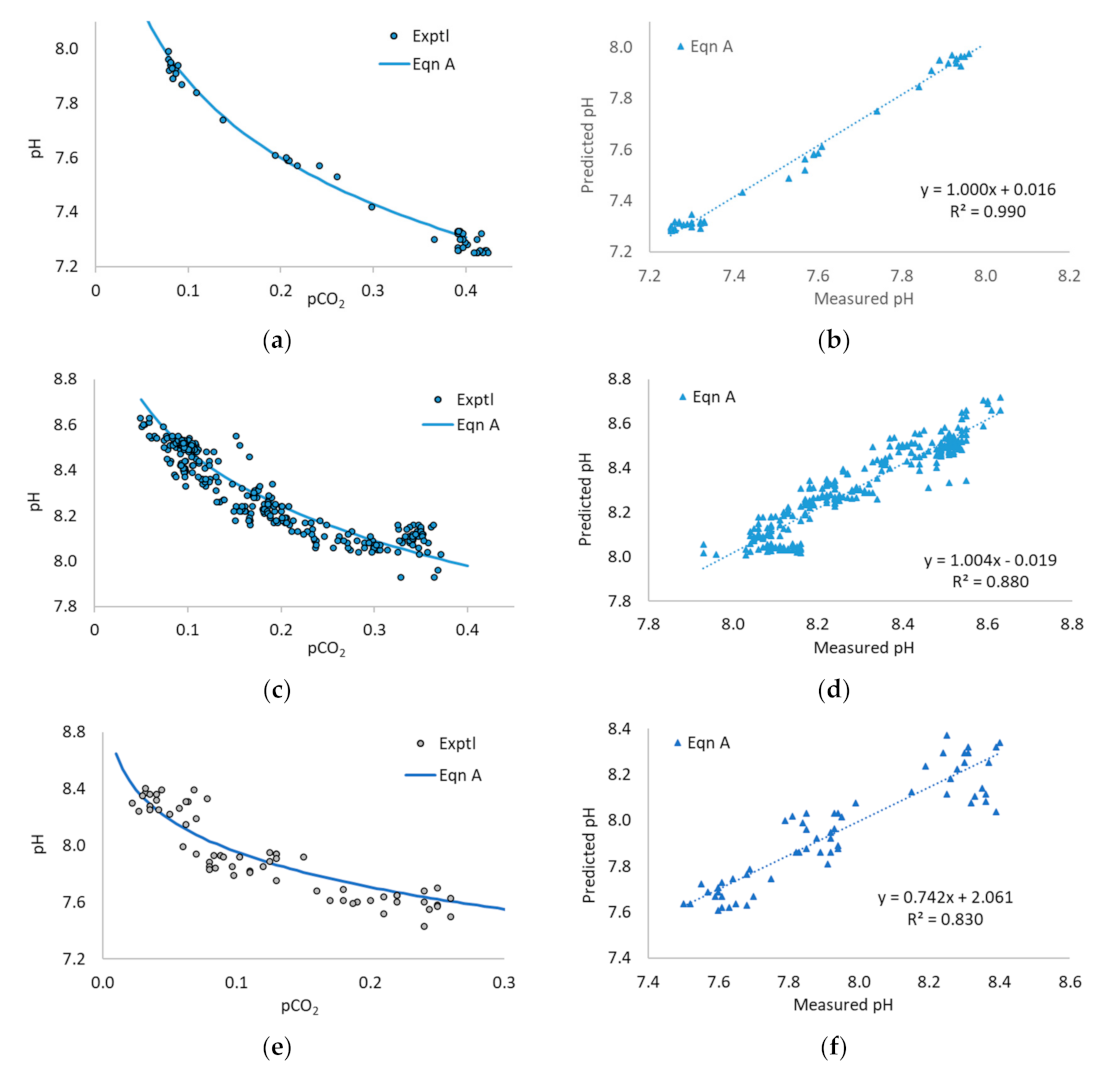
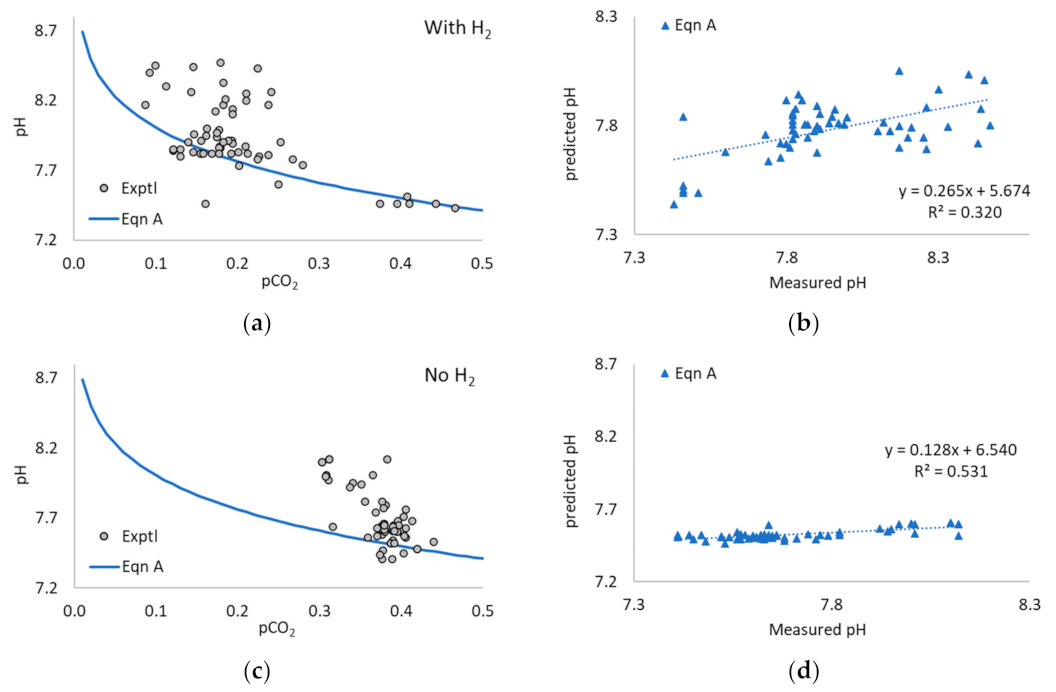
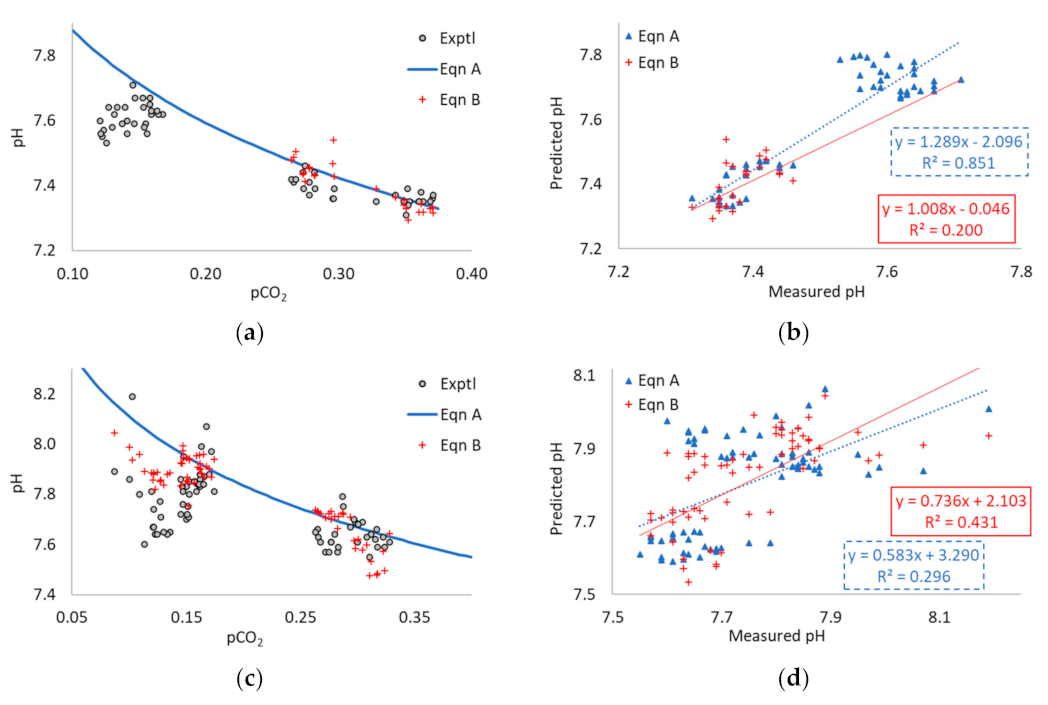
3.1. Application of Equation A to the Literature Data

In total, 36 studies were found with suitable data on pH and pCO2. Most of these reported average values for monitoring parameters from periods of operation under specified conditions, often supported by graphical data. Some also provided numerical data in Supplementary Materials or on request.
The studies covered a wide range of experimental conditions and operating configurations, including different digester types (continuous stirred tank reactors (CSTR) [6,17,18,23,28,29,30,31,32,33,34,35,36,37,38,39,40,41,42,43,44,45,46,47,48,49,50,51,52], upflow anaerobic sludge blanket (UASB) reactors [53,54], anaerobic membrane bioreactors (AnMBR) [55,56], and anaerobic filters (AF) or trickle beds [57,58]. These were arranged in single and 2-stage systems with H2 injection in the first [59] or second [32,36,42,43,45,46,47,60] stage, and with [59] or without [32,42] gas recirculation between the stages). Rates of mixing, gas addition, and recirculation were also varied both within and between studies. Some studies were carried out in pressurised systems [35,37], with gases other than H2 (e.g., carbon monoxide [41,54] or syngas [48,49]). Different gas supply systems were used, including headspace injection [28,29,47,58], various types of bubble tube [6,23,34] or diffuser [2,32,37,42,44,46,49,50,54], venturi outlets [57], and membrane systems [30,40,48]. Trials were conducted in mesophilic [28,29,30,33,34,35,36,37,38,44,48,52,54,55,56,58] and thermophilic [17,18,31,39,40,41,42,43,44,45,46,47,50,53,59,60] conditions, in some cases specifically to compare these [32,49,51]. They were also performed with a variety of feedstocks including livestock manures and slurries, crop and agro-wastes, industrial and post-consumer food wastes, wastewater biosolids, and others [12].
The results of the application of Equation A to these studies are shown in Tables S1–S36 in the Supplementary Materials, in the form of a summary of key operating conditions, with heat maps showing the difference between predicted and experimental pH values, and brief comments on interesting results or trends in each study. Selected examples are discussed below.
As can be seen from the heat maps, good agreement was found under a wide range of conditions for most or all the cases reported in the majority of these studies. In the earliest work on semi-continuous thermophilic digestion of cattle slurry in CSTR [18], the predicted pH based on pCO2 matched the experimental values exactly (see Table S1). However, it should be noted that experimental pH was only recorded to one decimal place (dp) in this trial. Table 1 shows results for a study in which a thermophilic CSTR was fed on cattle manure and whey as co-substrates, with gas supplied via a hollow fibre membrane (HFM) module and H2 input as the main variable [40]. Values of a were derived for every case (i.e., using reported average pCO2 and pH from each set of conditions tested as the baseline values) and used to predict the corresponding pH in all cases. The lower part of Table 1 shows the absolute value of the difference between predicted and experimental pH. As can be seen, Equation A gave a good fit both for each phase and across all experimental conditions. Values of a based on the control reactor provided the best agreement throughout. When a coefficient derived from the highest H2 input was used, this gave a slightly higher RMSD, possibly reflecting the small accumulation of VFA seen under these conditions. A high R2 value across a range of conditions tested, as seen here, is not an essential indicator of good performance in all cases, since some experimental designs will show differences between different phases. Yet, where it does occur, it provides additional confidence in the predictive capacity of the equation.
Similar levels of agreement were found in other studies using conventional single-stage CSTR, examples are given in Tables S1–S9. Equation A also performed well where stable operation was achieved in CSTR studies with the addition of carbon monoxide (Tables S10–S12) or syngas (Tables S13 and S14). One favourable factor in some of these trials may be the absence of very low pCO2 values due to the additional CO2 produced from CO conversion, although CO can also be inhibitory at higher concentrations [31,41].
In 2-stage CSTR systems, good agreement was found under both mesophilic and thermophilic conditions (see, e.g., Table S15). A long-term acclimatisation study in a thermophilic 2-stage CSTR initially showed good agreement between predicted and measured pH [42]. After two years of operation, agreement appeared to deteriorate: this was likely associated with a raised VFA concentration recorded at the time, linked to the high pH and low pCO2 value (see Table S16), and thus supports the usefulness of an equation taking VFA into account. Good agreement for comparable periods of stable operation was also found for other reactor types including AnMBR (Table S17), UASB (Table S18), AF (Table S19), and trickling filter (Table S20), and in a 2-stage system consisting of a CSTR coupled to an upflow reactor (Table S21).
Equation A also performed well when applied to pressurised systems. A 35-L mesophilic CSTR fed on wastewater biosolids was operated at four different pressures [35]: after pCO2 was adjusted for the applied pressure, the experimental and predicted pH agreed well for all but the initial lowest pressure (Table S22). No VFA accumulation was observed that might account for this, but it is possible that other factors such as acclimatisation were involved. In a trial of pulsed H2 addition, initial pressures were not reported but experimental and predicted pH agreed well up to a H2/CO2 ratio of 8 [29]; deterioration above this may have been due to changes associated with higher pressure and/or to VFA accumulation (Table S23). In another pulsed H2 trial, initial values corrected for pressure showed good agreement [28]; other results were difficult to interpret due to uncertainty over the timing of different measurements (see Table S24a,b). Another study with headspace pressurisation [33] showed good agreement within phases, although pH was only reported to 1 dp and there was relatively little variation in pCO2 values trial (see Table S25).
Where agreement between experimental and predicted pH values was less good, the reasons for this were often clear. One common issue was VFA accumulation. In a study of mesophilic and thermophilic digestion of cheese whey, significant swings in VFA concentration were encountered, and various buffering strategies were adopted to control them [43]. Equation A gave only reasonable agreement, reflecting changing conditions between the different phases (Table S26). Thermophilic digestion of ensiled ryegrass was successfully achieved [44], but the VFA accumulation observed during periods of H2 addition likely accounted for the poor agreement between predicted and experimental pH (see Table S27).
In some cases, there were apparent discrepancies in the data or results that could account for the poor agreement. In a study of mesophilic CSTR digestion of mixed sewage sludge [30], the pH in control and experimental digesters differed by 0.22 units during the start-up phase, before any H2 addition had occurred, making comparisons with other phases problematic (Table S28). pH values also showed quite high standard deviations during this trial, perhaps reflecting the use of online measurement and/or variability between batches of feedstock. A study of mesophilic food waste digestion with pressurisation and H2 addition used calculated pH values [37]; but these appeared to be incorrect, perhaps due to the use of acid dissociation and Henry’s Law constants for 25 °C rather than for the operating temperature of 37 °C. However, when Equation A was applied ‘in reverse’ using baseline values from the pH calculations, it gave a much better agreement between predicted and measured pCO2 (see Tables S29a,b).
In other cases, potential explanations remained speculative in the absence of supporting data. Digestion of ethanol distillery wastewater in a mesophilic AnMBR [55] showed poor agreement between predicted and experimental pH values in almost all conditions tested, although VFA accumulation was only seen at the highest H2 loading (Table S30). However, the reactor was operated without sludge wastage, which could have caused changes in TAN or other unreported parameters during the experimental period.
Very few cases were found where there was no clear reason for poor agreement. In one study of a 2-stage mesophilic CSTR processing cattle manure and food waste, with H2 injection in the second stage and gas recirculation between stages, pH reportedly fell on H2 addition (Table S31). However, no factors accounting for this were identified [36].
In general, analysis of the data was able to demonstrate convincingly that Equation A performed very well whenever conditions were relatively stable and without major shifts in TAN or VFA concentrations; while also providing evidence to support the usefulness of an equation able to take changes in these parameters into account. Some general and methodological issues and the insights obtained from them are further discussed in Section 4.1 below.

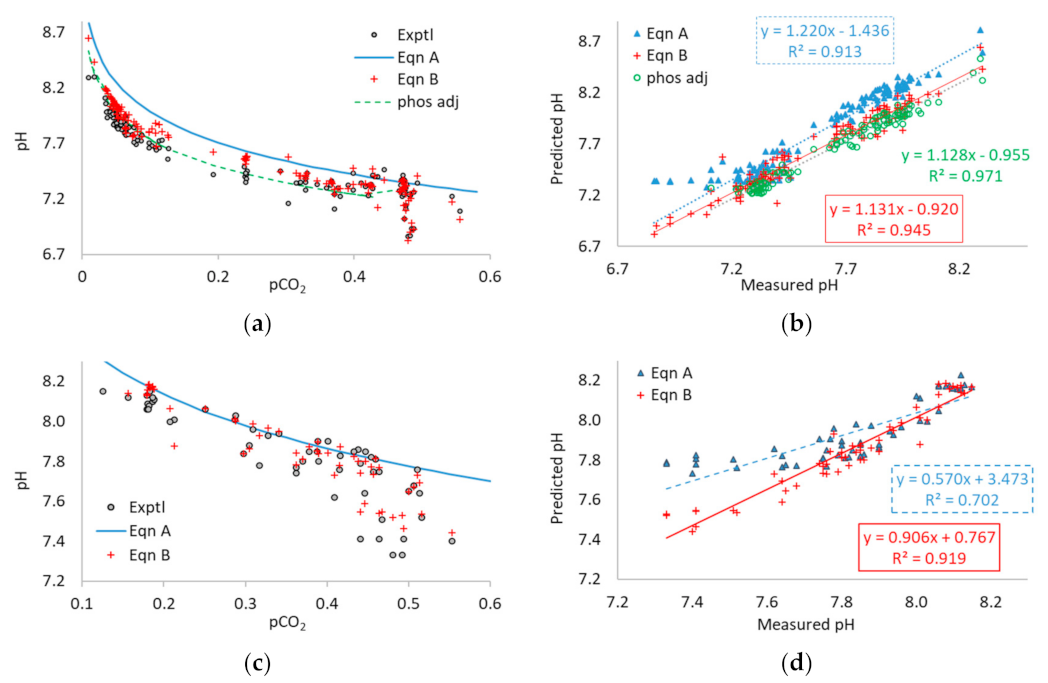
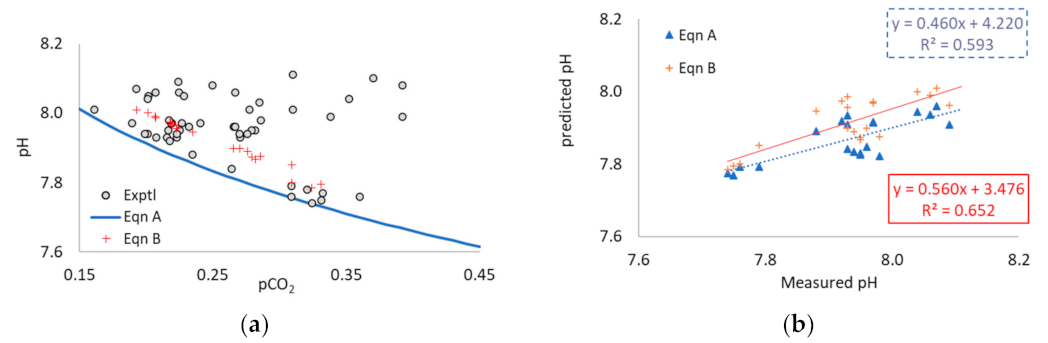
3.2. Application of Equation B to the Literature Data

Equation B was designed to take account of the effect of digestate TAN and VFA concentrations. However, the majority of studies examined had no data on TAN and in many cases only limited details of VFA content, e.g., as total VFA without speciation or expressed in terms of Chemical Oxygen Demand (COD) or acetic acid (Hac) equivalent. Ten studies by other groups were found which had suitable data on both TAN and VFA, and these were used to compare the relative performance of the two equations.
Application of Equation B did not always show a clear improvement over Equation A, either because Equation A already gave good agreement and there was little change in VFA or TAN during the trials (see Tables S1, S3, S7 and S17), or because HCO3- and NH4+ remained the main buffering pair despite the presence of VFA (Table S5); or because of other issues with the data or results (Tables S14, S22 and S28). Table 2 shows results from [46] where Equation B was able to improve estimated pH by up to 0.06 units, bringing case (iv) into the good agreement range. This and other examples of improvement can be seen in Tables S3, S4, S32 and S33. In general, the results showed that Equation B performed well, and merited further testing against datasets with more striking changes in VFA and/or TAN concentrations.

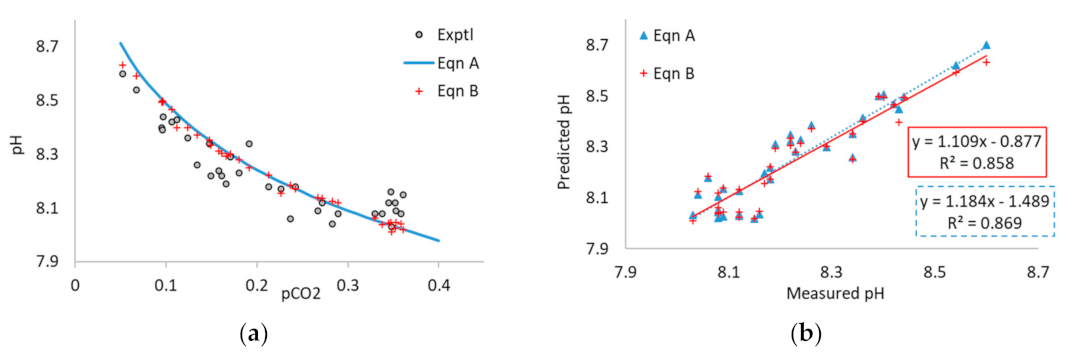
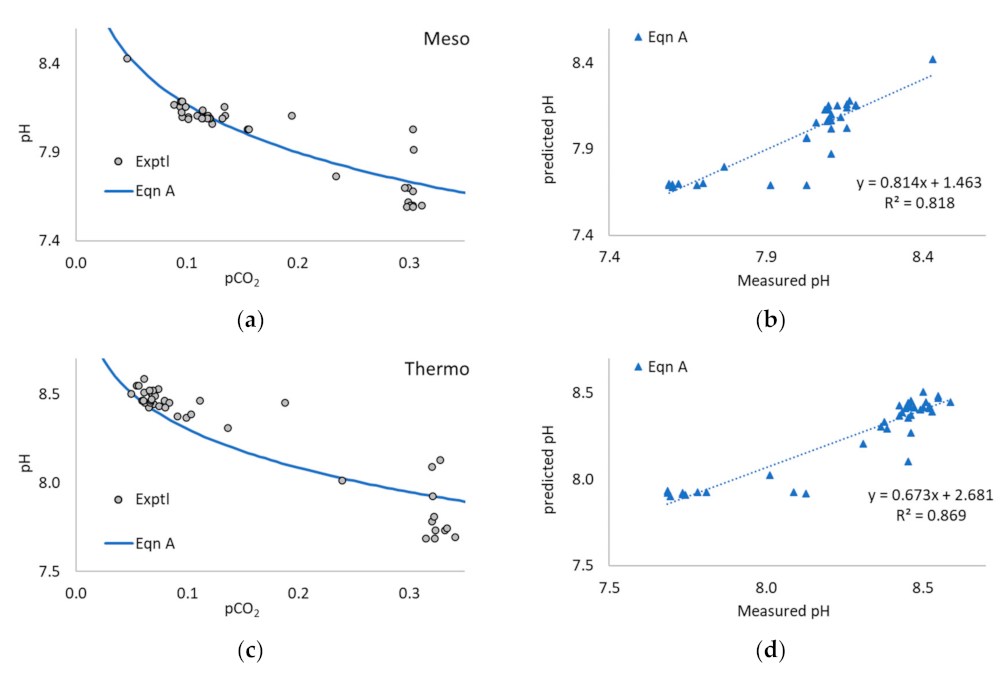
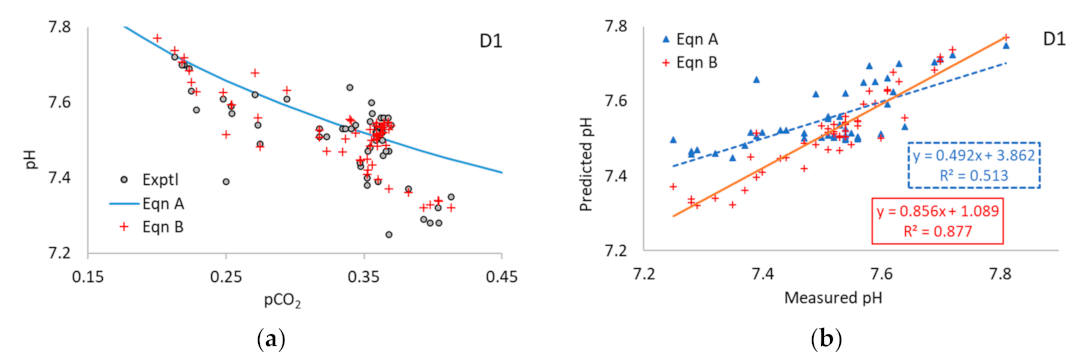
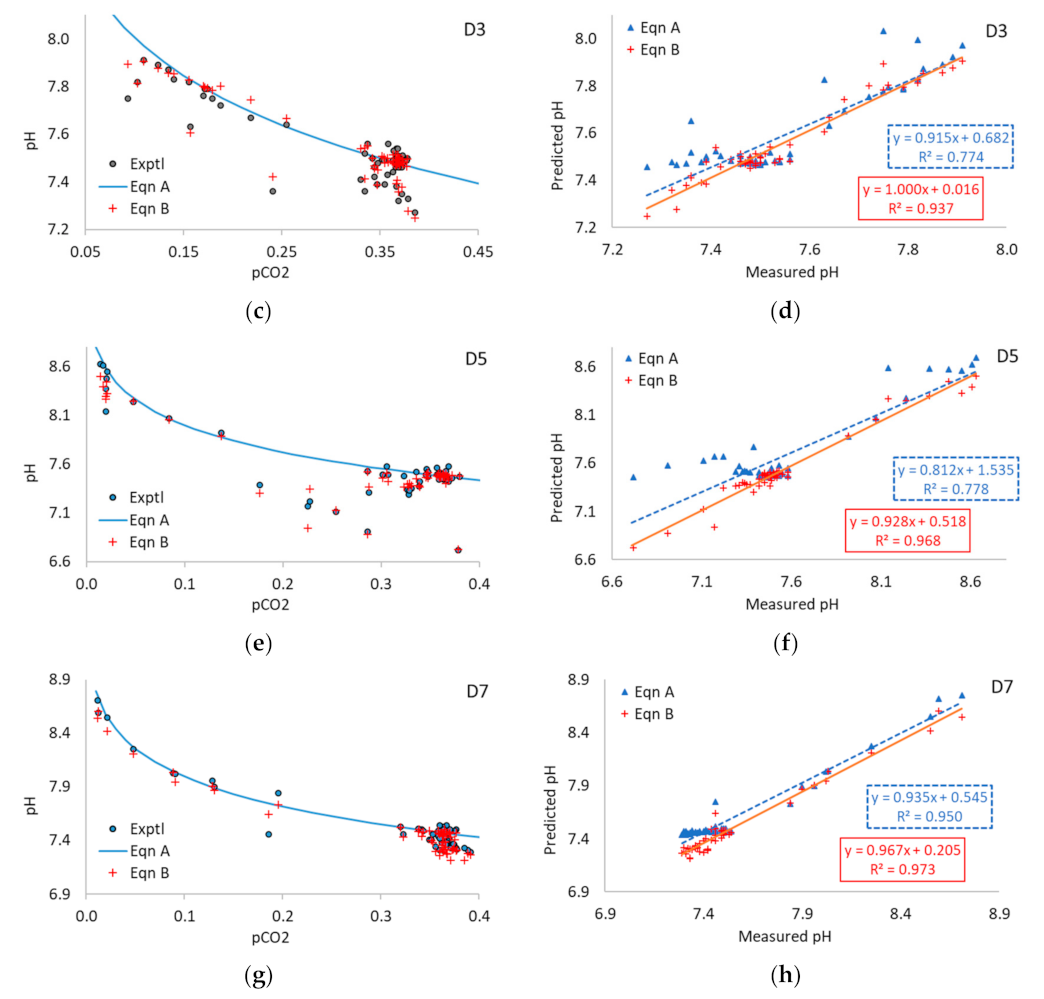
3.3. Application of Equations A and B to Multi-Point Data

This part of the work was carried out to test the performance of Equations A and B with multi-point data series.
The original study that derived Equation A [6] included datasets from mesophilic CO2 biomethanisation of food waste and from a short-term study with sewage sludge. These were re-analysed to include more datapoints and provide additional information. The results are shown in Figure 1a–d, and it can be seen that Equation A performed well in both cases. For sewage sludge the correlation coefficient R2 was 0.991 with n = 49 (increased from 30 in [6]), p < 0.000, and RMSE 0.03. For food waste digestion the equivalent values were R2 = 0.880, n = 299 (increased from 242), p < 0.000, and RMSE 0.07 indicating that most points met the good criterion: this was despite a rise in VFA concentrations when pCO2 briefly fell below 9% [6]. The food waste digestion study included some TAN and VFA data, and Equations A and B were also applied to points where VFA measurements were available, using interpolated TAN values where necessary. However, as TAN in this experiment was around 100 times higher than VFA on a molar basis, there was little difference between the two equations (see Figure A1 in Appendix A).
Several researchers kindly provided additional information in the form of experimental data series from published works [17,32,39,40,50,51,52,53]. These studies were designed to test a variety of factors, so the available data were not always ideal for the current purpose: parameters such as pH and pCO2 were not necessarily measured frequently or on the same day [32,53], or only were reported to 1 dp [40]. Data points were sometimes unevenly distributed, with a lack of results at high, intermediate, or low pCO2 [17,32,51]. TAN and VFA concentrations were not always monitored, and when available were usually measured less frequently than pH and pCO2, limiting the amount of data suitable for use with Equation B. In two cases, further processing was carried out to increase the number of data points available, by interpolation between measured pCO2 values [32] and by using modelled TAN concentrations [39].
Of the eight additional datasets considered, four showed poor agreement between experimental and predicted pH values based on Equation A [17,39,50,53], in part at least for some of the reasons mentioned above. The other four showed better agreement, with R2 values between 0.80–0.86. Figure 1e,f shows results for numerical data from the work of Luo and Angelidaki [40]: in this case Equation A gave a reasonable fit (R2 = 0.83, n = 60, p < 0.000; RMSE = 0.12) for thermophilic CSTR digestion of cattle manure and whey at three H2 loading rates across a range of pCO2 values between 0.02–0.26. Results for data from mesophilic digestion of pig manure by Zhu et al. [51,52] were R2 = 0.85, n = 55, p < 0.000, RMSE = 0.10; and from 2-stage mesophilic and thermophilic digestion of cattle manure by Bassani et al. [32] were R2 = 0.82, n = 32, p < 0.000, RMSE = 0.10 and R2 = 0.869, n = 40, p < 0.000, RMSE = 0.13, respectively. Graphs for these studies are given in Appendix A Figure A2, Figure A3, Figure A4, Figure A5 and Figure A6.
Four of the additional datasets included some data on TAN and VFA, but in each case, the application of Equation B was challenging. A further study on thermophilic co-digestion of cattle manure and whey by Luo and Angelidaki [17] had very few data points at high pCO2 (Figure A5). TAN was measured only once in each phase, and molar VFA concentrations occasionally exceeded the average TAN value, making Equation B inapplicable for these points. In data on CO2 biomethanisation of pig manure by Zhu et al. [50,51,52], Equation A had shown good results for mesophilic conditions, but TAN measurements were only available for the first part of this run (Figure A6a,b). Agreement in thermophilic conditions was poor, although there was a modest improvement in R2 when TAN and VFA were included using Equation B (Figure A6c,d). Using VFA data and modelled TAN values from a further study on cattle manure and whey by Lovato et al. [39] also produced a slight improvement in R2, but in some cases, VFA concentrations exceeded the estimated TAN values, and neither Equation A nor B gave good agreement between predicted and experimental pH (see Figure A4).
Two further studies with some TAN and VFA data were available from experiments using a synthetic feedstock containing phosphates [6,23]. In one of these [23], the OLR was adjusted by changing the feed concentration and thus TAN and other parameters. Equation A gave a good correlation (R2 = 0.91) between predicted and experimental pH values, but with the predicted curve offset from the experimental data (Figure 2a). Tao et al. [6] showed that a modified approach taking account of the effect of phosphate buffering could reduce this discrepancy, but it was not possible to adapt this approach for Equation B as TAN values were already used in the phosphate adjustment. However, when Equation B was applied without any phosphate correction, it also gave a considerable improvement. Figure 2a, b shows measured and predicted pH values based on Equation A, Equation B, and the phosphate adjustment for one replicate digester at OLR 3 g COD L−1 day−1. It can be seen that the phosphate adjustment increased the correlation coefficient and shifted the predicted pH closer to the experimental values, improving the RMSE from poor to good. Equation B (with no phosphate correction but adjusted for TAN and VFA) gave slightly a lower R2 value than the phosphate adjustment, but a similar improvement in RMSE. Table 3 shows a heat map of the difference between predicted and experimental pH values using Equation A, Equation B, and the phosphate adjustment, for each phase of the experiment at OLR 3 g COD L−1 day−1. Both Equation B and the phosphate adjustment were able to reduce some discrepancies although neither were able to eliminate poor results in phase 3. Table S34 gives equivalent results for all OLR in the trial with additional statistical parameters, while Figures S2–S5 show the data series graphically: it can be seen that in general both approaches performed very well, and comparison between them can help to elucidate the relative importance of phosphate buffering, and TAN and VFA concentrations in each case.
The second set of experiments using the same synthetic feed was carried out at controlled TAN concentrations [6]. At TAN 3 g N L−1, the pH was mainly affected by ammonia, and the effect of the phosphate adjustment was small (see Supplementary Materials in [6]). The dataset of points in this experiment with measured VFA concentrations were re-analysed, using interpolated TAN values where necessary: results for 3 g N L−1 are shown in Figure 2c,d. It can be seen that Equation B gave a significant improvement in fit (R2 = 0.919) compared to Equation A (R2 = 0.702, with n = 54 and p < 0.000 in both cases). Table S35 shows heat maps for results from Equation A using average values for each phase, while Figures S6–S9 present the data series graphically: the majority of results were in good agreement, and the two trials thus provided a powerful demonstration of the equations across a range of TAN concentrations.
It is also noteworthy that the datasets in both studies using this feedstock contained some extreme/outlying points, including values from the first days of digester operation before feeding was stabilised, and well before any H2 addition: these correspond to points with high pCO2 and low pH in Figure 2a,c. Thus, these results are interesting as they indicate Equation B can be used for pH prediction under a wide range of conditions, not only for the purposes of controlling H2 addition in CO2 biomethanisation. These two studies represent a special case, as in real organic feedstocks buffering capacity is normally provided mainly by the bicarbonate-ammonium pair. The results clearly demonstrate the value of taking VFA and TAN into consideration.
Analysis of the multi-point datasets therefore gave further clear evidence of the validity of Equation A. The additional datasets obtained from other groups did not provide a completely satisfactory demonstration of Equation B, in part because the studies considered were not designed for this purpose; although the results from these and from the data of Tao et al. [6,23] strongly indicated the potential of an equation able to take VFA and TAN into account, and confirmed the need for further experimental data.

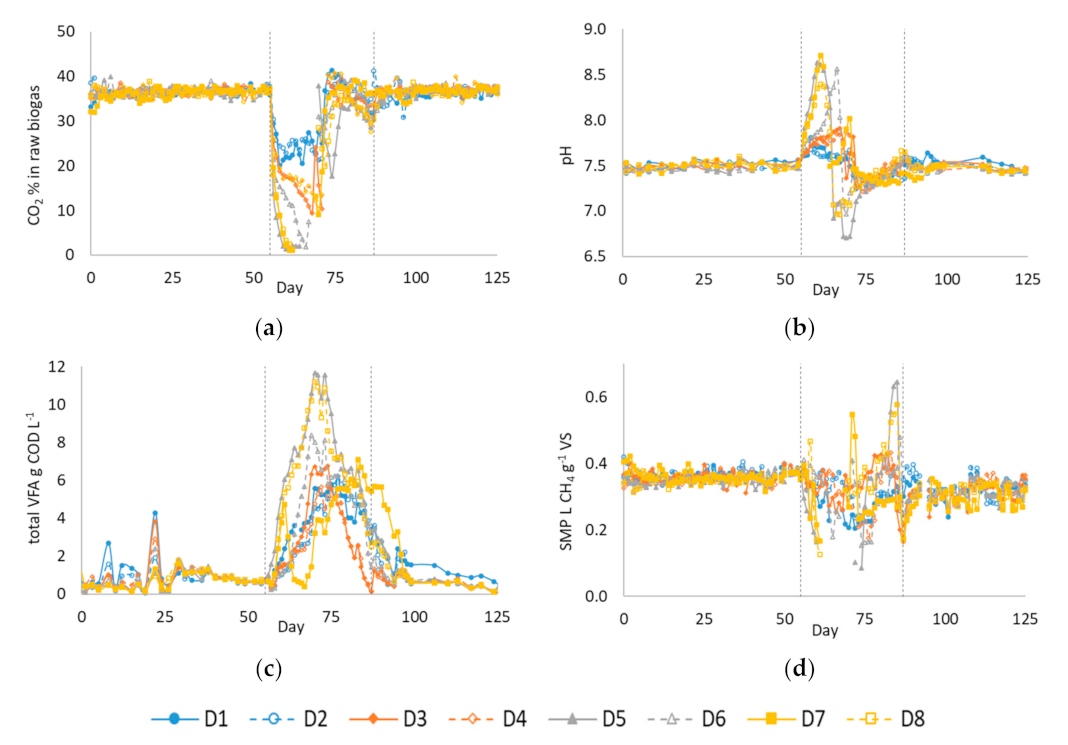
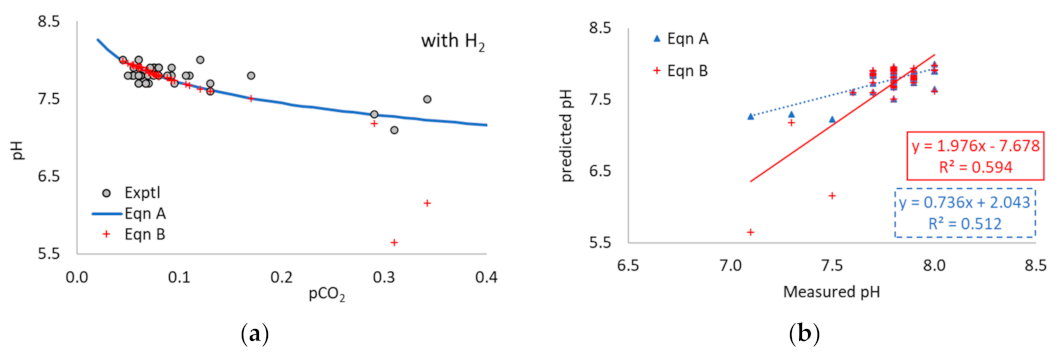
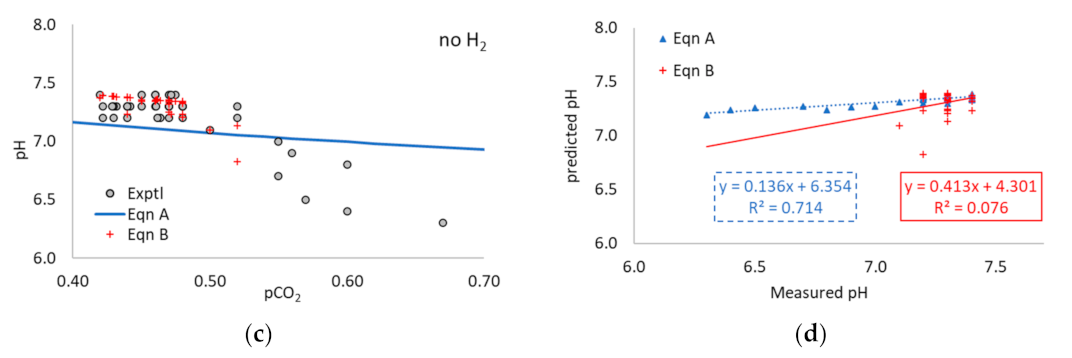
3.4. Experimental Trial of H2 Addition to Induce Digestion Instability

3.4.1. Digestion Performance
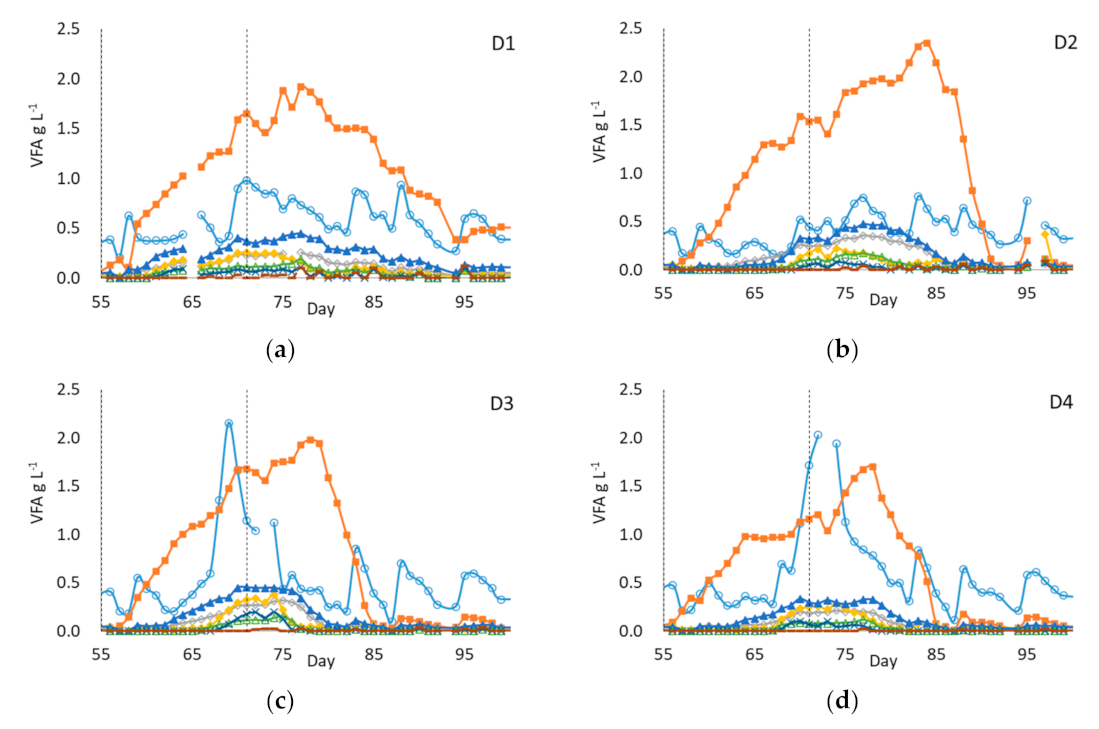
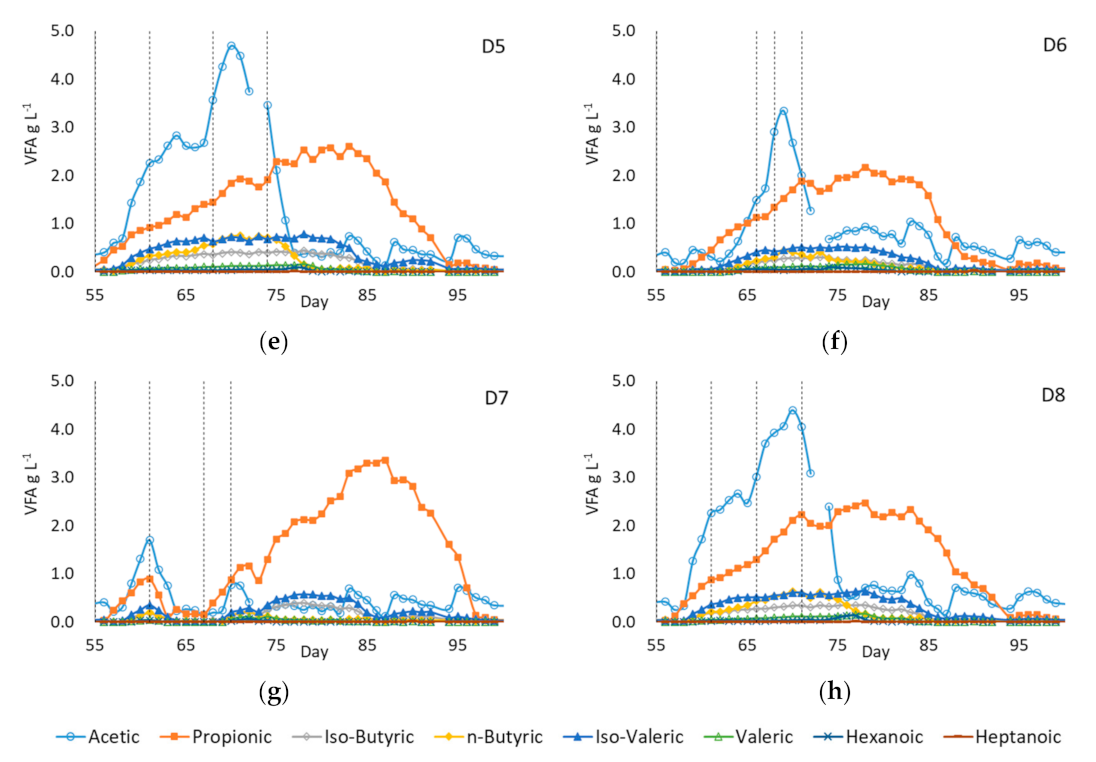
During the period of operation under uniform conditions between days 0–54, monitoring parameters for all digesters were in good agreement, as can be seen in Figure 3. Average values for this period are given in column (i) of Table 4. Note that specific methane production (SMP) is expressed as total CH4 produced per unit of organic feed VS, including any CH4 from added H2: on days without organic feed SMP values are omitted.
From day 55 onwards, digesters were operated in pairs and received H2 addition at the following rates: D1 and 2 0.81, D3 and 4 1.58, D5 and 6 2.34, and D7 and 8 2.82 L H2 L−1 day−1, corresponding to a nominal 24%, 48%, 70%, and 85% of the stoichiometric H2 requirement for conversion of CO2 in the produced biogas and to additional COD loadings of 0.58, 1.13, 1.67, and 2.01 g COD L−1 day−1, respectively. These rates of addition were intentionally selected to exceed the anticipated conversion capacity of the digesters in the described operating mode, especially without acclimatisation [18].
As expected, the introduction of excess H2 led to a rapid fall in pCO2 (Figure 3a) accompanied by a rise in pH (Figure 3b), VFA accumulation (Figure 3c), and a fall in volumetric methane production (VMP) and in SMP (Figure 3d). In D1 and 2, and D3 and 4, H2 addition rates were maintained until day 70 apart from a brief reduction in D1 on days 65–66. However, there were clear signs of continuous VFA accumulation, along with a decline in SMP (Figure 4c,d). H2 addition to these digesters was stopped on day 71. In D5, D7, and D8, the initial rate of H2 addition was maintained until day 61, by which time the pH had reached 8.61, 8.71, and 8.39 with total VFA concentrations of 6.0, 4.7, and 5.4 g COD L−1, respectively. Addition rates for H2 and organic feed were varied over the next few days (details in the experimental dataset) but any signs of recovery were temporary, and H2 addition was stopped completely on days 74, 70, and 72, respectively. D6 initially showed a slightly lower rate of pH rise and VFA accumulation than D5, and H2 addition continued until day 66: at this point, the pH had reached 8.6 with a total VFA concentration of 5.3 g COD L−1. H2 and organic loading rates were varied over the next few days, but without lasting recovery and H2 addition to D6 was stopped on day 71. After H2 addition ceased pH and VFA concentrations gradually stabilised, by day 87 the full organic loading of 3.87 g VS L−1 day−1 was resumed in all digesters. The operation continued until day 125 with less frequent monitoring until the end of the period, when parameters were again measured to provide baseline values after stabilisation. Average values for this period are shown in column (iv) of Table 4 and were close to those found at the start of the trial, indicating good stabilisation.

3.4.2. VFA Profiles

Figure 4 shows VFA speciation for the digesters between days 55 and 100. Following the start of H2 injection on day 55, propionic acid accumulation occurred at similar rates in all digesters. This was expected considering the high H2 partial pressures, which made one of the main propionate degradation pathways, to acetate, H2, and bicarbonate/CO2, thermodynamically unfavourable [61]. The average propionate accumulation rate was 100 mg L−1 day−1 for D1–4 over the 16 days of H2 injection, and 140 mg L−1 day−1 for D5–8 for the first 6 days of the period. Increases in acetic acid concentrations more closely reflected the difference in H2 injection rates, with D1 and 2 apparently showing little change in acetic acid while the average rate of acetic acid accumulation in D7 and 8 during the initial six days of H2 injection was 310 mg L−1 day−1. This is likely to have been due to homoacetogenesis occurring under high H2 partial pressure.
During H2 addition pH in D1–4 did not show such a marked rise as in D5–8, with measured values remaining below 7.9; whereas propionic acid concentrations continued to increase even after H2 addition ceased. This indicated that the degradation of organic feed in D1–4 might also be blocked, although not as severely as in D5–8. Since sampling and pH measurement was conducted at the end of each daily feeding cycle, it is possible that pH values at some point during the cycle were higher than at the end, as reported in [6], and that this was responsible for the apparent blockage. This temporary unfavourable pH may also have caused partial inhibition of organic feed degradation during the 16 days of the H2 injection period.
The VFA profile in D7 differed slightly from that in the other digesters, showing a fall in VFA concentrations when H2 addition was paused on day 61, accompanied by a two-day gap in organic feeding followed by two days at reduced OLR. However, after OLR was restored and H2 was reintroduced on day 67, propionate accumulation began and continued as in the other digesters even after H2 addition ceased on day 70. Other VFA species also accumulated and then declined in all digesters in roughly the same order (see Figure 5), with iso-valeric, n-butyric, and iso-butyric plateauing at around 0.5 g COD L−1 in most case until propionate concentrations started to fall.

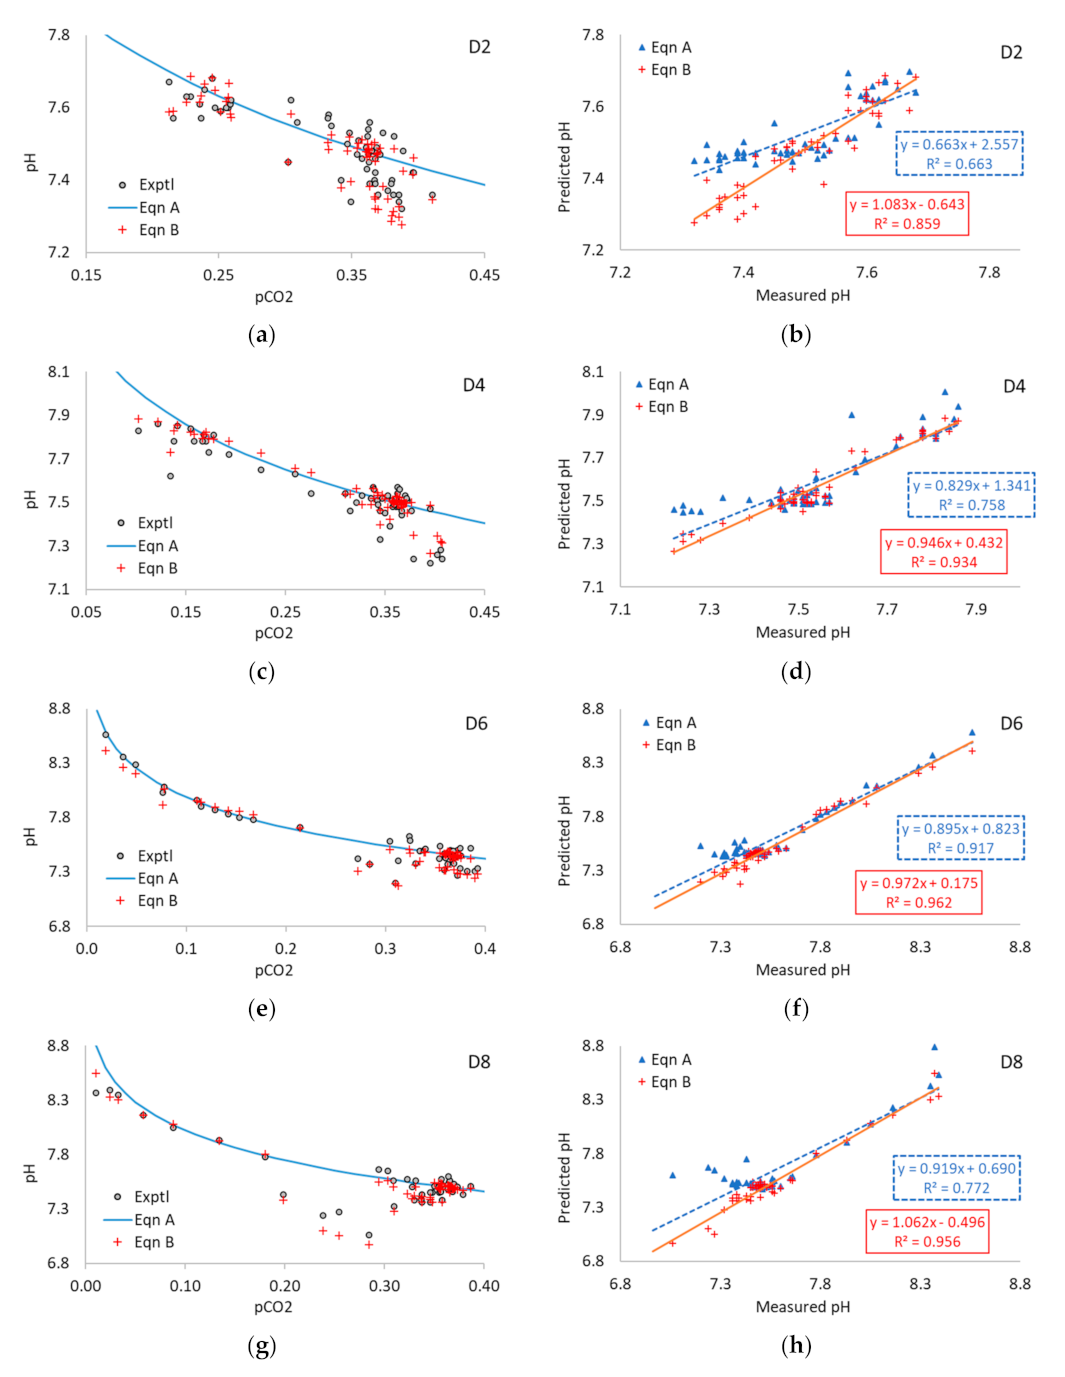
3.5. Application of Equations A and B to Experimental Data

As with the previous analysis of multi-point data series, values from the experimental work were used to evaluate the performance of Equations A and B. The dataset used consisted of points for which measured pH, pCO2, and VFA concentrations were available, with linear interpolation of TAN values where required. Day 0–24 was initially defined as the baseline period, and average values from this (shown in column (ii) in Table 4) were used to calculate the coefficients for Equations A and B. The two equations were then applied to the data for days 25–100.
Experimental pCO2 and pH and predicted pH values in D2, D4, D6, and D8 are shown in Figure 5, with equivalent graphs for D1, D3, D5, and D7 in Figure A7 in Appendix A. Coefficient values for Equations A and B and statistical data for all digesters are given in Table 5.
A fairly wide range of conditions occurred during the trial, with pCO2 values ranging from 0.41 to 0.01, pH from 6.7 to 8.7, TAN from 1.6 to 2.1 g N L−1, and VFA concentrations of up to 11.2 g COD L−1. Equation A provided a good fit to the experimental data during stable operation but was less able to predict pH accurately in the period of instability during and after H2 addition when VFA concentrations were high and varying. This resulted in poor correlation coefficients (R2 < 0.8) in most cases (Table 5). In contrast, the performance of Equation B was good, with R2 values ranging from 0.859 to 0.973. In comparison with Equation A, the use of Equation B gave a marked improvement in the correlation coefficient and the RMSE for experimental versus predicted data in each case and for each replicate (see Table 4). This improvement was particularly clear in D1-5 and D8, whereas in D6 and D7 Equation A also gave relatively good results. Equation B also appeared to give a slight improvement in the slope and intercept values for graphs of predicted versus experimental pH, although the difference in slope was only significant at the 5% level in D1 and D2. In all cases the RMSE value using Equation B was <0.1, indicating that it was able to provide a reliable prediction of digester pH based on pCO2 even in periods of rapidly changing VFA content.
As a further indication of the robustness of these equations, it can be seen from Table 4 that values for a and b obtained from the baseline period were very close for all eight reactors: substitution of the relevant coefficient from another digester made only a minimal difference to the results or to the statistical parameters shown. As an additional check, values for coefficients a and b were calculated for alternative baseline periods from day 25–54, and from day 110–125 after the final stabilisation of the digesters, based on the data in columns (iii) and (iv) of Table 3. The calculated values were closely similar to those in Table 4, and use of them again had very little impact on the performance of Equations A and B. Data points between days 110–125 were not included in the analysis shown in Table 4 and Figure 5 because of a lack of measured values for TAN in the later part of the trial. Yet, inclusion of these points using interpolated TAN values also caused only minor changes in R2 and RMSE (details in the experimental dataset). Equation B was thus shown to be both robust and effective even in conditions of operational instability.
As noted above, in digestion of organic wastes the main buffer pair is usually HCO3 and NH4+, with VFA and NH4+ only secondary. The strategy of excess H2 addition was very effective in pushing up VFA concentrations to create conditions of temporary instability in the digesters for testing Equation B. While the dataset would have been strengthened by more TAN measurements in the latter part of the experimental period, the trial was thus very successful in demonstrating both the impact of short-term changes in pCO2 and VFA on digester pH; and the potential value of Equation B as a tool for process control and management in unstable operating conditions.

4. Discussion

4.1. Methodological Issues with Data in Literature Studies

The relationship between pCO2 and pH described in Equation A was shown to work consistently and with a high predictive capability when applied under stable operating conditions. In circumstances where changes in VFA or TAN concentrations occurred, Equation B was shown to work well both for the majority of the datasets analysed, and for the dedicated experimental work in which digester stability was tested to a point of process failure. Some results were found in data from reported studies where the equations did not give reliable results; however, it is important to try and understand why these cases occurred. The first point to note is that the analysis presented used data from all relevant published studies on in-situ CO2 biomethanisation: it did not attempt selectively to discount datasets that did not show good agreement or to dismiss reactor types or methodologies that did not conform to typical norms. It is also important to remember that the studies considered were not specifically designed for the current purpose. As a result of these factors, there were some issues with the available data for methodological and other reasons: parameters of interest were not always measured, or not measured frequently enough, or were reported in unsuitable units, or omitting relevant details of sampling or operational conditions. Examples include experiments where H2 was added by headspace injection (see Tables S23–S25): interpretation of data from these could be challenging, as it was not always clear whether reported pH and gas composition values were measured at the same time, while headspace pressures could have varied both between treatments and during a trial.
Many studies reported average values for a given phase or set of conditions, but these could be misleading, especially when there is considerable variation during a phase. Equation A gave poor agreement when applied to average values reported in [47]. However, if the results were recalculated using the final data points, good agreement was achieved (see Table S9). Values for individual data points may thus be preferable, while the use of data series also allows the assessment of variability.
In some studies, pH was controlled by chemical addition during some or all of the experimental period [34,48,58,62], making the data difficult or unsuitable for use in this work.
In some cases, agreement between the first and subsequent phases was poor, but improved after phase 1 (see, e.g., Tables S20, S22 and S25). This may simply reflect initial acclimatisation, especially if the first phase was short; although there is also an intriguing possibility that differences could be due to changes in gas circulation and mixing. In some studies that used gas bubblers or diffusers, there was apparently no gas recirculation in the control digester or period [23,44]; whereas there is clear evidence that changes in recirculation or mixing rates can affect performance and operating parameters [17,36,46].
Despite such issues, the available data allowed a clear demonstration of performance of the equations in each case while providing some interesting insights on practical requirements for this type of research.

4.2. General Research-Related Issues

The derivation of Equation A assumes that most baseline parameters remain applicable throughout the operating period, and changes in pH are driven primarily by pCO2. As both the literature data and the experimental results showed, in practice this is not always so. Changes may occur over short periods, as in the current study where excess H2 induced rapid VFA accumulation, or, as a result of longer-term processes such as washout and acclimatisation. CO2 biomethanisation studies are often not run under the same conditions for three HRT for each phase or during start-up (see e.g., [31,49,51,60]). This is a reasonable approach where the main aim is to assess gas transfer and utilisation or changes in the microbial community, which happen on relatively rapid timescales. Yet, the stabilisation of digestate parameters can take longer and may appear as a drift in values between phases. For example, when tested on data from mesophilic cattle slurry digestion in a 140-L helically-mixed CSTR [38], Equation A gave good results (Table S8). However, there was a slight downward trend in agreement through the trial, which might have been associated with incremental shifts in TAN or VFA during acclimatisation, since the total duration for all phases was around 2.5 HRT. Unfortunately, these parameters were not reported.
Experimental design is an important factor here. Changes in baseline values during a trial due, e.g., due to acclimatisation or feedstock variability may be easy to distinguish where there is a control reactor. If TAN and/or VFA changes in the same way in both control and experimental reactors then agreement within each phase may be good, even if that between phases is not (e.g., Table S25). However, the identification of such changes is more difficult when different conditions are run in series without controls.
There may also be specific reasons for differences in TAN between control and experimental digesters within a phase, such as changes in microbial biomass associated with growth in the hydrogenotrophic methanogenic population during in situ CO2 biomethanisation [23], or toxicity effects from syngas or other inhibitors. These effects may help to explain patterns where agreement across several phases is good for control reactors but poor for experimental ones (e.g., Table S36). In such cases, results from control digesters do not resolve the problem, although it may still be possible to observe trends in the results.
The original studies by Luo et al. [17,18,40,41] were run with control reactors, at relatively short HRTs of 15 days, in conditions that allowed steady stable operation, and therefore produced good agreement in all cases: see Tables S1, S2, S3 and S10. Studies of this type can give high R2 values for prediction across multiple conditions but, as noted earlier, this is not a requirement for demonstrating the good performance of the equations tested if there are other reasons for variability across phases.
Several of the above examples add further support to the practical value of an equation that can deal with changes over both long and short timescales. The present work demonstrated that Equation B was able to deal with acute short-term changes, such as the rapid VFA accumulation in the current trial. It could also accommodate longer-term changes and shifts in TAN: the evidence for this is slightly more tentative due to the relative scarcity of datasets with TAN measurements but can be seen, e.g., in Tables S7, S22, S34 and S35. Equation B also performed well when there were changes in both TAN and VFA (e.g., Tables S4 and S32). As noted above, Equation B is thus applicable in cases where pH is affected by other factors in addition to changes in pCO2 induced by CO2 biomethanisation.

4.3. Considerations for Large-Scale Operation

In this work pCO2 values from literature and experimental data were used to predict pH, and the results were then compared with reported pH values. pH was selected as the output because this is widely used as an indicator of stability in day-to-day operation. However, the same relationships can of course be used to predict pCO2 from pH, and monitoring of either parameter in conjunction with the use of these equations could thus provide a useful basis for process control in CO2 biomethanisation.
Equation A allows calculation of pH values from two parameters (digester temperature and pCO2), with a further two (TAN and VFA) required for Equation B. Calibration can be achieved by measurement of these parameters under one set of conditions, which does not necessarily have to be baseline operation (e.g., without H2 addition in the case of CO2 biomethanisation), as long as these are representative of a stable operating mode. In contrast, alternative models to predict pH such as ADM1 [63] generally require a large number of input values for calibration. These more complex models also predict many other performance and stability parameters, but their use in real-time control is still uncommon, although interest in this application is expanding [20,22].
Variations in the feedstock can cause changes in total Kjeldahl nitrogen and TAN, and while these can be controlled in laboratory experiments they also affect commercial AD plants [20]. Even with relatively consistent feedstocks such as sewage sludges, biosolids concentration may vary over time as a result, e.g., of changes in dewatering practices. AD operators at WWTW can accommodate this by changing the applied OLR or HRT if required, but TAN concentrations will still vary and may affect the ammonium-bicarbonate equilibrium, pCO2 and pH and thus the coefficients for Equation A and B. At commercial sites with a single digester, operation without a ‘control’ reactor represents the normal situation: these sites may also have less staff time available for digester management, so simple robust process control systems for CO2 biomethanisation are likely to be particularly valuable in this case [21]. At multi-digester sites it may be possible to process all of the biogas generated on the site in one digester retrofitted for CO2 biomethanisation [6]; in this case the performance of other digesters could provide control data indicating any changes due, e.g., to feedstock variation.
Use of a relationship which takes account of the effect of changes in TAN and VFA concentrations may appear to require increased monitoring compared to current practice at many AD plants [27]. However, as noted earlier, the objective in full-scale operation is normally to remain within an envelope of safe operating conditions. As Equations A and B are equivalent when no VFA is present, Equation A can be used when conditions are stable. Analysis for TAN and VFA is relatively straightforward, and in normal circumstances TAN values do not change very rapidly. Monitoring of additional parameters can therefore be performed infrequently or not at all when an operation is stable, and introduced or stepped up only if some disturbance makes this necessary, meaning the requirement for more parameters need not be burdensome [21].
No detailed analysis was made to compare the values of coefficients a or b derived for different sets of feedstocks or operating conditions. However, it is interesting to note that four studies on thermophilic (55 °C) CSTR digestion of cattle manure obtained from three different sources gave values for a of around 2–3 × 10⁻⁸ when operating stably (Tables S1, S15, S16 and S32); values for mesophilic (37 and 40 °C) operation were slightly higher at around 5–6 × 10⁻⁸ (Tables S8 and S15). Three independent studies of sewage sludge digestion in mesophilic (37 °C) CSTR gave a values of 11–15 × 10−8 (Tables S6, S10 and S38). Crop and agro-wastes and food waste feedstocks, as defined in [12], were more diverse, forestalling any direct comparison. These different values of a reflect both the digestate TAN concentration, and the effect of other physico-chemical characteristics of the digestate on the Henry’s and acid disassociation constants; when the VFA concentration is zero, b is simply equal to a divided by the molar TAN concentration. While it is easy to obtain values for a or b from any suitable set of baseline parameters for a given digester, the idea that there may be typical values of these coefficients which could be applied generally and/or that can be linked to other digestate properties is of interest and worth consideration in further work

5. Conclusions

In the current work, the performance of the two equations was well demonstrated across a wide range of operating conditions and data sources.
Equation A provides a relationship between two simple parameters, often routinely measured, which showed good agreement with experimental data when applied under stable operating conditions. This approach therefore appears suitable as a basis for control of H2 addition in CO2 biomethanisation of organic substrates.
Equation A performed less well for digesters undergoing dynamic change or experiencing instability, as indicated, e.g., by VFA accumulation. In these situations, the use of Equation B incorporating VFA and TAN concentrations was generally able to improve prediction, giving RMSD values of <0.1 pH units: this was clearly demonstrated by experimental work in which unstable conditions were deliberately induced to test the equations’ performance. Both TAN and VFA are relatively straightforward to monitor and when they are included along with pCO2 as in the derived Equation B, the range of application can be extended from stable operation to cover both dynamic change, and crisis management and recovery if digester operation becomes unstable.
As both Equation A and B are derived from fundamental principles, the discrepancies that are seen in some cases between predicted and experimental data most likely reflect limitations in typical measurement accuracy and/or experimental design. This and the fact that the equations performed well when applied to data from a wide range of plant configurations and substrates gives strong support to the view that they are suitable for application on real-world operational sites.
Establishing the required coefficient values for each equation is a simple process requiring only basic data from a period of stable operation. Once these are determined for a particular waste/digester combination, the use of this approach offers a reliable means of optimising the biomethanisation potential of a plant without the risk of exceeding critical values for pH or pCO2. This should provide the industry with the confidence to adopt this emerging biotechnology, which could significantly increase the efficiency of utilisation of carbon from organic substrates. The research thus further strengthens the case for promoting in situ CO2 biomethanisation as a means of maximising the value of existing infrastructure and resources in the waste and agri-food sectors.

Supplementary Materials

The following supporting information can be downloaded at: https://www.mdpi.com/article/10.3390/pr11010113/s1. [64,65].

Author Contributions

Development of equations, Y.Z.; Conceptualisation of study, C.J.B., Y.Z. and S.H.; literature review and data analysis, S.H. and Y.Z.; supervision of experimental work, C.J.B., S.H. and Y.Z.; analysis of experimental data: Y.Z. and S.H.; writing—original draft preparation, S.H.; writing—review and editing, Y.Z. and C.J.B.; funding acquisition, C.J.B., S.H. and Y.Z. All authors have read and agreed to the published version of the manuscript.

Funding

This research was supported by the IBCat H2AD project (EP/M028208/1) funded by the Engineering and Physical Sciences Research Council (EPSRC). The APC were funded by MDPI Topic Anaerobic Digestion Processes.

Data Availability Statement

The experimental data in this study are openly available in https://doi.org/10.5258/SOTON/D2488. For other data requests please contact the corresponding authors.

Acknowledgments

The authors would like to thank the following for the provision of additional numerical datasets: Ilaria Bassani, Istituto Italiano di Tecnologia, Genova, Italy; Giovanna Lovato, Instituto Mauá di Tecnologia, São Caetano do Sul, Brazil; Gang Luo, Department of Environmental Science and Engineering, Fudan University, Shanghai, China; Bing Tao, formerly of the University of Southampton, Southampton, UK; Xianpu Zhu, Shanghai Jiao Tong University, Shanghai, China. The authors also gratefully acknowledge the help and support of the Specialist Technical Staff of the Environmental Laboratories at the University of Southampton, UK.

Conflicts of Interest

The authors declare no conflict of interest. The funders had no role in the design of the study, namely in the collection, analyses, or interpretation of data; in the writing of the manuscript; or in the decision to publish the results.

Appendix A

Figure A1, Figure A2, Figure A3, Figure A4, Figure A5, Figure A6 and Figure A7 show results for the application of Equation A and where possible Equation B to datasets associated with [6,17,32,39,40,50,51,52,53], and with the experimental work in the current trial. Numerical datasets associated with the published literaturewere kindly provided by the authors in each case. Note that graphs do not include baseline values used for deriving coefficients a and b.
Figure A1. (a) Measured pCO2 and measured and predicted pH values and (b) predicted pH values from Equations A and B for mesophilic CO2 biomethanisation of industrial food waste for points with measured VFA and measured or interpolated TAN associated with Tao et al. [6]. See Figure 1c,d in the main text for results from Equation A for the full dataset, and Table S5 for operating conditions and average results for each phase.
Processes 11 00113 g0a1
Figure A2. Experimental pCO2 and pH values and predicted pH from Equation A for 2-stage mesophilic (a,b) and thermophilic (c,d) CO2 biomethanisation of cattle manure associated with Bassani et al. [32]. See Table S15 for operating conditions and average results for each phase.
Processes 11 00113 g0a2
Figure A3. Experimental pCO2 and pH values and predicted pH from Equation A for thermophilic UASB fed on potato starch wastewater with (a,b) and without (c,d) H2 addition associated with Bassani et al. [53]. See Table S18 for operating conditions and average results for each phase.
Processes 11 00113 g0a3
Figure A4. (a) Measured pCO2 and measured and predicted pH values and (b) predicted pH values from Equations A and B for thermophilic CO2 biomethanisation of cattle manure and whey using modelled TAN values associated with Lovato et al. [39]. See Table S7 for operating conditions and average results for each phase.
Processes 11 00113 g0a4
Figure A5. Experimental pCO2 and pH values and predicted pH from Equations A and B for thermophilic CO2 biomethanisation of cattle manure and whey with (a,b) and without (c,d) H2 addition associated with Luo and Angelidaki [17]. See Table S3 for operating conditions and average results for each phase.
Processes 11 00113 g0a5aProcesses 11 00113 g0a5b
Figure A6. Experimental pCO2 and pH values and predicted pH from Equation A for mesophilic (a,b) and thermophilic (c,d) CO2 biomethanisation of pig manure associated with Zhu et al. [50, 51, 52]. See Table S4 for operating conditions and average results for each phase.
Processes 11 00113 g0a6
Figure A7. Experimental pCO2 and pH values and predicted pH from Equations A and B in digesters D1 (a,b), D3 (c,d), D5 (e,f), and D7 (g,h) during mesophilic anaerobic digestion of sewage sludge at varying H2 addition rates. For even-number digesters, see Figure 5 in the main text.
Processes 11 00113 g0a7aProcesses 11 00113 g0a7b

References

  1. Zeikus, J. The biology of methanogenic bacteria. Bacteriol. Rev. 1977, 41, 514–541. [Google Scholar] [CrossRef] [PubMed]
  2. Luo, G.; Angelidaki, I. Integrated biogas upgrading and hydrogen utilization in an anaerobic reactor containing enriched hydrogenotrophic methanogenic culture. Biotechnol. Bioeng. 2012, 109, 2729–2736. [Google Scholar] [CrossRef] [PubMed]
  3. Rafrafi, Y.; Laguillaumie, L.; Dumas, C. Biological Methanation of H2 and CO2 with Mixed Cultures: Current Advances, Hurdles and Challenges. Waste Biomass Valorization 2020, 12, 5259–5282. [Google Scholar] [CrossRef]
  4. Zavarkó, M.; Imre, A.R.; Pörzse, G.; Csedő, Z. Past, Present and Near Future: An Overview of Closed, Running and Planned Biomethanation Facilities in Europe. Energies 2021, 14, 5591. [Google Scholar] [CrossRef]
  5. Aryal, N.; Kvist, T.; Ammam, F.; Pant, D.; Ottosen, L.D. An overview of microbial biogas enrichment. Bioresour. Technol. 2018, 264, 359–369. [Google Scholar] [CrossRef]
  6. Tao, B.; Zhang, Y.; Heaven, S.; Banks, C.J. Predicting pH rise as a control measure for integration of CO2 biomethanisation with anaerobic digestion. Appl. Energy 2020, 277, 115535. [Google Scholar] [CrossRef]
  7. Andreides, D.; Stransky, D.; Bartackova, J.; Pokorna, D.; Zabranska, J. Syngas biomethanation in countercurrent flow trickle-bed reactor operated under different temperature conditions. Renew. Energy 2022, 199, 1329–1335. [Google Scholar] [CrossRef]
  8. Ghofrani-Isfahani, P.; Tsapekos, P.; Peprah, M.; Kougias, P.; Zervas, A.; Zhu, X.; Yang, Z.; Jacobsen, C.S.; Angelidaki, I. Ex-Situ biogas upgrading in thermophilic trickle bed reactors packed with micro-porous packing materials. Chemosphere 2022, 296, 133987. [Google Scholar] [CrossRef]
  9. Paniagua, S.; Lebrero, R.; Muñoz, R. Syngas biomethanation: Current state and future perspectives. Bioresour. Technol. 2022, 358, 127436. [Google Scholar] [CrossRef]
  10. Dong, D.; Choi, O.K.; Lee, J.W. Influence of the continuous addition of zero valent iron (ZVI) and nano-scaled zero valent iron (nZVI) on the anaerobic biomethanation of carbon dioxide. Chem. Eng. J. 2022, 430, 132233. [Google Scholar] [CrossRef]
  11. Geppert, F.; Liu, D.; van Eerten-Jansen, M.; Weidner, E.; Buisman, C.; Ter Heijne, A. Bioelectrochemical power-to-gas: State of the art and future perspectives. Trends Biotechnol. 2016, 34, 879–894. [Google Scholar] [CrossRef]
  12. Bywater, A.; Heaven, S.; Zhang, Y.; Banks, C.J. Potential for Biomethanisation of CO2 from Anaerobic Digestion of Organic Wastes in the United Kingdom. Processes 2022, 10, 1202. [Google Scholar] [CrossRef]
  13. D’Silva, T.C.; Isha, A.; Chandra, R.; Vijay, V.K.; Subbarao, P.M.V.; Kumar, R.; Chaudhary, V.P.; Singh, H.; Khan, A.A.; Tyagi, V.K. Enhancing methane productionh in anaerobic digestion through hydrogen assisted pathways—A state-of-the-art review. Renew. Sustain. Energy Rev. 2021, 151, 111536. [Google Scholar] [CrossRef]
  14. Lai, C.S.; McCulloch, M.D. Sizing of stand-alone solar PV and storage system with anaerobic digestion biogas power plants. IEEE Trans. Ind. Electron. 2016, 64, 2112–2121. [Google Scholar] [CrossRef]
  15. Wang, P.; Wang, J.; Jin, R.; Li, G.; Zhou, M.; Xia, Q. Integrating biogas in regional energy systems to achieve near-zero carbon emissions. Appl. Energy 2022, 322, 119515. [Google Scholar] [CrossRef]
  16. Angelidaki, I.; Treu, L.; Tsapekos, P.; Luo, G.; Campanaro, S.; Wenzel, H.; Kougias, P.G. Biogas upgrading and utilization: Current status and perspectives. Biotechnol. Adv. 2018, 36, 452–466. [Google Scholar] [CrossRef] [Green Version]
  17. Luo, G.; Angelidaki, I. Co-digestion of manure and whey for in situ biogas upgrading by the addition of H2: Process performance and microbial insights. Appl. Microbiol. Biotechnol. 2013, 97, 1373–1381. [Google Scholar] [CrossRef]
  18. Luo, G.; Johansson, S.; Boe, K.; Xie, L.; Zhou, Q.; Angelidaki, I. Simultaneous hydrogen utilization and in situ biogas upgrading in an anaerobic reactor. Biotechnol. Bioeng. 2012, 109, 1088–1094. [Google Scholar] [CrossRef]
  19. Drosg, B. Process Monitoring in Biogas Plants; IEA Bioenergy: Paris, France, 2013. [Google Scholar]
  20. Gaida, D.; Wolf, C.; Bongards, M. Feed control of anaerobic digestion processes for renewable energy production: A review. Renew. Sustain. Energy Rev. 2017, 68, 869–875. [Google Scholar] [CrossRef]
  21. Nguyen, D.; Gadhamshetty, V.; Nitayavardhana, S.; Khanal, S.K. Automatic process control in anaerobic digestion technology: A critical review. Bioresour. Technol. 2015, 193, 513–522. [Google Scholar] [CrossRef]
  22. Wade, M.J. Not just numbers: Mathematical modelling and its contribution to anaerobic digestion processes. Processes 2020, 8, 888. [Google Scholar] [CrossRef]
  23. Tao, B.; Alessi, A.M.; Zhang, Y.; Chong, J.P.; Heaven, S.; Banks, C.J. Simultaneous biomethanisation of endogenous and imported CO2 in organically loaded anaerobic digesters. Appl. Energy 2019, 247, 670–681. [Google Scholar] [CrossRef]
  24. APHA. Standard Methods for the Examination of Water and Wastewater; American Public Health Association: Washington, DC, USA, 2005. [Google Scholar]
  25. Ripley, L.E.; Boyle, W.C.; Converse, J.C. Improved alkalimetric monitoring for anaerobic digestion of high-strength wastes. J. (Water Pollut. Control Fed.) 1986, 58, 406–411. [Google Scholar]
  26. Walker, M.; Zhang, Y.; Heaven, S.; Banks, C. Potential errors in the quantitative evaluation of biogas production in anaerobic digestion processes. Bioresour. Technol. 2009, 100, 6339–6346. [Google Scholar] [CrossRef] [PubMed] [Green Version]
  27. Wu, D.; Li, L.; Zhao, X.; Peng, Y.; Yang, P.; Peng, X. Anaerobic digestion: A review on process monitoring. Renew. Sustain. Energy Rev. 2019, 103, 1–12. [Google Scholar] [CrossRef]
  28. Agneessens, L.M.; Ottosen, L.D.M.; Andersen, M.; Olesen, C.B.; Feilberg, A.; Kofoed, M.V.W. Parameters affecting acetate concentrations during in-situ biological hydrogen methanation. Bioresour. Technol. 2018, 258, 33–40. [Google Scholar] [CrossRef] [PubMed]
  29. Agneessens, L.M.; Ottosen, L.D.M.; Voigt, N.V.; Nielsen, J.L.; de Jonge, N.; Fischer, C.H.; Kofoed, M.V.W. In-situ biogas upgrading with pulse H2 additions: The relevance of methanogen adaption and inorganic carbon level. Bioresour. Technol. 2017, 233, 256–263. [Google Scholar] [CrossRef] [PubMed]
  30. Alfaro, N.; Fdz-Polanco, M.; Fdz-Polanco, F.; Díaz, I. H2 addition through a submerged membrane for in-situ biogas upgrading in the anaerobic digestion of sewage sludge. Bioresour. Technol. 2019, 280, 1–8. [Google Scholar] [CrossRef]
  31. Andreides, D.; Pokorna, D.; Zabranska, J. Assessing the syngas biomethanation in anaerobic sludge digestion under different syngas loading rates and homogenisation. Fuel 2022, 320, 123929. [Google Scholar] [CrossRef]
  32. Bassani, I.; Kougias, P.G.; Treu, L.; Angelidaki, I. Biogas upgrading via hydrogenotrophic methanogenesis in two-stage continuous stirred tank reactors at mesophilic and thermophilic conditions. Environ. Sci. Technol. 2015, 49, 12585–12593. [Google Scholar] [CrossRef]
  33. Corbellini, V.; Catenacci, A.; Malpei, F. Hydrogenotrophic biogas upgrading integrated into WWTPs: Enrichment strategy. Water Sci. Technol. 2019, 79, 759–770. [Google Scholar] [CrossRef] [PubMed]
  34. Corbellini, V.; Feng, C.; Bellucci, M.; Catenacci, A.; Stella, T.; Espinoza-Tofalos, A.; Malpei, F. Performance Analysis and Microbial Community Evolution of In Situ Biological Biogas Upgrading with Increasing H2/CO2 Ratio. Archaea 2021, 2021, 8894455. [Google Scholar] [CrossRef] [PubMed]
  35. Díaz, I.; Fdz-Polanco, F.; Mutsvene, B.; Fdz-Polanco, M. Effect of operating pressure on direct biomethane production from carbon dioxide and exogenous hydrogen in the anaerobic digestion of sewage sludge. Appl. Energy 2020, 280, 115915. [Google Scholar] [CrossRef]
  36. Khan, A.; Akbar, S.; Okonkwo, V.; Smith, C.; Khan, S.; Shah, A.A.; Adnan, F.; Ijaz, U.Z.; Ahmed, S.; Badshah, M. Enrichment of the hydrogenotrophic methanogens for, in-situ biogas up-gradation by recirculation of gases and supply of hydrogen in methanogenic reactor. Bioresour. Technol. 2022, 345, 126219. [Google Scholar] [CrossRef]
  37. Kim, S.; Mostafa, A.; Im, S.; Lee, M.-K.; Kang, S.; Na, J.-G.; Kim, D.-H. Production of high-calorific biogas from food waste by integrating two approaches: Autogenerative high-pressure and hydrogen injection. Water Res. 2021, 194, 116920. [Google Scholar] [CrossRef]
  38. Lebranchu, A.; Blanchard, F.; Fick, M.; Pacaud, S.; Olmos, E.; Delaunay, S. Pilot-scale biomethanation of cattle manure using dense membranes. Bioresour. Technol. 2019, 284, 430–436. [Google Scholar] [CrossRef]
  39. Lovato, G.; Alvarado-Morales, M.; Kovalovszki, A.; Peprah, M.; Kougias, P.G.; Rodrigues, J.A.D.; Angelidaki, I. In-situ biogas upgrading process: Modeling and simulations aspects. Bioresour. Technol. 2017, 245, 332–341. [Google Scholar] [CrossRef] [Green Version]
  40. Luo, G.; Angelidaki, I. Hollow fiber membrane based H2 diffusion for efficient in situ biogas upgrading in an anaerobic reactor. Appl. Microbiol. Biotechnol. 2013, 97, 3739–3744. [Google Scholar] [CrossRef]
  41. Luo, G.; Wang, W.; Angelidaki, I. Anaerobic digestion for simultaneous sewage sludge treatment and CO biomethanation: Process performance and microbial ecology. Environ. Sci. Technol. 2013, 47, 10685–10693. [Google Scholar] [CrossRef]
  42. Treu, L.; Kougias, P.; de Diego-Díaz, B.; Campanaro, S.; Bassani, I.; Fernández-Rodríguez, J.; Angelidaki, I. Two-year microbial adaptation during hydrogen-mediated biogas upgrading process in a serial reactor configuration. Bioresour. Technol. 2018, 264, 140–147. [Google Scholar] [CrossRef]
  43. Treu, L.; Tsapekos, P.; Peprah, M.; Campanaro, S.; Giacomini, A.; Corich, V.; Kougias, P.G.; Angelidaki, I. Microbial profiling during anaerobic digestion of cheese whey in reactors operated at different conditions. Bioresour. Technol. 2019, 275, 375–385. [Google Scholar] [CrossRef] [PubMed]
  44. Voelklein, M.; Rusmanis, D.; Murphy, J. Biological methanation: Strategies for in-situ and ex-situ upgrading in anaerobic digestion. Appl. Energy 2019, 235, 1061–1071. [Google Scholar] [CrossRef]
  45. Wahid, R.; Horn, S.J. Impact of operational conditions on methane yield and microbial community composition during biological methanation in in situ and hybrid reactor systems. Biotechnol. Biofuels 2021, 14, 1–15. [Google Scholar] [CrossRef] [PubMed]
  46. Wahid, R.; Horn, S.J. The effect of mixing rate and gas recirculation on biological CO2 methanation in two-stage CSTR systems. Biomass Bioenergy 2021, 144, 105918. [Google Scholar] [CrossRef]
  47. Wahid, R.; Mulat, D.G.; Gaby, J.C.; Horn, S.J. Effects of H2:CO2 ratio and H2 supply fluctuation on methane content and microbial community composition during in-situ biological biogas upgrading. Biotechnol. Biofuels 2019, 12, 1–15. [Google Scholar] [CrossRef] [Green Version]
  48. Wang, W.; Xie, L.; Luo, G.; Zhou, Q.; Angelidaki, I. Performance and microbial community analysis of the anaerobic reactor with coke oven gas biomethanation and in situ biogas upgrading. Bioresour. Technol. 2013, 146, 234–239. [Google Scholar] [CrossRef] [Green Version]
  49. Yang, Z.; Liu, Y.; Zhang, J.; Mao, K.; Kurbonova, M.; Liu, G.; Zhang, R.; Wang, W. Improvement of biofuel recovery from food waste by integration of anaerobic digestion, digestate pyrolysis and syngas biomethanation under mesophilic and thermophilic conditions. J. Clean. Prod. 2020, 256, 120594. [Google Scholar] [CrossRef]
  50. Zhu, X.; Cao, Q.; Chen, Y.; Sun, X.; Liu, X.; Li, D. Effects of mixing and sodium formate on thermophilic in-situ biogas upgrading by H2 addition. J. Clean. Prod. 2019, 216, 373–381. [Google Scholar] [CrossRef]
  51. Zhu, X.; Chen, L.; Chen, Y.; Cao, Q.; Liu, X.; Li, D. Differences of methanogenesis between mesophilic and thermophilic in situ biogas-upgrading systems by hydrogen addition. J. Ind. Microbiol. Biotechnol. 2019, 46, 1569–1581. [Google Scholar] [CrossRef]
  52. Zhu, X.; Chen, L.; Chen, Y.; Cao, Q.; Liu, X.; Li, D. Effect of H2 addition on the microbial community structure of a mesophilic anaerobic digestion system. Energy 2020, 198, 117368. [Google Scholar] [CrossRef]
  53. Bassani, I.; Kougias, P.G.; Angelidaki, I. In-situ biogas upgrading in thermophilic granular UASB reactor: Key factors affecting the hydrogen mass transfer rate. Bioresour. Technol. 2016, 221, 485–491. [Google Scholar] [CrossRef] [PubMed]
  54. Jing, Y.; Campanaro, S.; Kougias, P.; Treu, L.; Angelidaki, I.; Zhang, S.; Luo, G. Anaerobic granular sludge for simultaneous biomethanation of synthetic wastewater and CO with focus on the identification of CO-converting microorganisms. Water Res. 2017, 126, 19–28. [Google Scholar] [CrossRef] [PubMed]
  55. Deschamps, L.; Imatoukene, N.; Lemaire, J.; Mounkaila, M.; Filali, R.; Lopez, M.; Theoleyre, M.-A. In-situ biogas upgrading by bio-methanation with an innovative membrane bioreactor combining sludge filtration and H2 injection. Bioresour. Technol. 2021, 337, 125444. [Google Scholar] [CrossRef]
  56. Hafuka, A.; Fujino, S.; Kimura, K.; Oshita, K.; Konakahara, N.; Takahashi, S. In-situ biogas upgrading with H2 addition in an anaerobic membrane bioreactor (AnMBR) digesting waste activated sludge. Sci. Total Environ. 2022, 828, 154573. [Google Scholar] [CrossRef] [PubMed]
  57. Illi, L.; Lecker, B.; Lemmer, A.; Müller, J.; Oechsner, H. Biological methanation of injected hydrogen in a two-stage anaerobic digestion process. Bioresour. Technol. 2021, 333, 125126. [Google Scholar] [CrossRef]
  58. Thapa, A.; Park, J.-G.; Yang, H.-M.; Jun, H.-B. In-situ biogas upgrading in an anaerobic trickling filter bed reactor treating a thermal post-treated digestate. J. Environ. Chem. Eng. 2021, 9, 106780. [Google Scholar] [CrossRef]
  59. Corbellini, V.; Kougias, P.G.; Treu, L.; Bassani, I.; Malpei, F.; Angelidaki, I. Hybrid biogas upgrading in a two-stage thermophilic reactor. Energy Convers. Manag. 2018, 168, 1–10. [Google Scholar] [CrossRef]
  60. Andreides, D.; Quispe, J.I.B.; Bartackova, J.; Pokorna, D.; Zabranska, J. A novel two-stage process for biological conversion of syngas to biomethane. Bioresour. Technol. 2021, 327, 124811. [Google Scholar] [CrossRef]
  61. Scholten, J.C.; Conrad, R. Energetics of syntrophic propionate oxidation in defined batch and chemostat cocultures. Appl. Environ. Microbiol. 2000, 66, 2934–2942. [Google Scholar] [CrossRef] [Green Version]
  62. Fontana, A.; Kougias, P.G.; Treu, L.; Kovalovszki, A.; Valle, G.; Cappa, F.; Morelli, L.; Angelidaki, I.; Campanaro, S. Microbial activity response to hydrogen injection in thermophilic anaerobic digesters revealed by genome-centric metatranscriptomics. Microbiome 2018, 6, 194. [Google Scholar] [CrossRef]
  63. Batstone, D.J.; Keller, J.; Angelidaki, I.; Kalyuzhnyi, S.; Pavlostathis, S.; Rozzi, A.; Sanders, W.; Siegrist, H.; Vavilin, V. The IWA anaerobic digestion model no 1 (ADM1). Water Sci. Technol. 2002, 45, 65–73. [Google Scholar] [CrossRef] [PubMed]
  64. Heaven, S.; Zhang, Y.; Bywater, A.; Banks, C. Dataset for ‘Potential for Biomethanisation of CO2 from Anaerobic Digestion of Organic Wastes in the UK’. 2022. Available online: https://eprints.soton.ac.uk/467644/1/processes_10_01202_1_.pdf (accessed on 6 June 2022).
  65. Palù, M.; Peprah, M.; Tsapekos, P.; Kougias, P.; Campanaro, S.; Angelidaki, I.; Treu, L. In-situ biogas upgrading assisted by bioaugmentation with hydrogenotrophic methanogens during mesophilic and thermophilic co-digestion. Bioresour. Technol. 2022, 348, 126754. [Google Scholar] [CrossRef] [PubMed]
Figure 1. Experimental pCO2 and pH values and predicted pH from Equation A for mesophilic CO2 biomethanisation of sewage sludge (a,b) as reported in [6]; mesophilic CO2 biomethanisation of industrial food waste (c,d) as reported in [6]; and thermophilic CO2 biomethanisation of cattle manure (e,f) as reported in [40]. Numerical datasets were kindly provided by the authors in each case.
Processes 11 00113 g001
Figure 2. Experimental pCO2 and pH values and predicted pH from Equations A and B for mesophilic CO2 biomethanisation of phosphate-containing synthetic feed at OLR 3 g COD L−1 day−1 (a,b) as reported in [23], and for TAN concentration 3 g N L−1 (c,d) as reported in [6]. Numerical data was kindly provided by the authors.
Processes 11 00113 g002
Figure 3. Values for (a) biogas CO2 content, (b) pH, (c) total VFA, and (d) SMP in digesters D1−8 during the whole experimental period. Vertical dotted lines indicate the start of H2 addition on day 55 and the re-establishment of full OLR in all digesters on day 87.
Processes 11 00113 g003
Figure 4. (ah) VFA profiles between day 55−100 in digesters D1−8. All digesters initially received H2 from day 55: vertical dotted lines indicate the start and end of subsequent periods of H2 addition in each digester. Note the difference in y-axis scales for D1−4 and D5−8.
Processes 11 00113 g004aProcesses 11 00113 g004b
Figure 5. Experimental pCO2 and pH values and predicted pH from Equations A and B in digesters D2 (a,b), D4 (c,d), D6 (e,f), and D8 (g,h) during mesophilic anaerobic digestion of sewage sludge at varying H2 addition rates.
Processes 11 00113 g005
Table 1. Performance of Equation A for reported average values from Luo and Angelidaki [40].
(i)(ii)(iii)(iv)(v)(vi)RMSDR2
No H2With H2No H2With H2No H2With H2
Temp°C555555555555--
OLRg VS L−1 day−11.671.671.671.671.671.67--
HRTdays151515151515--
H2 inputL L−1 day−100.9301.4401.76--
SMPtotL CH4 g−1 VS0.2750.4070.2710.4780.2870.515--
CH4%54.278.453.190.255.496.1--
TANMn/rn/rn/rn/rn/rn/r--
VFAM0.0020.0040.0020.0120.0020.038--
pH-7.297.617.287.97.38.31--
pCO2-0.4580.2160.4690.0980.4460.039--
a × 108 10.419.8110.429.8110.436.99--
Difference between experimental and predicted pH based on Equation A with coefficient a(x)
a(i)--0.020.000.020.000.120.060.997
a(ii)-0.02-0.020.000.020.100.050.997
a(iii)-0.000.02-0.020.000.120.060.997
a(iv)-0.020.000.02-0.020.100.051.000
a(v)-0.000.020.000.02-0.120.060.997
a(vi)-0.160.130.160.120.16-0.151.000
n/r = not reported. Lower part of Table shows heat map with white = good, grey = reasonable, black = poor agreement.
Table 2. Performance of Equations A and B for reported average values from Wahid and Horn [46].
(i)(ii)(iii)(iv)(v)(vi)(vii)RMSDR2
Phase 123a3b3c3d3e
H2/CO2 0244444
MixingRpm808080120140170200--
Temp°C55555555555555--
OLRg VS L−1 day−13.092.692.302.362.192.372.32--
HRTDays20202020202020--
H2 inputL L−1 day−10.00.81.61.71.71.71.7--
SMP totalL CH4 g−1 VS0.2170.2460.3050.3310.4110.3210.315--
CH4%62.237.831.638.340.341.940.2--
TANM0.100.110.130.150.140.140.14--
VFAM0.0050.0060.0080.0110.0120.0160.015--
pH-7.868.078.258.378.418.438.41--
pCO2-0.3780.2070.1370.1240.1190.1160.120--
a × 108-2.852.822.431.811.631.561.62--
b × 108-0.2550.2770.2780.2330.1930.1620.171--
Difference between experimental and predicted pH based on Equation A with coefficient a(x)
a(i)--0.000.050.140.170.180.170.140.949
a(ii)-0.00-0.050.130.160.180.160.130.966
a(iii)-0.060.05-0.090.120.130.120.100.978
a(iv)-0.160.140.09-0.030.040.030.100.955
a(v)-0.190.170.120.03-0.010.000.120.956
a(vi)-0.210.190.130.040.01-0.010.130.958
a(vii)-0.190.180.120.030.000.01-0.120.957
Difference between experimental and predicted pH based on Equation B with coefficient b(x)
b(i)--0.030.030.030.080.120.110.080.853
b(ii)-0.03-0.000.050.100.150.130.090.940
b(iii)-0.030.00-0.050.100.150.130.090.963
b(iv)-0.030.060.05-0.050.100.080.070.941
b(v)-0.100.110.110.05-0.050.030.080.929
b(vi)-0.160.170.160.100.05-0.010.120.947
b(vii)-0.140.150.140.090.030.01-0.110.942
n/r = not reported. Lower part of Table shows heat map with white = good, grey = reasonable, black = poor agreement.
Table 3. Performance of Equations A and B and phosphate adjustment for data from Tao et al. [23].
OLR 3 (i)(ii)(iii)(iv)(v)(vi)RMSDR2
Phase 1 2 3
No H2No H2With H2With H2H2 + CO2H2 + CO2
Temp°C373737373737--
OLRg VS L−1 day−1333333--
HRTdays151515151515--
H2 inputL L−1 day−10.00.02.92.92.97.4--
SMPtotL CH4 g−1 VS0.2870.2890.4960.4900.4520.804--
CH4%50.050.193.790.975.076.6--
TANM0.0750.0740.0450.0450.0490.044--
VFAM0.0000.0000.0010.0020.0070.006--
pH-7.347.358.007.937.827.81--
pCO2-0.4740.4730.0400.0460.0710.077--
a × 108-9.299.2322.0823.0319.4518.67--
b × 108-0.690.680.971.000.810.70--
Temp°C373737373737--
Difference between experimental and predicted pH based on Eqn A with coefficient a(x)
a(i)--0.000.320.350.290.270.280.995
a(ii)-0.00-0.330.350.290.280.280.996
a(iii)-0.370.37-0.020.050.070.241.000
a(iv)-0.390.390.02-0.070.090.250.998
a(iv)-0.310.320.050.07-0.020.200.998
a(vi)-0.300.300.060.080.02-0.190.998
Difference between experimental and predicted pH based on Equation B with coefficient b(x)
b(i)--0.010.130.140.060.000.090.980
b(ii)-0.01-0.140.150.070.010.100.979
b(iii)-0.140.15-0.010.070.130.110.983
b(iv)-0.160.170.01-0.090.150.130.990
b(iv)-0.060.070.070.08-0.060.070.987
b(vi)-0.000.010.130.140.06-0.090.997
Difference between experimental and predicted pH for Equation A with a(x) and phosphate adjustment
Period (i)--0.010.050.070.060.010.050.993
Period (ii)-0.01-0.060.080.070.010.060.993
Period (iii)-0.060.07-0.010.000.050.050.995
Period (iv)-0.090.100.03-0.020.070.070.996
Period (iv)-0.070.080.010.01-0.060.060.997
Period (vi)-0.010.020.040.060.05-0.040.999
n/r = not reported. Lower parts of Table show heat map with white = good, grey = reasonable, and black = poor agreement.
Table 4. Average values of monitoring parameters in D1-8 from different periods of stable operation during the experimental period.
(i)(ii)(iii)(iv)
Before H2 AdditionBaseline Period 1Baseline Period 2After
Recovery
Day 0–54Day 0–24Day 25–54Day 110–125
pH-7.50 ± 0.047.48 ± 0.047.50 ± 0.047.46 ± 0.04
TANM0.131 ± 0.0050.128 ± 0.0040.134 ± 0.0030.133 ± 0.004
Total VFAM0.008 ± 0.0050.006 ± 0.0050.010 ± 0.0040.006 ± 0.003
TAg CaCO3 L−19.38 ± 0.329.26 ± 0.349.51 ± 0.229.37 ± 0.28
PAg CaCO3 L−16.33 ± 0.256.20 ± 0.186.46 ± 0.226.40 ± 0.23
IAg CaCO3 L−13.05 ± 0.243.05 ± 0.303.05 ± 0.172.97 ± 0.15
TS%WW3.86 ± 0.113.85 ± 0.113.88 ± 0.123.88 ± 0.07
VS%WW2.59 ± 0.092.59 ± 0.082.58 ± 0.092.60 ± 0.06
SMPL CH4 g−1 VS0.358 ± 0.0170.355 ± 0.0170.360 ± 0.0170.322 ± 0.027
pCH4-0.616 ± 0.0080.617 ± 0.0090.616 ± 0.0080.620 ± 0.009
pCO2-0.365 ± 0.0090.362 ± 0.0100.367 ± 0.0080.369 ± 0.008
Values after ± give standard deviation for data from all eight digesters.
Table 5. Coefficient values and statistical parameters from the application of Equations A and B to data series from day 25–100 of experimental work.
R2 Slope Int’cept RMSE
a × 108b × 108nEquation AEquation BEquation AEquation BEquation AEquation BEquation AEquation B
D18.290.962500.5130.8770.4920.8563.861.090.060.04
D28.851.052510.6630.8590.6631.0832.56−0.640.050.04
D38.701.043510.7740.9370.9151.0000.680.020.080.04
D48.451.023500.7580.9340.8290.9461.340.430.080.04
D58.871.103470.7780.9680.8120.9281.540.520.180.07
D69.181.118500.9170.9620.8950.9720.820.170.080.06
D78.961.134460.9500.9730.9350.9670.540.210.070.06
D88.351.039450.7720.9560.9191.0620.69-0.500.140.07
Note: n = number of datapoints used (i.e., where measured values were available for pCO2, pH, and VFA with TAN interpolated where required). Results from regression analysis were significant in all cases (p < 0.0001).
Disclaimer/Publisher’s Note: The statements, opinions and data contained in all publications are solely those of the individual author(s) and contributor(s) and not of MDPI and/or the editor(s). MDPI and/or the editor(s) disclaim responsibility for any injury to people or property resulting from any ideas, methods, instructions or products referred to in the content.

