Article

Adsorption of Phosphates onto Mg/Al-Oxide/Hydroxide/Sulfate-Impregnated Douglas Fir Biochar

1
Department of Chemistry, Mississippi State University, Starkville, MS 39762, USA
2
Department of Sustainable Bioproducts, Mississippi State University, Starkville, MS 39762, USA
3
School of Environmental Sciences, Jawaharlal Nehru University, New Delhi 110067, India
*
Authors to whom correspondence should be addressed.
Processes 2023, 11(1), 111; https://doi.org/10.3390/pr11010111
Submission received: 27 October 2022 / Revised: 13 December 2022 / Accepted: 29 December 2022 / Published: 31 December 2022
(This article belongs to the Section Environmental and Green Processes)

Abstract

:
Nitrates and phosphates, found in fertilizers, are the most common eutrophication-causing agents. Douglas fir biochar (BC), a syngas byproduct, was treated with different Al/Mg ratios of sulfate (5% w/w metal loading) followed by an NaOH treatment. The greatest phosphate uptake at 25 °C and pH 7 was attributed to the composite with a Mg/Al 2:1 ratio prepared at pH 13 (AMBC). Batch AMBC phosphate uptake was optimized for initial pH, equilibrium time, temperature, and initial phosphate concentration. Phosphate removal following pseudo-2nd-order kinetics and increases gradually before reaching a max at pH 11, with 95% phosphate uptake in 15 mins. The Sips isotherm model provided the best sorption data fit resulting in a 42.1 mg/g capacity at 25 °C and pH 11. Endothermic and spontaneous adsorption were determined using van ’t Hoff’s plots. BET, XRD, XPS, SEM, TEM, and EDS were used to characterize the biochar before and after phosphate sorption. Used AMBC has the potential to be exploited as a phosphate fertilizer as a key part of an environmentally friendly agricultural management plan.

1. Introduction

Phosphate (PO43−) is a plant macronutrient found in detergents, soaps, and soil fertilizers. However, due to excessive amounts, phosphorus pollution is a growing environmental concern [1]. A strong correlation exists between eutrophication and phosphate pollution [2]. Agricultural chemical runoffs containing phophates and nitrates are increasing, bringing surges in eutrophication and water treatment costs [3]. In freshwater systems, phosphorus levels usually range from 0.005 mg/L to 0.5 mg/L [4]. Long-term eutrophication is prevented if phosphorus levels are below 0.5 mg/L [4]. Humans accelerate the rate of cultural eutrophication with fertilizers and detergents.
The effect of cultural eutrophication leads to the increased production of phytoplankton and algal blooms covering the top layer of lakes, reducing sunlight needed to sustain other forms of marine life [5]. Algal bloom species produce toxins that accumulate in shellfish at dangerous levels for humans and animal species [6]. Shellfish (mussels) are responsible for amnestic shellfish poisoning, resulting in memory loss and possibly coma [6]. Clams and other crustaceans can cause diseases such as neurotoxic shellfish poisoning, resulting in muscular paralysis or even death. High rates of photosynthesis cause a decrease in inorganic carbon, which raises the pH of water which impairs the chemosensory skills of the organisms [6]. Oxygen levels decrease because of the further decomposition of matter, creating a hypoxic environment or dead zone. In Europe, the Baltic Sea and the Mediterranean are impacted by treated and untreated phosphorus runoff into the marine waters [7]. In US waters, hypoxic dead zones can be found along the East Coast and span into the Gulf of Mexico resulting from the washing of fertilizers into rivers and streams [8].
There are many methods for removing phosphorus in water, including physical and biological treatment, with mixed success [9,10]. Physical methods are primarily filtration and membrane technology. Membrane bioreactors, tertiary membrane filtration devices, and reverse osmosis methods are used [10]. The biological processes for removing phosphates include an anaerobic tank and an activated sludge tank, where phosphorus-accumulating organisms are removed due to sludge wasting. Current methods of removing phosphorus can be costly and inefficient for eutrophication-affected areas. Adsorptive removal of phosphates has been reported for metal oxides [MgO, Fe2O3, Fe3O4, Al2O3], metal hydroxides [(Fe(OH)3, Fe(OH)2, Mg(OH)2], layered double hydroxides, a class is known as anionic clays [11]. Since the solubility products for their stoichiometric compounds are very low, these materials exhibit a rich chemistry with phosphate [12,13].
Layered double hydroxides can exchange oxyanions with their flexible interlayer region. For example, positively charged brucite stacking sheets are balanced by anions in the interlayer region by hydrogen-bonded water molecules [14,15,16]. Additionally, oxyanions like phosphate can form insoluble surface complexes on their surfaces. All of these may result in substantial phosphate absorption.
However, using these LDH, oxide, or hydroxide materials in a sorption system has limitations, such as particle clustering, poor mechanical strength, and aggregation [17]. Adsorption speed and capacities suffer from the aforementioned technical deficiencies and limit its widespread application. Activated carbon, bentonite, diatomite, resin, sand, tea-waste, and zeolites have been used to stabilize the agglomeration [12]. Correspondingly, biochar has been engaged in developing composites with improved sorption features. Coating biochar with mineral oxides has recently been used to improve phosphate sorption capacity under variable conditions: equilibrium time and concentration, ionic strength, pH, and competing contaminants [18,19].
Biochar is a charcoal-like material saturated in carbon. It has unique properties, such as a high surface area, a stable carbon matrix, and a sizeable porous layer that creates an excellent adsorbent or absorbent. Biochar is typically made by fast/slow pyrolysis of wood biomass, animal debris, and plant wastes. It is formed through a thermochemical conversion of biomass under starved O2 conditions into charcoal-like material [20]. Inexpensive biochar adsorbents are readily available and can be used in large-scale agricultural roles where activated carbons are prohibitively expensive. Agricultural byproducts, energy crops, and waste wood and brush provide a plentiful and renewable source of lignocellulosic feeds for biorefineries that produce biochar as a byproduct [21].
This work optimized phosphate uptake by 28 different commercial Douglas fir biochar (BC)/Al-Mg/oxide/hydroxide/sulfate composites prepared with different ratios of NaOH treated in Mg/Al sulfates. Adsorption benchmarks such as pH effect, equilibrium time, and initial concentration of phosphate concentration were performed. The virgin and phosphate-laden material was extensively characterized by imaging and spectroscopy techniques to unveil the adsorption interactions and mechanism.

2. Materials and Methods

Most of the chemicals and reagents used in this program were analytical-grade and purchased from Sigma-Aldrich, MO (USA). MgSO4·7H2O and Al2(SO4)3·18H2O were used to prepare Mg/Al biochar composites. A 1000 mg/L phosphate solution was prepared by dissolving NaH2PO4.H2O in deionized (DI) water. Douglas fir biochar (BC), provided by Black Owl Biochar Supreme, has a surface area ~700 m2/g, porosity ~0.25 cm3/g, and a contact angle ~122.3 ± 4.2°. Elemental analysis gave C = 81.5%, H = 2.1%, N = 1.2%, O = 13.0%, Fe = 0.07% while ash content = 2.3%. BC was produced from wet gasification of timber industry waste Douglas fir as a byproduct. Three-inch chipped wood (12–15% moisture content) was auger fed into an air-fed updraft gasifier at 800–1000 °C, with a hot zone residence time of 1–10 s. Biochar particles of ∼2 cm were collected, washed thoroughly with water, dried at ambient temperature for 2 days then ground, and sieved to a 0.1–0.3 mm particle.

2.1. Preparation of AMBC

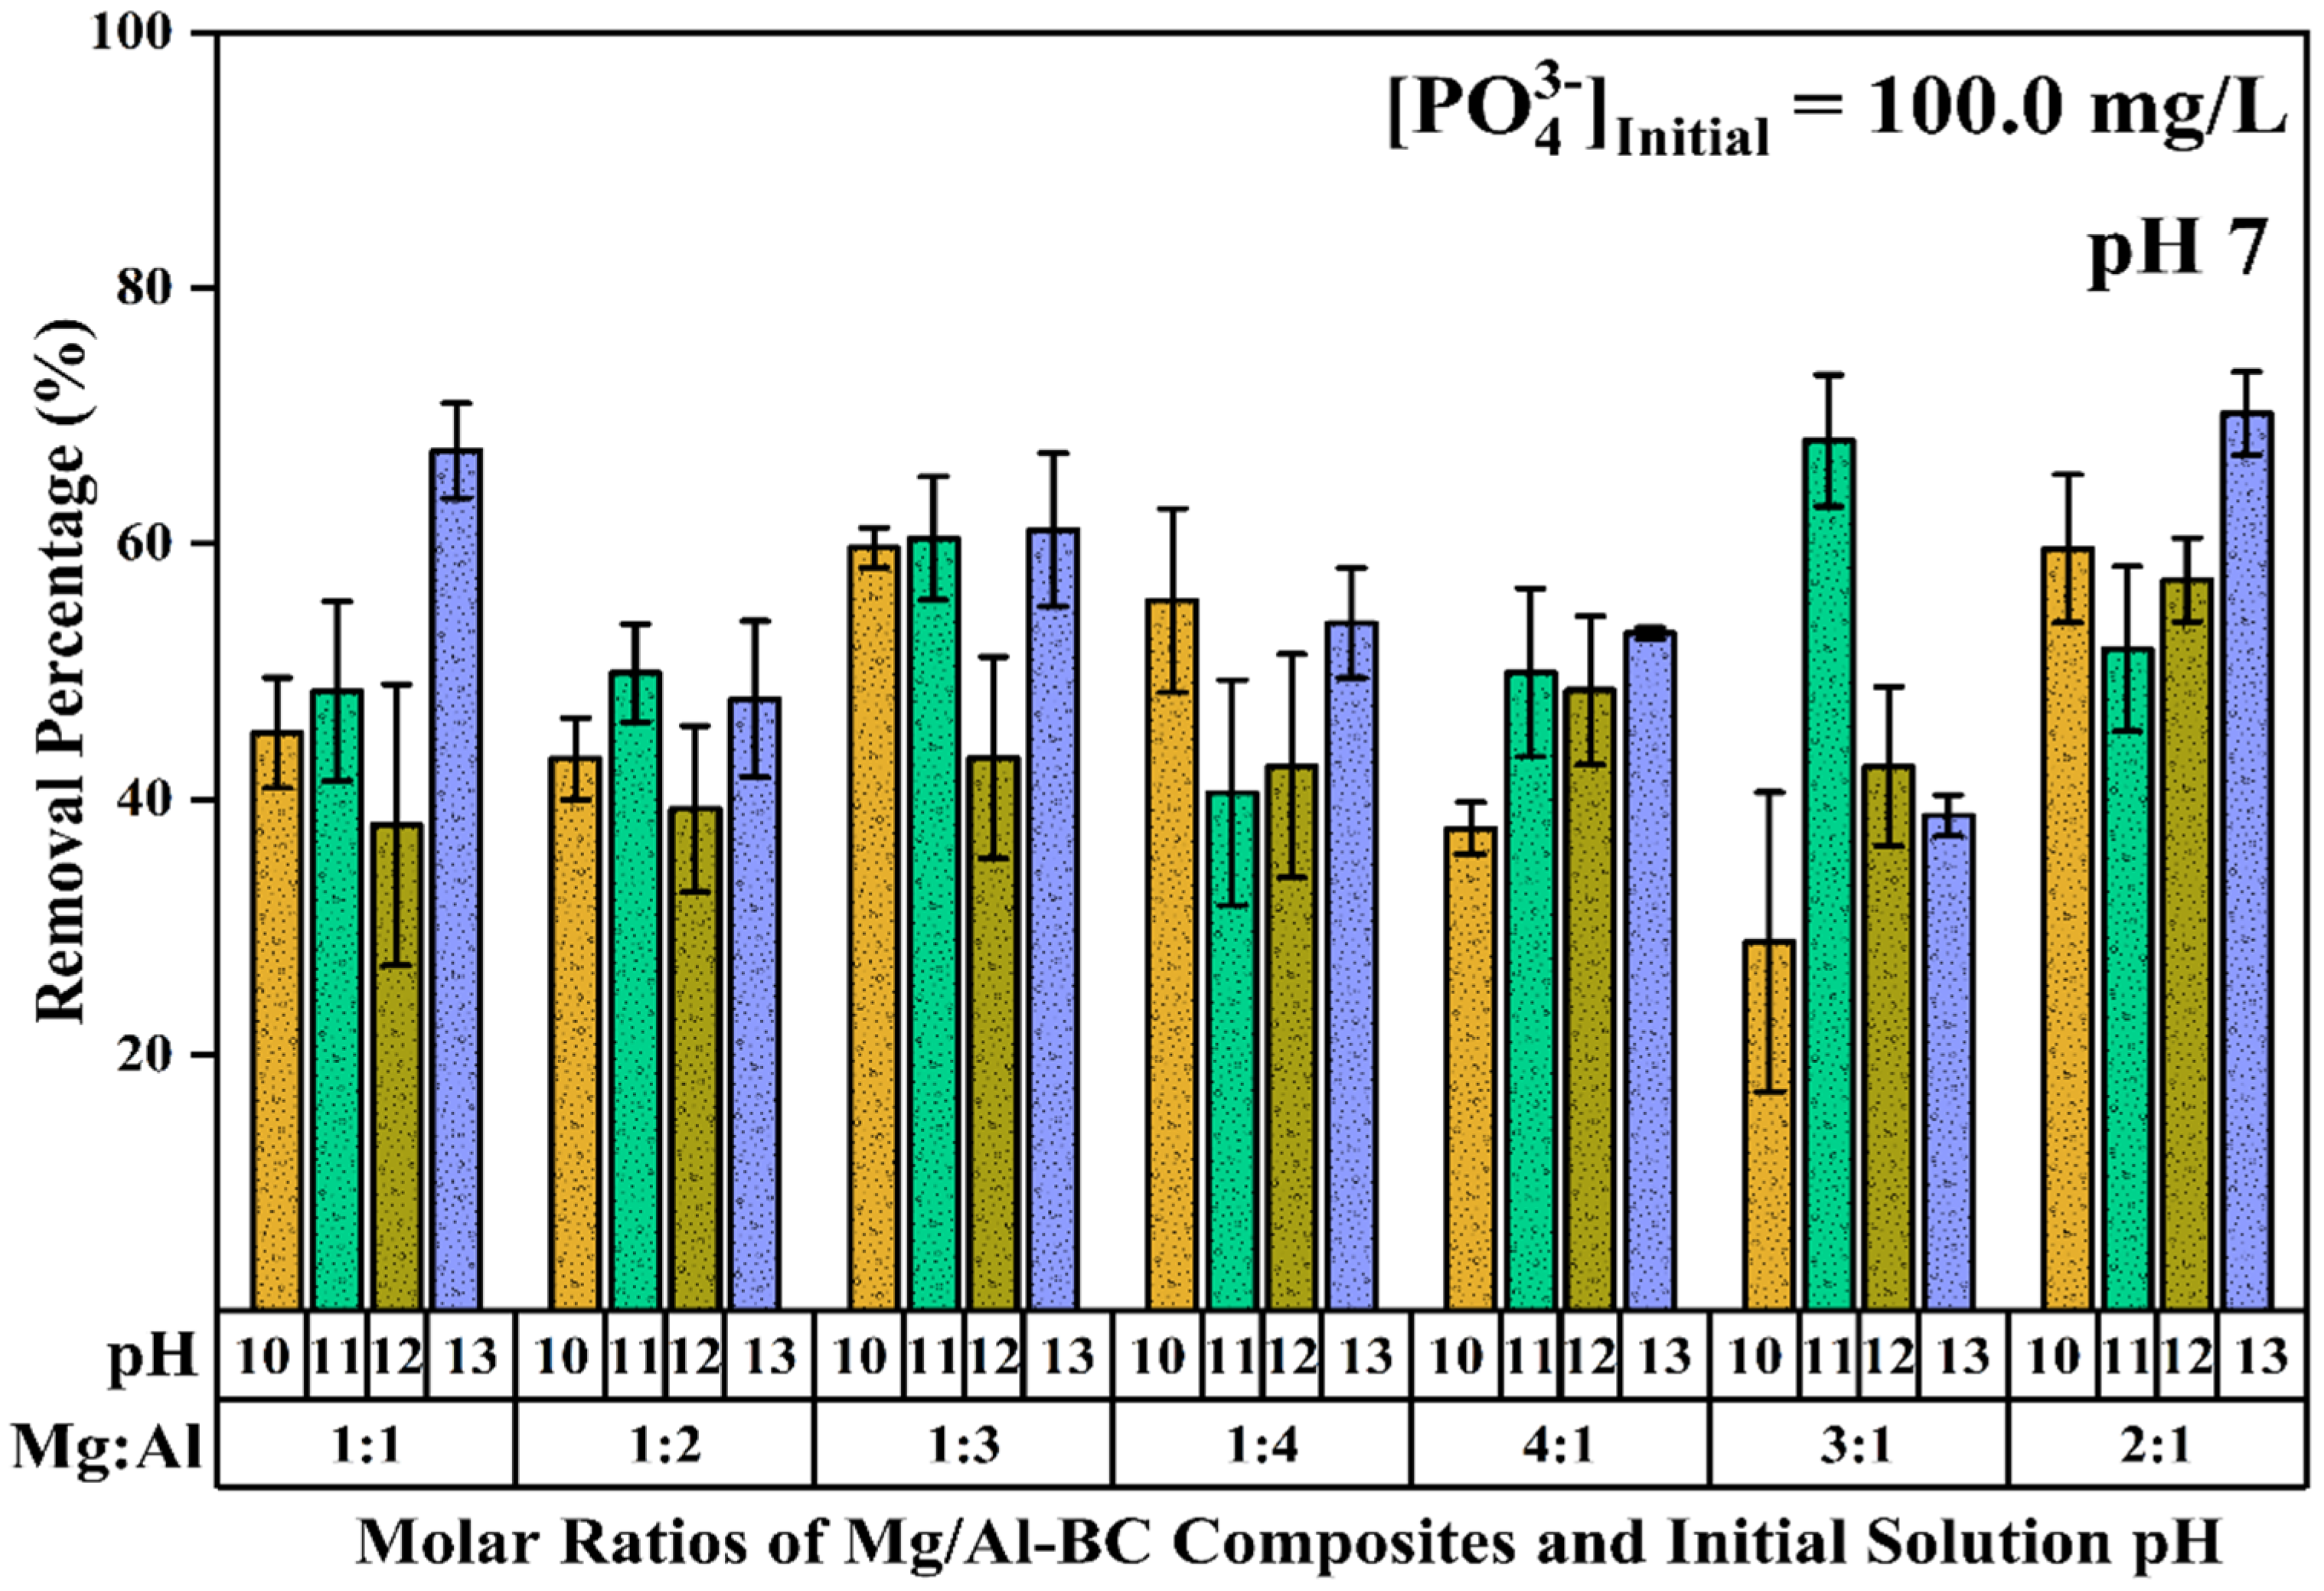
AMBC preparation was carried out using a chemical co-precipitation method described by Li, Ronghua, et al. with slight modifications [18]. First, a 25.0 g portion of raw BC was soaked in Mg/Al-SO4 solutions for 1 h to incorporate Mg/Al salts into the BC. Next, the obtained slurry was treated with 10 M NaOH after drying at room temperature for 6 hours. Well-stirred conditions were maintained at the corresponding pH (10, 11, 12, or 13). The resulting slurry was aged for 24 hours, filtered, thoroughly washed with methanol and de-ionized water, and dried at 70 °C for 12 hours to obtain Mg/Al-SO4/OH-impregnated BC (AMBC) (Figure 1). Finally, the different ratios (at different pH = 10, 11, 12, 13) of Mg/Al-biochar composites prepared were subjected to preliminary phosphate sorption screening tests in triplicate (Figure 2).

2.2. Sorption Kinetics and Isotherms

Preliminary sorption experiments were conducted using 100 mg/L phosphate solution (20 mL). After being shaken in an orbital shaker at 200 rpm for 1 hour (at pH = 7), the vessels were withdrawn and filtered through 0.22 micron filter paper. Next, phosphate concentration in the filtrate was determined using UV-spectrometry at 820 nm wavelength, followed by the ammonium molybdate ascorbic acid method [22]. Finally, the composite with the highest phosphate adsorption was selected for batch adsorption experiments. All the batch sorption experiments were conducted in triplicate, and Grubbs test was used to exclude any outliers.
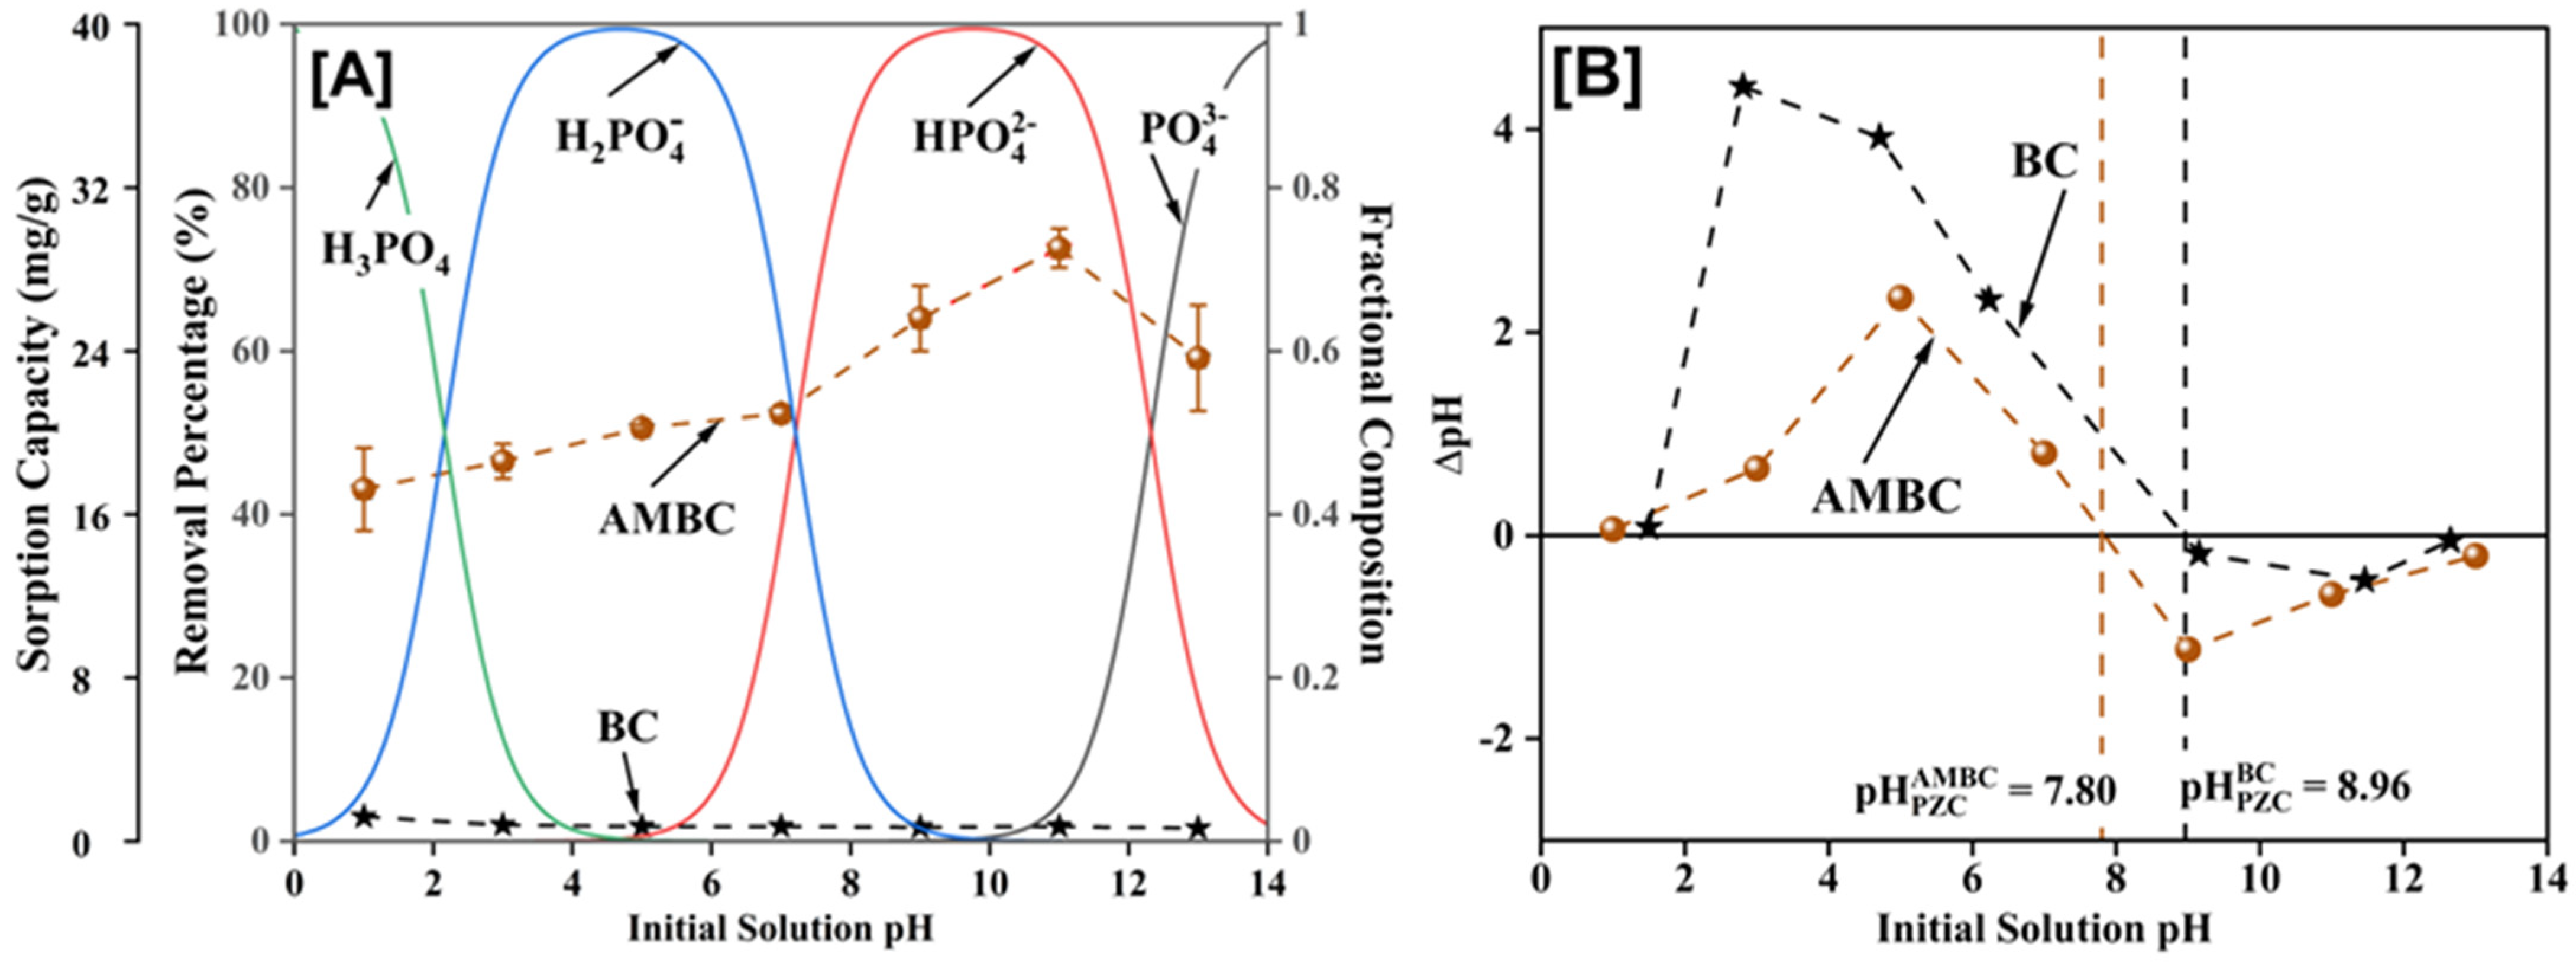
The effect of the solution pH on phosphate adsorption on AMBC was studied using 100 mg/L of phosphate solutions at 25 °C within pH 1 to 13 (at an interval of pH 2). Different molarities of HCl and NaOH are used to adjust the pH of the solutions.
Adsorption kinetics of AMBC were examined by mixing 50 mg of AMBC with 20 mL of 12.5, 25 ppm, and 50 mg/L phosphate solutions at pH = 11, and a controlled study was carried out at pH 7 using 50 mg/L phosphate solution following the same agitation and filtering procedures used in preliminary screening experiments. For the isotherm experiments, 5–1000 mg/L concentrations of phosphate solutions were equilibrated with AMBC at pH 11 and room temperature (25 °C). The final pH was recorded after each experiment. In addition, the adsorption thermodynamics was assessed by repeating the same experiment at lower (10 °C) and higher (40 °C) temperatures.
The mass (mg) of analyte removed per gram of char (qe) was calculated as follows,
q e = V ( C 0 C e ) M
where Co and Ce are initial and equilibrium analyte concentrations (mg/L), V is the solution volume (L), and M is the total mass of adsorbent added (g).

Adsorbent Characterization

Multiple analytical techniques were used to characterize BC, AMBC, and phosphate-laden AMBC including BET (Brunauer–Emmet–Teller), SEM and TEM (Scanning and Transmission Electron Microscopy), EDX (Energy Dispersive X-ray), XRD (X-ray diffraction), and XPS (X-ray photoelectron spectroscopy). The specific surface area (BET) was determined using a nitrogen adsorption isotherm at 273.15 K (Micromeritics Tristar II Plus) and the Dubinin–Astakhov equation ( log   a = log   a 0 Dlog n   ( P 0 P ) , where a indicates the quantity of gas adsorbed per unit mass of adsorbent (mol/g), a0 is the micropore capacity (mol/g), D is constant, P is the equilibrium pressure, and P0 is the saturation vapor pressure of adsorbate at temperature T (K)). Density Functional Theory (DFT) was used to calculate micropore volume ( W 0 = 44,000   a 0 ρ , where W0 is the limiting micropore volume (cm3/g), a0 is the micropore capacity (mol/g), and ρ is the density of adsorbed gas (g/cm3)) [23]. Biochar surface textures were observed by SEM using a JEOL JSM-6500F FE instrument at 5 kV coupled with a Zeiss, EVO 40 SEM containing a BRUKER EDX system. TEM of AMBC and P-laden AMBC were obtained using a JEOL model 2100 electron microscope operated at 200 kV. TEM/EDX analysis was done with an Oxford X-max-80 detector. XRD analysis was used to determine the Al/Mg-specific crystallographic structure phase after precipitation to make AMBC and to detect any alterations in the AMBC structure after phosphate sorption using a Rigaku ultima III (using Cu-K ( α (λ = 1.54 Å)). XPS analysis was done with a Thermo Scientific K-Alpha system outfitted with a monochromatic X-ray source at 1486.6 eV, corresponding to the Al Kα line, with a 400 µm spot size. AMBC samples equilibrated with 100 mg/L phosphate solutions at pH 11 were used for XPS analysis. In addition, the prepared composite’s PZC (point of zero charges) was measured using the pH drift method, where 20 mL of a series of pH solutions was prepared in a 0.01 NaCl matrix. Solutions were equilibrated for 24 h with 50 mg of biochar before measuring the final pH. PZC values were determined using a graphical approach [24].

3. Results

3.1. Preliminary Screening, pH Optimization, and Point of Zero Charge

The Mg/Al 2:1 ratio prepared at pH 13 showed the best phosphate uptake performance on preliminary screening tests (Figure 2). H3PO4 dissociation constants are pKa1 = 2.12, pKa2 = 7.21, and pKa3 = 12.67 (Figure 3A). BC has no significant phosphate uptake due to the lack of functional groups. pH influence on AMBC’s phosphate sorption remained constant (40–50%) except for the pH range 9–11. At pH 11, the highest uptake (~70% removal) was observed (Figure 3A). The PZCs for BC and AMBC are 9.2 and 6.9, respectively (Figure 3B). The basic BC PZC is due to the presence of carbonates and oxides of Mg, Ca, and K formed in the biochar during the pyrolysis, and they are hydrolyzed with the contact with water [25]. The AMBC PZC is due to the contributions of the BC (~9.2), Al2O3 (~7), MgO (~11.6), and MgAl2O4~(8.3) phases [26,27].

3.2. The Surface Area and Morphological Architecture of the Biochar

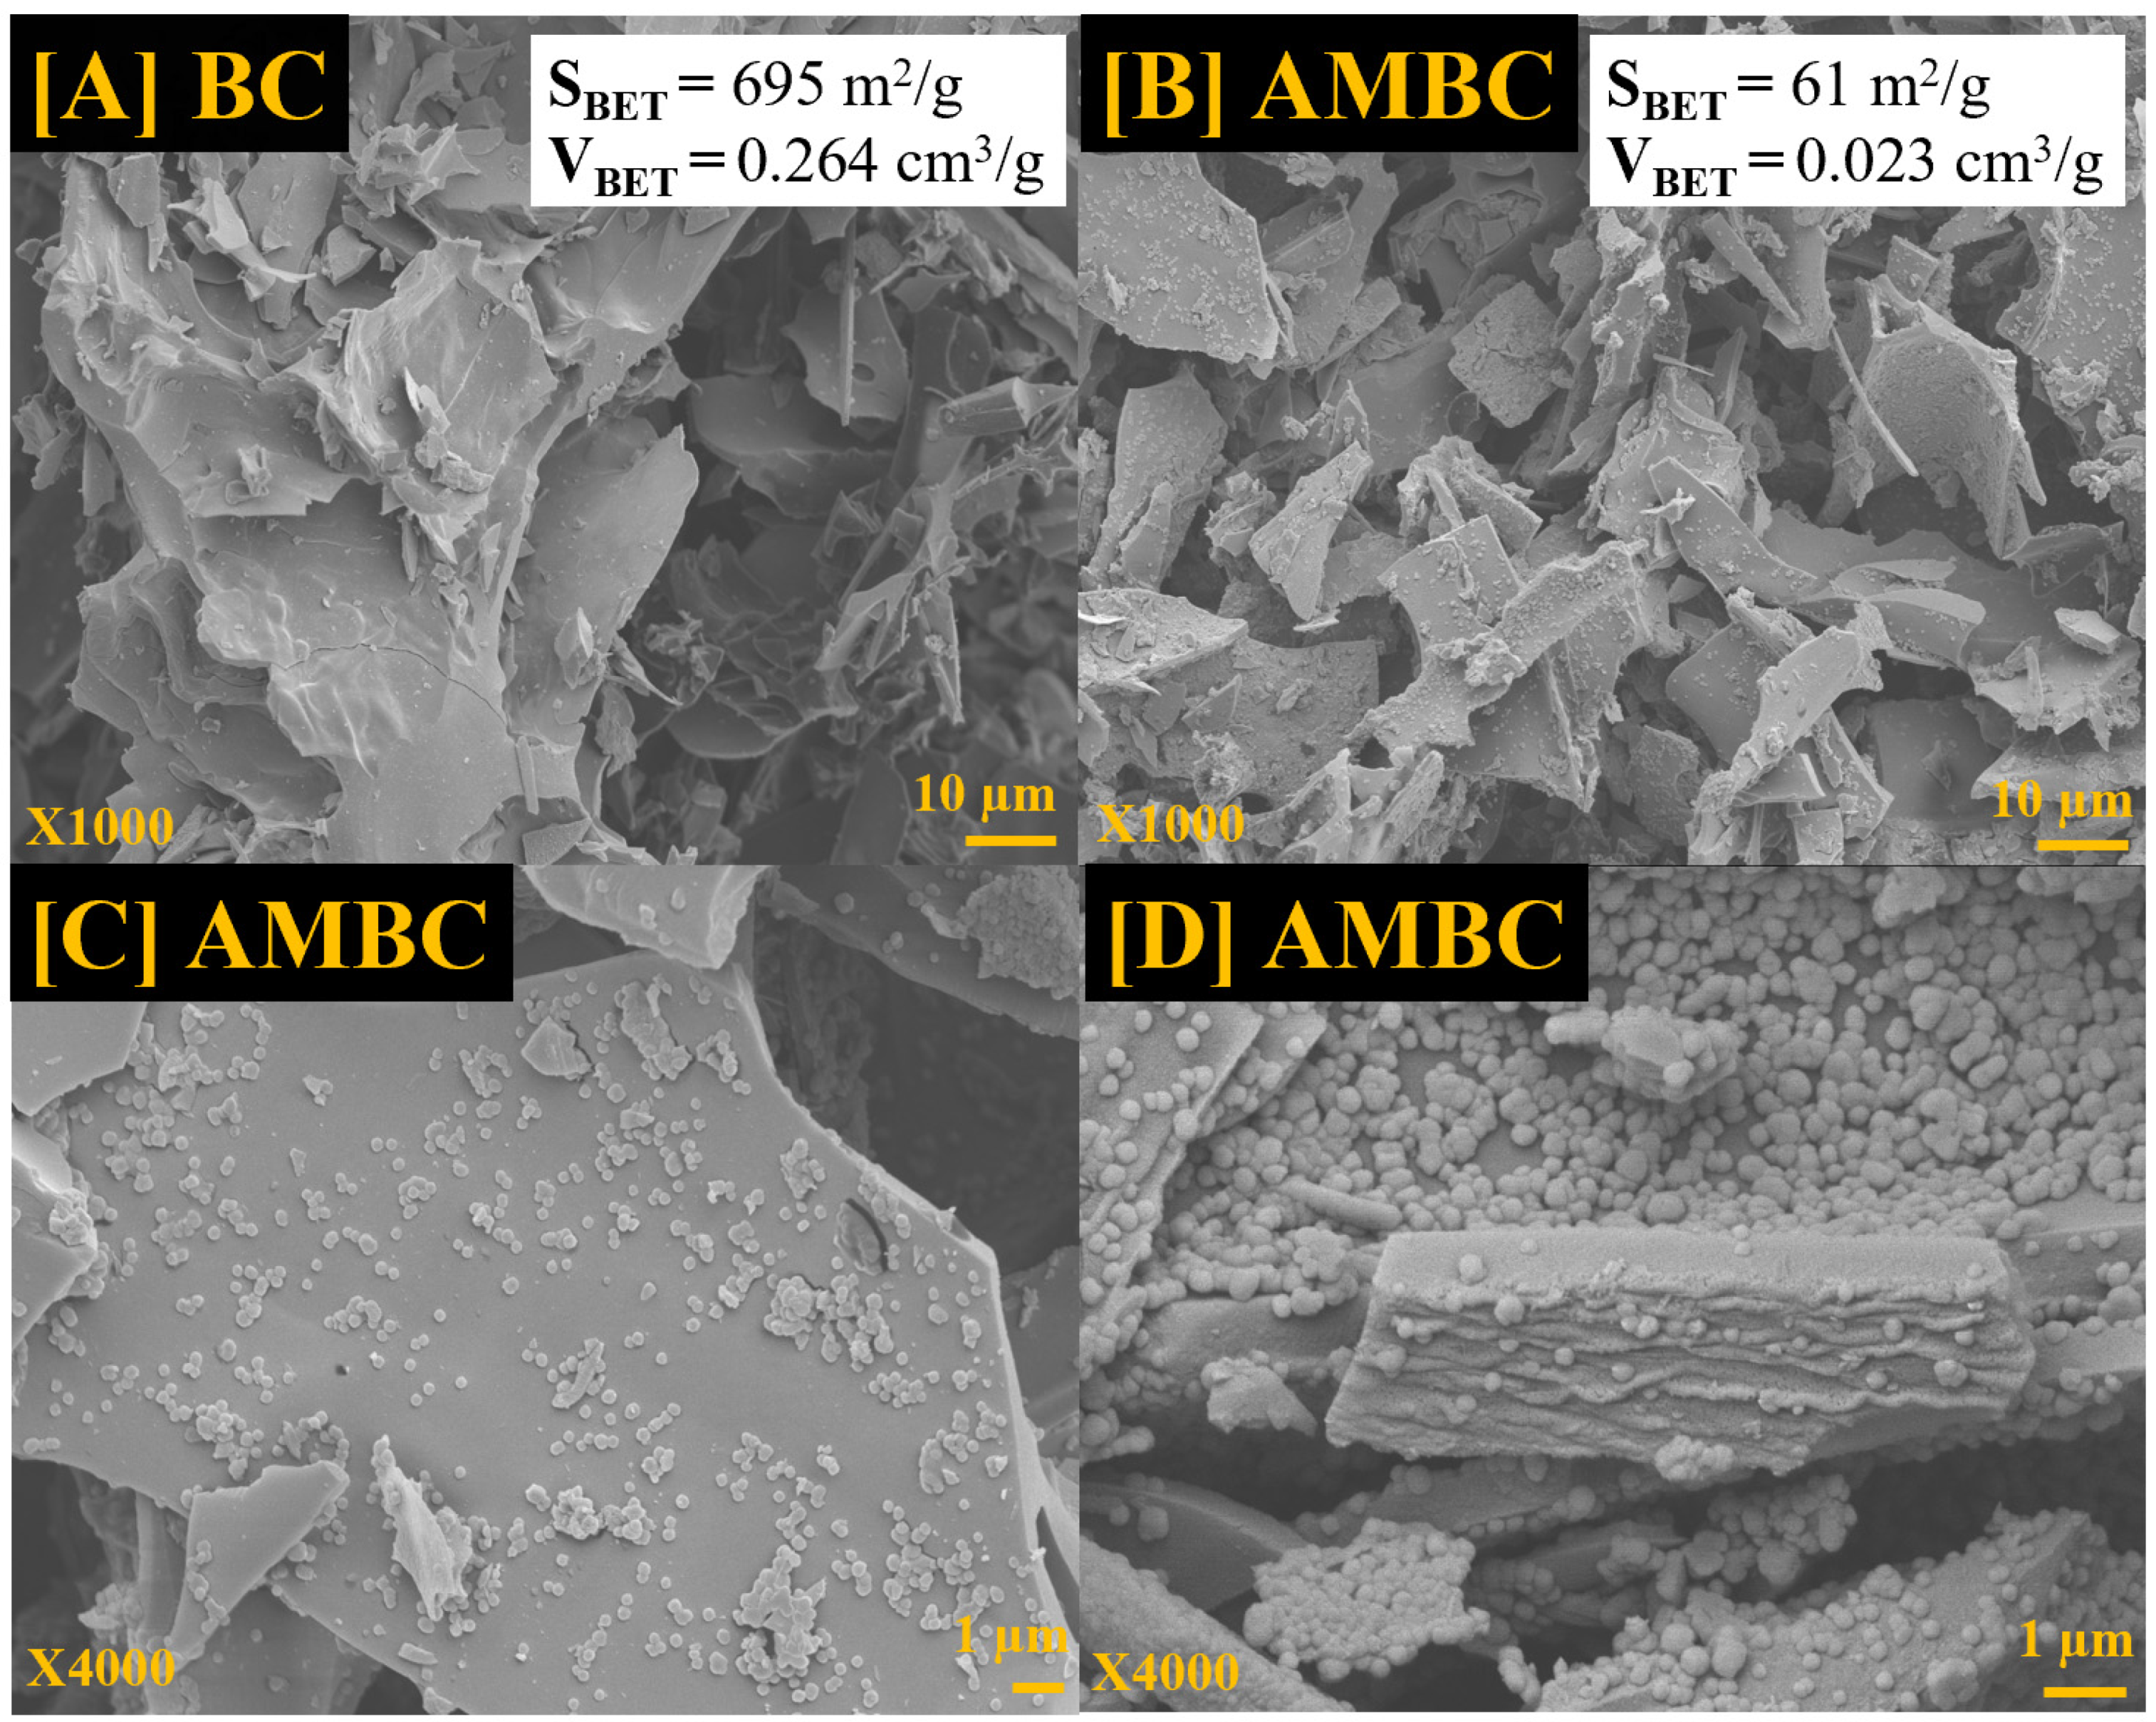
The BC utilized was a byproduct of the gasification of wet waste wood (Douglas fir), which was done in an updraft gasifier and produced at a residence time of 1–30 s at 900 °C. This process yields biochar with a relatively large surface area (695 m2/g) and a large pore volume (0.264 cm3/g). When Mg/Al oxides precipitate on BC to create AMBC, a portion of the char’s micropores and ultramicropores cross the char surface and are blocked from adsorbing nitrogen because of the deposited nanoparticles and their aggregates. As a result, it loses ~90% of its pore volume and ~88% of its original surface area (0.264 to 0.023 cm3/g and 695 to 61 m2/g, respectively). Scanning electron micrographs (SEM) for the BC and AMBC are shown in Figure 4. Micrographs (A–D) show the morphological architectural changes due to the precipitation of Mg/Al sulfates, oxides, and hydroxides. The particles were dispersed on the biochar either as primary spherical nano (~200 nm) particles or their aggregates [28]. Elemental mapped TEM-EDX images of phosphate-laden AMBC show the presence of phosphorus (~8.4%) (Figure 5A,B). Furthermore, it was preferentially adsorbed to Al/Mg-sulfate/hydroxide-rich regions on the BC surface rather than on the carbonaceous surface (Figure 5B), which illustrates reasonable agreement that the adsorption of phosphate is mainly due to the ion-exchange or chemisorptive interactions with the Al and Mg oxide/hydroxide phases or formation of insoluble AlPO4 or Mg3(PO4)2 stoichiometric phosphate compounds [12,13].

3.3. X-ray Diffraction (XRD) and X-ray Photoelectron Spectroscopy

BC XRD has a broad peak centered at 22.2° due to deformed (amorphous) cellulose, resulting during biomass pyrolysis (Figure 5C) [13]. In addition, the AMBC and phosphate-laden AMBC displayed new peaks corresponding to Al/Mg oxides/hydroxides and sulfates: Mg(OH)2 (18.2°), MgSO4 (20.9°), Al(OH)3 (24.3°), Al2(SO4)3 (25.6°), Al2(SO4)3/Al2O3 (30.1°), Al(OH)3 (40.3°), MgAl2O4 (48.1°), and Mg(OH)2 (52.4°) (Figure 5C) [29,30,31,32]. Moreover, the peak intensities decreased upon phosphate adsorption, indicating a possible formation of amorphous Al/Mg-phosphate surface complexes/stoichiometric compounds [33,34]. Typically, the phosphate surface complexes with Al/Mg oxides/hydroxides result in amorphous phases and will not yield new XRD peaks [13].
XPS further investigated the elemental composition of the near surface (10–100 Å) region of phosphate-laden BC and AMBC. Both LR and HR P-laden XPS spectra are given in the supporting material (Figures S1 and S2). The BC contains trace levels of Al and S as well as undetectable Mg concentrations. Additionally, the P2p signal was noisy due to the extremely low phosphate uptake, therefore the XPS data could not be interpreted as P-loaded BC.
The XPS survey spectra clearly show phosphorus’s presence in phosphate-laden AMBC (Figure 6a). The P2p signal has a relatively low signal-to-noise ratio and was deconvoluted into H3PO4 (137.2 eV) (physisorbed phosphates), Mg-O-P (135.8 eV), and Al-O-P/Mg-Al-O-P (134.3 eV) (Figure 6b) [35,36]. O1s high resolution XPS spectra were resolved into four peaks (Figure 6c). These regions are assigned, respectively, adsorbed H2O (535.6 eV), MgAl2O4 (534.2 eV), CO32−/O-C=O (532.7 eV), and Mg-Al-P, Al2O3, O-C/C=O, P-OH, P=O, Al-O-P (531.3 eV) [37,38]. Peak binding energies for C1s at 287.7, 286.1, 284.6, 283.7, and 282.9 eV correspond to -CO2R(H) and CO32−, C=O, C-O-C/C-OH, C-C, and C-H (Figure 6d). Al2p was deconvoluted to Al-O-P (78.3 eV), -Al-OH (76.9 eV), and Al2O3/Mg-Al-O-P (75.7 eV) (Figure 6e) [39], and Mg1s was deconvoluted to MgHPO4 (1307.6 eV), Mg(H2PO4)2 (1306.3 eV), MgO/MgAl2O4 (1304.9 eV), and Mg/Mg(OH)2 (1303.3 eV) (Figure 5F) [38,39,40].

3.4. Adsorption Mechanism/Interactions

Multiple interactions are sought to govern the uptake process. Biochar has negligible adsorption, but some electrostatic attractions may be present (via hydrogen bonding, charged metal hydroxide surface, etc.) [13]. The adsorption-onto-Mg/Al-oxides phases are driven by physisorption and chemisorption interactions. Physisorption interactions can be governed by charged metal hydroxide surfaces and hydrogen bonding (Equation (2)).
(MgAl2O4)-M-OH + H+ ⟷ M-OH2+
where M = Al or Mg. Chemisorption is thought to occur via the formation of M-O-P (M = Al/Mg) bonds associated with H2O/H3O+ or OH exchange. Temperature, pH, and initial phosphate concentration all influence the formation of monodentate or bidentate forms (Figure 7A) [12,13,41]. In addition, stoichiometric insoluble phosphate compounds with leached Al3+ [Al3+(aq) + PO43−(aq) ⇌ AlPO4(s) (Ksp = 9.84 × 10⁻²¹ mol2L−2)] and Mg2+ [3Mg2+(aq) + 2PO43−(aq) ⇌ Mg3(PO4)2(s) Ksp = 1.04 × 10⁻²⁴ mol5L−5] [13] can be formed. They will be precipitated back onto the biochar surface, resulting in a higher uptake. This is more likely to occur above 35 °C with the initial phosphate concentration >100 mg/L.

3.5. Adsorption Kinetics

At pH 11, 85–95% phosphate removal was achieved within 15 min (Figure 8A–C), and for pH 7, 50–55% removal was achieved after 240 min (Figure 8D). Both data sets were fitted well onto a pseudo-2nd-order (PSO) [42] kinetic model with high correlation coefficients (0.96–0.99).
t q t = 1 k 2 q e 2 + t q e
Here, t corresponds to contact time, qe is the phosphate equilibrium capacity (mg/g), qt is the phosphate capacity (mg/g) at time t (min), and k2 (g/mg·min) is second-order rate constant.
The PSO rate constant (k2) increased from 0.25 to 0.77 g/mg·min when increasing initial phosphate concentrations from 25 to 50 mg/L (Table 1). However, a further increase in [P] decreased the rate constant (0.02 g/mg·min). This is perhaps due to switching from a mono dentate to bidentate complex formation or to a stoichiometric compound precipitation. Monodentate and bidentate surface complexes or stoichiometric compounds are produced with distinct kinetics while all adsorption paths combine to produce the observed adsorption rate.

3.6. Adsorption Isotherms and Thermodynamics

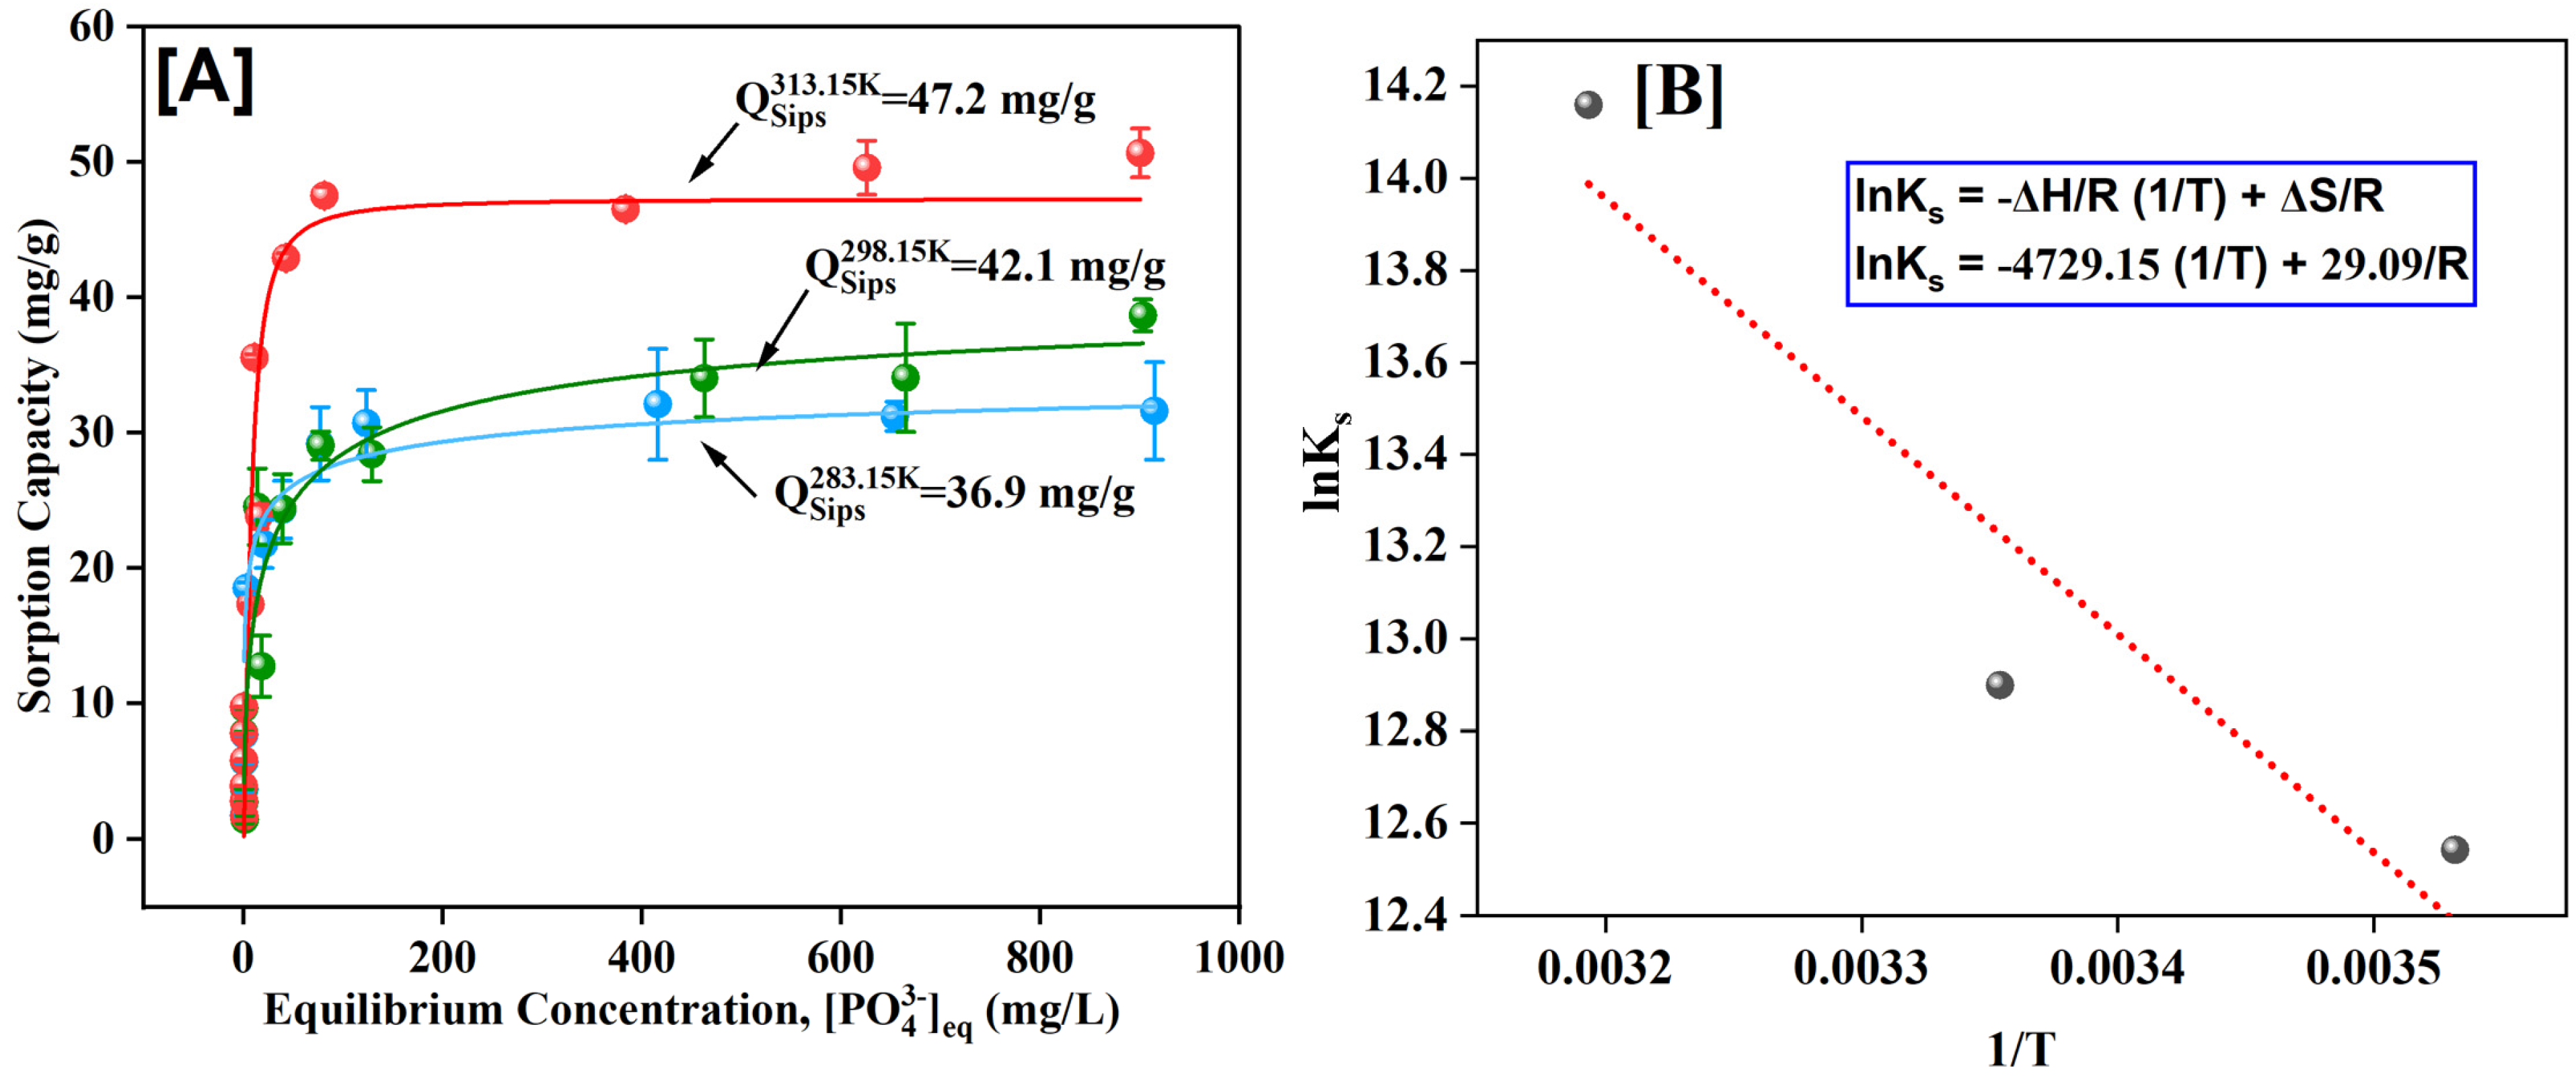
The isotherm data were well fitted (R2 = 0.99) to the Sips [43] isotherm model, and capacities spanned from 36.9 to 47.2 mg/g (Figure 9) and showed an endothermic nature in its adsorption (Figure 9B and Table 2). Sips isotherm (Equation (4)) is a hybrid of the Langmuir and Freundlich expressions used for heterogeneous adsorption systems—it circumvents the Freundlich isotherm model limitation of the rising adsorbate concentration. It reduces to the Freundlich isotherm at low adsorbate concentrations, while at high concentrations, it provides a prediction of a monolayer adsorption capacity characteristic of the Langmuir isotherm [43].
Q e = q o ( K S C e ) n ( 1 + ( K S C e ) n )
Here, qo is the theoretical isotherm saturation capacity (µg/g), qe is the quantity of adsorbate in the adsorbent at equilibrium (mg/g), Ce is concentration at equilibrium (mg/g), n is adsorption intensity, and Ks is the Sips isotherm constant (L/mg).
Gibbs free energy (ΔG), entropy (ΔS) and enthalpy (ΔH) were calculated utilizing van’t Hoff’s calculations. The Sips constant (Ks) was converted to a dimensionless constant after multiplying by the density of the liquid phase (~1 × 10⁶ mg/L). The calculated negative ΔG values indicated spontaneous adsorption, and its magnitude increased with temperature (from −29.52 to 36.86 kJ/mol). The positive ΔH (39.3 kJ/mol) confirmed endothermic adsorption. Physisorptions take place when ΔH < 20 kJ/mol, and chemisorptions happen when ΔH > 40 kJ/mol. This ΔH indicates that phosphate uptake is both physisorption and chemisorption. The positive value of ΔSο equates to a slightly increased randomness during phosphate uptake onto the Mg/Al oxide/hydroxide phases.
Isotherm fitting curves, isotherm capacities, and constant data were produced after the refinement of empirical isotherm equations using the inbuilt Levenberg–Marquardt nonlinear regression algorithm in Origin2020b. An average of three replicates were used for each data point. Isotherm capacities, significant figures, regression coefficients, and constants are based on the model-reported data and may not reflect the actual experimental uncertainties.

3.7. Comparison with Other Adsorbents

AMBC displayed reasonably fast uptake kinetics (15 min) and comparable capacities (up to ~47 mg/g). Previous results indicate that adsorption at acidic pH is not just the result of adsorption but also stoichiometric precipitation, which is irreversible (Table 3). Adsorption also occurs at near neutral pH. In addition, the metal-loading percentages are above 20% in most adsorbents. AMBC only has 5% metal loading, and its preparation is cheaper and more sustainable since the biochar support is a byproduct and is also available on a commercial scale.

4. Conclusions

Douglas fir biochar engineered with Al/Mg (AMBC (Mg/Al 2:1 pH = 13)) demonstrates fast phosphate removal kinetics and the potential ability to remediate phosphate-contaminated water. Optimal sorption pH was 11, requiring 15 min to reach 95% phosphate saturation following pseudo-2nd-order kinetics. AMBC also perform satisfactorily at neutral pH solutions allowing for real-world applications. Sorption data were best fitted into the Sips isotherm model giving a 42.1 mg/g capacity at 25 °C and pH 11. The process was endothermic with increased phosphate adsorption with increasing temperature. Uptake is thought to be governed by a combination of physisorption, chemisorption, and stoichiometric compound formation pathways. Used biochar composites could be used as a soil-enriching phosphate fertilizer, becoming part of an environmentally friendly agricultural management plan.

Supplementary Materials

The following supporting information can be downloaded at: https://www.mdpi.com/article/10.3390/pr11010111/s1, Figure S1: LR-XPS data for P-laden BC; Figure S2: HR-XPS data for P-laden BC.

Author Contributions

Conceptualization, C.M.N. and N.B.D.; methodology, C.M.N.; software, P.M.R.; validation, D.M. and X.Z.; formal analysis, X.Z. and D.M.; investigation, A.R., C.R., C.D., J.E.P., S.M., M.E.J., P.M.R., E.F., C.W., D.O.C. and M.W.; data curation, P.M.R.; writing—original draft preparation, C.M.N.; writing—review and editing, C.M.N.; supervision, T.E.M.; project administration, T.E.M.; funding acquisition, T.E.M. All authors have read and agreed to the published version of the manuscript.

Funding

This material is based upon work supported by the National Science Foundation under Grant No. 1659830. Any opinions, findings, conclusions, or recommendations expressed in this material are those of the authors and do not necessarily reflect the views of the National Science Foundation.

Data Availability Statement

The data presented in this study are available on request from the corresponding author.

Acknowledgments

The authors also would like to acknowledge the Department of Chemistry, Mississippi State University and Biochar Supreme LLC., Everson, WA 98247, USA for facilitating this research.

Conflicts of Interest

The authors declare no conflict of interest.

References

  1. Lambers, H.; Raven, J.A.; Shaver, G.R.; Smith, S.E. Plant nutrient-acquisition strategies change with soil age. Trends Ecol. Evol. 2008, 23, 95–103. [Google Scholar] [CrossRef] [PubMed]
  2. Schindler, D.; Armstrong, F.; Holmgren, S.; Brunskill, G. Eutrophication of Lake 227, Experimental Lakes Area, northwestern Ontario, by addition of phosphate and nitrate. J. Fish. Board Can. 1971, 28, 1763–1782. [Google Scholar] [CrossRef]
  3. Knud-Hansen, C. Historical perspective of the phosphate detergent conflict. In Proceedings of the Natural Resources and Environmental Policy Seminar, University of Colorado, Boulder, CO, USA, February 1994; Available online: http://johnhogan.info/hogan/CHEM_1002/Notes/PhosphateDetergentConflict.pdf (accessed on 12 December 2022).
  4. Lucassen, E.C.; Smolders, A.J.; Lamers, L.P.; Roelofs, J.G. Water table fluctuations and groundwater supply are important in preventing phosphate-eutrophication in sulphate-rich fens: Consequences for wetland restoration. Plant Soil 2005, 269, 109–115. [Google Scholar] [CrossRef]
  5. Bricker, S.B.; Clement, C.G.; Pirhalla, D.E.; Orlando, S.P.; Farrow, D.R. National Estuarine Eutrophication Assessment: Effects of Nutrient Enrichment in the Nation’s Estuaries; US National Oceanographic and Atmospheric Administration, National Ocean Service, Special Projects Office and the National Center for Coastal Ocean Science: Silver Spring, MD, USA, 1999.
  6. Schindler, D.W.; Vallentyne, J.R. The Algal Bowl: Overfertilization of the World’s Freshwaters and Estuaries; University of Alberta Press: Edmonton, AB, Canada, 2008. [Google Scholar]
  7. Bonsdorff, E.; Blomqvist, E.; Mattila, J.; Norkko, A. Coastal eutrophication: Causes, consequences and perspectives in the archipelago areas of the northern Baltic Sea. Estuar. Coast. Shelf Sci. 1997, 44, 63–72. [Google Scholar] [CrossRef]
  8. Rabalais, N.N.; Turner, R.E.; Gupta, B.K.S.; Platon, E.; Parsons, M.L. Sediments tell the history of eutrophication and hypoxia in the northern Gulf of Mexico. Ecol. Appl. 2007, 17, S129–S143. [Google Scholar] [CrossRef]
  9. Mino, T.; Van Loosdrecht, M.; Heijnen, J. Microbiology and biochemistry of the enhanced biological phosphate removal process. Water Res. 1998, 32, 3193–3207. [Google Scholar] [CrossRef]
  10. Blaney, L.M.; Cinar, S.; SenGupta, A.K. Hybrid anion exchanger for trace phosphate removal from water and wastewater. Water Res. 2007, 41, 1603–1613. [Google Scholar] [CrossRef]
  11. Özacar, M.; Şengil, I.A. Enhancing phosphate removal from wastewater by using polyelectrolytes and clay injection. J. Hazard. Mater. 2003, 100, 131–146. [Google Scholar] [CrossRef]
  12. Karunanayake, A.G.; Navarathna, C.M.; Gunatilake, S.R.; Crowley, M.; Anderson, R.; Mohan, D.; Perez, F.; Pittman, C.U., Jr.; Mlsna, T. Fe3O4 nanoparticles dispersed on Douglas fir biochar for phosphate sorption. ACS Appl. Nano Mater. 2019, 2, 3467–3479. [Google Scholar] [CrossRef]
  13. Rahman, S.; Navarathna, C.M.; Das, N.K.; Alchouron, J.; Reneau, P.; Stokes, S.; Thirumalai, R.V.; Perez, F.; Hassan, E.B.; Mohan, D. High capacity aqueous phosphate reclamation using Fe/Mg-layered double hydroxide (LDH) dispersed on biochar. J. Colloid Interface Sci. 2021, 597, 182–195. [Google Scholar] [CrossRef]
  14. Das, J.; Patra, B.; Baliarsingh, N.; Parida, K. Adsorption of phosphate by layered double hydroxides in aqueous solutions. Appl. Clay Sci. 2006, 32, 252–260. [Google Scholar] [CrossRef]
  15. Seida, Y.; Nakano, Y. Removal of phosphate by layered double hydroxides containing iron. Water Res. 2002, 36, 1306–1312. [Google Scholar] [CrossRef]
  16. Goh, K.-H.; Lim, T.-T.; Dong, Z. Application of layered double hydroxides for removal of oxyanions: A review. Water Res. 2008, 42, 1343–1368. [Google Scholar] [CrossRef] [PubMed]
  17. Henrist, C.; Mathieu, J.-P.; Vogels, C.; Rulmont, A.; Cloots, R. Morphological study of magnesium hydroxide nanoparticles precipitated in dilute aqueous solution. J. Cryst. Growth 2003, 249, 321–330. [Google Scholar] [CrossRef] [Green Version]
  18. Li, R.; Wang, J.J.; Zhou, B.; Awasthi, M.K.; Ali, A.; Zhang, Z.; Gaston, L.A.; Lahori, A.H.; Mahar, A. Enhancing phosphate adsorption by Mg/Al layered double hydroxide functionalized biochar with different Mg/Al ratios. Sci. Total Environ. 2016, 559, 121–129. [Google Scholar] [CrossRef] [Green Version]
  19. Zhang, M.; Gao, B.; Yao, Y.; Inyang, M. Phosphate removal ability of biochar/MgAl-LDH ultra-fine composites prepared by liquid-phase deposition. Chemosphere 2013, 92, 1042–1047. [Google Scholar] [CrossRef] [PubMed]
  20. Fuertes, A.; Arbestain, M.C.; Sevilla, M.; Maciá-Agulló, J.A.; Fiol, S.; López, R.; Smernik, R.; Aitkenhead, W.; Arce, F.; Macìas, F. Chemical and structural properties of carbonaceous products obtained by pyrolysis and hydrothermal carbonisation of corn stover. Soil Res. 2010, 48, 618–626. [Google Scholar] [CrossRef]
  21. Van Zwieten, L.; Kimber, S.; Morris, S.; Chan, K.; Downie, A.; Rust, J.; Joseph, S.; Cowie, A. Effects of biochar from slow pyrolysis of papermill waste on agronomic performance and soil fertility. Plant Soil 2010, 327, 235–246. [Google Scholar] [CrossRef]
  22. Murphy, J.; Riley, J.P. A modified single solution method for the determination of phosphate in natural waters. Anal. Chim. Acta 1962, 27, 31–36. [Google Scholar] [CrossRef]
  23. Burevski, D. The application of the Dubinin-Astakhov equation to the characterization of microporous carbons. Colloid Polym. Sci. 1982, 260, 623–627. [Google Scholar] [CrossRef]
  24. Lopez-Ramon, M.V.; Stoeckli, F.; Moreno-Castilla, C.; Carrasco-Marin, F. On the characterization of acidic and basic surface sites on carbons by various techniques. Carbon 1999, 37, 1215–1221. [Google Scholar] [CrossRef]
  25. Yao, Y.; Gao, B.; Inyang, M.; Zimmerman, A.R.; Cao, X.; Pullammanappallil, P.; Yang, L. Removal of phosphate from aqueous solution by biochar derived from anaerobically digested sugar beet tailings. J. Hazard. Mater. 2011, 190, 501–507. [Google Scholar] [CrossRef] [PubMed]
  26. Sverjensky, D.A. Zero-point-of-charge prediction from crystal chemistry and solvation theory. Geochim. Cosmochim. Acta 1994, 58, 3123–3129. [Google Scholar] [CrossRef]
  27. Rey, C.; Combes, C.; Drouet, C.; Grossin, D.; Bertrand, G.; Soulié, J. 1.11 Bioactive Calcium Phosphate Compounds: Physical Chemistry☆. In Comprehensive Biomaterials II; Elsevier: Amsterdam, The Netherlands, 2017; pp. 244–290. [Google Scholar]
  28. Bafrooei, H.B.; Ebadzadeh, T. MgAl2O4 nanopowder synthesis by microwave assisted high energy ball-milling. Ceram. Int. 2013, 39, 8933–8940. [Google Scholar] [CrossRef]
  29. Molefe, D.M.; Labuschagne, J.; Focke, W.W.; Van der Westhuizen, I.; Ofosu, O. The effect of magnesium hydroxide, hydromagnesite and layered double hydroxide on the heat stability and fire performance of plasticized poly (vinyl chloride). J. Fire Sci. 2015, 33, 493–510. [Google Scholar] [CrossRef] [Green Version]
  30. Zheng, G.; Xia, J.; Chen, Z.; Yang, J.; Liu, C. Study on kinetics of the pyrolysis process of aluminum sulfate. Phosphorus Sulfur Silicon Relat. Elem. 2020, 195, 285–292. [Google Scholar] [CrossRef]
  31. Saoud, K.M.; Saeed, S.; Al-Soubaihi, R.M.; Bertino, M.F. Microwave assisted preparation of magnesium hydroxide nano-sheets. Am. J. Nanomater. 2014, 2, 21–25. [Google Scholar]
  32. Prorok, R.; Ramult, J.; Nocun-Wczelik, W.; Madej, D. The Effect of Chelate Compounds on the Hydration Process of MgO–Al2O3 Phase System under Hydrothermal Conditions. Appl. Sci. 2021, 11, 2834. [Google Scholar] [CrossRef]
  33. Wignall, G.; Rothon, R.; Longman, G.; Woodward, G. The structure of amorphous aluminium phosphate by radial distribution functions derived from X-ray diffraction. J. Mater. Sci. 1977, 12, 1039–1049. [Google Scholar] [CrossRef]
  34. Abbona, F.; Baronnet, A. A XRD and TEM study on the transformation of amorphous calcium phosphate in the presence of magnesium. J. Cryst. Growth 1996, 165, 98–105. [Google Scholar] [CrossRef]
  35. Konno, H.; Kobayashi, S.; Takahashi, H.; Nagayama, M. The hydration of barrier oxide films on aluminium and its inhibition by chromate and phosphate ions. Corros. Sci. 1982, 22, 913–923. [Google Scholar] [CrossRef]
  36. Chong, K.Z.; Shih, T.S. Conversion-coating treatment for magnesium alloys by a permanganate–phosphate solution. Mater. Chem. Phys. 2003, 80, 191–200. [Google Scholar] [CrossRef]
  37. Xu, J.; Yang, Q.; Huang, C.; Javed, M.S.; Aslam, M.K.; Chen, C. Influence of additives fluoride and phosphate on the electrochemical performance of Mg–MnO2 battery. J. Appl. Electrochem. 2017, 47, 767–775. [Google Scholar] [CrossRef]
  38. Akolekar, D.B. Novel, crystalline, large-pore magnesium aluminophosphate molecular sieve of type 50: Preparation, characterization, and structural stability. Zeolites 1995, 15, 583–590. [Google Scholar] [CrossRef]
  39. Mordekovitz, Y.; Shoval, Y.; Froumin, N.; Hayun, S. Effect of structure and composition of non-stoichiometry magnesium aluminate spinel on water adsorption. Materials 2020, 13, 3195. [Google Scholar] [CrossRef] [PubMed]
  40. Zheng, G.; Wu, C.; Wang, J.; Mo, S.; Zou, Z.; Zhou, B.; Long, F. Space-confined effect one-pot synthesis of γ-AlO (OH)/MgAl-LDH heterostructures with excellent adsorption performance. Nanoscale Res. Lett. 2019, 14, 281. [Google Scholar] [CrossRef] [PubMed]
  41. Herath, A.; Navarathna, C.; Warren, S.; Perez, F.; Pittman, C.U., Jr.; Mlsna, T.E. Iron/titanium oxide-biochar (Fe2TiO5/BC): A versatile adsorbent/photocatalyst for aqueous Cr (VI), Pb2+, F and methylene blue. J. Colloid Interface Sci. 2022, 614, 603–616. [Google Scholar] [CrossRef]
  42. Ho, Y.-S.; McKay, G. Pseudo-second order model for sorption processes. Process Biochem. 1999, 34, 451–465. [Google Scholar] [CrossRef]
  43. Foo, K.Y.; Hameed, B.H. Insights into the modeling of adsorption isotherm systems. Chem. Eng. J. 2010, 156, 2–10. [Google Scholar] [CrossRef]
  44. Jung, K.-W.; Ahn, K.-H. Fabrication of porosity-enhanced MgO/biochar for removal of phosphate from aqueous solution: Application of a novel combined electrochemical modification method. Bioresour. Technol. 2016, 200, 1029–1032. [Google Scholar] [CrossRef]
  45. Jack, J.; Huggins, T.M.; Huang, Y.; Fang, Y.; Ren, Z.J. Production of magnetic biochar from waste-derived fungal biomass for phosphorus removal and recovery. J. Clean. Prod. 2019, 224, 100–106. [Google Scholar] [CrossRef]
  46. Seftel, E.M.; Ciocarlan, R.G.; Michielsen, B.; Meynen, V.; Mullens, S.; Cool, P. Insights into phosphate adsorption behavior on structurally modified ZnAl layered double hydroxides. Appl. Clay Sci. 2018, 165, 234–246. [Google Scholar] [CrossRef]
  47. Yan, L.-G.; Yang, K.; Shan, R.-R.; Yan, T.; Wei, J.; Yu, S.-J.; Yu, H.-Q.; Du, B. Kinetic, isotherm and thermodynamic investigations of phosphate adsorption onto core–shell Fe3O4@LDHs composites with easy magnetic separation assistance. J. Colloid Interface Sci. 2015, 448, 508–516. [Google Scholar] [CrossRef] [PubMed]
  48. Chitrakar, R.; Tezuka, S.; Sonoda, A.; Sakane, K.; Ooi, K.; Hirotsu, T. Adsorption of phosphate from seawater on calcined MgMn-layered double hydroxides. J. Colloid Interface Sci. 2005, 290, 45–51. [Google Scholar] [CrossRef] [PubMed]
  49. Daou, T.; Begin-Colin, S.; Greneche, J.-M.; Thomas, F.; Derory, A.; Bernhardt, P.; Legaré, P.; Pourroy, G. Phosphate adsorption properties of magnetite-based nanoparticles. Chem. Mater. 2007, 19, 4494–4505. [Google Scholar] [CrossRef]
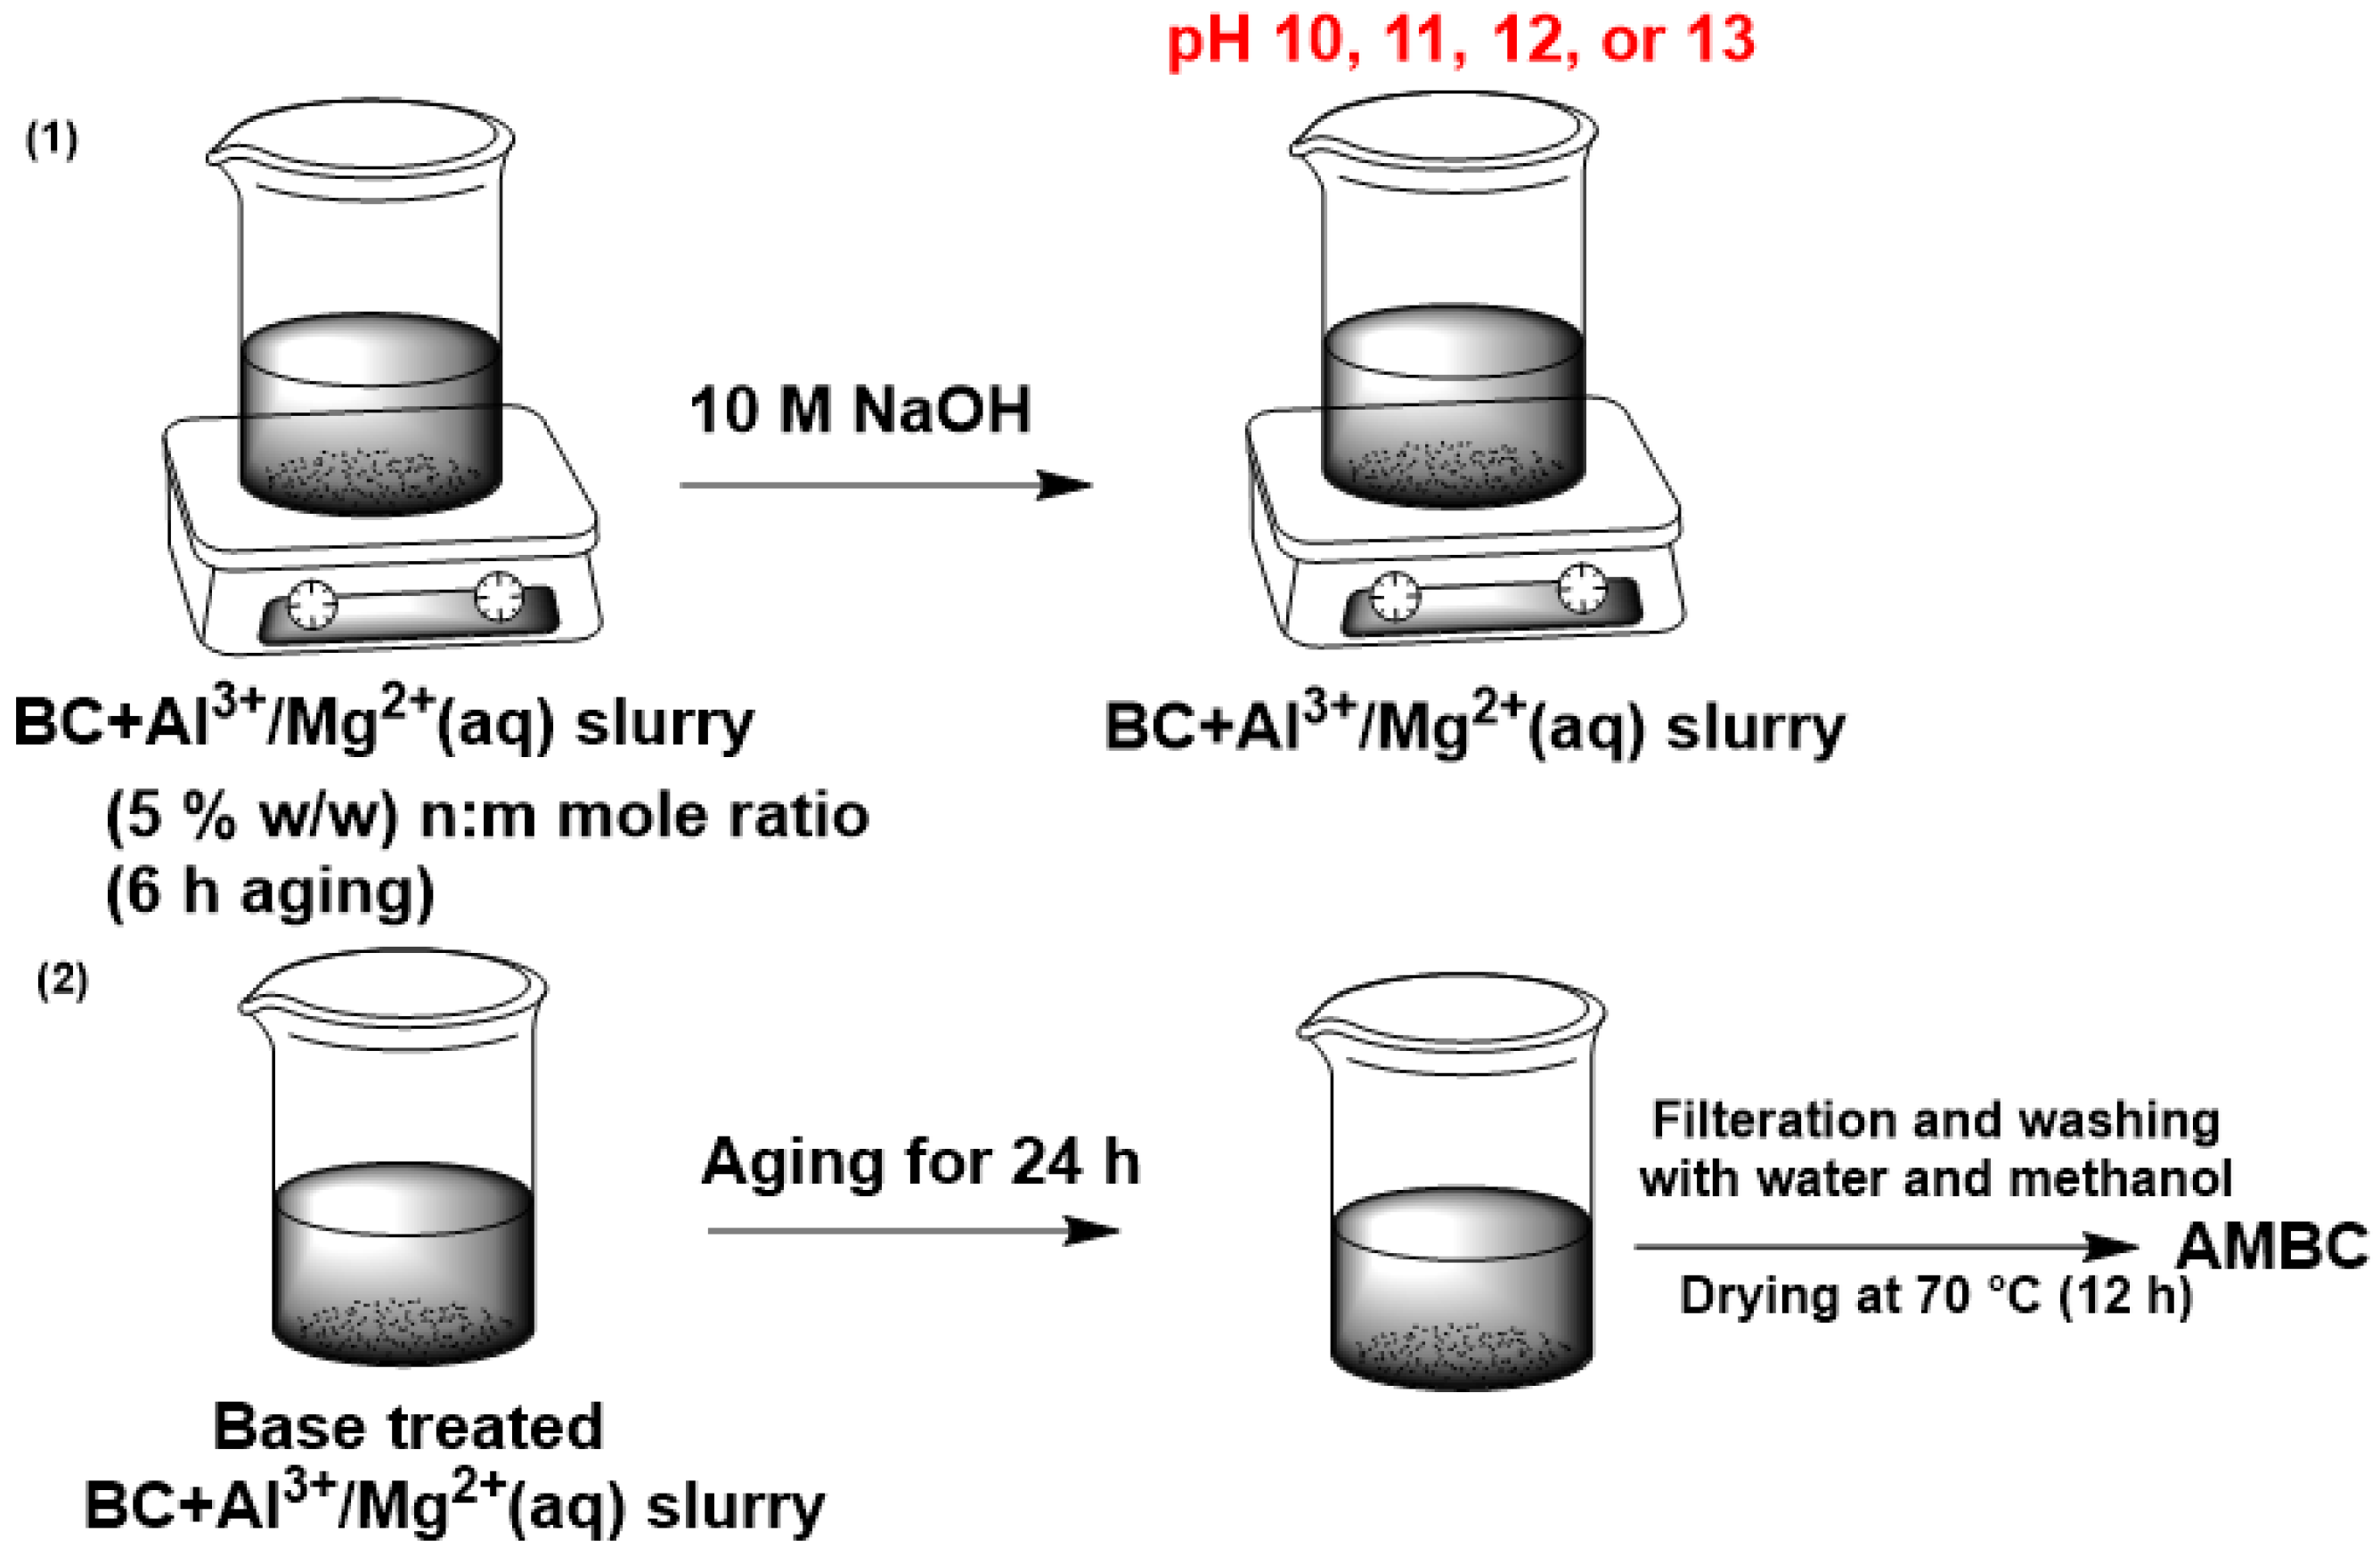
Figure 1. Biochar composite preparation scheme.
Processes 11 00111 g001
Figure 2. Adsorbent screening test results for phosphate uptake (error bars represent the standard deviation of 3 replicates). Adsorption experiments were performed at pH 7, while the materials were prepared either at 10, 11, 12, or 13.
Processes 11 00111 g002
Figure 3. (A) pH dependency on phosphate adsorption to BC and AMBC, and (B) fractional phosphate composition curves and point of zero charges (PZC) plot for BC and AMBC (error bars represent the standard deviation of 3 replicates).
Processes 11 00111 g003
Figure 4. SEM images of (A) BC, and (BD) AMBC.
Processes 11 00111 g004
Figure 5. (A) TEM-EDS elemental percentages; (B) TEM images and element-mapped TEM images of (I) BC, (II) AMBC, and (III) Phosphate-laden AMBC; and (C) XRD for BC, AMBC, and phosphate-laden AMBC.
Processes 11 00111 g005
Figure 6. (A) Low-resolution XPS survey spectra for BC, AMBC, and phosphate-laden AMBC, and (BF) high-resolution XPS spectra for phosphate-sorbed AMBC.
Processes 11 00111 g006
Figure 7. (A) Chemisorptive surface complex formation mechanism, and (B) Al/Mg oxide/hydroxide chemisorptive interactions.
Processes 11 00111 g007
Figure 8. Pseudo-2nd-order fits for phosphate: (A) 12.5, (B) 25, (C) 50 (at pH 11), and (D) 100 mg/L (at pH 7) [25 °C and 200 rpm stirring]. The uncertainty of qexp is due to the standard deviation of 3 replicates.
Processes 11 00111 g008
Figure 9. (A) Sips isotherm model fits (error bars represent the standard deviation of 3 replicates) at 10, 25, and 40 °C, and (B) van’t Hoff’s plot.
Processes 11 00111 g009
Table 1. Pseudo-2nd-order model fit data for phosphate uptake a.
Phosphate Concentration (mg/L)R2qcal (mg/g)qexp (mg/g)k2 (g/mg·min)
pH 11, 12.50.995.054.940.2548
25 0.994.664.570.7797
500.9616.8816.440.0319
pH 7, 1000.9818.8521.910.0238
a Rate constants and regression coefficients significant figures on the table are related to the model fittings and may not reflect the actual uncertainties of experimental data.
Table 2. Sips isotherm model constants and van’t Hoff’s data for phosphate uptake.
Temperature (°C)Temperature (K)1/T (K−1)Ks (L/mg)Ks (unitless)ln KsΔG (kJ/mol)ΔH
(kJ/mol)
ΔS
(kJ/mol·K)
10283.150.0035320.28280,00012.54−29.5239.3 0.24
25298.150.0033540.4400,00012.89−31.97
40313.150.0031931.411,410,00014.15−36.86
Table 3. Comparison of uptake data with similar adsorbents.
AdsorbentTemp (°C)Equilibrium TimepHBET Surface Area (m2/g)Adsorption Capacity (mg/g)Ref.
Marine macroalgae BC2048 h 2.43.3[44]
Waste-derived fungal biomass magnetite BC2524 h 53.023.9[45]
2:1 Mg/Al-LDHs sugar cane leaf BC composite251 h310.1753.4[18]
3:1 Mg/Al-LDHs sugar cane leaf BC composite11.4172.1
4:1 Mg/Al-LDHs sugar cane leaf BC composite12.2581.8
Magnetic biochar (MBC)252 min3312.691.3[12]
3591.0
4590.0
Zn-Al LDH2572 h 35.9[46]
3058.2
4079.1
5092.6
Fe3O4 Zn/Al-LDH251 h 13336.9[47]
Fe3O4 Mg/Al-LDH71.931.7
Fe3O4 Ni/Al-LDH50.926.5
Mg/Mn Layered double hydroxides103 d 6.2[48]
257.3
407.5
Magnetite based nanoparticles24 3315.2[49]
Al/Mg oxide/hydroxide/sulfate impregnated Douglas fir biochar1015 mins11, 76136.9This work
2542.1 (21.9 @ pH 7)
4047.2
Disclaimer/Publisher’s Note: The statements, opinions and data contained in all publications are solely those of the individual author(s) and contributor(s) and not of MDPI and/or the editor(s). MDPI and/or the editor(s) disclaim responsibility for any injury to people or property resulting from any ideas, methods, instructions or products referred to in the content.