Article

A PDCA Framework towards a Multi-Response Optimization of Process Parameters Based on Taguchi-Fuzzy Model

1
Department of Industrial Engineering, Faculty of Engineering, The Hashemite University, P.O. Box 330127, Zarqa 13133, Jordan
2
Hijjawi Faculty for Engineering Technology, Yarmouk University, Irbid 21163, Jordan
*
Author to whom correspondence should be addressed.
Processes 2022, 10(9), 1894; https://doi.org/10.3390/pr10091894
Submission received: 18 August 2022 / Revised: 2 September 2022 / Accepted: 9 September 2022 / Published: 18 September 2022

Abstract

:
Multi-response optimization problems investigation is a crucial element in initiatives designed to enhance quality and overall productivity for manufacturing processes. Since no particular algorithm can be employed for all multi-response problems, defining the method that is utilized as a problem-solving technique is a vital step in the process factors optimization. Identifying a formal procedure of implementing the improvement approach in a multi-criteria decision-making problem is a critical need to ensure the consistency and sustainability of the enhancement methods. In this study, a Plan–Do–Check–Act (PDCA) framework is implemented for a case study in the food industry under which a multi-response optimization problem is investigated. The design of experiment (DOE) is used to examine the effect of process parameters on the quality responses by using the Taguchi method to find the optimal setting for each parameter. An orthogonal array (OA) and signal-to-noise (SNR) ratio is employed to investigate the performance characteristics. Each performance characteristic is then converted into a signal-to-noise ratio, and all the ratios are then fed into a fuzzy model to produce a single comprehensive output measure (COM). The average COM values for various factor levels are calculated, and the level that maximizes the COM value for each factor is identified as the optimal level. Results indicated the effectiveness of the applied method to find the optimal factor levels for the multi-response optimization problem under study. The global optimal factor levels that are driven from the fuzzy logic for the studied parameters are 1250, 40, 7.5, and 1:2, for the speed, frying time, cooking time, and the coating ratio, respectively. Means of all the studied quality characteristics were closer to the target values when compared with the initial factors’ settings.

1. Introduction

Improving systems performance and enhancing process efficiency are key interests for companies in efforts made towards product and process quality development. Design of Experiment (DOE) is a helpful tool used in identifying the key variables that influence quality characteristics in a process. Designed experiment is a systematic approach to change the controllable factors (inputs) in a process and define the effect of these inputs on the parameters (the outputs) of the process. For DOE, it is vital to set the operating conditions of the process variables that will result in the best process performance; this can achieve the target value of the mean and minimize the variability of the quality characteristics (outputs) of the process [1,2,3]. Several studies have investigated the use of DOE in different applications. Alagumurthi et al. investigated and optimized the process parameters of a grinding process, to obtain the optimal factor levels that deliver a superior quality and productivity while considering the economic factors. The DOE principles were implemented in the optimality procedures using the Taguchi method [4]. Al Athamneh et al. explored the fatigue properties of SAC305 solder joints at different operating conditions. Since the reliability of the final product is one of the eight dimensions of quality, DOE rules were used in constructing a robust reliability model for solder joint fatigue life, as a function of the process parameters [5]. In addition, Durakovic provided a formal guideline for the planning and execution of the experiments and for the analysis and interpretation of the results for different applications [6].
The use of the Design of Experiment in the food industry has been examined in numerous studies. Ahmadabadi et al., in their study, investigated the use of DOE and Quality Function Deployment (QFD) for developing new food products. The study used several parameters for process improvement to satisfy the customer needs, and the results indicated the effectiveness of the use of DOE and QFD [7]. Cucuz et al., in their study, found satisfactory results using DOE to optimize the process parameters in the food industry for grape pomace extracts, using the ultrasound-assisted extraction to produce a satisfactory yield of phenols and anthocyanins [8]. Kumar et al. developed models of DOE and simulation to maximize the output of tomato concentrated pulp; the results highlighted the practical application of DOE to increase the throughput rate and the productivity in the food industry [9]. In addition, other studies highlighted the impact of DOE for process improvement in different applications. Olveira et al. proposed a full factorial design in natural fibers as reinforcement in polymers, and they investigated the impact of some parameters on the physical properties of the coir fiber [10,11,12]. Beg et al. proposed the application of DOE in pharmaceutical product and process optimization [13]. Other case studies investigated the machinability performance during the various processes using DOE [14,15]. Moreover, other studies used fractional factorial designs. Moreira et al. found that the fractional design can be applied to optimizing an acid–alkaline pretreatment in rice husks [16]. Rezende et al. used DOE to optimize milling time, temperature, double treatment, chemical concentration, and pretreatment time in acid–alkali (EA) and acid–organosolv (EO) pretreatments [17].
Numerous optimization techniques are commonly used in optimizing the process parameters. Under the Taguchi method, various parameters can be examined simultaneously with a minimum number of experimental conditions [18,19]. The local optimal settings can be obtained with a reasonable number of experiments, and it is more powerful than fractional factorial because it has its orthogonal array. Moreover, it considers the mean and variance by using the signal-to-noise ratio (SNR). SNR has three main categories: larger-the-better, smaller-the-better, and nominal-the-best. Each of these categories has a special equation to calculate SNR, and this ratio is defined so that a maximum value of the ratio minimizes variability transmitted from the noise variables. In most manufacturing processes, several quality characteristics must be considered for process parameter optimization; this means that more than one response characteristic must be optimized at the same time. To obtain the overall optimal setting of process parameters concerning all the responses, an optimization strategy is required. The strategy that can deal with this type of problem is the multi-response optimization technique [20,21,22,23]. The approach seeks to modify the design parameters (known as control factors) such that the system response is robust; that is, insensitive to noise elements that are difficult or impossible to control. The Taguchi method contains system design, parameter design, and tolerance design procedures to achieve a robust process [24]. The main thrust of Taguchi’s technique is the use of parameter design to determine the parameter (factor) settings, providing the optimum levels of a quality characteristic (performance measure) with the least variation. The process has three stages: System design, Parameter design and Tolerance design [25]. Taguchi’s (SNR), which are log functions, are based on Orthogonal Array (OA) experiments that result in considerably reduced “variance” for the experiment with “optimal settings” of control parameters. Thus, the Taguchi Method combines the Design of Experiments with optimization of control parameters to reach the best outcomes. Orthogonal Arrays give a set of well-balanced (minimum) experiments and desired outputs, act as objective functions for optimization, improve data analysis, and forecast optimal results [26,27].
The Taguchi method has been efficient in optimizing the process performance in many applications [28,29,30,31]. For example, in the manufacturing field, Fratila and Caizar used the fractional orthogonal with the Taguchi method to optimize the lubrication and cutting parameters of a face-milling process. The examined quality responses in their study were surface roughness and power consumption. The contributions of the process parameters were determined using ANOVA analysis [32]. A biodiesel production process was demonstrated by Esmaeili et al., where the reaction time, temperature, methanol-to-oil ratio and catalyst concentration were considered as process parameters for investigation. The Taguchi method was applied to obtain the factor levels that provide the optimal production performance [33].
The Taguchi method also has many applications in the food industry; for example, in the study implemented by Patidar et al. DOE methodology using Taguchi orthogonal array (OA) was used to evaluate the influence of several factors on the pectinase production. The results indicated that Taguchi’s method is efficient for optimizing the experiments for the investigated case study [34]. Noorwali, in his study, introduced a model based on the Taguchi method (along with applying the lean principles) to reduce the variability in the food processing industry, and found significant results [35].
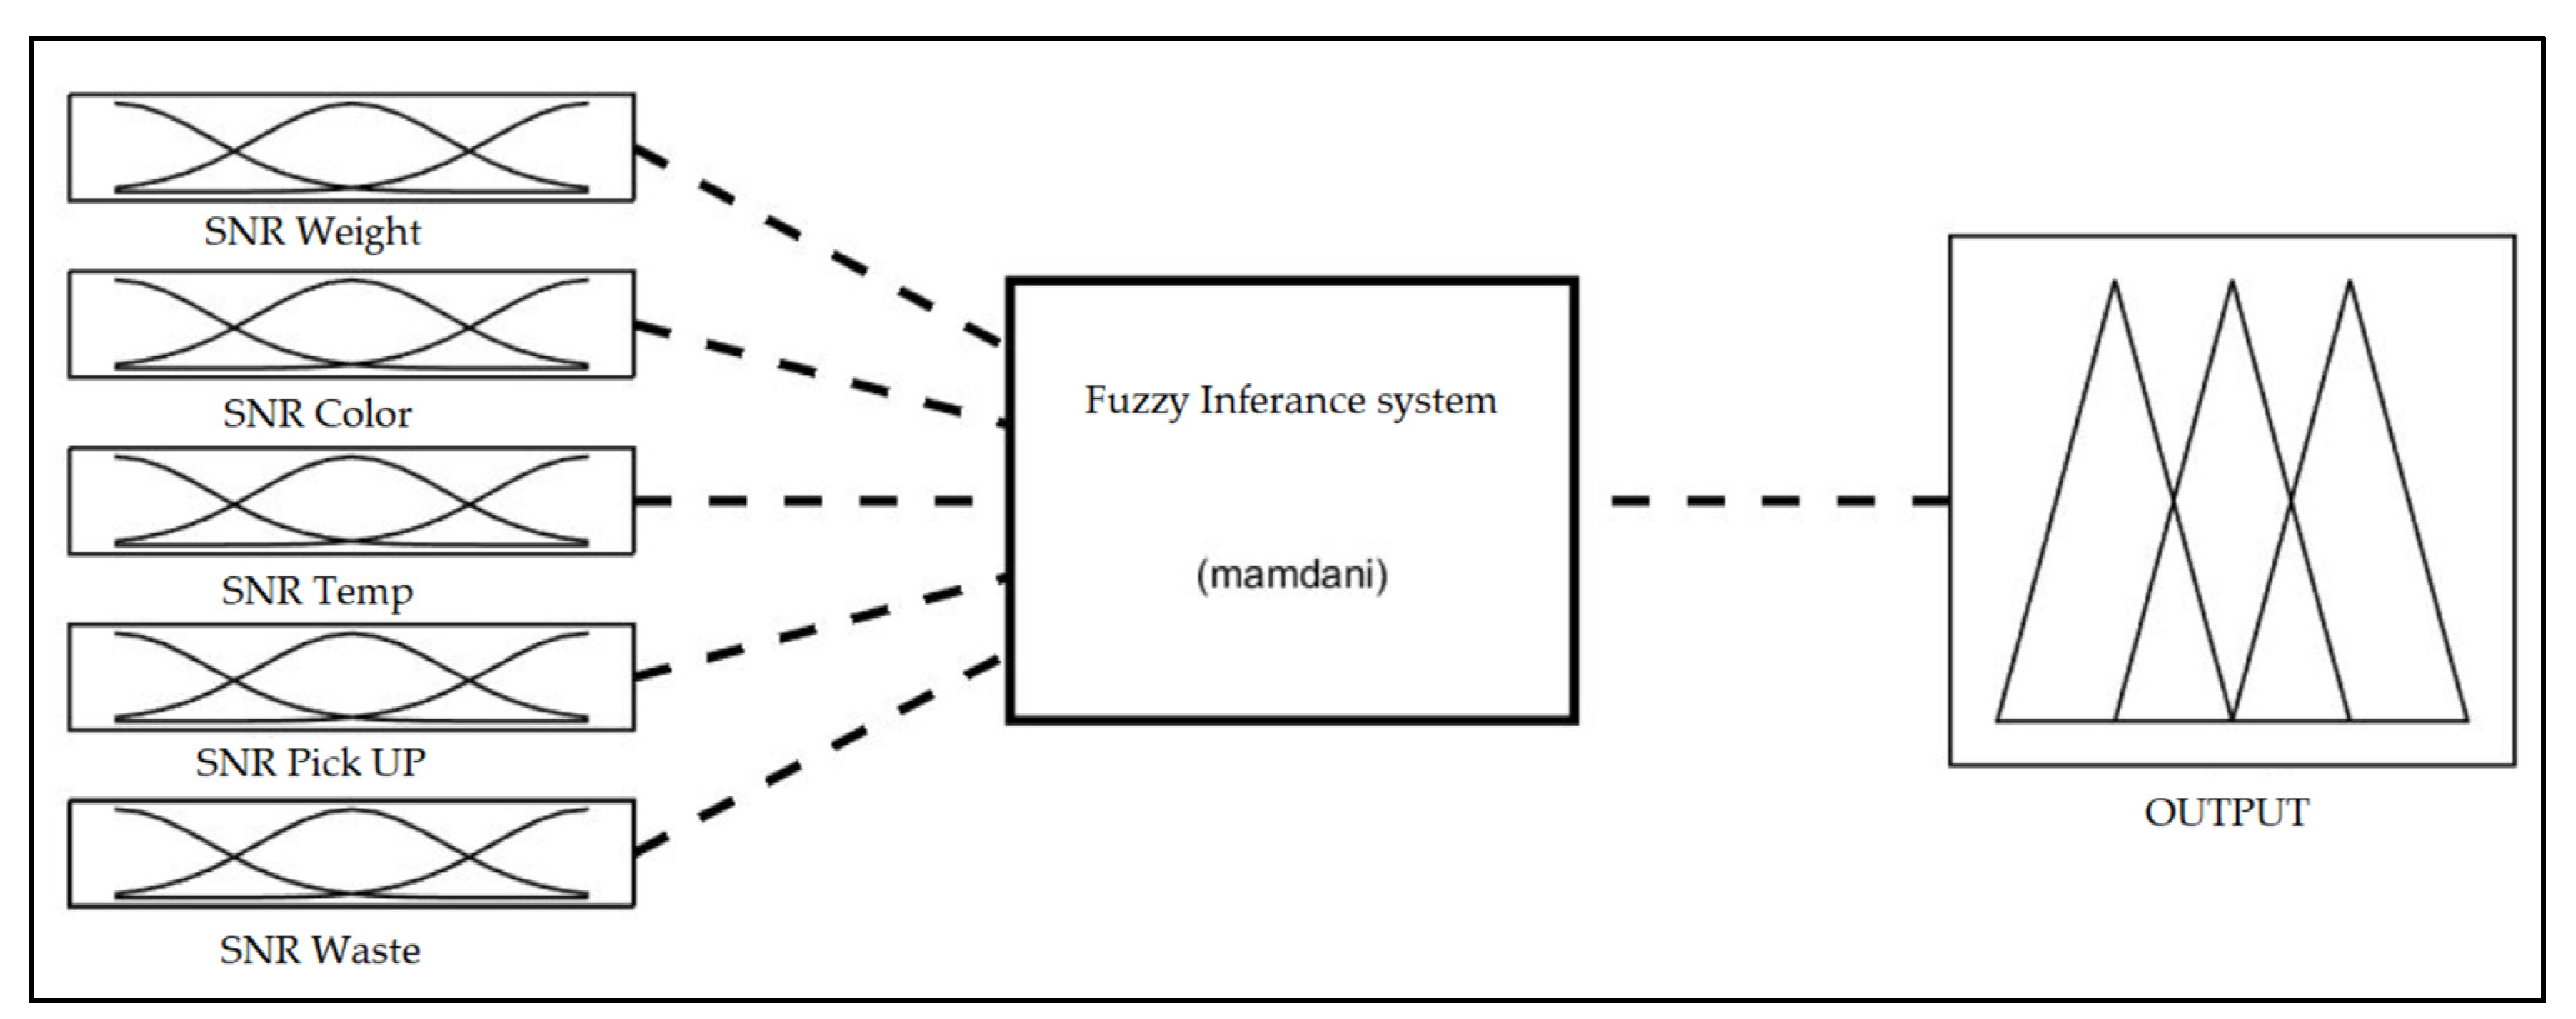
The Taguchi and DOE approaches showed a significant deficiency when the multi-criteria problem optimization was presented. There has been a lot of research undertaken on the various methods for dealing with multi-response problems, such as artificial neural networks (ANNs), fuzzy logic, fuzzy Taguchi method, neural fuzzy Taguchi method, genetic algorithm, utility method, goal programming, grey fuzzy method, principal component analysis, fuzzy regression, and response surface methodology [36,37,38,39,40,41,42]. The principles of fuzzy logic are used to deal with ambiguous and uncertain data. Different case studies used fuzzy logic, fuzzy Taguchi method, grey fuzzy method, neural fuzzy Taguchi method, and fuzzy regression, and found significant results that the fuzzy measured values were in good agreement with the experimental values. Furthermore, confirmation tests were carried out to ensure that the Taguchi optimized levels and fuzzy-developed models accurately represent the measured responses [43,44,45,46].
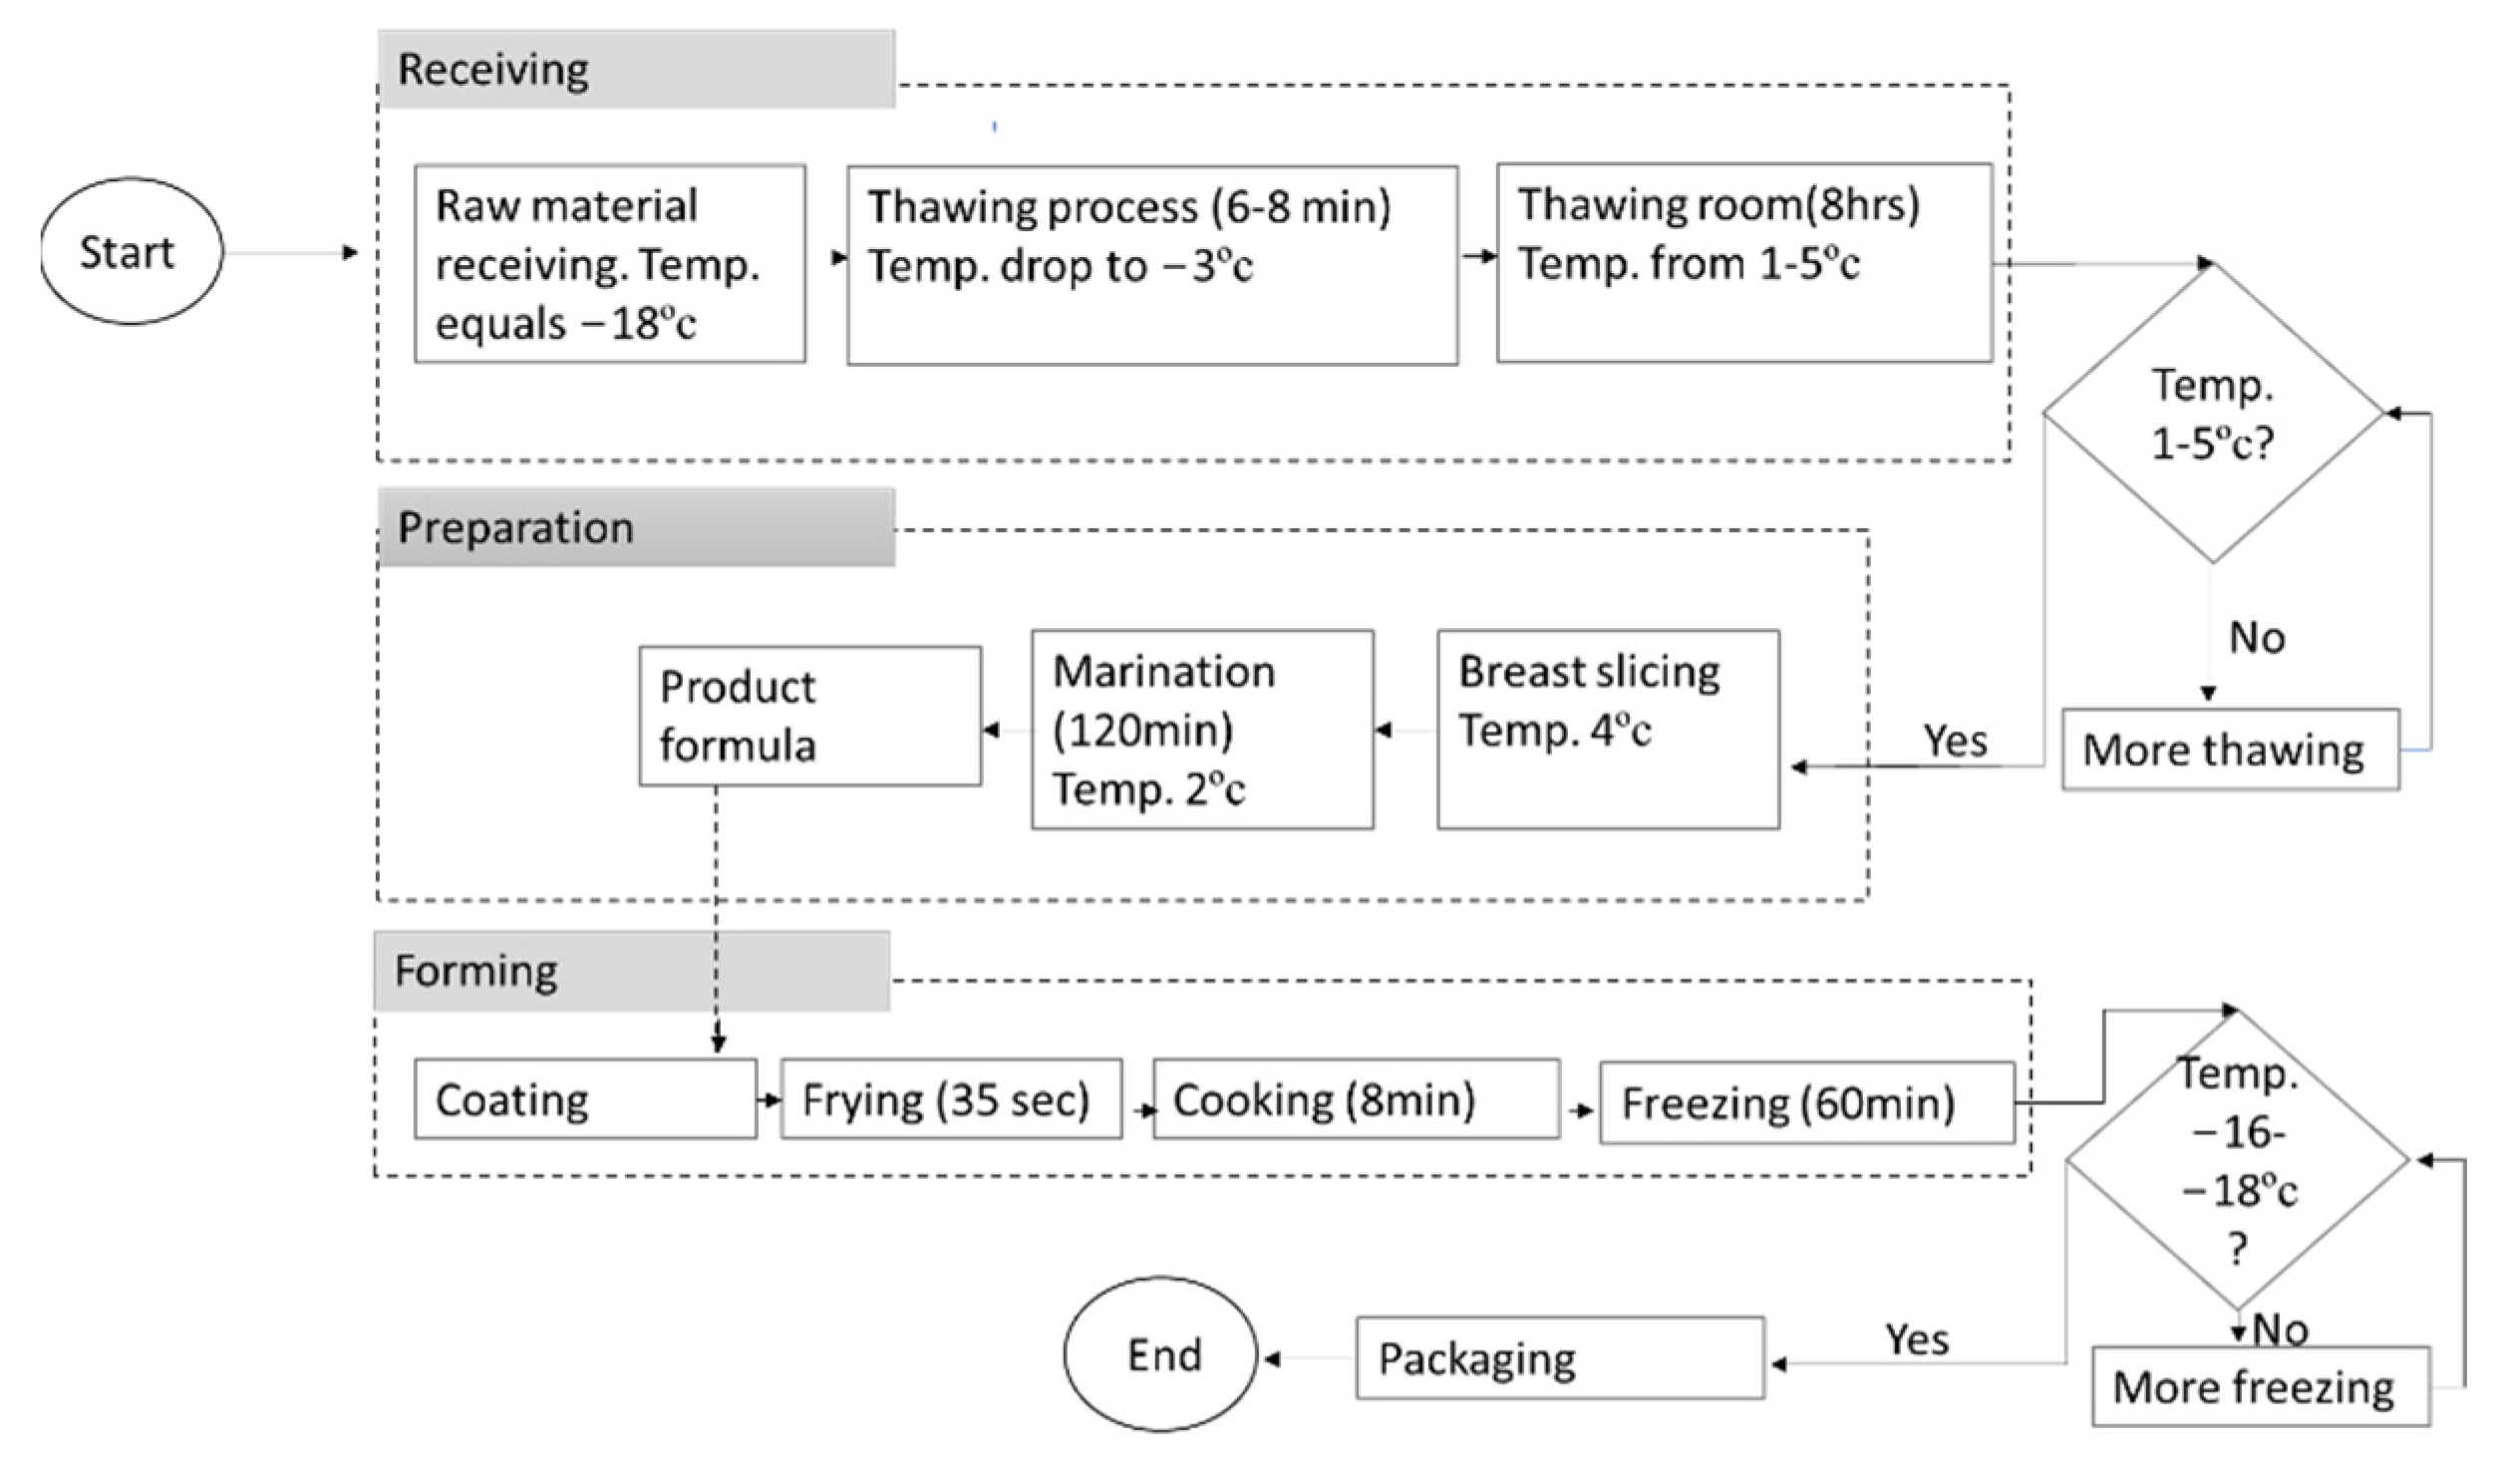
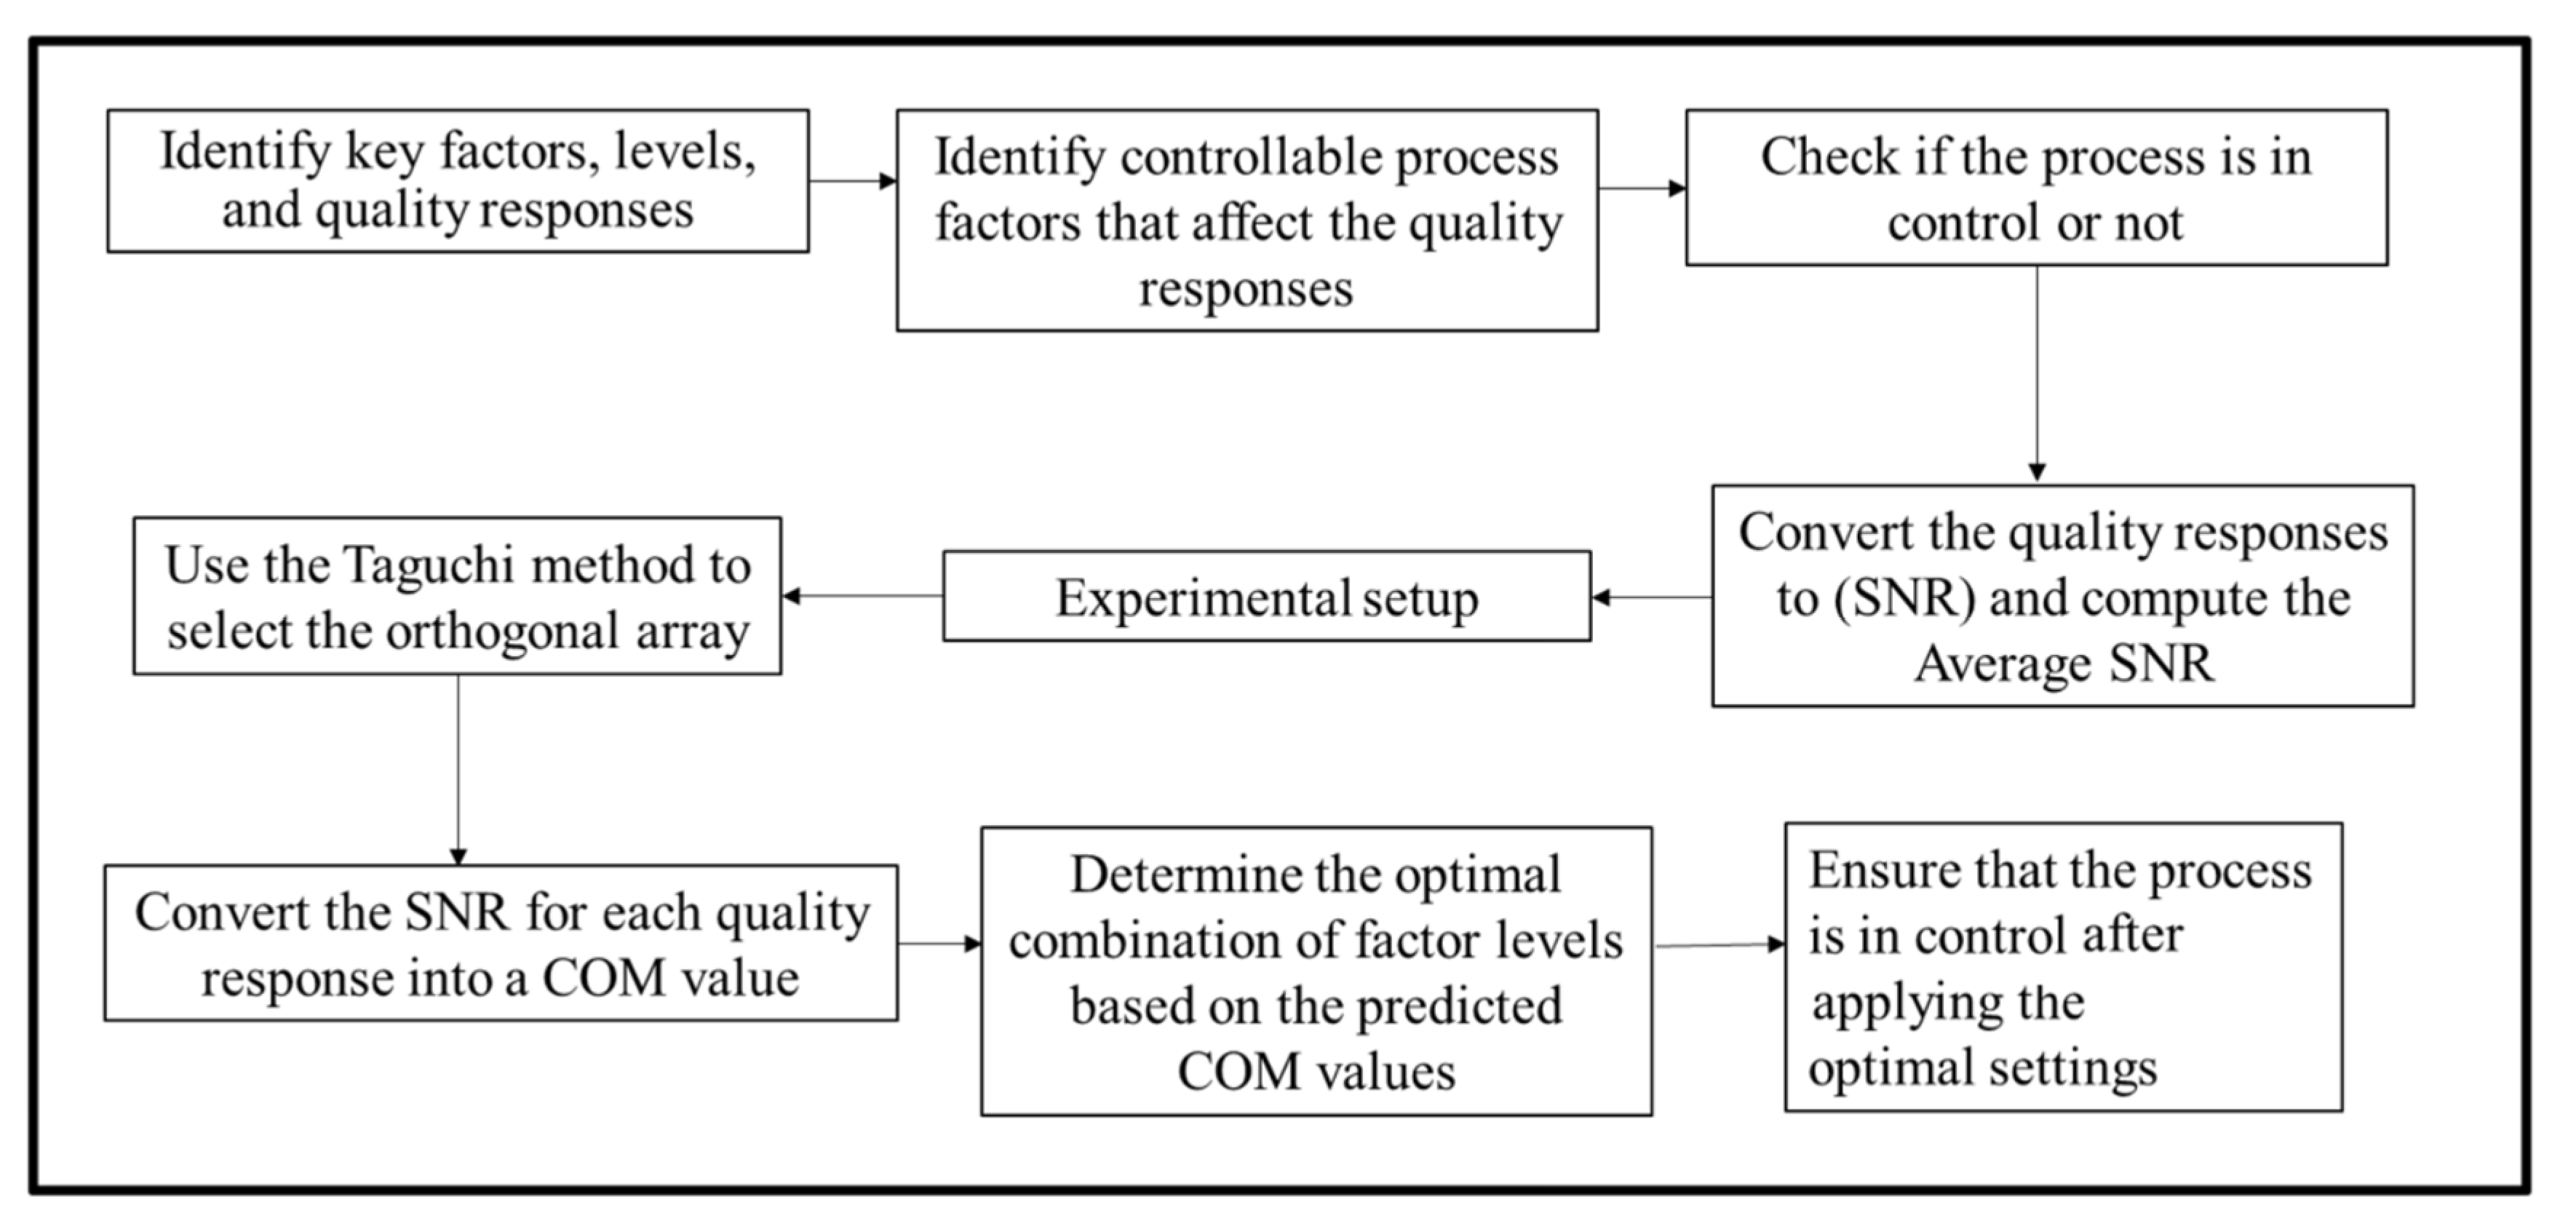
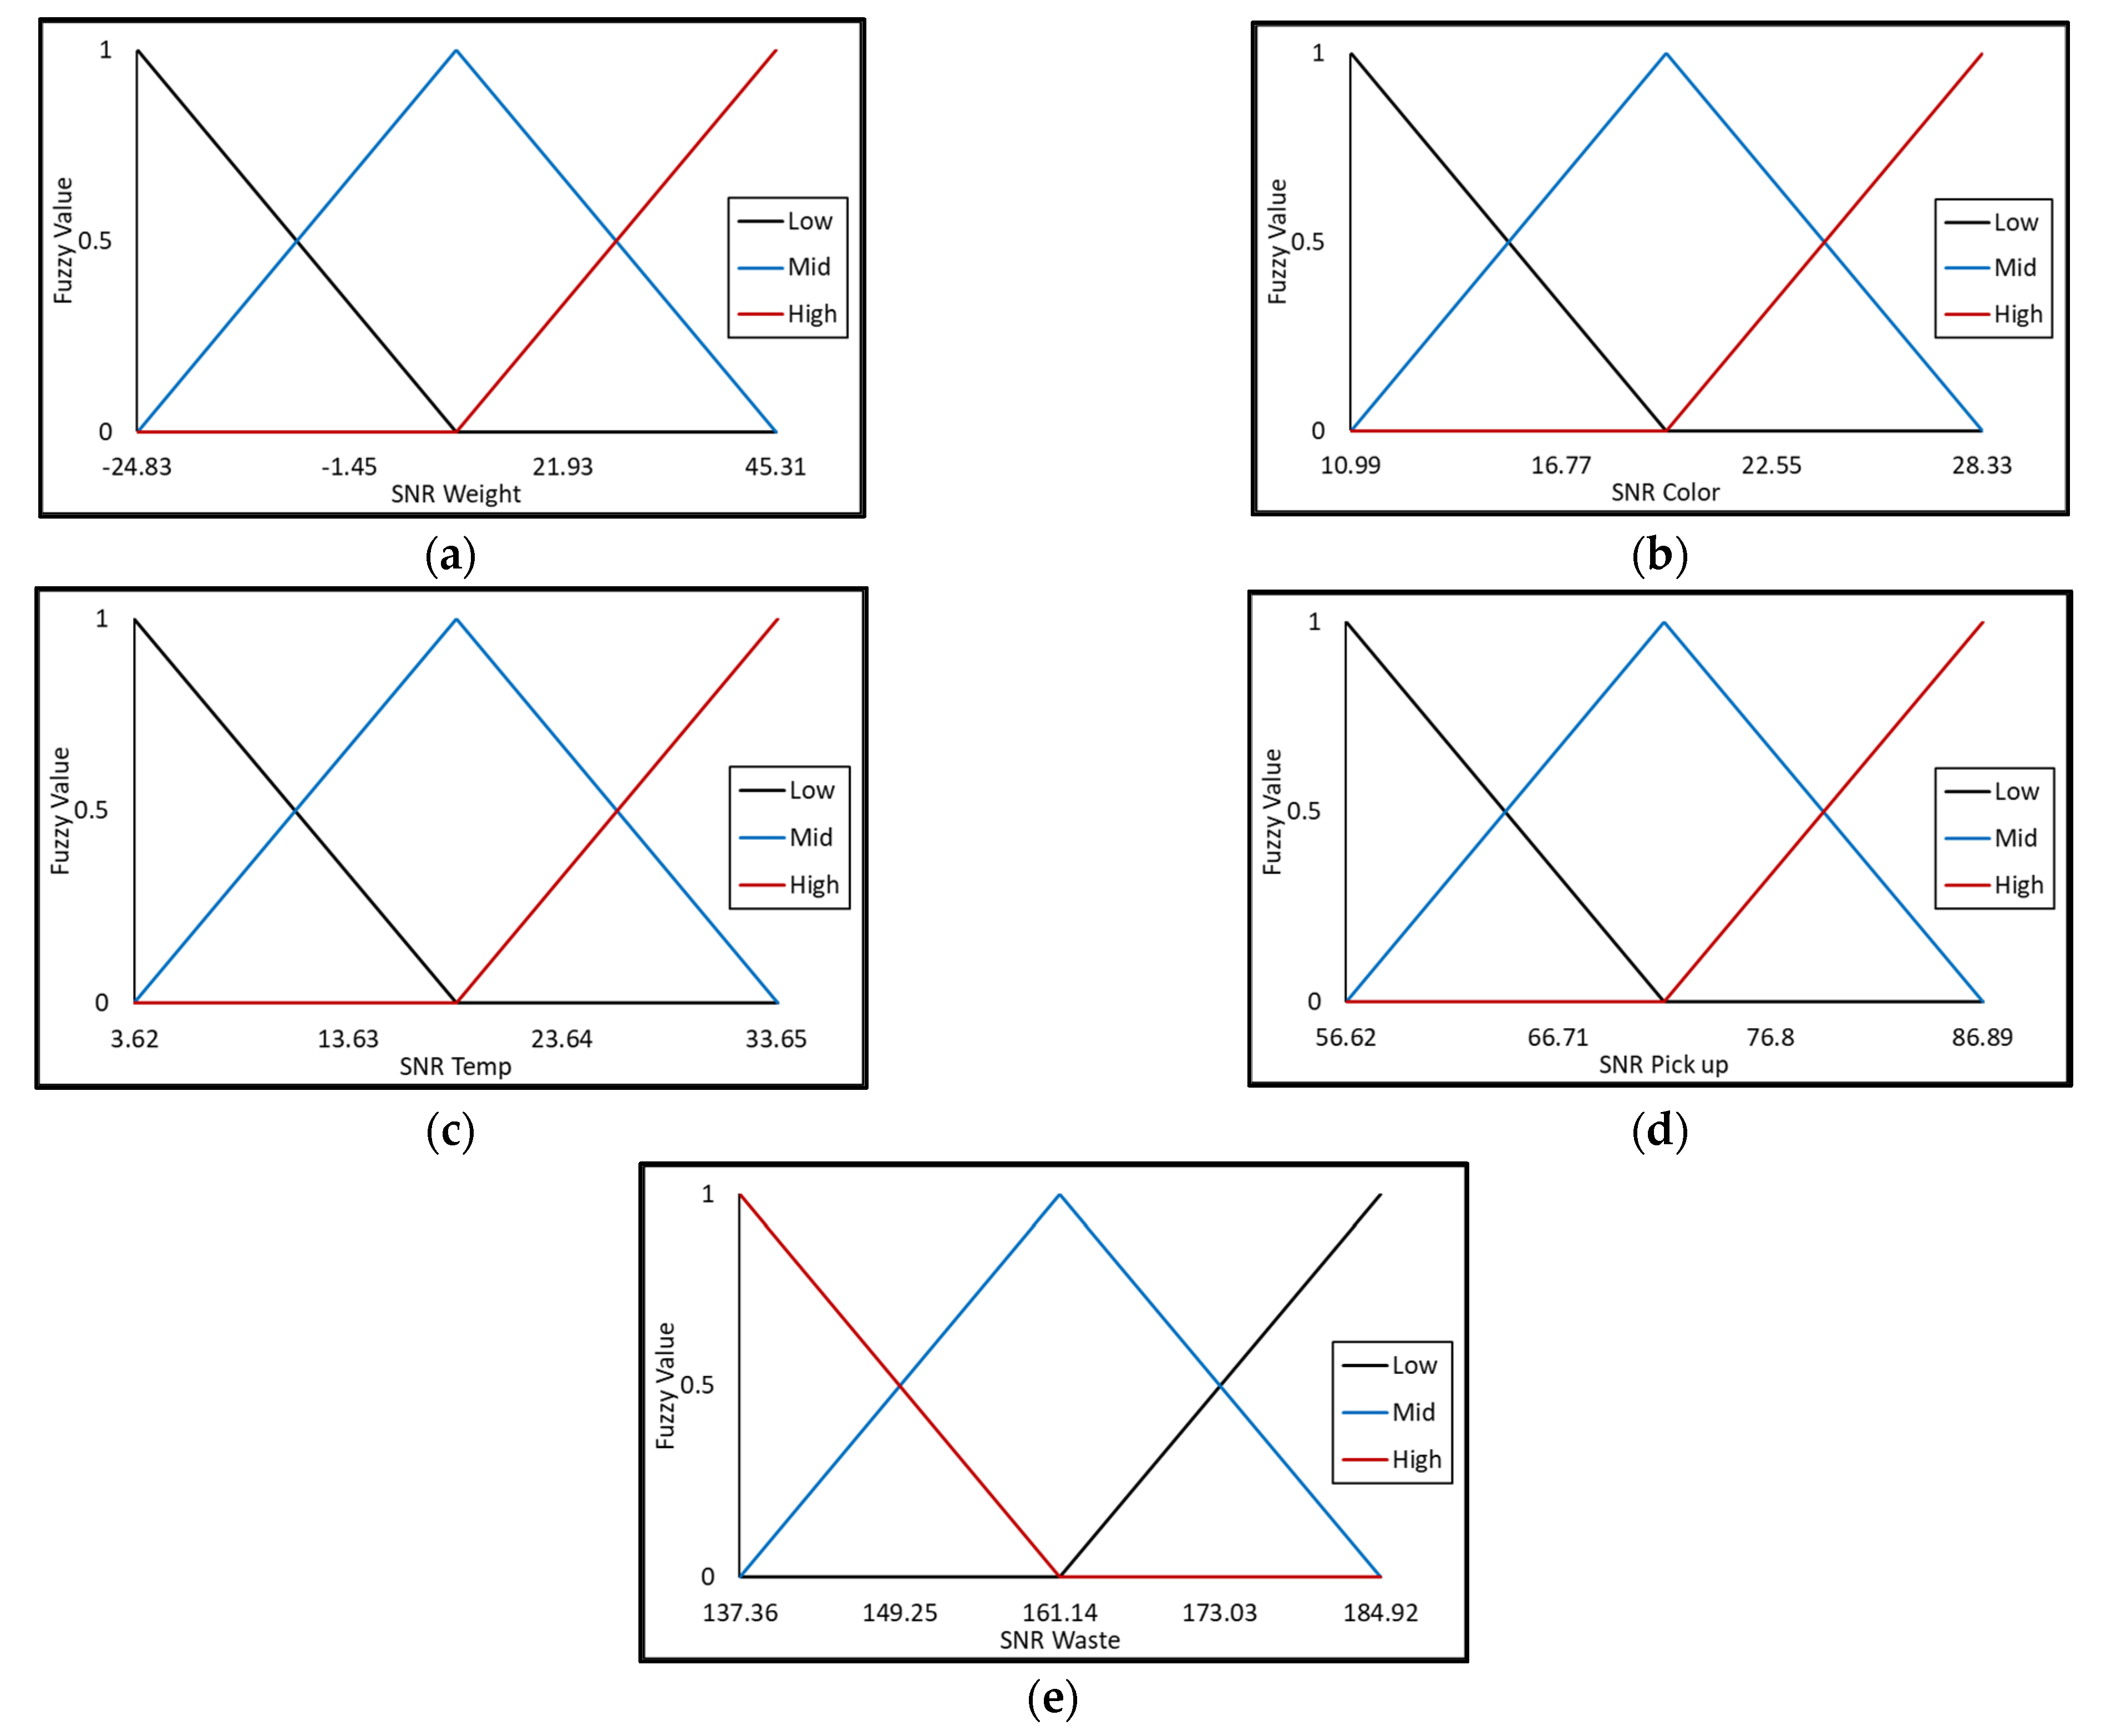
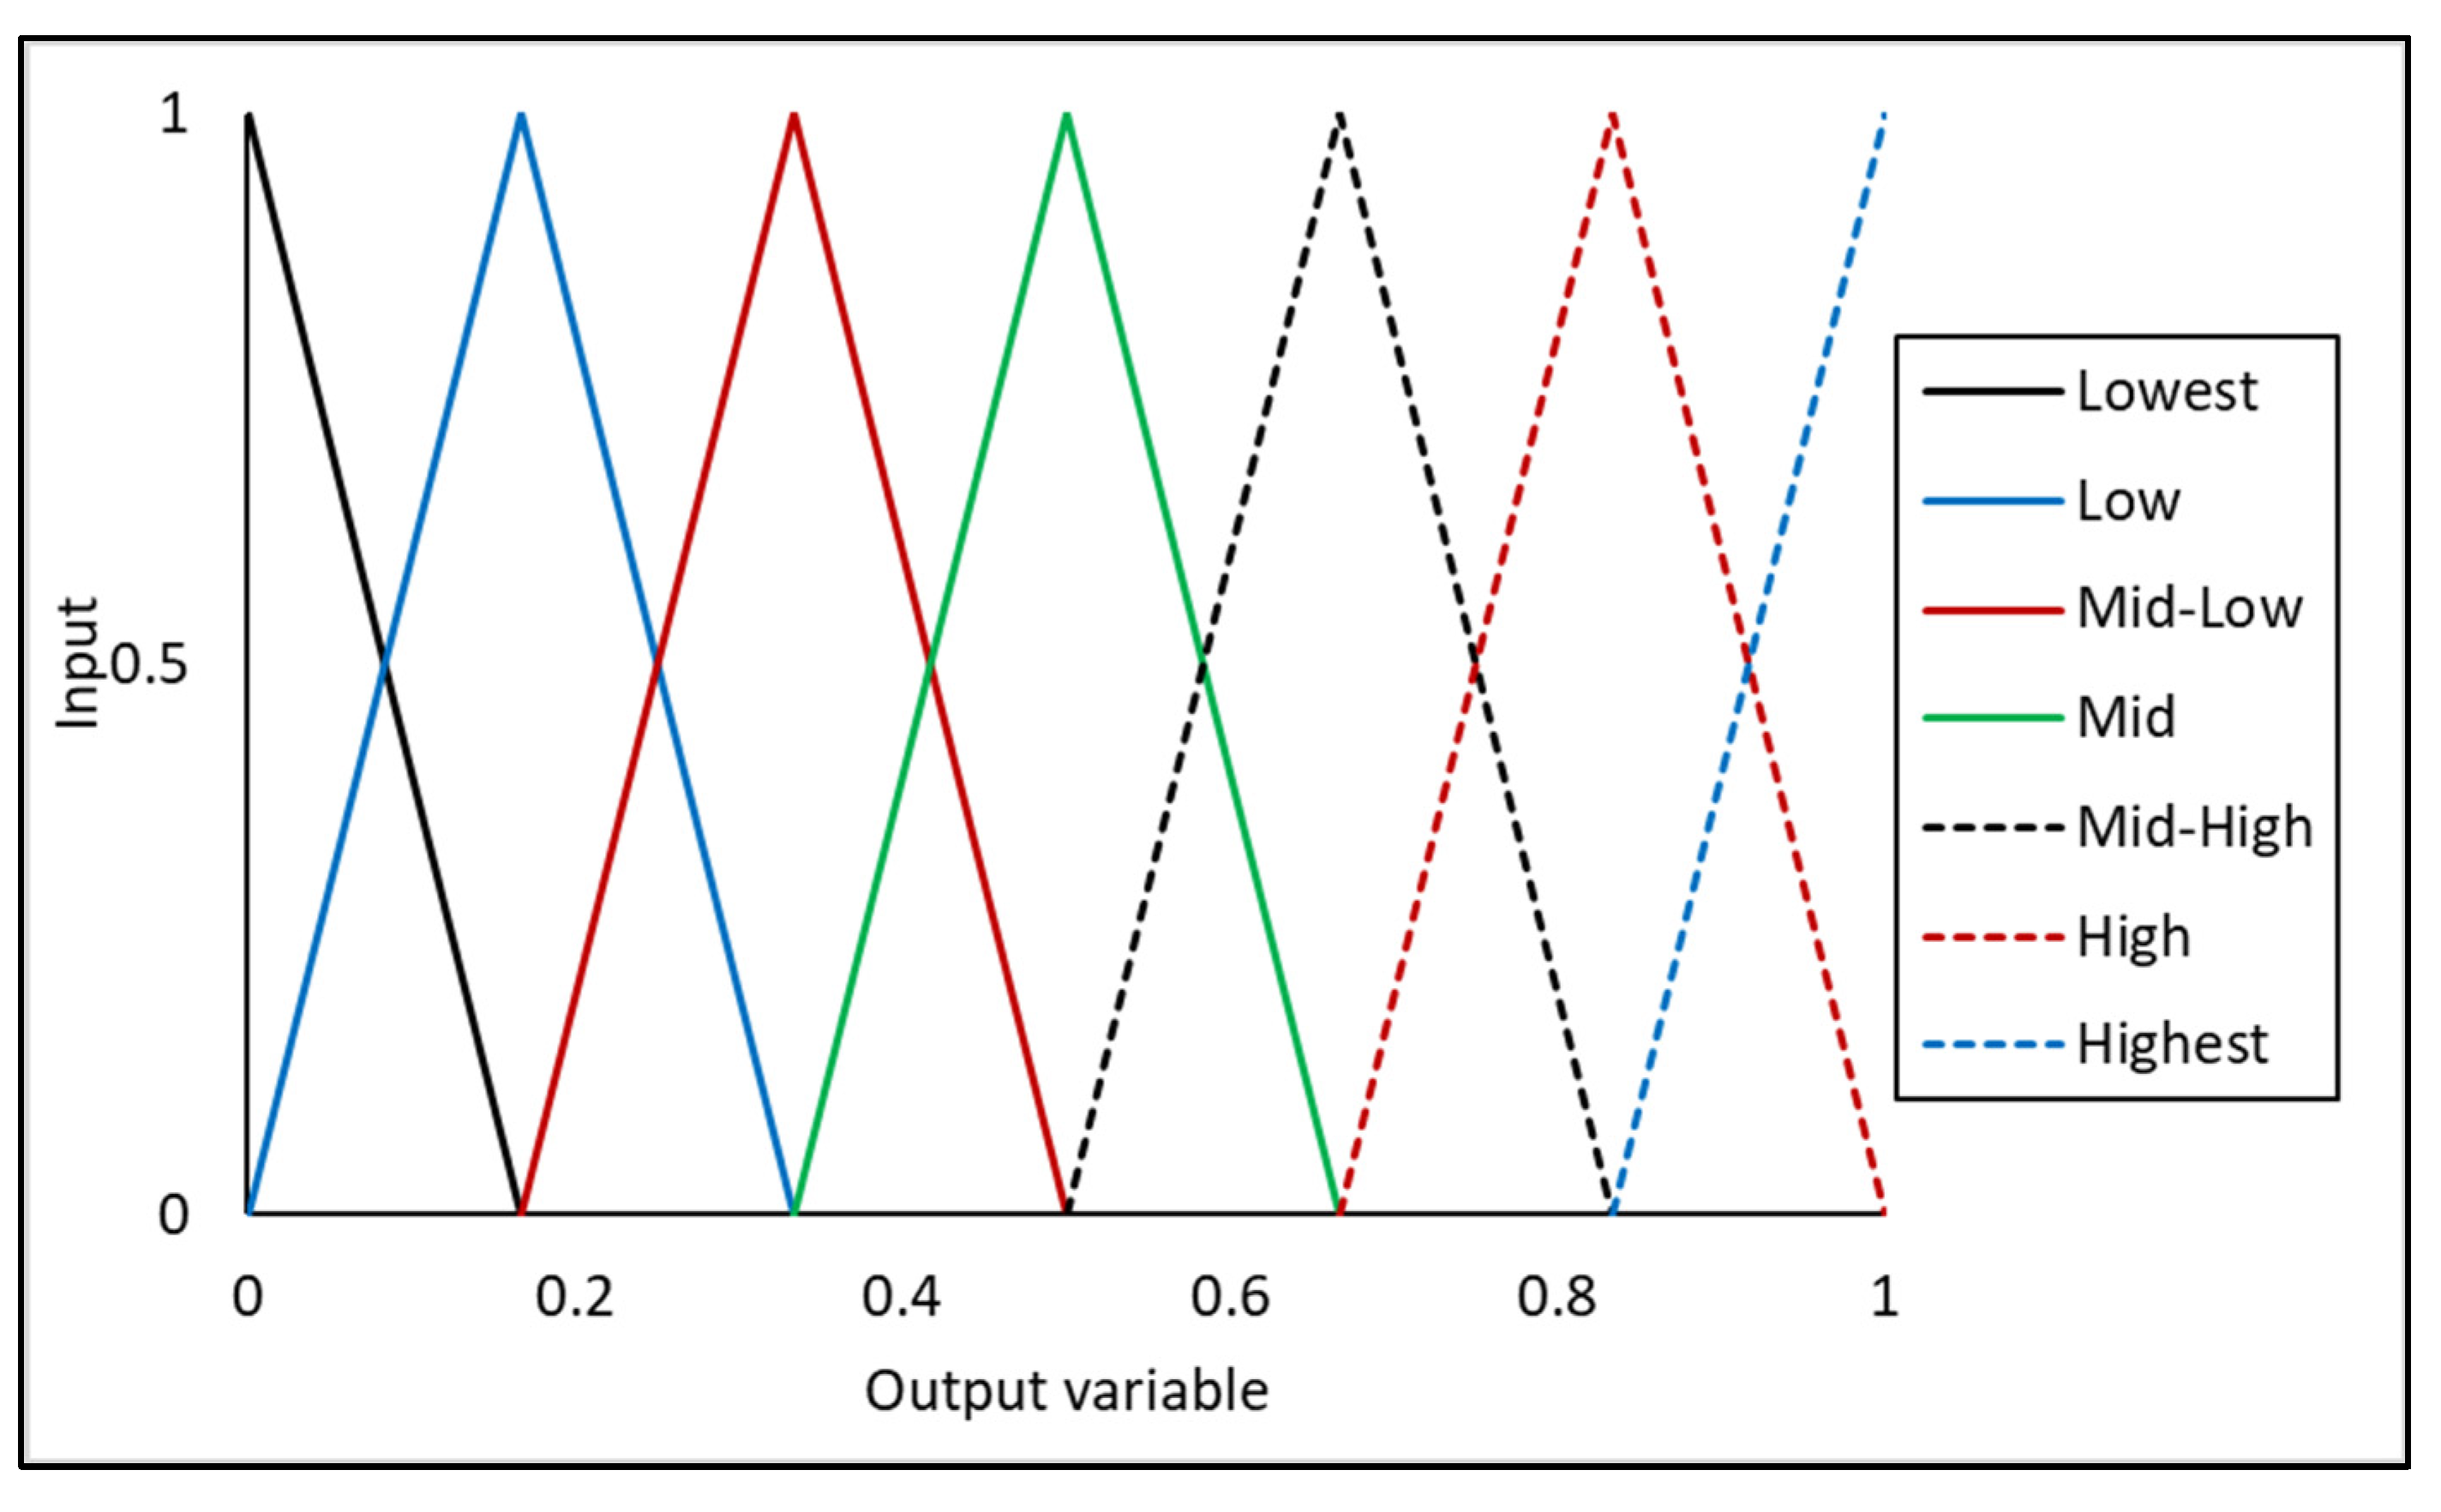
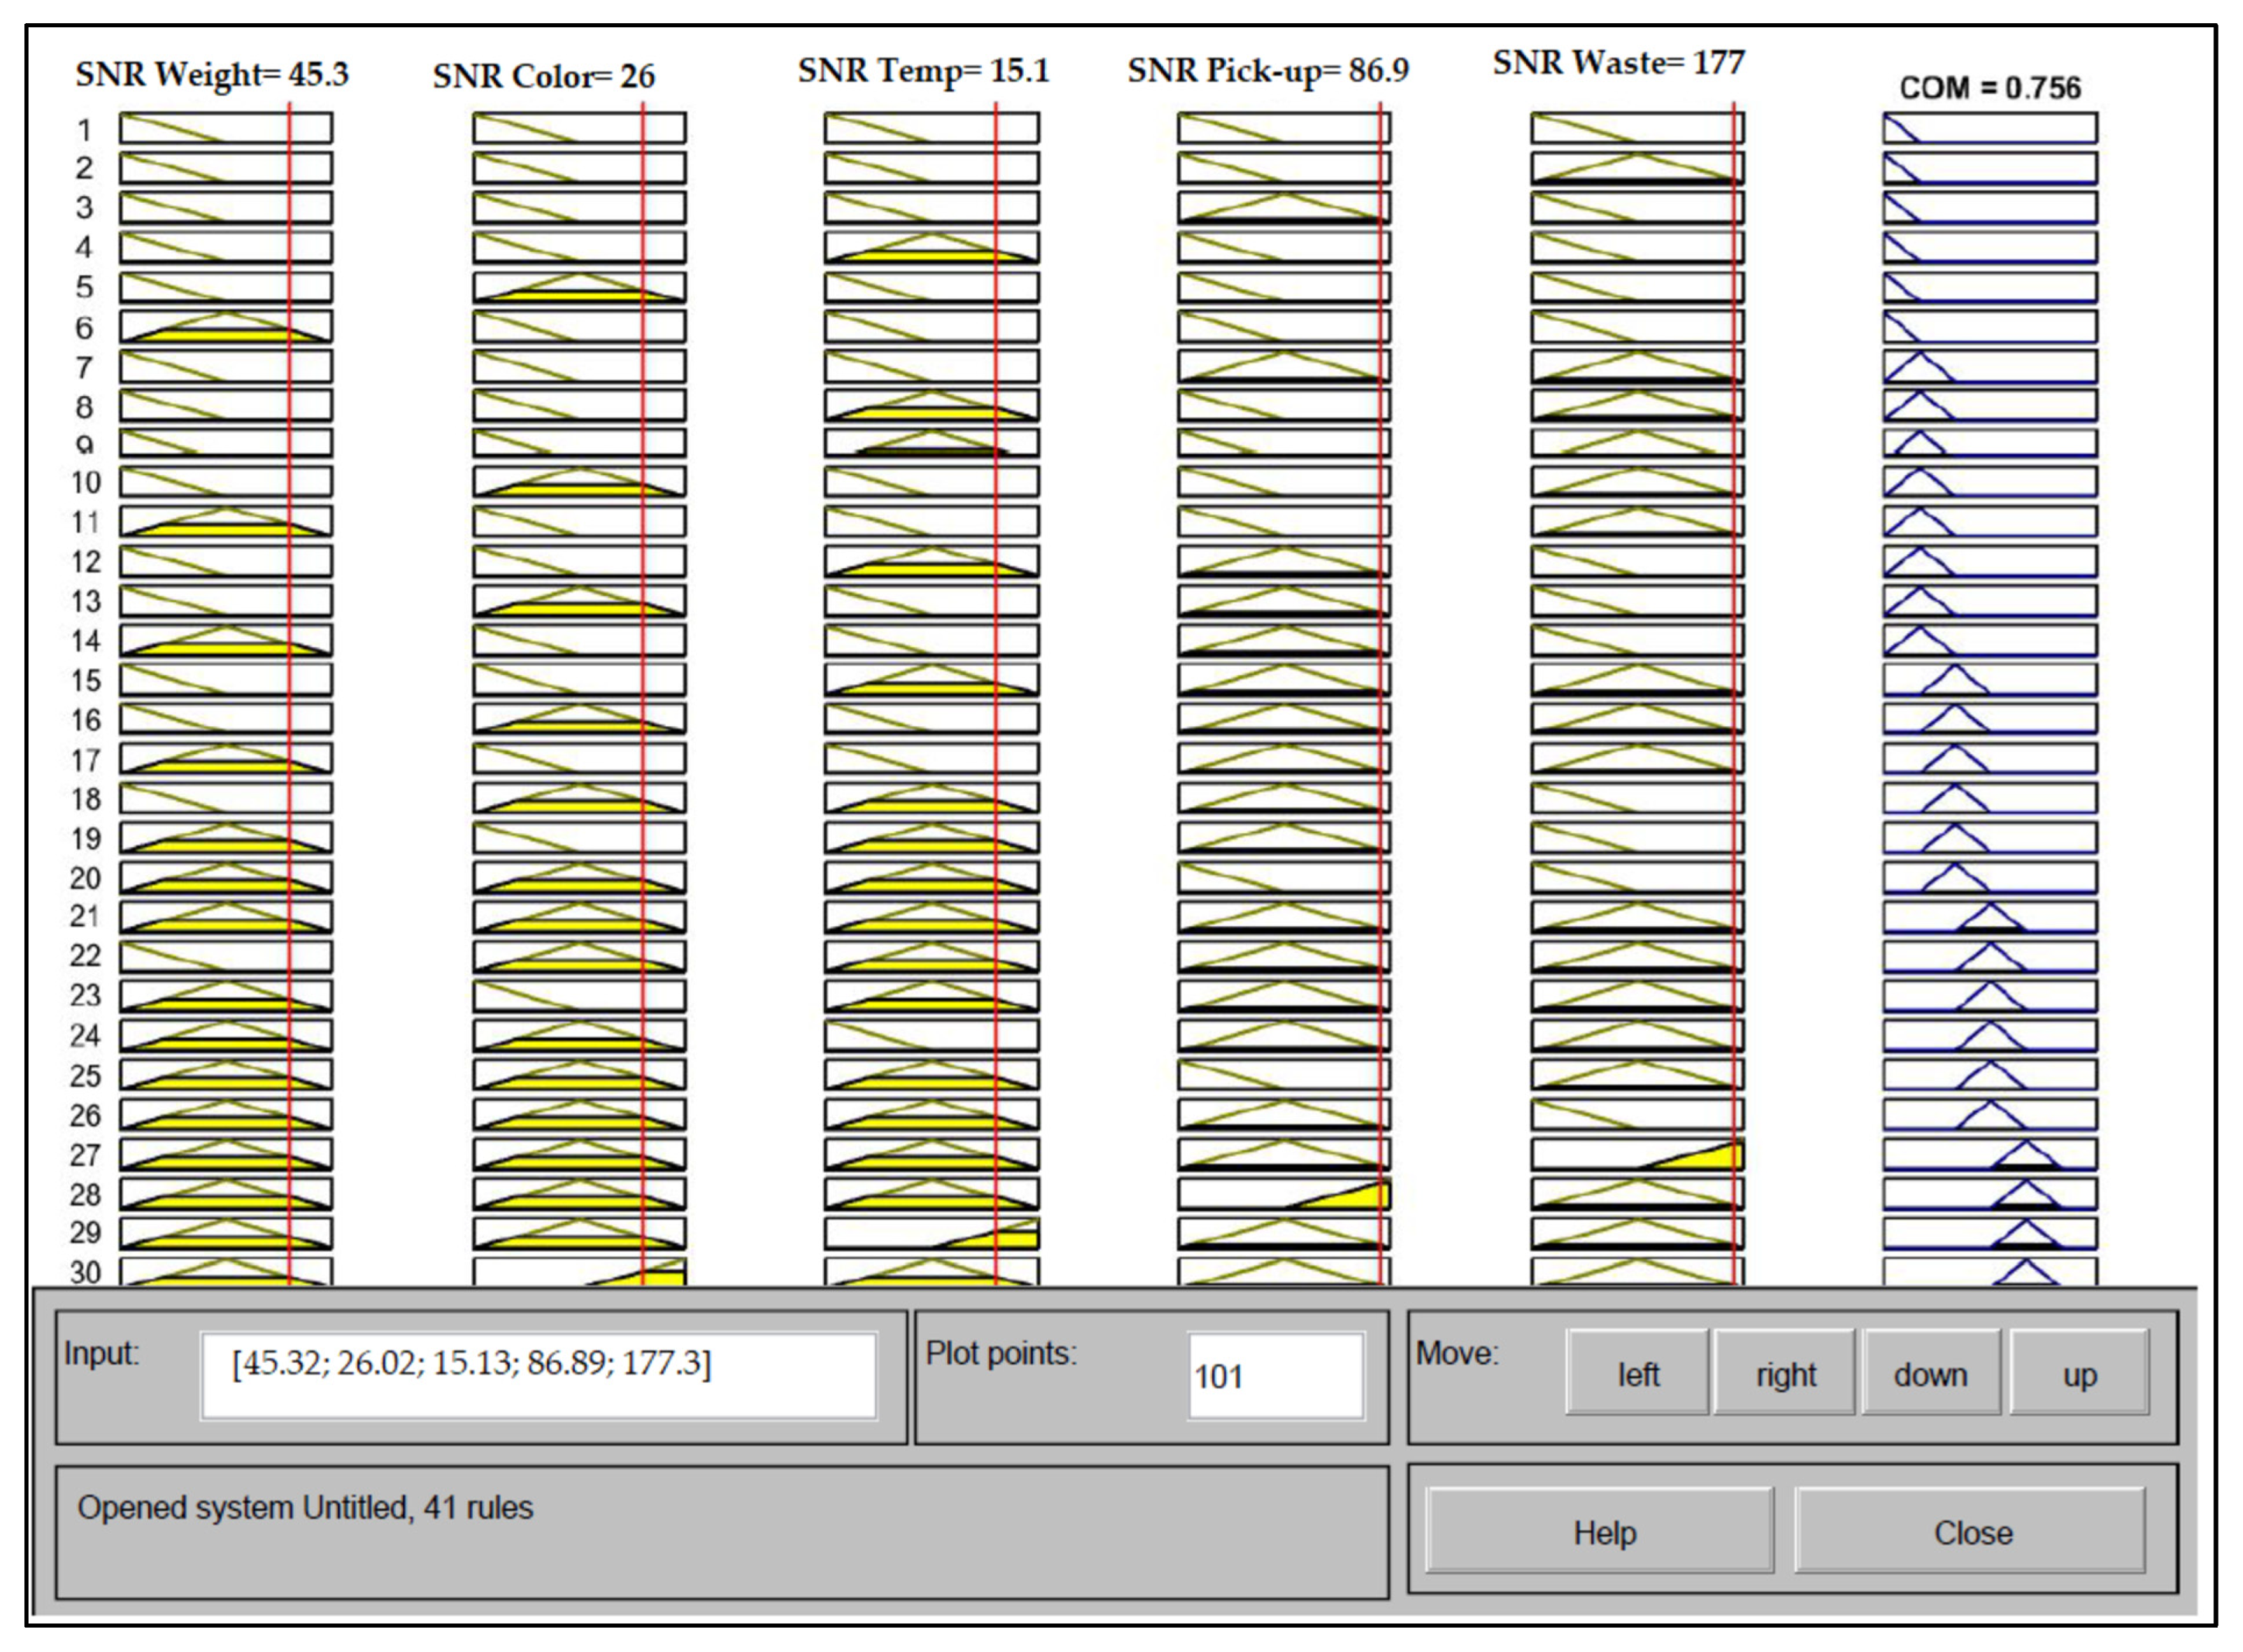
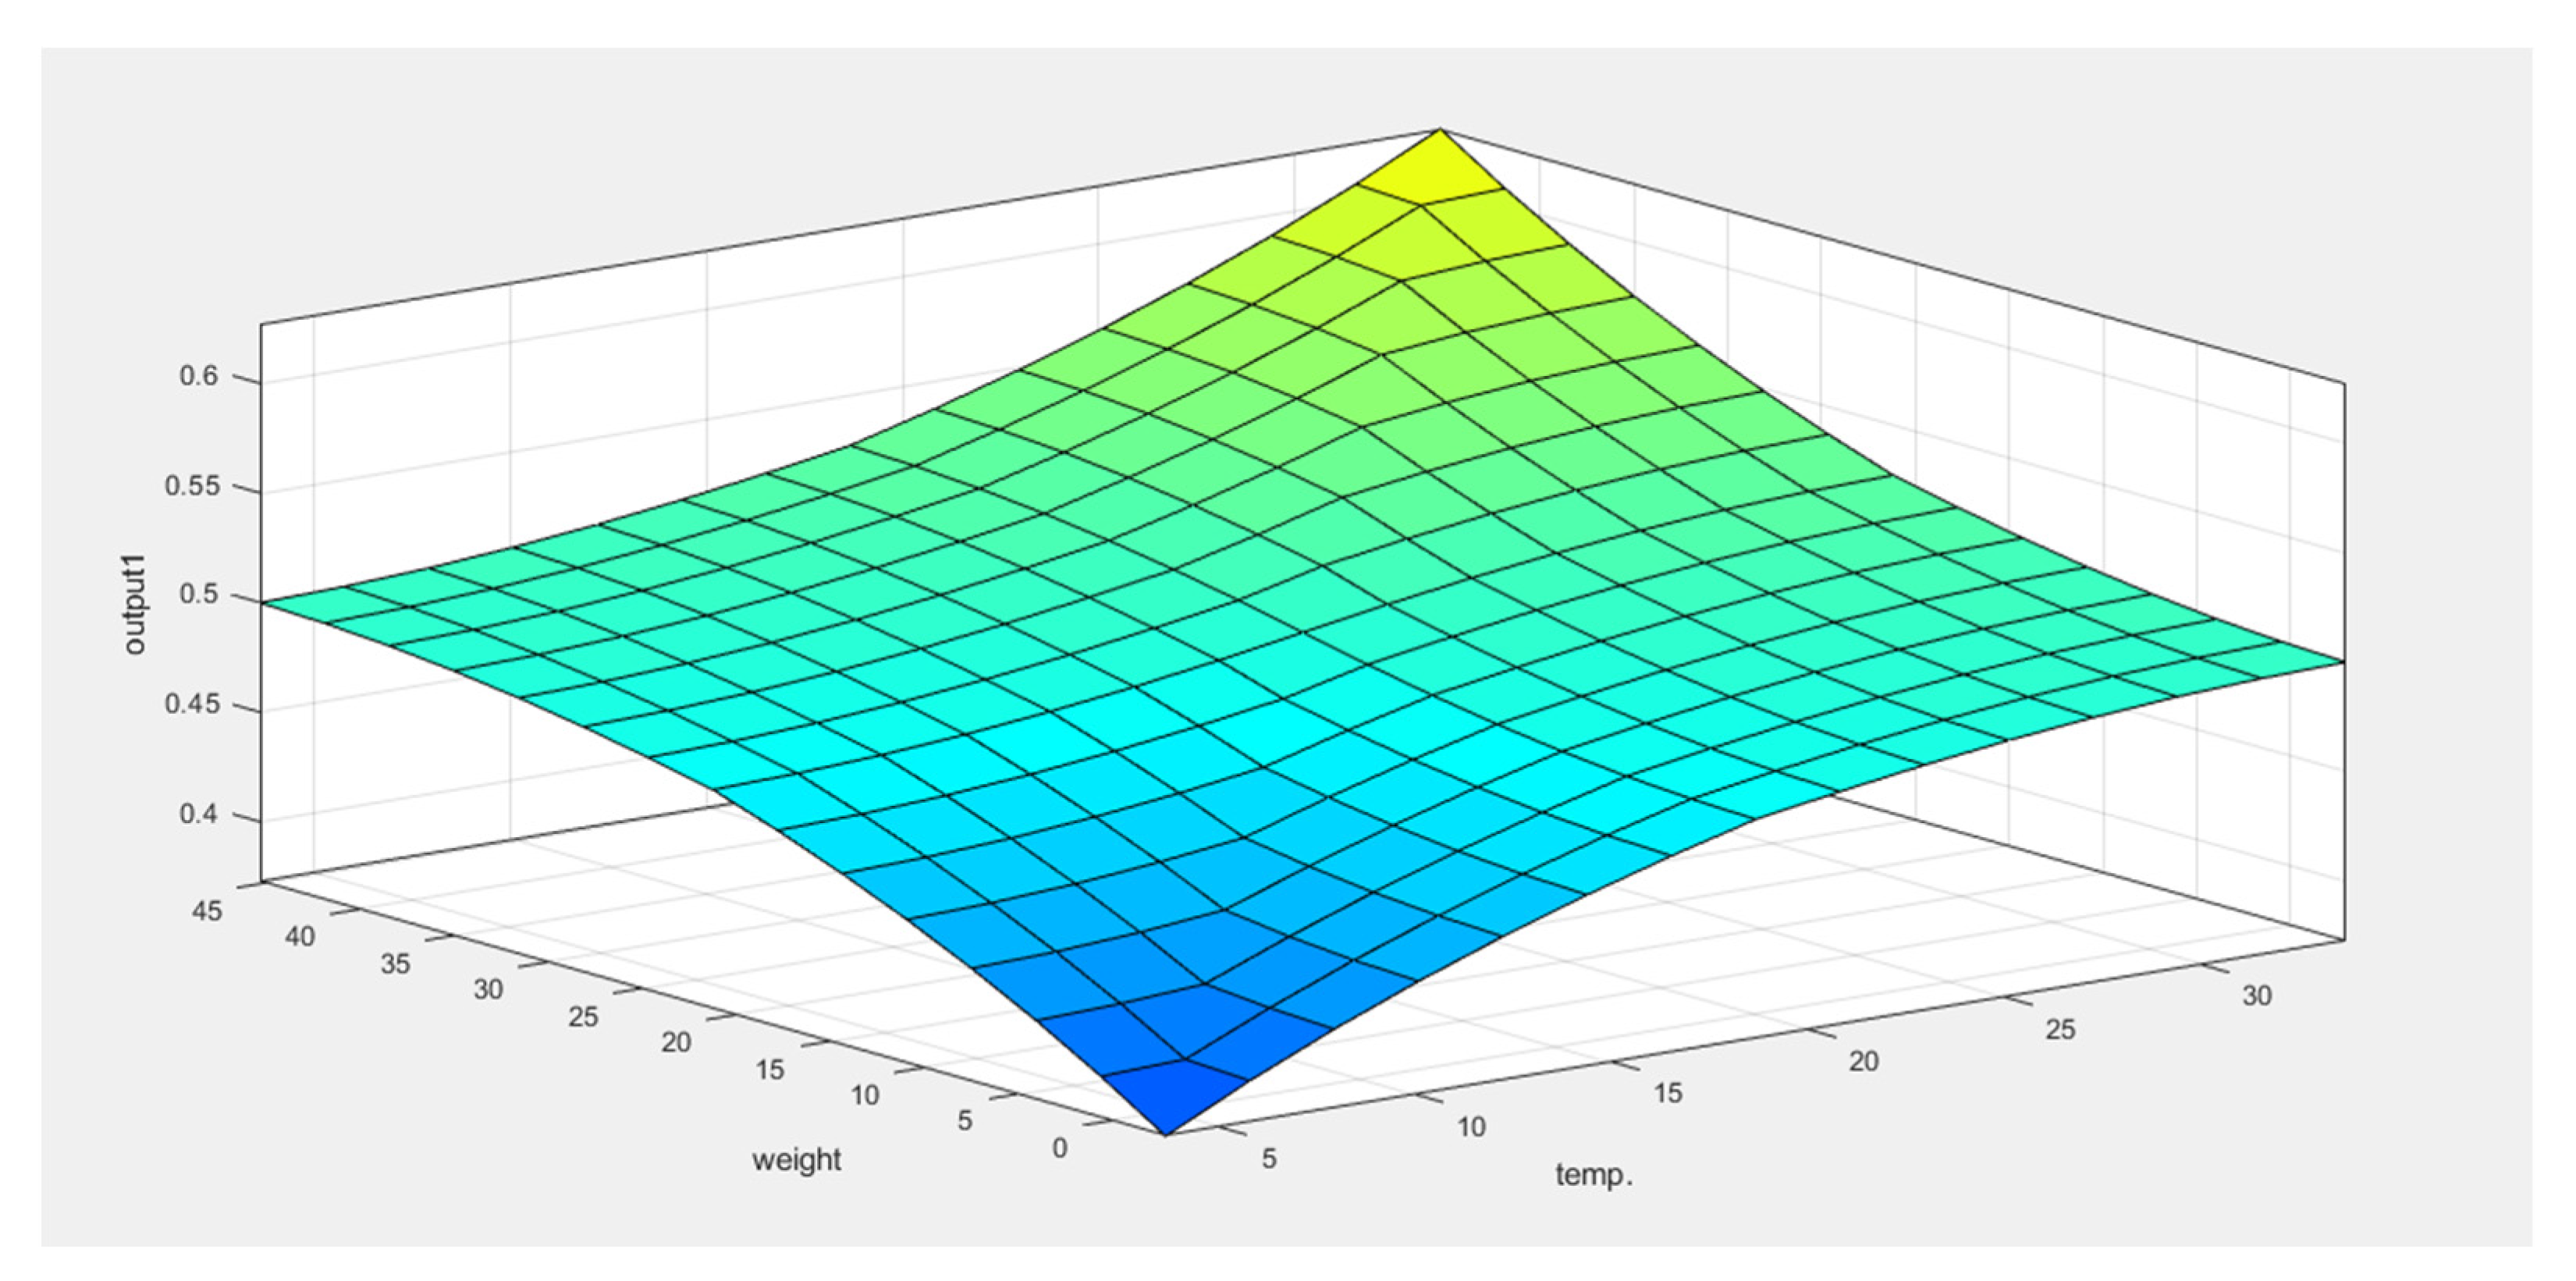
In the presented study, a case study in the food industry is investigated under which a multi-response problem is considered. The main aim is to achieve high quality in terms of (piece/product) best flavor, surface texture, dimensional accuracy, color, and high production rate. This will also consider reducing variability between (pieces/products), and machining economy in terms of cost savings. Moreover, other considerations will include increasing the performance and productivity (of the lines/machines) with the best utilization and the least amount of required rework, which comes in accordance with increasing customer satisfaction. The Taguchi-Fuzzy model has been used to optimize the process and to find the optimal settings of the controllable factors that achieve a target value of the mean and minimize the variability of all quality characteristics.

2. Materials and Methods

2.1. PDCA framework

The PDCA (also known as Deming cycle, Shewhart cycle) is well known as a simple lean manufacturing tool, enabling companies to focus on continuous improvement. Thus, it is considered as an approach to developing process improvement at the organizational level. This, in turn, will affect the companies’ practices for solving problems, managing changes, and updating their working procedures and practices accordingly [47].
Figure 1 illustrates the four stages of the PDCA cycle: Plan: where problems are identified, the current state of the process is evaluated using related data, and solutions are proposed to improve the process performance and assign priorities. Do: where several experiments, along with statistical tools, are used to analyze the data and obtain results. Check: where an analysis of the results obtained from the previous phases and comparisons are implemented to check for improvements and goals achievement. Act: where techniques are implemented if the target is achieved in the efforts made to standardize improvements. New data might be gathered to retest the improvement if conditions are changed, and the proof is repeated if effective improvements were not achieved.

2.2. Taguchi Method

The Taguchi method is a robust statistical design method under which the process parameters are optimized to minimize the variation. This method is commonly used to improve the quality of the manufactured goods. The Taguchi method uses special designs of orthogonal arrays to minimize the number of experiments, while considering all design factors. It includes several steps, which start by creating the Taguchi Design. Orthogonal arrays are established to investigate the effect of the process factors on the process performance. After the proposed experiments are performed the SNRs are calculated for each response, based on the quality characteristic category. The quality responses can be classified into three categories: larger-the- better (LTB), smaller-the-better (STB) and nominal-the-best (NTB). The SNR is classified in the LTB category, regardless of the original category of the quality response [48]. The conversion equations from the original form of the quality responses to SNR from are shown in Equations (1)–(3):
SNR STBi = 10 log   [ ( 1 / K )   K = 1 K y i k ^ 2 ]
S N R N T B i = 10 l o g [ Y ¯ 2 s i 2 ]
SNR LTBi = 10 log   [ ( 1 / K )   K = 1 K 1 / y i k ^ 2 ]
where K represents the number of replicates, yik represents the quality response value at experiment i and replicate k, and Yi-bar is the average value of the quality response for different replicates at experiment i. After determining the SNR values for all responses, the optimal factor settings were found for each quality response individually by calculating the average SNR at each factor level. The optimal factor setting represents the factor levels that have the largest SNR. Since the optimal factor settings for each quality response are different, other optimization tools need to be implemented to deal with multi-response problems. In the current study, the fuzzy logic technique was employed as an optimization tool where the SNR values for each response were utilized as inputs for the fuzzy system.

2.3. Fuzzy Logic

Fuzzy logic is a method of processing variables that enables the estimation of several potential truth values through a single variable. It tries to resolve issues using an open, imperfect spectrum of facts and heuristics that enables the production of a variety of exact conclusions. Fuzzy logic is intended to solve problems by considering all available data and selecting the optimal course of action given the input. In this study, the fuzzy logic (Mamdani-style fuzzy inference) is utilized to convert multiple quality characteristics into a single response (COM) value. Linear function was implemented for inputs and output membership functions (MFs). The Mamdani-style fuzzy inference procedure consists of four phases: Fuzzification of the inputs under which the SNRs are used to define the MF for each quality characteristic by defining values to represent the fuzzy subsets. The fuzzy rules are then evaluated, depending on the inputs, output measure, and the rules that connect the input to the output. Aggregation of the rule outputs is then implemented, where the fuzzy rules are used to identify the MFs of the output. The fuzzy reasoning of the rules and max–min composition operation is used to produce the output where the minimum operation is used in the AND fuzzy operation, and the maximum operation is used in the OR fuzzy operation. Defuzzification is then used to convert the inference output into a nonfuzzy COM value. The center of gravity method (COG) is utilized as a Defuzzification method, which is applied to convert the fuzzy value into a non-fuzzy (COM) value where higher COM values indicate a better performance. Average COM values at each factor level are then computed, and the level with the highest COM value will indicate the optimal level for the factor [49].

3. Results and Discussion

3.1. Plan Step

In this phase, the product and the production line under investigation are identified, and a process flowchart is created to provide insights about the process under consideration. Data are also collected to identify factors affecting the quality characteristics of interest, and their levels. Outputs of interest were also determined, and a systematic plan for process optimization was established. The product selected for investigation is the pre-cooked chicken fillet. The product passes through several processes, each of which includes several inputs and a number of both controllable and uncontrollable factors. According to the standard operating procedure, the product passes through the receipt of raw materials, preparation, forming, and packaging, as shown in Figure 2. A thorough research revealed that the forming process—which also includes coating, frying, cooking, and freezing—is the major process of interest. Moreover, the investigation indicated the factors of interest, which include production speed, frying time, cooking time and coating ratio. The response variables considered for improvement include weight, color, final temperature, pick up and waste.

The Optimization Procedure

The systematic approach used for the optimization is established as shown in Figure 3. The orthogonal array is built for the Taguchi technique, where the rows correspond to the combination of experimentally utilized factor levels and the columns that correspond to the factors to be examined. Table 1 shows the levels for the studied factors. The quality characteristics are classified into three categories: smaller-the-better (STB), larger-the-better (LTB), and nominal-the-best (NTB). The levels are determined for each controllable factor within the specification limit, as shown in Table 1.
Quality characteristics considered include Weight (g), Color, Final Temperature (°C), Waste (Loss amount of Coating in g) and pick up (coating gain ratio), as defined by Equation (4):
Pick   up   ( Coating   Gain   Ratio ) = F i n a l   w e i g h t I n i t i a l   w e i g h t w e i g h t   %

3.2. Do Step

To ensure that the process is in statistical control, twenty samples of size 10 were taken for each quality response, at different intervals of the production time. Table 2 shows a sample of the temperature response. Both the normality tests and the capability tests were performed to ensure that the data follow a normal distribution, and that the process meets the specifications. Figure 4 shows the Xbar-S control chart for the temperature response. Based on the control chart, the process is in control and the DOE method can be implemented. The OA of the Taguchi method is then constructed to represent the controllable factors and their combination levels, as shown in Table 3. The experimental setup is based on the OA, where each experiment was repeated for four runs. Samples studied represent 1 kg of the chicken pieces, as for each experiment 200 kg of chicken pieces was used. The five outputs were measured in the first experiment on four runs. A sample of the Experimental data is shown in Table 4.

3.3. Check Step

The responses are classified into the proper categories to calculate the SNR. These categories are Smaller-The-Better (STB), the Larger-The-Better (LTB), and the Nominal-The-Best (NTB) [25]. For example, weight, temperature, color and pick up were set as nominal-the-best, whereas waste is set as smaller-the-better. The SNR analyzes the mean of the responses and calculates the responses’ deviations from the target. Thus, the SNR will determine the optimal factor levels. For the studied responses, the SNRs were computed based on the four runs of the L9 experiment. Table 5 shows a sample of the SNR for the weight response. Table 6 shows the SNR values chosen for each response, where the larger the value is, the better is the performance.

3.4. Act Step

3.4.1. Optimal Factor Levels for a Single Response

The optimal settings for the factors were chosen based on the largest value of the average SNR, where the average SNR is computed for each factor level. The optimal settings were obtained for each response as shown in Table 7 and Table 8. Table 9 shows a summary of the optimal factors setting at each response.

3.4.2. The Optimal Factor Levels for the Multi-Response Problem

The responses are combined into a one single response using fuzzy inference in the Mamdani method; they served as inputs for the fuzzy system, as depicted in Figure 5. The fuzzification of the inputs shown in Table 10 requires the identification of three MFs as Low, Mid, and High, for each input. The MFs for the five quality responses are displayed in Figure 6. Then, the 243 rules were developed based on the quantity of fuzzy inputs, as indicated in Table 11. The rule aggregation is used to define the output MFs, as illustrated in Figure 7 and Figure 8. Seven MFs were used by the fuzzy system (Lowest, Low, Mid-low, Mid, Mid-high, High, and Highest). Each one of the output MFs has a different rule combination. For example, the Highest output MF has the rule that contains five High input MFs. On the other hand, the Lowest output MF has five Low input MFs. Table 12 represents the input combinations versus the targeting output MF. The defuzzification step includes converting the fuzzy values into a COM value, using the center of gravity method (COG). The COM values for the experimental combinations are shown in Table 13. After determining the COM values at the experimental combinations, the average COM values were found at each factor level as shown in Table 14, based on the highest COM value for each factor, where they represent level 1 for factor 1 (speed), level 3 for factor 2 (frying time), level 1 for factor 3 (cooking time), and level 1 for factor 4 (ratio).
After obtaining the optimal factor settings, those were implemented in the production line and data were collected to ensure that the process was in control and the improvement was achieved. At various points during the production process, twenty samples of size 10 were taken for each quality response. Table 15 displays a sample of the temperature response data. Figure 9 displays the X-bar and S control charts for the temperature response, indicating that the process is under control. Based on the Taguchi approach, the analysis findings suggested the ideal factor values for each quality response. For example, Table 16 shows that to optimize the weight as a single response, the factors studied including the speed, frying time, cooking time, and the ratio should be set at 1250, 30, 7.5, and 1:2, respectively. On the other hand, the use of the fuzzy system provided an average COM value for each factor level, and the highest value for the average COM represented the optimal level for the studied factors. Based on the results, the optimal factor levels including the speed, frying time, cooking time, and the ratio should be set at 1250, 40, 7.5, and 1:2, respectively, to optimize all quality responses as shown in Table 17. Figure 10 shows the surface charts that help to clarify how each input parameter on the fuzzy system relates to the others. The mean for the analyzed quality responses shifted closer to the target after applying the best factor settings, demonstrating the success of the applied optimization strategy for the examined case study. For example, at the initial setting for the pick up, the mean of the pick up collected data was 23.79%, whereas this value changed to 23.6% after implementing the optimal factor settings. The anticipated results of the improvement index were 0.0039 and 0.00305, respectively.
Several studies have explored the effects of process parameters on the output quality characteristics, using multi-criteria decision-making techniques and fuzzy logic in the food industry. In similar applications, some studies examined the optimization of process performance for other quality responses. For example, Hosseinpour and Martnenko evaluated the food quality by implementing multi-dimensional fuzzy sets. In their study, the authors investigated a shrimp production line. A total of 27 quality responses were considered in the study, which were combined in nine orthonormal vectors. The artificial neural networks approach was employed to convert the real time data into a multi-dimensional fuzzy inference system. Finally, a Multi-dimensional kinetic model was introduced to predict the food quality [50]. Vivek et al. proposed a new methodology for evaluating the food products quality, based on sensory quality responses. Five quality attributes (color, aroma, taste, mouthfeel, and texture) were merged, using a fuzzy inference system (additive rule models and non-additive rule models). The outcome from the fuzzy logic was extensively utilized to enhance the classification of the products into accepted and rejected products, along with weak and strong quality performance for both the existing and new food products [51].

4. Conclusions

The presented study investigated a multi-response optimization problem case study in the food industry using the Taguchi optimization method. The signal-to-noise (SNR) was used, along with a special design of orthogonal arrays (OA). In SNR, the optimal factor levels for each quality response can be obtained. The single response (COM) value can be obtained by using the Mamdani fuzzy inference method, under which the SNR values were used as inputs to generate the COM values. Three MFs were defined for each input variable, and seven MFs were established for the output variable. The fuzzy rules were generated based on the input and output MFs, and COG was utilized as a defuzzification method. The average COM values were then determined for each factor level to determine the optimal factor settings. Results indicated the effectiveness of the applied method, to find the optimal factor levels for the multi-response optimization problem under investigation.

Author Contributions

Conceptualization, R.A.A., D.B.H. and M.T.; methodology, M.T., M.R., D.B.H. and R.A.A.; validation, R.A.A. and D.B.H.; formal analysis, R.A.A.; investigation, D.B.H.; resources, M.T. and D.B.H.; data curation, R.A.A. and Z.A.; writing—original draft preparation, R.A.A., M.T. and D.B.H.; writing—review and editing, M.T. and D.B.H.; visualization, D.B.H.; supervision, M.T. and D.B.H.; project administration, R.A.A. and D.B.H. All authors have read and agreed to the published version of the manuscript.

Funding

This research received no external funding.

Data Availability Statement

The datasets generated during and/or analyzed during the current study are available from the corresponding author on reasonable request.

Conflicts of Interest

The authors declare no conflict of interest.

References

  1. Park, G.J. Design of experiments. In Analytic Methods for Design Practice; Springer: Cham, Switzerland, 2007; pp. 309–391. [Google Scholar]
  2. Eriksson, L.; Johansson, E.; Kettaneh-Wold, N.; Wikström, C.; Wold, S. Design of experiments. In Principles and Applications; Learn ways AB: Stockholm, Sweden, 2000. [Google Scholar]
  3. Pukelsheim, F. Optimal Design of Experiments; Society for Industrial and Applied Mathematics: Philadelphia, PA, USA, 2006. [Google Scholar]
  4. Alagumurthi, N.; Palaniradja, K.; Soundararajan, V. Optimization of grinding process through design of experiment (DOE)—A comparative study. Mater. Manuf. Processes 2006, 21, 19–21. [Google Scholar] [CrossRef]
  5. Al Athamneh, R.; Hani, D.B.; Ali, H. Fatigue life degradation modeling of SnAgCu solder joints after aging. IEEE Trans. Compon. Packag. Manuf. Technol. 2020, 10, 1175–1184. [Google Scholar] [CrossRef]
  6. Durakovic, B. Design of experiments application, concepts, examples: State of the art. Period. Eng. Nat. Sci. 2017, 5, 421–439. [Google Scholar] [CrossRef]
  7. Ahmadabadi, H.Z.; Zamzam, F.; Meybodi, F.R.; Streimikiene, D.; Mardani, A. Development of a New Sesame Product using QFD and DOE methods: A Case Study of Sesame Product in Yazd. Montenegrin J. Econ. 2018, 14, 27–44. [Google Scholar] [CrossRef]
  8. Ćućuz, V.; Cvejić, J.; Torović, L.; Gojković-Bukarica, L.; Acevska, J.; Dimitrovska, A.; Galanakis, C.M. Design of experiments (DoE) to model phenolic compounds recovery from grape pomace using ultrasounds. J. Food Sci. Technol. 2021, 59, 1–12. [Google Scholar] [CrossRef]
  9. Kumar, C.C.; Naidu, N.V.R.; Kadadevaramutt, R.S. Developing models of DOE and simulation to maximise output of tomato concentrated pulp processing unit. Int. J. Bus. Syst. Res. 2018, 12, 441–453. [Google Scholar] [CrossRef]
  10. Oliveira, L.; Santos, J.C.; Panzera, T.H.; Freire, R.T.S.; Vieira, L.M.G.; Scarpa, F. Evaluation of hybrid-short-coir-fibre-reinforced composites via full factorial design. Compos. Struct. 2018, 202, 313–323. [Google Scholar] [CrossRef]
  11. Santos, J.C.d.; de Oliveira, L.Á.; Vieira, L.M.G.; Mano, V.; Freire, R.T.S.; Panzera, T.H. Eco-friendly sodium bicarbonate treatment and its effect on epoxy and polyester coir fibre composites. Constr. Build. Mater. 2019, 211, 427–436. [Google Scholar] [CrossRef]
  12. de Olveira, L.Á.; Santos, J.C.d.; Panzera, T.H.; Freire, R.T.S.; Vieira, L.M.G.; Rubio, J.C.C. Investigations on short coir fibre-reinforced composites via full factorial design. Polym. Polym. Compos. 2018, 26, 391–399. [Google Scholar] [CrossRef]
  13. Beg, S.; Swain, S.; Rahman, M.; Hasnain, M.S.; Imam, S.S. Application of Design of Experiments (DoE) in Pharmaceutical Product and Process Optimization. In Pharmaceutical Quality by Design; Academic Press: Cambridge, MA, USA, 2019. [Google Scholar] [CrossRef]
  14. Kechagias, J.D.; Aslani, K.E.; Fountas, N.A.; Vaxevanidis, N.M.; Manolakos, D.E. A comparative investigation of Taguchi and full factorial design for machinability prediction in turning of a titanium alloy. Measurement 2020, 151, 107213. [Google Scholar] [CrossRef]
  15. Zaman, P.B.; Sultana, N.; Dhar, N.R. Quantifying the effects of cooling condition, tool type and cutting parameters on machinability of turning AISI 4140 steel using full factorial DOE. J. Prod. Syst. Manuf. Sci. 2020, 1, 23–39. [Google Scholar]
  16. Moreira, B.R.; Breitkreitz, M.C.; Simister, R.; McQueen-Mason, S.J.; Gomez, L.D.; Rezende, C.A. Improved hydrolysis yields and silica recovery by design of experiments applied to acid-alkali pretreatment in rice husks. Ind. Crops Prod. 2021, 170, 113676. [Google Scholar] [CrossRef]
  17. Rezende, C.A.; Atta, B.W.; Breitkreitz, M.C.; Simister, R.; Gomez, L.D.; McQueen-Mason, S.J. Optimization of biomass pretreatments using fractional factorial experimental design. Biotechnol. Biofuels 2018, 11, 206. [Google Scholar] [CrossRef] [PubMed]
  18. Montgomery, D.C.; Runger, G.C. Applied Statistics and Probability for Engineers; John wiley & sons: Hoboken, NJ, USA, 2010; pp. 553–637. [Google Scholar]
  19. Deepanraj, B.; Sivasubramanian, V.; Jayaraj, S. Multi-response optimization of process parameters in biogas production from food waste using Taguchi—Grey relational analysis. Energy Convers. Manag. 2017, 141, 429–438. [Google Scholar] [CrossRef]
  20. Walia, R.S.; Shan, H.S.; Kumar, P. Multi-response optimization of CFAAFM process through Taguchi method and utility concept. Mater. Manuf. Processes 2006, 21, 907–914. [Google Scholar] [CrossRef]
  21. Antony, J.; Antony, F.J. Teaching the Taguchi method to industrial engineers. Work. Study 2001, 50, 141–149. [Google Scholar] [CrossRef]
  22. Kondapalli, S.P.; Chalamalasetti, S.R.; Damera, N.R. Application of Taguchi based Design of Experiments to Fusion Arc Weld Processes: A Review. Int. J. Bus. Res. Dev. 2015, 4, 1–8. [Google Scholar] [CrossRef]
  23. Fei, N.C.; Mehat, N.M.; Kamaruddin, S. Practical Applications of Taguchi Method for Optimization of Processing Parameters for Plastic Injection Moulding: A Retrospective Review. Int. Sch. Res. Not. 2013, 2013, 462174. [Google Scholar] [CrossRef]
  24. Singh, O.P.; Kumar, G.; Kumar, M. Role of Taguchi and Grey Relational Method in Optimization of Machining Parameters of Different Materials: A Review. Acta Electron. Malays. 2019, 3, 19–22. [Google Scholar] [CrossRef]
  25. Freddi, A.; Salmon, M. Introduction to the Taguchi method. In Springer Tracts in Mechanical Engineering; Springer: Berlin, Germany, 2019. [Google Scholar] [CrossRef]
  26. Tseng, H.C.; Lin, H.C.; Tsai, Y.C.; Lin, C.H.; Changlai, S.P.; Lee, Y.C.; Chen, C.Y. Applying Taguchi Methodology to Optimize the Brain Image Quality of 128-Sliced CT: A Feasibility Study. Appl. Sci. 2022, 12, 4378. [Google Scholar] [CrossRef]
  27. Mehat, N.M.; Kamaruddin, S. Quality control and design optimisation of plastic product using Taguchi method: A comprehensive review. Int. J. Plast. Technol. 2012, 16, 194–209. [Google Scholar] [CrossRef]
  28. Pundir, R.; Chary, G.H.V.C.; Dastidar, M.G. Application of Taguchi method for optimizing the process parameters for the removal of copper and nickel by growing Aspergillus sp. Water Resour. Ind. 2018, 20, 83–92. [Google Scholar] [CrossRef]
  29. Shrestha, S.; Manogharan, G. Optimization of Binder Jetting Using Taguchi Method. JOM 2017, 69, 491–497. [Google Scholar] [CrossRef]
  30. Terzioğlu, H. Analysis of effect factors on thermoelectric generator using Taguchi method. Measurement 2020, 149, 106992. [Google Scholar] [CrossRef]
  31. Srivastava, M.; Rathee, S. Optimisation of FDM process parameters by Taguchi method for imparting customised properties to components. Virtual Phys. Prototyp. 2018, 13, 203–210. [Google Scholar] [CrossRef]
  32. Fratila, D.; Caizar, C. Application of Taguchi method to selection of optimal lubrication and cutting conditions in face milling of AlMg3. J. Clean. Prod. 2011, 19, 640–645. [Google Scholar] [CrossRef]
  33. Esmaeili, H.; Yeganeh, G.; Esmaeilzadeh, F. Optimization of biodiesel production from Moringa oleifera seeds oil in the presence of nano-MgO using Taguchi method. Int. Nano Lett. 2019, 9, 257–263. [Google Scholar] [CrossRef]
  34. Patidar, M.K.; Nighojkar, S.; Kumar, A.; Nighojkar, A. Pectinolytic enzymes-solid state fermentation, assay methods and applications in fruit juice industries: A review. 3 Biotech 2018, 8, 199. [Google Scholar] [CrossRef]
  35. Noorwali, A. Apply lean and Taguchi in different level of variability of food flow processing system. Procedia Eng. 2013, 63, 728–734. [Google Scholar] [CrossRef] [Green Version]
  36. Al Athamneh, R.; Abueed, M.; Bani Hani, D.; Hamasha, S. Fuzzy Approach for Reliability Modeling of Lead-Free Solder Joints in Elevated Temperature Environmental Conditions. Crystals 2022, 12, 775. [Google Scholar] [CrossRef]
  37. Sivasakthivel, T.; Murugesan, K.; Thomas, H.R. Optimization of operating parameters of ground source heat pump system for space heating and cooling by Taguchi method and utility concept. Appl. Energy 2014, 116, 76–85. [Google Scholar] [CrossRef]
  38. İç, Y.T.; Akkoç, F.S.; Gümüşboğa, N.; Ballı, Z. A New Multi-response Taguchi-Based Goal Programming Model for Sustainable Turning Process. Arab. J. Sci. Eng. 2022, 47, 3915–3928. [Google Scholar] [CrossRef]
  39. Sholahudin, S.; Han, H. Simplified dynamic neural network model to predict heating load of a building using Taguchi method. Energy 2016, 115, 1672–1678. [Google Scholar] [CrossRef]
  40. Kickingereder, P.; Isensee, F.; Tursunova, I.; Petersen, J.; Neuberger, U.; Bonekamp, D.; Brugnara, G.; Schell, M.; Kessler, T.; Foltyn, M.; et al. Automated quantitative tumour response assessment of MRI in neuro-oncology with artificial neural networks: A multicentre, retrospective study. Lancet Oncol. 2019, 20, 728–740. [Google Scholar] [CrossRef]
  41. Rawat, S.; Zhang, Y.X.; Lee, C.K. Multi-response optimization of hybrid fibre engineered cementitious composite using Grey-Taguchi method and utility concept. Constr. Build. Mater. 2022, 319, 126040. [Google Scholar] [CrossRef]
  42. Gajalakshmi, K.; Senthilkumar, N.; Prabu, B. Multi-response optimization of dry sliding wear parameters of AA6026 using hybrid gray relational analysis coupled with response surface method. Meas. Control. 2019, 52, 540–553. [Google Scholar] [CrossRef]
  43. Aamir, M.; Tu, S.; Tolouei-Rad, M.; Giasin, K.; Vafadar, A. Optimization and modeling of process parameters in multi-hole simultaneous drilling using taguchi method and fuzzy logic approach. Materials 2020, 13, 680. [Google Scholar] [CrossRef]
  44. Lan, T.S.; Chuang, K.C.; Chen, Y.M. Optimization of machining parameters using fuzzy Taguchi method for reducing tool wear. Appl. Sci. 2018, 8, 1011. [Google Scholar] [CrossRef]
  45. Yao, W.; Cai, K.; Xu, Y. Optimizing the beam-like structure of a vehicle body using the grey–fuzzy–Taguchi method. Eng. Optim. 2021, 53, 49–70. [Google Scholar] [CrossRef]
  46. Al-Refaie, A.; Domi, G.B.; Abdullah, R. A fuzzy goal programming-regression approach to optimize process performance of multiple responses under uncertainty. Int. J. Manag. Sci. Eng. Manag. 2019, 14, 20–32. [Google Scholar] [CrossRef]
  47. Realyvásquez-Vargas, A.; Arredondo-Soto, K.C.; Carrillo-Gutiérrez, T.; Ravelo, G. Applying the Plan-Do-Check-Act (PDCA) cycle to reduce the defects in the manufacturing industry. A case study. Appl. Sci. 2018, 8, 2181. [Google Scholar] [CrossRef]
  48. Al Athamneh, R. Reliability Modeling of Microelectronic Interconnections in Long-term Applications. Ph.D. Thesis, Auburn University, Auburn, Alabama, 2019. [Google Scholar]
  49. Al-Refaie, A.; Chen, T.; Al-Athamneh, R.; Wu, H.C. Fuzzy neural network approach to optimizing process performance by using multiple responses. J. Ambient. Intell. Humaniz. Comput. 2016, 7, 801–816. [Google Scholar] [CrossRef]
  50. Hosseinpour, S.; Martynenko, A. Food quality evaluation in drying: Structuring of measurable food attributes into multi-dimensional fuzzy sets. Dry. Technol. 2022, 40, 2293–2307. [Google Scholar] [CrossRef]
  51. Vivek, K.; Subbarao, K.V.; Routray, W.; Kamini, N.R.; Dash, K.K. Application of fuzzy logic in sensory evaluation of food products: A comprehensive study. Food Bioprocess Technol. 2020, 13, 1–29. [Google Scholar] [CrossRef]
Figure 1. PDCA cycle.
Processes 10 01894 g001
Figure 2. Flowchart of all the processes in the studied production line.
Processes 10 01894 g002
Figure 3. The methodology plan.
Processes 10 01894 g003
Figure 4. X-bar-S control chart for temperature.
Processes 10 01894 g004
Figure 5. The inputs in the fuzzy system.
Processes 10 01894 g005
Figure 6. MFs for each quality response in the fuzzy system. (a) MFs for the weight quality response. (b) MFs for the color quality response. (c) MFs for the temperature quality response. (d) MFs for the pick up quality response. (e) MFs for the waste quality response.
Processes 10 01894 g006
Figure 7. The six output MFs.
Processes 10 01894 g007
Figure 8. Rules aggregation in the fuzzy system.
Processes 10 01894 g008
Figure 9. X-bar-S control chart for temp. response.
Processes 10 01894 g009
Figure 10. Response Surface for the weight and temp. parameters in the fuzzy system.
Processes 10 01894 g010
Table 1. Levels for the controllable factors.
FactorsSpeed (unit/hour)Frying Time (min)Cooking Time (min)Ratio
Level 11250307.51:02
Level 21300358.501:02.5
Level 31350409.51:03
Table 2. Samples of the temperature response (ºC).
Sample No.12345678910
125.223.52322.322.422.923.123.124.825.1
223.423.624.624.925.223.62324.323.824.1
1922.5252422.423.522.125.323.125.722.8
2024.323.425.722.223.725.524.822.823.724.9
Table 3. Orthogonal Array (OA).
Exp. (i)Speed (unit/hour)Frying Time (min)Cooking Time (min)Ratio
11250307.51:2
21250358.51:2.5
31250409.51:3
41300308.51:3
51300359.51:2
61300407.51:2.5
71350309.51:2.5
81350357.51:3
91350408.51:2
Table 4. Responses for the first run, based on Taguchi L9.
First RunWeight 1 (g)Color 1Temp 1 (ºC)Pick up 1 (%)Waste 1 (g)
11024.57582.319.44%7424
21349593.219.19%3400
31154392.616.30%960
41254483.918%1582
51238582.518.47%7800
61146384.518.39%3800
71062575.316.88%4600
81108273.313.02%2600
91298.7488.417.85%10,500
Table 5. SNR for the 4 runs of the 9 experiments for the weight (g) response.
Exp. (i)Weight 1Weight 2Weight 3Weight 4Ybar2SD2 SNR (NTB)
11024.571183.441240.601315.801,418,725.16515,263.75245.320
2134912601171.131089.131217.3212,575.798−23.351
3115412311206.810561161.956022.676−16.454
412541218124810661196.507817.000−18.769
5123812401179.71278.31234.001654.326−2.931
6114611131176.71103.981134.921102.0340.2940
7106213281303.23611991223.0614,653.267−24.833
8110811771124.411661143.851084.3560.534
91298.712281060.61257.51211.2010,920.846−21.990
Table 6. The largest value of SNR is chosen, which is a better performance response for each output.
ResponseThe Larger Value of SNR
Weight45.320
Color28.332
Temperature33.707
Pick up86.897
Waste184.920
Table 7. Levels for the controllable factors.
FactorsSpeed (unit/hour)Frying Timze (min)Cooking Time (min)Ratio
Level 11250307.51:02
Level 21300358.501:02.5
Level 3 1350409.51:03
Table 8. The average SNR for weight response.
Avg-SNR (Weight)
Level 1Level 2Level 3
Speed (unit/hour)1.84−7.14−15.43
Frying time (min)0.57−5.21−12.72
Cooking time (min)15.38−21.37−14.74
Ratio6.80−11.56−15.96
Table 9. The optimal settings for each response.
Speed
(unit/hour)
Frying Time (min)Cooking Time (min)Ratio
Weight1250307.51:2
Color1250409.51:2
Temp1250407.51:3
Pick up1250409.51:2
Waste1350357.51:2
Table 10. The largest and smallest values in High, Mid and Low MFs of SNR for each response.
ResponseHighMidLow
Weight45.3210.25−24.83
Color28.3319.6610.99
Temp.33.7118.673.62
Pick up86.9071.7656.62
Waste184.92161.14137.36
Table 11. The Fuzzy rules for the five responses.
RuleWeightColorTempPick upWasteOutput
1LowLowLowLowLowLowest
2LowLowLowLowMidLowest
3LowLowLowMidLowLowest
4LowLowMidLowLowLowest
5LowMidLowLowLowLowest
6MidLowLowLowLowLowest
7LowLowLowlowHighLow
8LowLowlowHighLowLow
9LowLowHighLowLowLow
241HighLowHighHighHighHigh
242LowHighHighHighHighHigh
243HighHighHighHighHighHighest
Table 12. The rules combination with output MFs.
Combination Inputs MFsOutput MF
Low (count)Mid (count)High (count)
1500Lowest
2410Lowest
3320Low
4230Low
5140Mid-Low
6050Mid
7005Highest
8014Highest
9023High
10032High
11041Mid-High
12401Low
13302Mid-Low
14203Mid-High
15104High
Table 13. The COM value at each experimental condition.
Exp. (i) SNR Weight SNR Color SNR TempSNR Pick UpSNR WasteCOM
145.3226.0215.1386.89177.30.756
2−23.3526.026.8971.18161.80.467
3−16.4523.5133.7184.62137.630.534
4−18.7710.99−2.6460.31147.590.224
5−2.9326.031.9373.34178.490.529
60.2917.9223.663.23164.090.479
7−24.8317.923.6277.6168.090.433
80.5315.0417.456.62154.880.412
9−21.9928.3332.3377.22184.920.714
Table 14. The average of the COM values at each factor level.
Avg. COM
Level 1Level 2Level 3
Speed0.5860.4110.520
Frying time0.4710.4690.576
Cooking time0.5490.4680.499
Ratio0.6660.4600.390
Table 15. Samples for temperature response after applying the optimization method.
Sample No. 12345678910
172.874.474.075.077.675.176.674.271.974.8
272.974.975.775.773.472.474.675.071.475.1
1975.177.475.074.376.174.973.472.275.574.1
2074.575.075.875.176.472.974.873.877.673.8
Table 16. Results for the optimization of a single response.
Avg (SNR)Setting
FactorsWeightcolortemppick upWasteWeightcolorTemppick upwaste
Speed1.83825.18918.58080.902169.29412501250125012501350
Frying time0.57223.25429.88075.027165.0533040404035
Cooking time15.38222.48618.79278.522165.4297.59.57.59.57.5
Ratio6.79926.79016.23579.153180.2431:21:21:31:21:2
Table 17. Results for the optimization of the multi-response problem.
FactorsAvg (COM)COM Setting
Speed0.5861250
Frying time0.57640
Cooking time0.5497.5
Ratio0.6661:2
Publisher’s Note: MDPI stays neutral with regard to jurisdictional claims in published maps and institutional affiliations.

