Article

Thermodynamic and Economic Analysis of a High Temperature Cascade Heat Pump System for Steam Generation

1
Guangzhou Institute of Energy Conversion, Chinese Academy of Sciences, Guangzhou 510640, China
2
University of Chinese Academy of Sciences, Beijing 100049, China
3
Key Laboratory of Renewable Energy, Chinese Academy of Sciences, Guangzhou 510640, China
4
Guangdong Provincial Key Laboratory of New and Renewable Energy Research and Development, Guangzhou 510640, China
*
Author to whom correspondence should be addressed.
Processes 2022, 10(9), 1862; https://doi.org/10.3390/pr10091862
Submission received: 13 August 2022 / Revised: 7 September 2022 / Accepted: 9 September 2022 / Published: 15 September 2022
(This article belongs to the Special Issue The Role of Renewable Energy Systems in the Modern Societies)

Abstract

:
A high temperature cascade heat pump (HTCHP) system using low-grade heat from waste water to generate steam for industrial processes is studied from the thermodynamic and economic view. The effects of intermediate temperature, heat source temperature, heat sink temperature, working fluids, and the pinch point temperature difference at the evaporator, condenser, and intermediate heat exchanger on the thermodynamic performance and cost-effectiveness of the HTCHP system are investigated. The PBP varying with the gas price and electricity price is evaluated as well. The results show that optimal intermediate temperatures exist under different operational conditions, not only for the COP, but also for the PBP. A high heat source temperature and low heat sink temperature are conducive to increasing the COP and shortening the PBP. Working fluid pair R1234Ze(E)-R1233zd(Z) shows a promising application in the HTCHP system for its relatively high COP, short PBP, and low GWP. A lower pinch point temperature difference will cause a higher COP and shorter PBP, but a higher SEC. The energy price has a great effect on the economic viability of the system. When the price ratio is lower than 1.81, the PBP is lower than 4.6 years.

1. Introduction

Reaching net zero emissions by 2050 has become the greenhouse gas emissions target of most countries in the world. Power generation plants and industrial manufacturing are the two largest CO2 emissions sectors, accounting for around 50% and 30% of total emissions, and 40% of total emissions come from coal-fired power plants alone. Using clean energy for electricity generation and realizing electrification in final energy consumption are inevitable ways to achieve the net zero emissions goal. Industrial processes are globally the second-largest source of CO2 emissions, with a total of about 8.4 Gt in 2020 [1]. On the other hand, there is much low-grade waste heat with temperatures between 40 and 80 °C with no effective reuse in industrial processes. A high temperature heat pump could reuse this waste heat as the heat source to produce high-grade heat, such as high temperature water or steam, showing great potential for heating electrification in various industrial processes [2].
To generate steam for industrial applications, the output temperature of the heat pump must be higher than 100 °C, which would lead to a high compression ratio for the single-stage heat pump system. A high compression ratio will cause low compression efficiency, low COP, and poor heating capacity. The cascade heat pump cycle is an effective technology to lower the compression ratio while realizing the same temperature lift. The cascade cycle has been widely applied in low-temperature refrigeration systems to offer a relatively high temperature lift. Park et al. studied the effects of intermediate temperature and water temperature lift on the performance of a cascade refrigeration system [3,4,5]. Wu et al. conducted an experiment to analyze the performance of a cascade refrigeration system with ammonia and carbon dioxide as the working fluids, and an evaporating temperature of minus 40 °C was achieved [6]. In recent years, some research on applying the cascade cycle in heat pump systems has also been carried out. Sheng et al. conducted an experiment to investigate the performance of a high temperature cascade heat pump (HTCHP) using BY-3/R245fa as the working fluid. The results showed that the HTCHP system using BY-3 and R245fa could produce hot water at 142 °C with good performance, and the temperature lift of the HTCHP could reach 100 °C [7]. Wang et al. applied extremum-seeking control (ESC) technology in a cascade air source heat pump (CASHP) with a discharge water temperature of 85 °C and validated the feasibility of the extremum-seeking control strategy applied to the CASHP [8]. Dai et al. studied five configurations of a dual-pressure condensation high-temperature heat pump (HTHP), and the results showed that the cascade HTHP system was superior to the traditional single-stage HTHP system [9].
Working fluids play an important role in the HTHP system, which can affect its performance and safe operation. Compared with the conventional vapor compression heat pump system, the discharge temperature of the HTHP system is very high. Hence, many research works have focused on seeking suitable high temperature working fluids for the HTHP system. Yu et al. developed a new binary mixture named MF-1, and the simulated results indicated that the HTHP system using MF-1 can produce heat at a temperature of 120 °C with good performance [10]. Zhang et al. developed a binary near-azeotropic mixture named BY-5 used for the HTHP system, and the experimental results showed that the water output temperature reached 130 °C and when the temperature lift was less than 46 °C, the COP was higher than 3.0 [11]. Bamigbetan et al. conducted a theoretical analysis to evaluate available and potential fluids for HTHPs. The evaluations showed that certain hydrocarbons and halocarbons were the most promising fluid candidates for waste heat upgrade from low temperatures to high temperatures, up to 125 °C [12]. Except for high cycle performance, working fluids with low global warming potential (GWP) have attracted much attention due to their emission reduction. Mateu-Royo et al. comprehensively evaluated advanced HTHP configurations for industrial waste heat recovery using low-GWP refrigerants [13,14,15]. Hu et al. simulated a megawatt HTHP with the environmentally friendly R1233zd(E) refrigerant to evaluate the system performance under different conditions [16]. Kondou et al. thermodynamically, experimentally, and numerically assessed the refrigerants R1234ze(E) and R1234ze(Z) for high-temperature heat pumps, and the results demonstrated that R1234ze(Z) was suitable for high-temperature applications rather than in typical air conditioners [17].
The previous studies mainly focused on the thermodynamic performance of HTHP systems such as the COP and exergy efficiency. However, it is hard to evaluate the economic viability of the system from thermodynamic view [18]. Besides, the traditional HTHP systems cannot effectively use industrial waste heat with temperatures lower than 50 °C because of the limited temperature lift. In this paper, a HTCHP system is adopted to recover the waste heat under 50 °C from industrial process to produce steam. Thermodynamic and economic analysis is performed to study the performance of the HTCHP system. The effects of the intermediate temperature, heat source/heat sink temperature, working fluids, the pinch point temperature difference in the heat exchangers, and energy price on the thermodynamic performance and cost-effectiveness of the system are investigated.

2. System Description

As shown in Figure 1, a cascade heat pump system consists of two vapor compression cycles, a low temperature circuit (LTC) and a high temperature circuit (HTC). The two circuits are coupled with a cascade heat exchanger (or intermediate heat exchanger). The cascade heat exchanger is used as the condenser in the LTC and as the evaporator in the HTC. In the LTC evaporator, heat transfers from the heat source to the working fluid, and the working fluid liquid evaporates and changes into a low-pressure vapor. Then, the low-pressure working fluid vapor is compressed to a high-pressure vapor by the compressor. During the compression, electricity is consumed. In the cascade heat exchanger, the high-pressure working fluid vapor in the LTC transfers its heat to the low-pressure working fluid in the HTC and condenses into a high-pressure liquid, and then, the high-pressure working fluid liquid flows through the low-stage throttle valve and changes to a low-pressure gas–liquid phase working fluid. Finally, the low-pressure gas–liquid phase working fluid flows into the LTC evaporator, absorbing heat from the heat source again and completes the low-temperature circuit. The HTC is similar to the LTC. Through the LTC and HTC, heat transfers from the heat source to the heat sink for steam generation.
In HTHPs, the hydrofluorocarbon HFC-245fa is the dominant refrigerant used. However, its GWP value is quite high, equal to 858. HFO-1234ze(Z), HCFO-1233zd(E), and HFO-1366mzz(Z) are considered as the main alternatives to HFC-245fa in the future because of their low GWP. Therefore, in this study, HFC-245fa, HFO-1234ze(Z), HCFO-1233zd(E), and HFO-1366mzz(Z) were selected as the working fluids in the HTC, as shown in Table 1. In traditional heat pump systems, HFC-134a is widely applied. However, just like HFC-245fa, its GWP is as high as 1430, and it is likely to be phased out in the near future. Compared with HFC-134a, HFO-1234ze(E) offers the approximate critical temperature, 109.51 °C, at a GWP of 6. Hence, HFC-134a and HFO-1234ze(E) were selected as the working fluids in the LTC. The parameters of HFC-134a and HFO-1234ze(E) are shown in Table 2.

3. Model Establishment

3.1. Boundary Conditions and Assumptions

To analyze the thermodynamic performance and economic viability of the high temperature cascade heat pump system, a mathematical model is developed based on the assumptions as follows:
(1)
The working fluids in the cascade heat pump system are steady state.
(2)
The heat loss in heat exchangers and pipelines is ignored.
(3)
Refrigerants are saturated at the outlet of the evaporator and the condenser.
(4)
The pressure loss in heat exchangers and pipes is negligible.
(5)
The compressor efficiencies in the LTC and HTC are both 0.72 [19,20].
(6)
The expansion valve process is considered isenthalpic.
The reference values and the boundary conditions are shown in Table 3. The intermediate temperature is treated as the condensation temperature in the intermediate heat exchanger and is optimized to maximize the COP without exceeding the maximum discharge temperature in the HTC by the quadratic approximations optimization method. The energy price is an essential factor affecting the PBP of the HTHP system. Due to the COVID-19 pandemic and political conflict, the energy price has been greatly rising. However, this extraordinary energy price will not last long as the COVID-19 pandemic and political conflict end. Therefore, the electricity and gas price are set according to the literature [18] which had considered all previous results about the EU’s average prices for electricity and gas before the COVID-19 pandemic broke out.

3.2. Model Establishment

3.2.1. Thermodynamics Analysis Model

The thermodynamics model is established based on the energy conservation equation and mass conservation equation. The compression of the fluids takes place from state 2 to state 3 in the LTC and from state 6 to state 7 with the same compressor isentropic efficiency:
h 3 = h 3 s h 2 η is + h 2
h 7 = h 7 s h 6 η is + h 6
W ˙ c 1 = m ˙ evap ( h 3 h 2 )
W ˙ c 2 = m ˙ cond ( h 7 h 6 )
Condensation of the fluid in HTC takes place from state 7 to state 8. The steam generation is assumed to be an isothermal process, so the heat sink temperature keeps the same:
Q ˙ cond = m ˙ cond ( h 7 h 8 )
As for the heat pump cycle, enthalpy is considered to be kept the same before and after the throttling process:
h 1 = h 4
h 5 = h 8
For the evaporator in the LTC:
Q ˙ evap = m ˙ evap ( h 2 h 1 )
For the cascade heat exchanger:
Q ˙ chx = m ˙ cond ( h 6 h 5 ) = m ˙ evap ( h 3 h 4 )
Commonly, the coefficient of performance is used to evaluate the efficiency of a heat pump system, which can be calculated as follows:
C O P = Q ˙ cond / ( W ˙ c 1 + W ˙ c 2 )
The compressor suction volume flow rate greatly affects the cost of the compressor, so the suction volume flow rate of the compressor is also investigated here:
V ˙ total = m ˙ evap v 2 + m ˙ cond v 6

3.2.2. Economic Analysis Model

The compressor and heat exchanger are two main parts of the HTCHP system’s cost. These two pieces of equipment’s cost correlations were developed by Ommen et al. [21]. The cost of the compressor depends greatly on the suction volume flow rate of the compressor.
C c = 19,850 × ( V ˙ total 279.8 ) 0.73
The heat exchanger surface is the main factor affecting its cost. The heat exchanger surface (A) is calculated by the logarithmic mean temperature difference method and heat transfer equation. The heat transfer coefficients are calculated from the literature [22,23,24].
C HEX = 15,526 × ( A 42 ) 0.8
Q ˙ = k A Δ T LMTD
The cost of auxiliary equipment, including valves, piping, tanks, electrical equipment, and so on, are summed and expressed as a function of the compressor(s) and heat exchanger cost [18]. This cost function is given as follows.
C aux = 0.2 × ( C c + C HEX )
Refrigerant is another part of the equipment cost. This cost has a small contribution to the total equipment cost, generally less than 4% of the total equipment cost [18]. The refrigerant cost is considered to be 4% of the other equipment cost in this paper.
C ref = 0.04 × ( C c + C HEX + C aux )
The total equipment cost includes all the equipment mentioned above. The specific equipment cost (SEC) is defined as the ratio of the total equipment cost to the heating capacity of the heat pump system.
C eq = C c + C HEX + C aux + C ref
S E C = C eq / Q ˙ cond
Except for the equipment cost, other costs such as installation cost, labor cost, and so on, should be included to realize the final application. In this study, the whole project cost including the equipment cost, installation cost, and labor cost is considered to be double the equipment cost.
C p = 2 C eq
The payback period (PBP) is an important economic indicator to evaluate the economy efficiency of the heat pump project, defined as the ratio of the initial investment to the annual profit [25].
P B P = C p / ( C g C el )
In the above equation, the term Cg is the gas cost savings. To calculate the annual gas cost savings, it is assumed that the heat pump reduces the gas consumption for the process heat with a boiler efficiency of 90%, which can be calculated by
C g = B × V ˙ g × P g
where B is the operating time in a year; V ˙ g is gas consumption; Pg is gas price.
The term Cel represents the operating cost of the heat pump system and can be calculated as
C el = B × W × P el
where W is the power input to the heat pump; Pel is the electricity price.

3.2.3. Model Validation

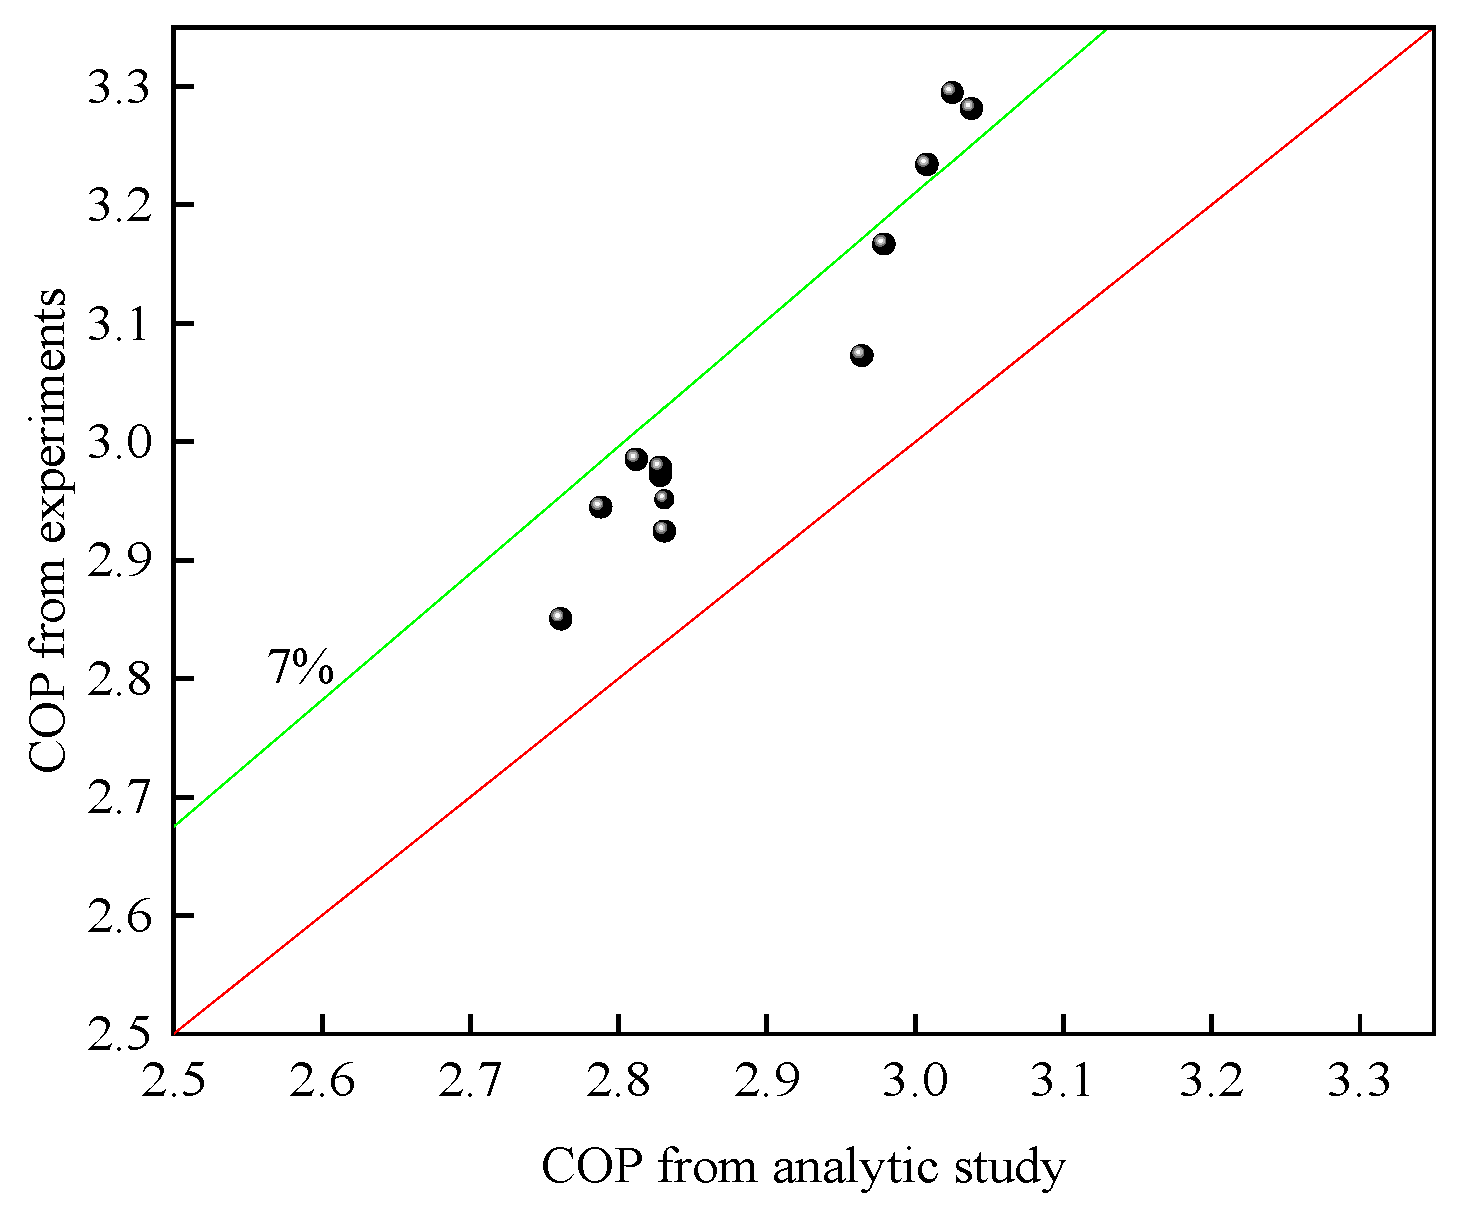
The thermodynamic analysis model is validated by comparing with the experimentally tested data from [3]. Comparisons are made between the calculated COP of the system with R134a as the HTC working fluid and R410A as the LTC working fluid at the same operating conditions. The comparison results are shown in Figure 2. It can be seen from Figure 2 that the deviation between the results from the thermodynamic analysis model and the experimental data is mostly less than 7%.

4. Results and Discussion

4.1. Effects of the Intermediate Temperature

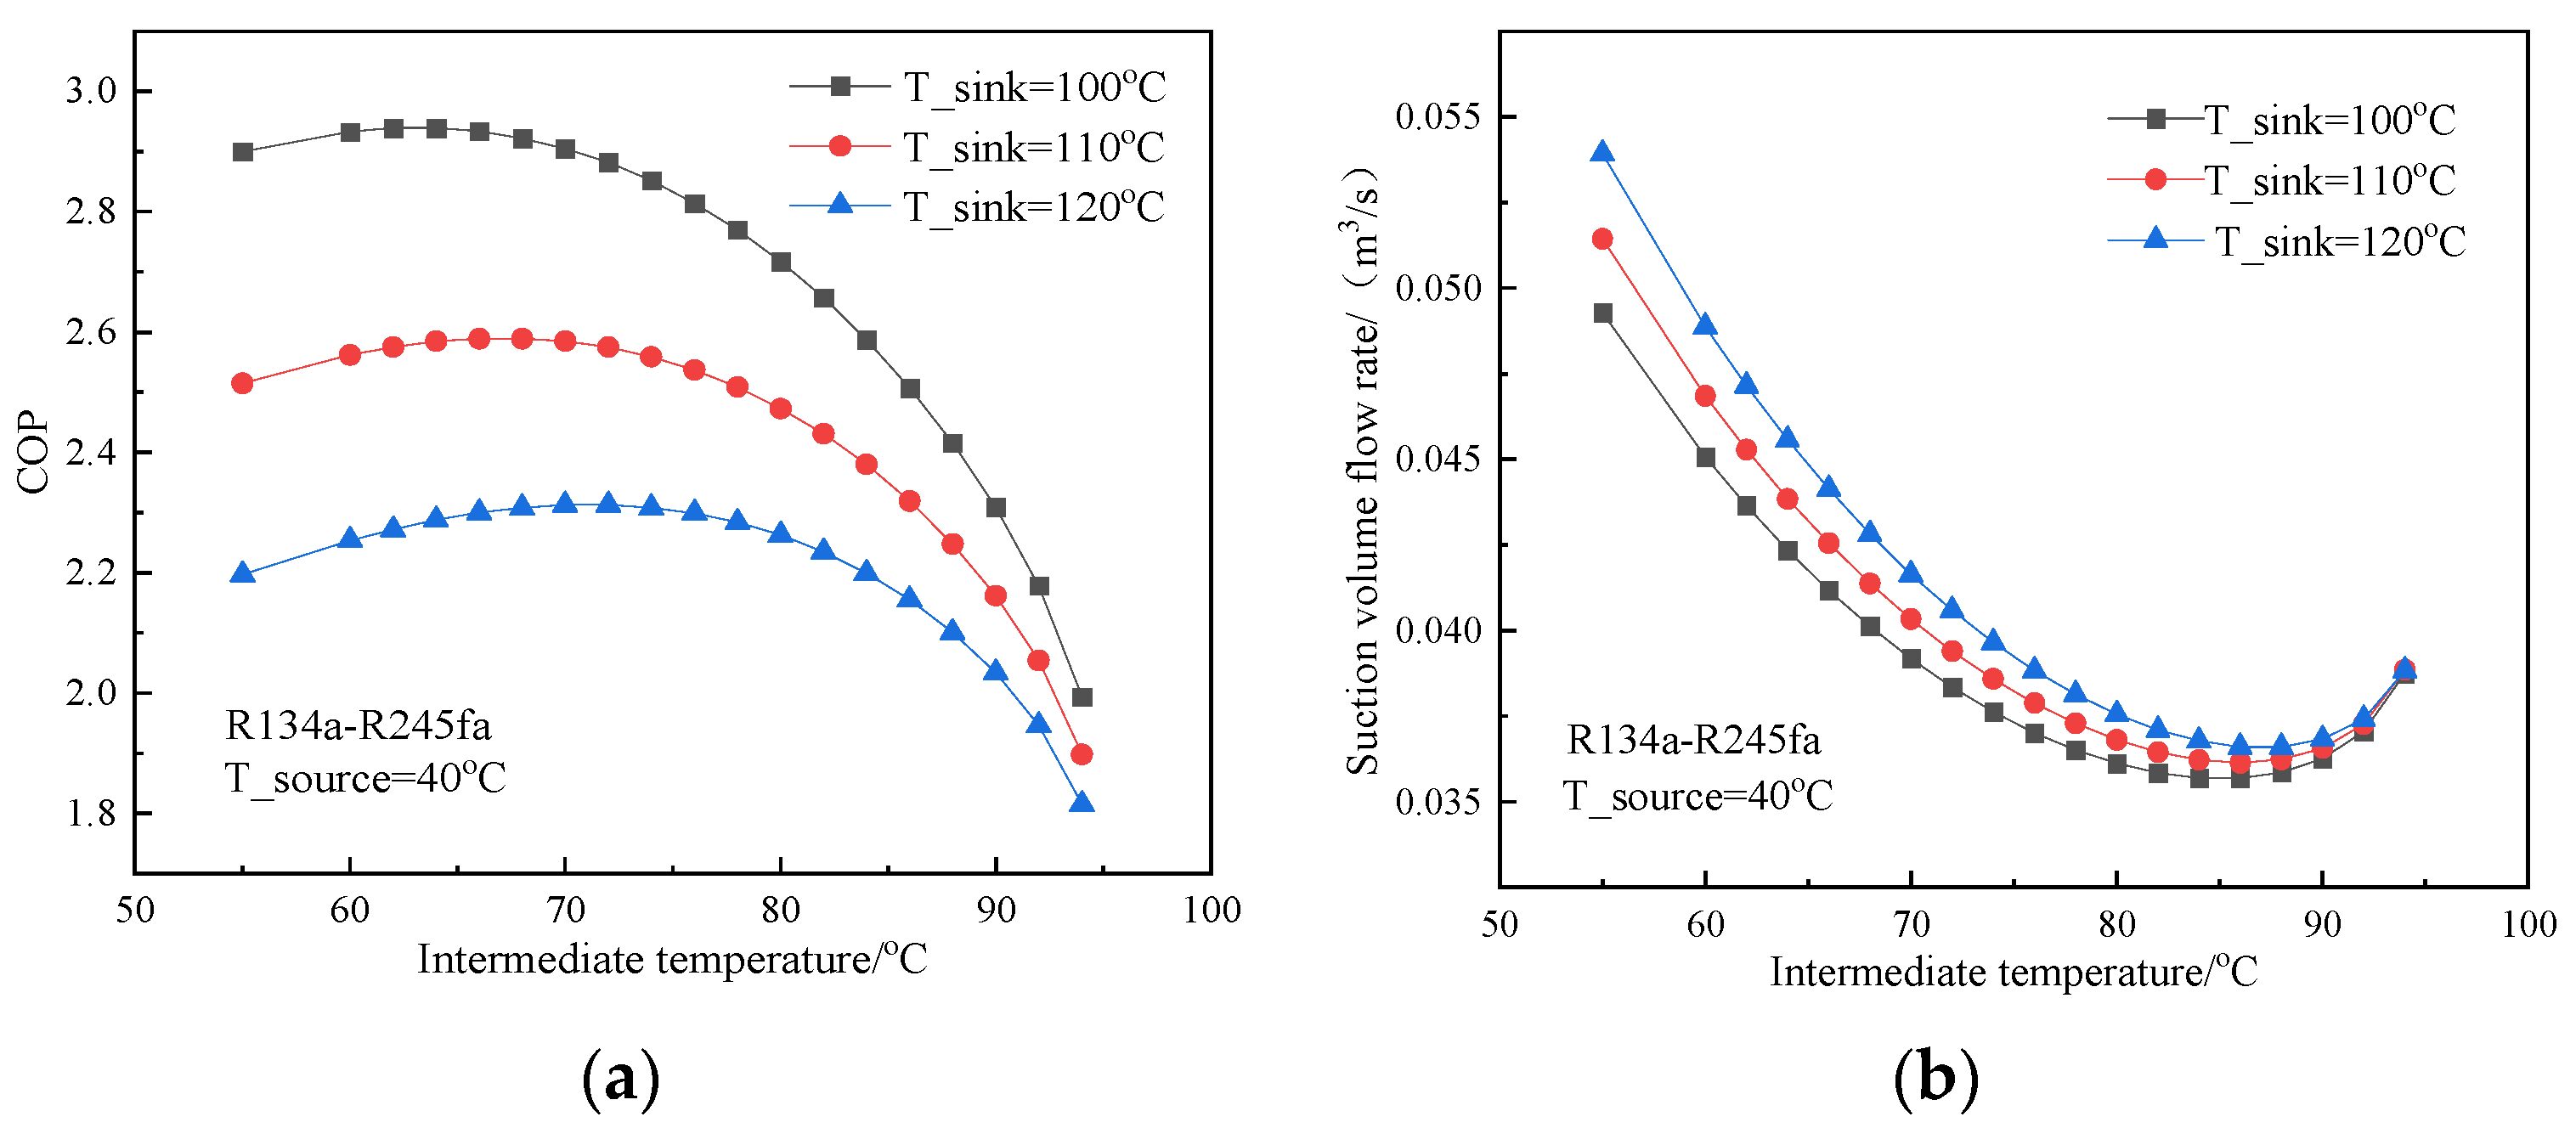
The cascade heat exchanger is an important component connecting the LTC and HTC. Figure 3 presents the effects of intermediate temperature (IT) on the COP and the compressor suction volume flow rate of working fluid R134a-R245fa. The COP of the system firstly increases and then falls with the increasing IT. The trend of the COP varying with the intermediate temperature indicates that optimal ITs exist under different operational conditions. The optimal ITs for the COP are 63.07 °C (COP = 2.94), 67.07 °C (COP = 2.59), 71.7 °C (COP = 2.31) at temperatures of Tsource/Tsink of 40 °C/100 °C, 40 °C/110 °C, 40 °C/120 °C, respectively. The reason why the COP of the system changes in this way is that as the IT increases, the compression ratio of the HTC decreases and that of the LTC increases, which results in the decrease of the power input to the HTC, but the increase of the power input to the LTC. These two opposite trends lead to an optimum COP. The trend of the suction volume flow rate is opposite that of the COP. The optimal ITs for the suction volume flow rates are 85.05 °C (0.03568 m3/s), 85.96 °C (0.03614 m3/s), 87.03 °C (0.03658 m3/s) at temperatures of Tsource/Tsink of 40 °C/100 °C, 40 °C/110 °C, 40 °C/120 °C, respectively.
Figure 4 shows the effects of the intermediate temperature (IT) on the PBP and SEC. It is identified that there is a certain intermediate temperature for the minimum PBP. The PBP decreases along with the intermediate temperature below the optimal temperature, while it increases over the optimal value. The optimal ITs for the PBP are 73.26 °C (PBP = 3.78), 74.3 °C (PBP = 4.77), 75.78 °C (PBP = 6.44) at temperatures of Tsource/Tsink of 40 °C/100 °C, 40 °C/110 °C, 40 °C/120 °C, respectively. It can be found that the optimal ITs for the PBP are different from the optimal ITs for the COP, which can be explained by the fact that the PBP depends not only on the COP, but also on the project cost of the system. It can be observed from Figure 4b that the SEC decreases with the increase of the IT. When the intermediate temperature is 70 °C and the heat source temperature is 40 °C, the SECs are 255.4, 263.6, 273.1 EUR/kW for a heat sink temperature of 100, 110, 120 °C, respectively.

4.2. Effects of the Heat Source/Heat Sink Temperature

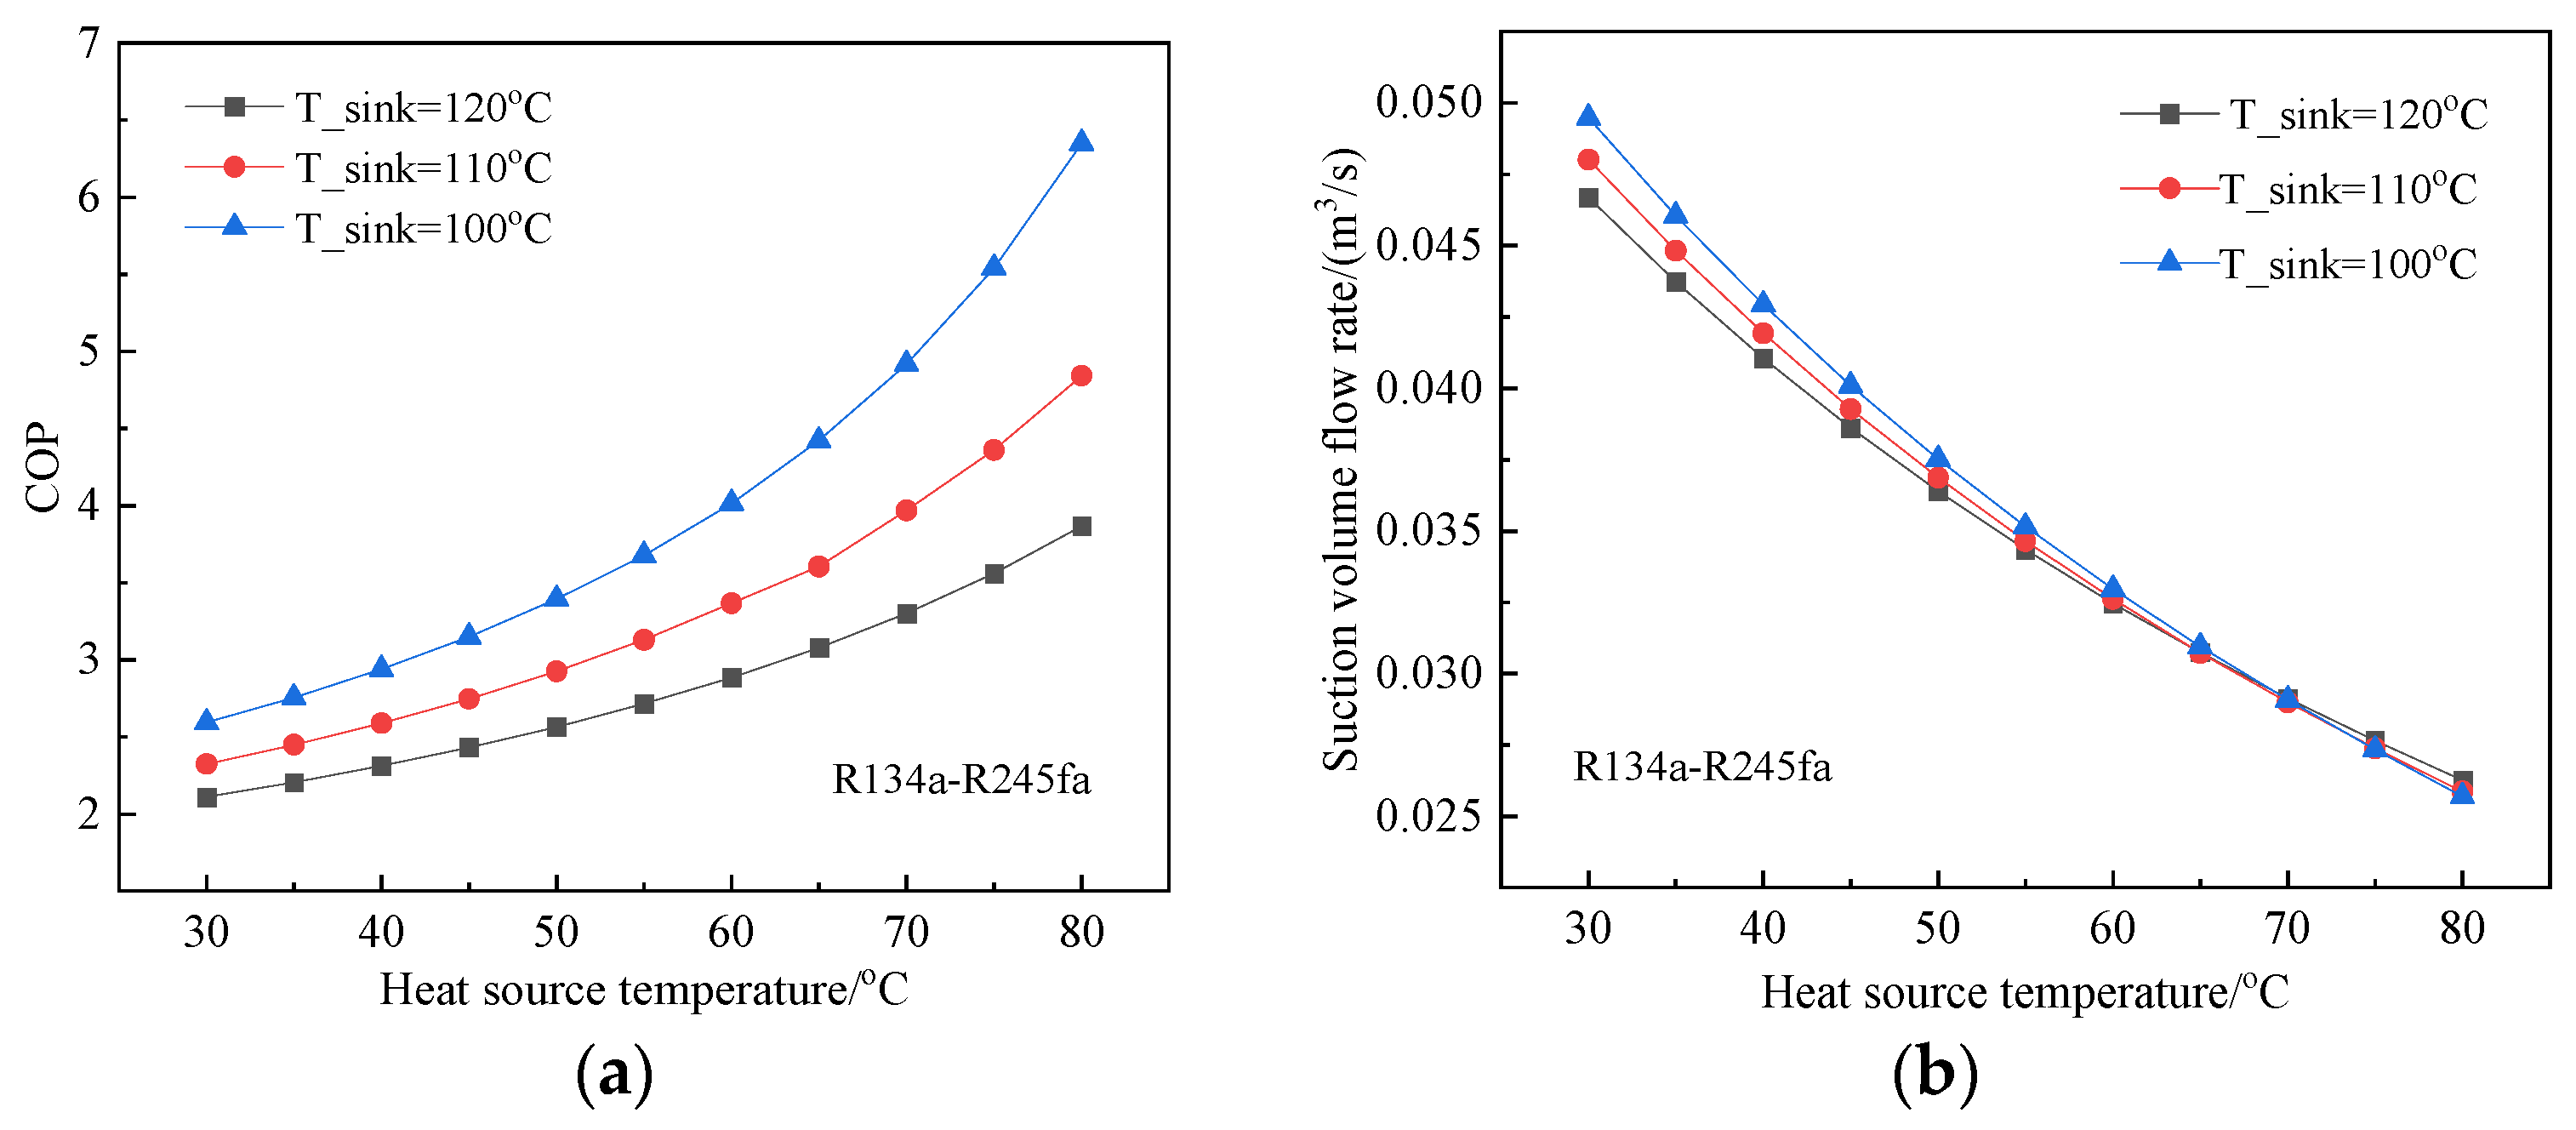
This part of the results concerns the presentation of the influence of different heat sources and sink temperatures on the performance. The heat source temperature varies from 30 °C to 80 °C, and the heat sink temperature varies from 100 °C up to 120 °C. As expected, the COP greatly increases with the increase of the heat source temperature and decreases with the increase of the heat sink temperature. When the heat source temperature is 30 °C, the COP is 2.59, 2.33, 2.11 for a heat sink temperature of 100, 110, 120 °C, respectively. When the heat source temperature is 80 °C, the COP is 6.35, 4.84, 3.87 for a heat sink temperature of 100, 110, 120 °C, rising 145%, 108%, 84% from the heat source temperature of 30 °C, respectively. Figure 5b shows how the heat source/heat sink temperature affects the compressor suction volume flow rate. When the heat source temperature increases, the compressor suction volume flow rate diminishes greatly. This illustrates that a higher heat source temperature leads to better system performance.
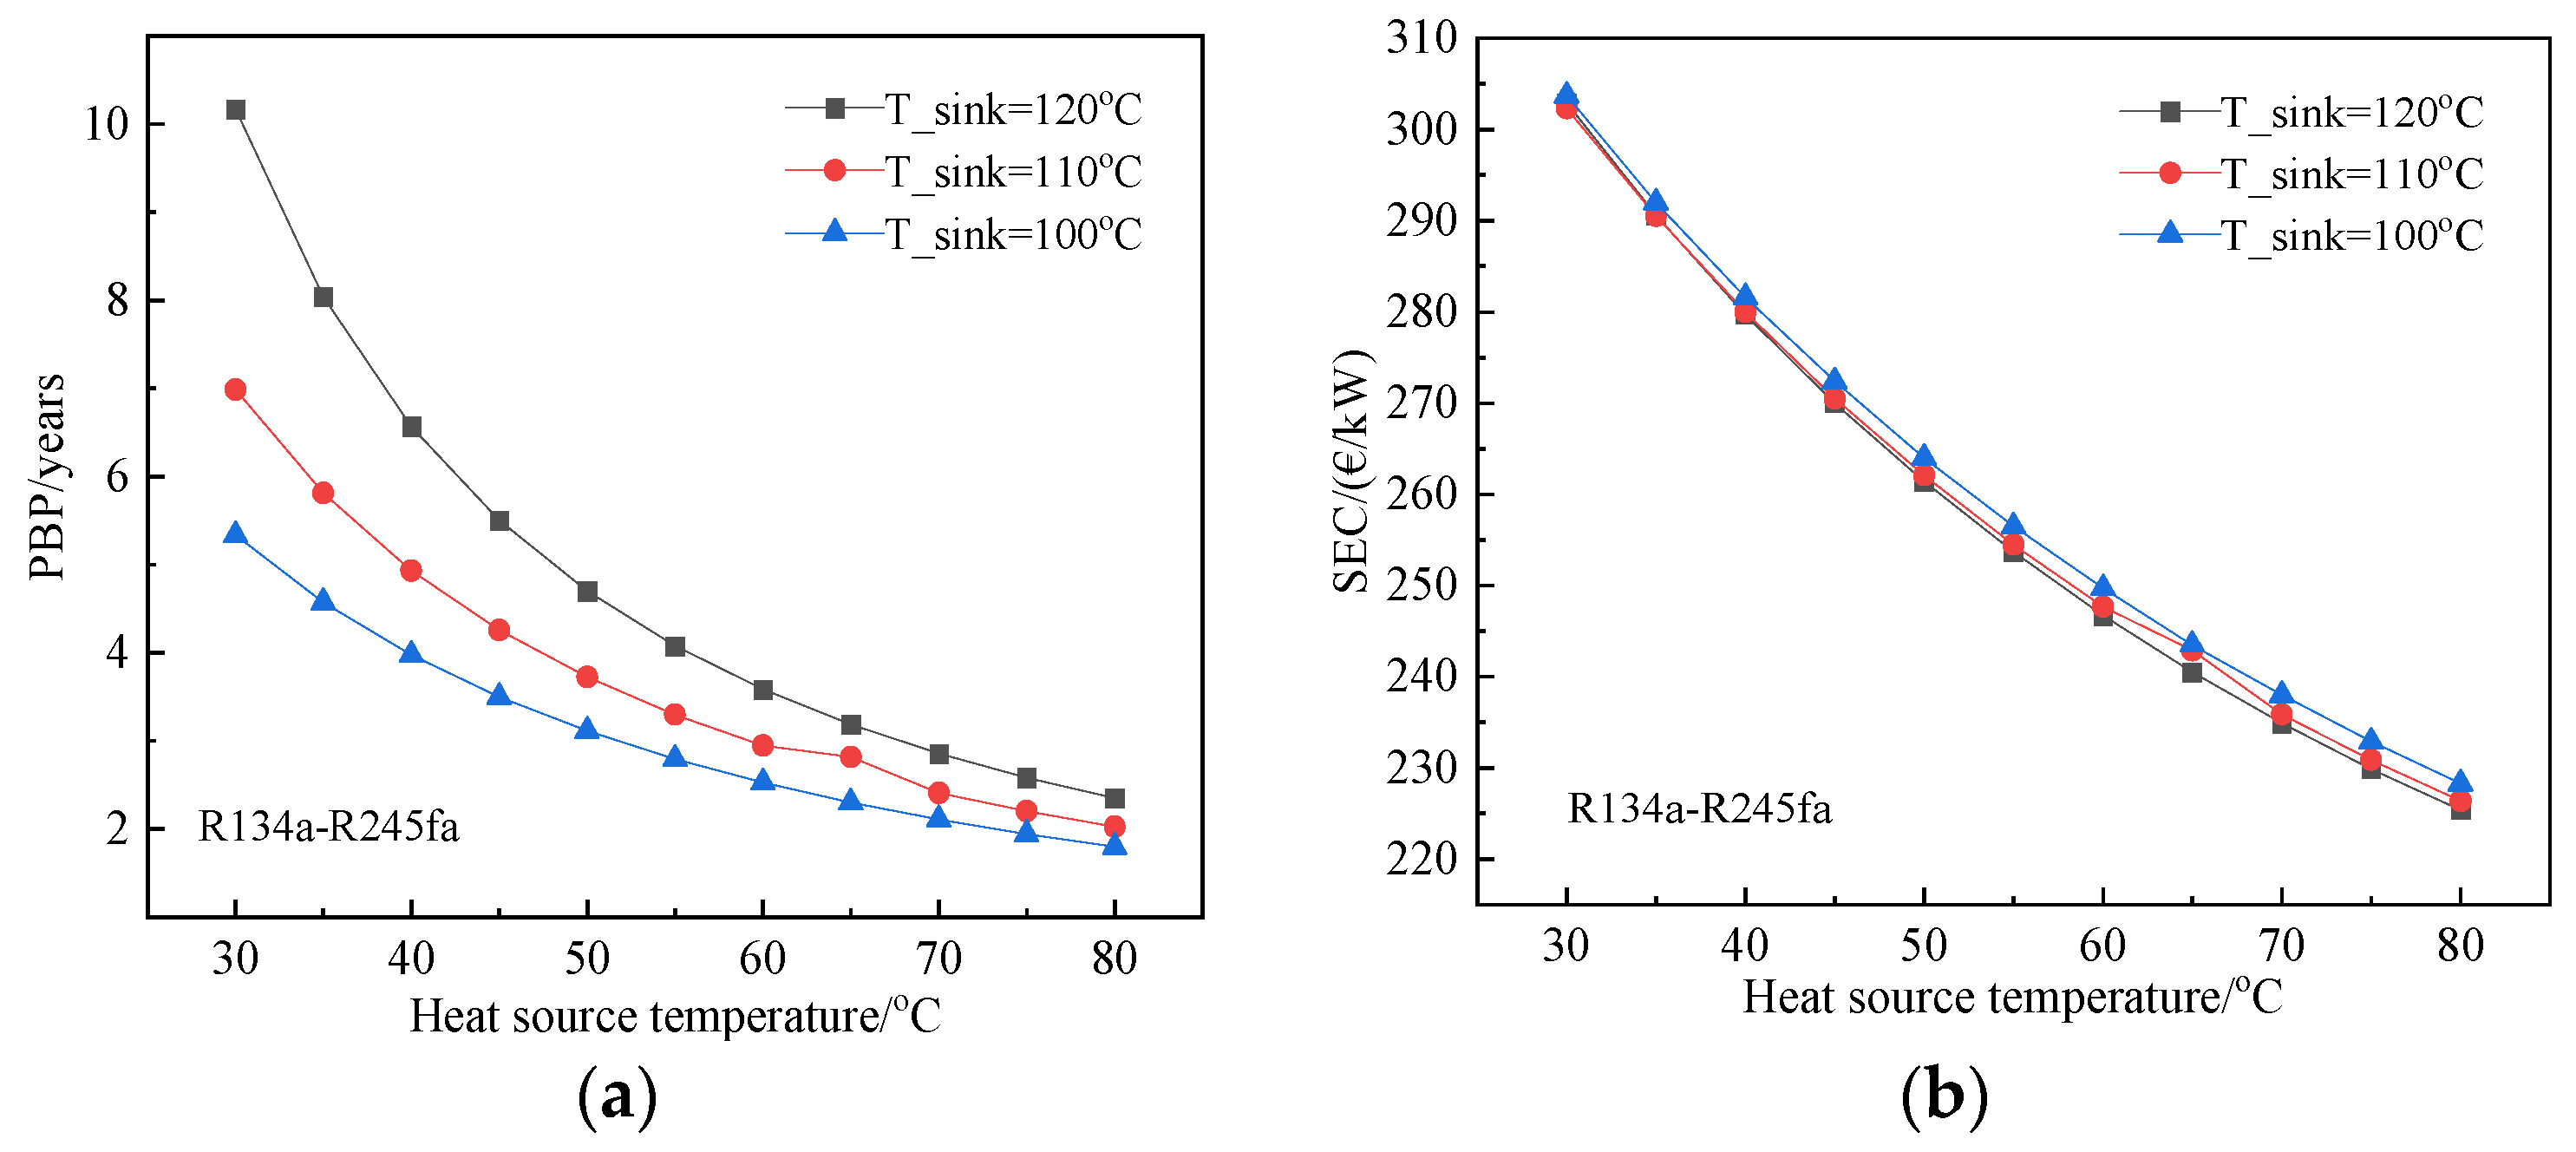
The PBP varying with heat source/heat sink temperature is presented in Figure 6a. The PBP increases with the decrease of the heat source temperature and the increase of the heat sink temperature, which can be attributed to a higher temperature lift, causing a lower COP value. When the heat source temperature is higher than 55 °C, the results show that PBP shorter than 4 years for heat sink temperatures from 100 °C to 120 °C, showing a good economic efficiency for the application. The SEC is shown in Figure 6b as a function of the heat sink and source temperatures. The SEC increases for lower heat source temperatures, reaching 302.9 EUR/kW at heat sink and source temperatures of 120 °C and 30 °C. For most of the operation conditions, the SEC is within the range from 220 to 300 EUR/kW. This also indicates that the heat sink temperature plays a minor role in the SEC. This can be explained by the fact that, despite the increasing heat sink temperature reducing the COP, which would increase the SEC, it can reduce the compressor suction volume flow rate, which would reduce the SEC. Under the combined action of the COP and compressor suction volume flow rate, the SEC varies slightly with the heat sink temperature.

4.3. Effects of Working Fluid

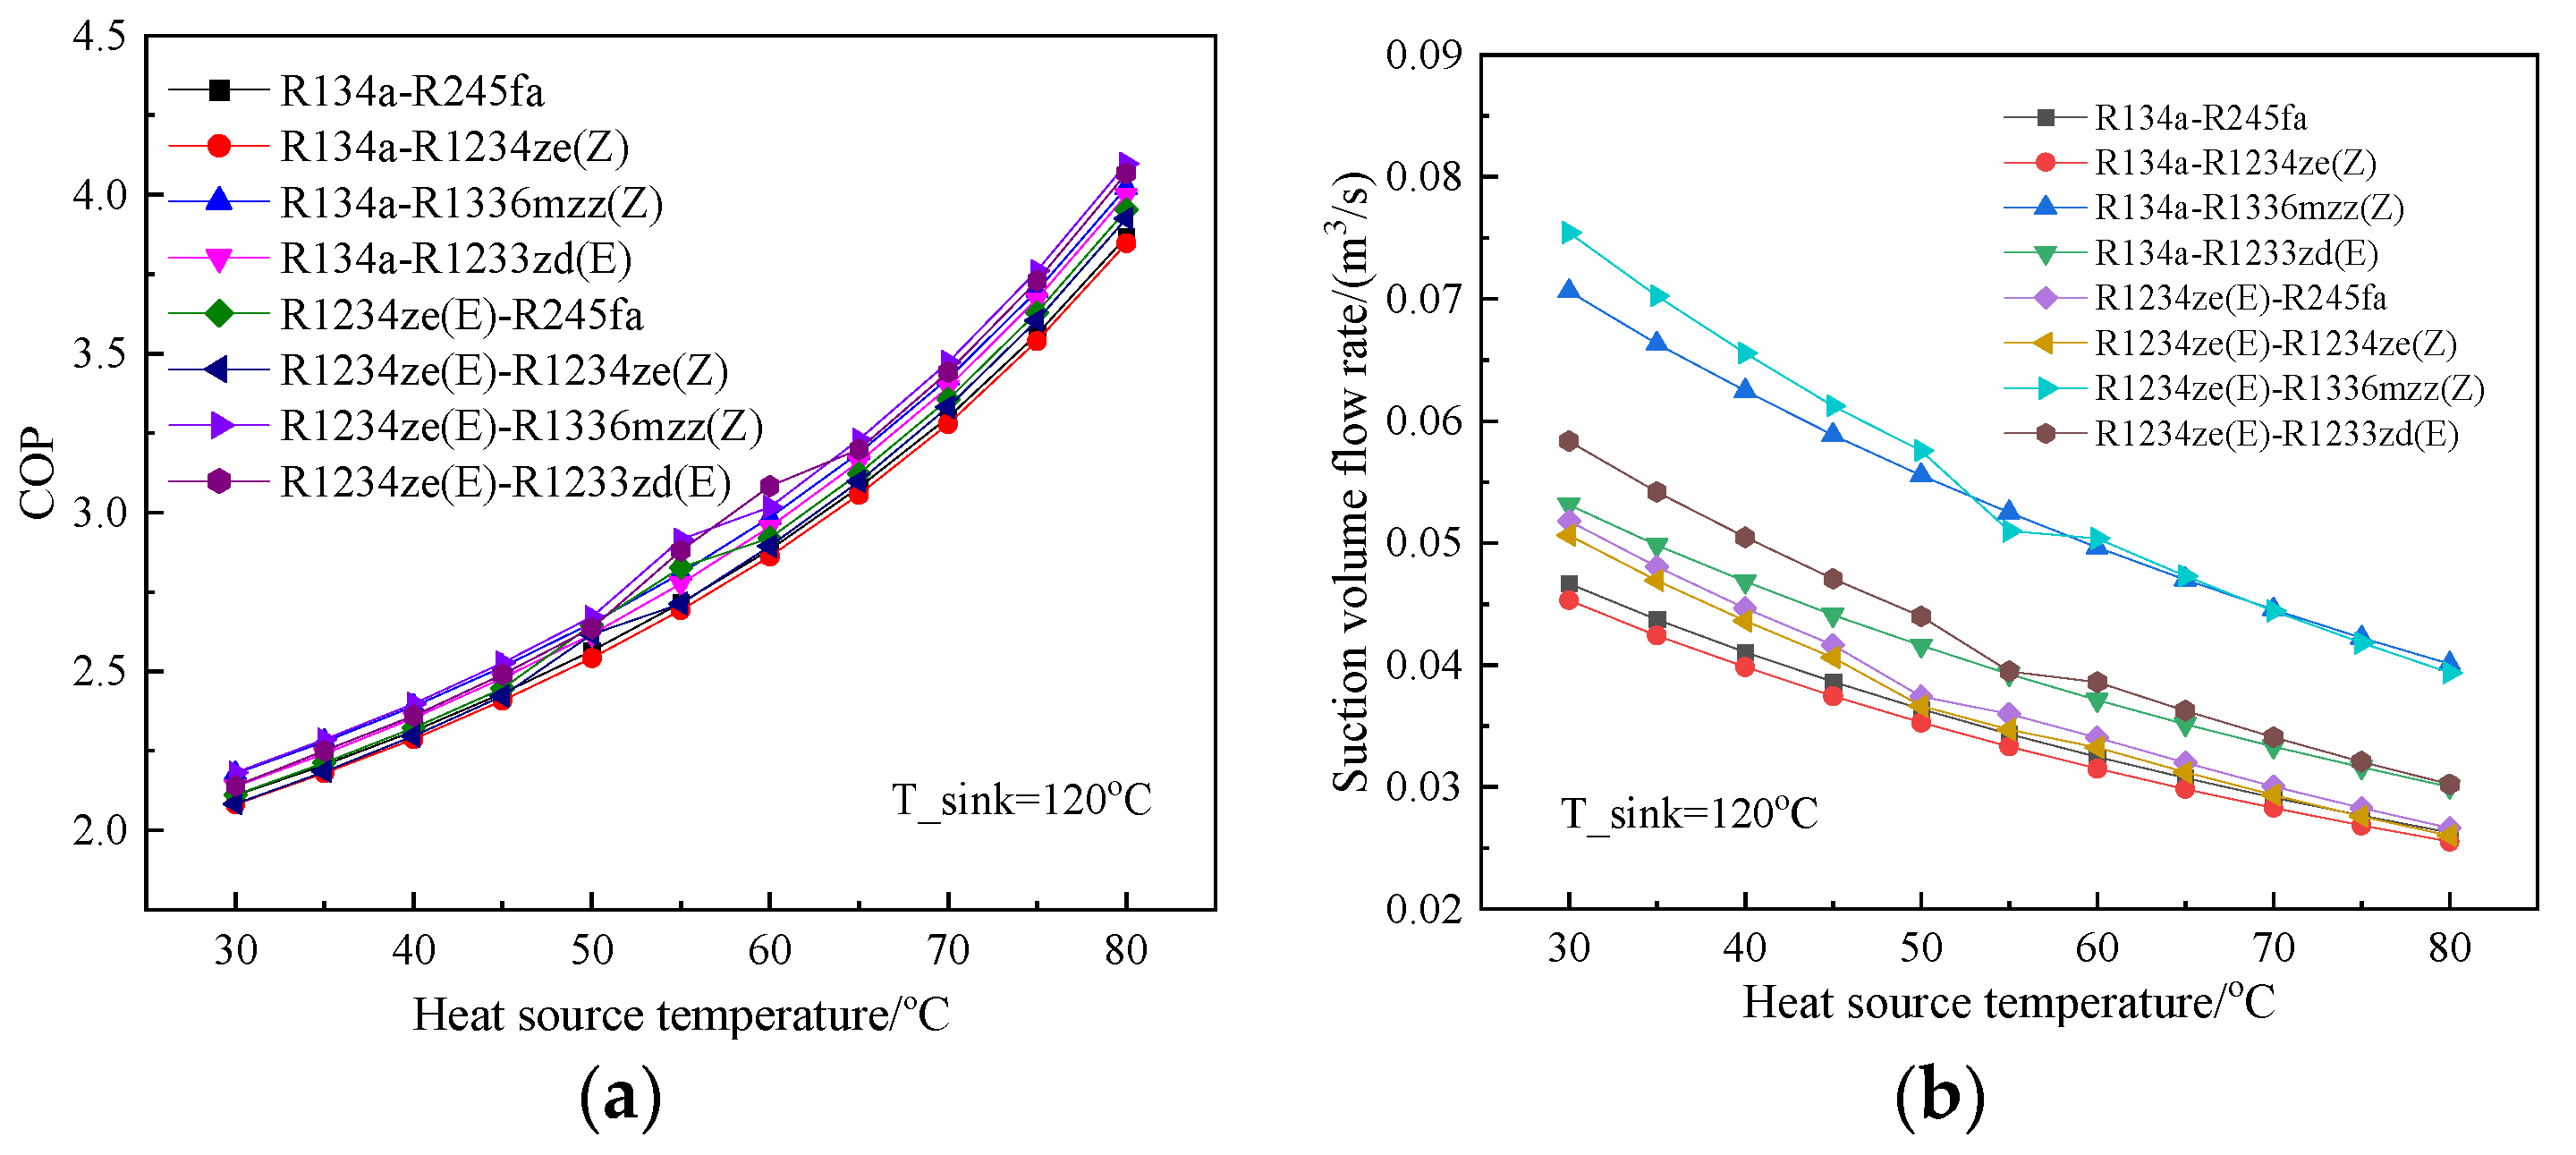
Figure 7 presents the effects of the working fluid on the thermodynamic performance. For the analysis, two fluids in the LTC are selected, namely R134a and R1234ze(E), whereas the HTC uses R245fa, R1234ze(Z), R1336mzz(Z), and R1233zd(E). Figure 7a shows that the COP with different refrigerants increases with the increasing heat source temperature. R1234ze(E)/R1336mzz(Z) gives the highest COP with a value of 2.40 when the heat source temperature and the heat sink temperature are 40 °C and 120 °C, followed by R134a-R1336mzz(Z), R1234Ze(E)-R1233zd(E), R134a-R1233zd(E), R1234Ze(E)-R245fa, R134a-R245fa, R1234Ze(E)-R1234ze(Z), and R134a-R1234Ze(Z), for which the COPs are 2.39, 2.36, 2.35, 2.32, 2.31, 2.30, and 2.29, respectively. However, as shown in Figure 7b, R1234ze(E)/R1336mzz(Z) leads to largest compressor suction volume flow rate and needs the biggest compressor, which will result in a high equipment cost.
The effects of the working fluids on the PBP of the system are presented in Figure 8a. The PBPs with various working fluids decrease with the heat source temperature, showing that R1234ze(E)-R1336mzz(Z) needs the longest PBP of 7.56 years at a heat source temperature and heat sink temperature of 40 °C and 120 °C, closely followed by R134a-R1336mzz(Z) with a PBP of 7.34 years. The shortest PBP among all the working fluids is R134a-R1233zd(E), with a value of 6.53 years at a heat source temperature and heat sink temperature of 40 °C and 120 °C. However, when the heat source temperature and heat sink temperature are 80 °C and 120 °C, the shortest PBP among all the working fluids is R1234Ze(E)-R1234ze(Z), with a value of 2.32 years. The effects of the working fluids on the SEC are shown in Figure 8b. The R134a-R1234Ze(Z) shows the lowest SEC over the whole range of heat source temperatures with the value ranging from 221.7 EUR/kW to 290.9 EUR/kW.

4.4. Effects of Pinch Point Temperature Difference

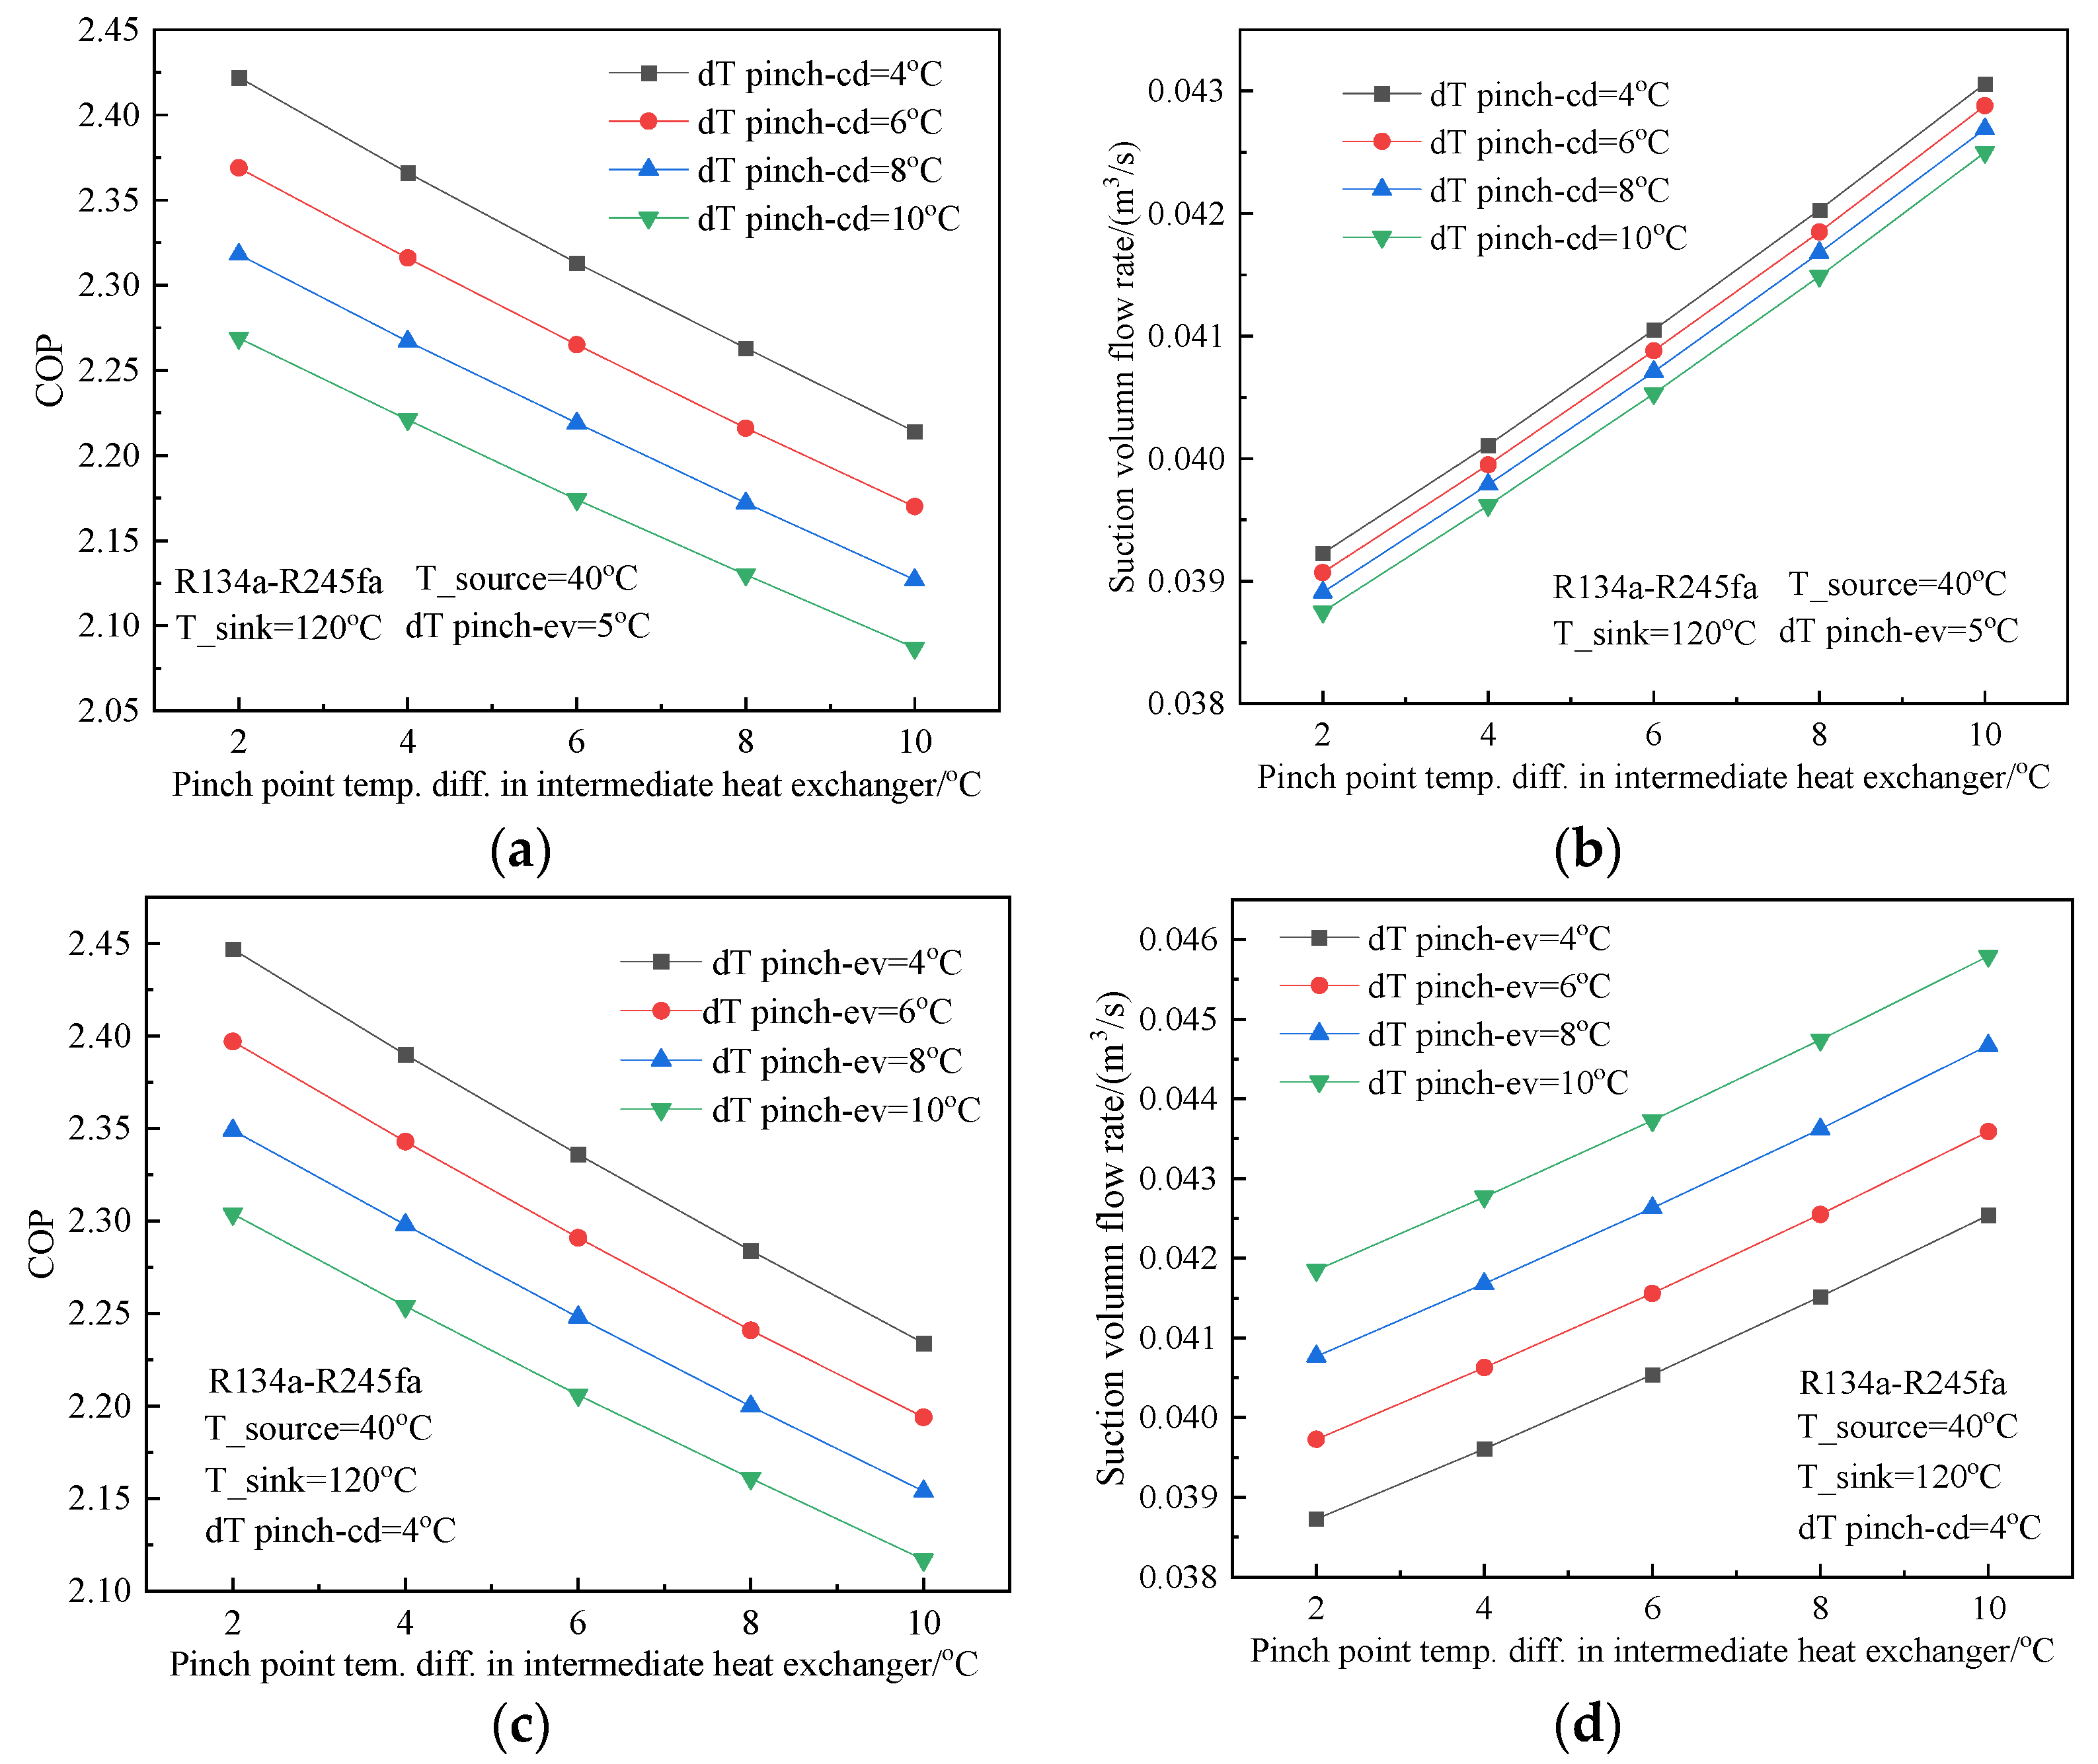
To evaluate the effects of the pinch point temperature difference at the evaporator, condenser, and intermediate heat exchanger, the heat sink and source temperatures are kept constant and equal to 120 °C and 40 °C, respectively. Figure 9 presents the thermodynamic performance results for various pinch point temperature differences at the evaporator, condenser, and intermediate heat exchanger with the refrigerant R134a-R245fa. The COPs decrease linearly with the increase of the pinch point temperature difference in all the heat exchangers. This can be explained by the fact that a higher pinch point temperature difference leads to a higher temperature lift of the heat pump cycle, which causes the reduction of the COP. The compressor suction volume flow rate increases with the increase of the pinch point temperature difference at the evaporator and intermediate heat exchanger and decreases with the increase of the pinch point temperature difference at the condenser. This is because the pinch point temperature difference at the evaporator and intermediate heat exchanger directly affects the evaporation temperature of the refrigerant and compressor suction parameters. A higher pinch point temperature difference at the evaporator and intermediate heat exchanger leads to a lower compressor suction pressure and higher specific volume of the refrigerant. As for the condenser, it can be explained by the fact that the input and output parameters at the condenser are slightly affected by the variation of the pinch point. The variation of the input and output parameters at the condenser causes the changing of the mass flow rate of the heat pimp system, even though this effect at the condenser is weak.
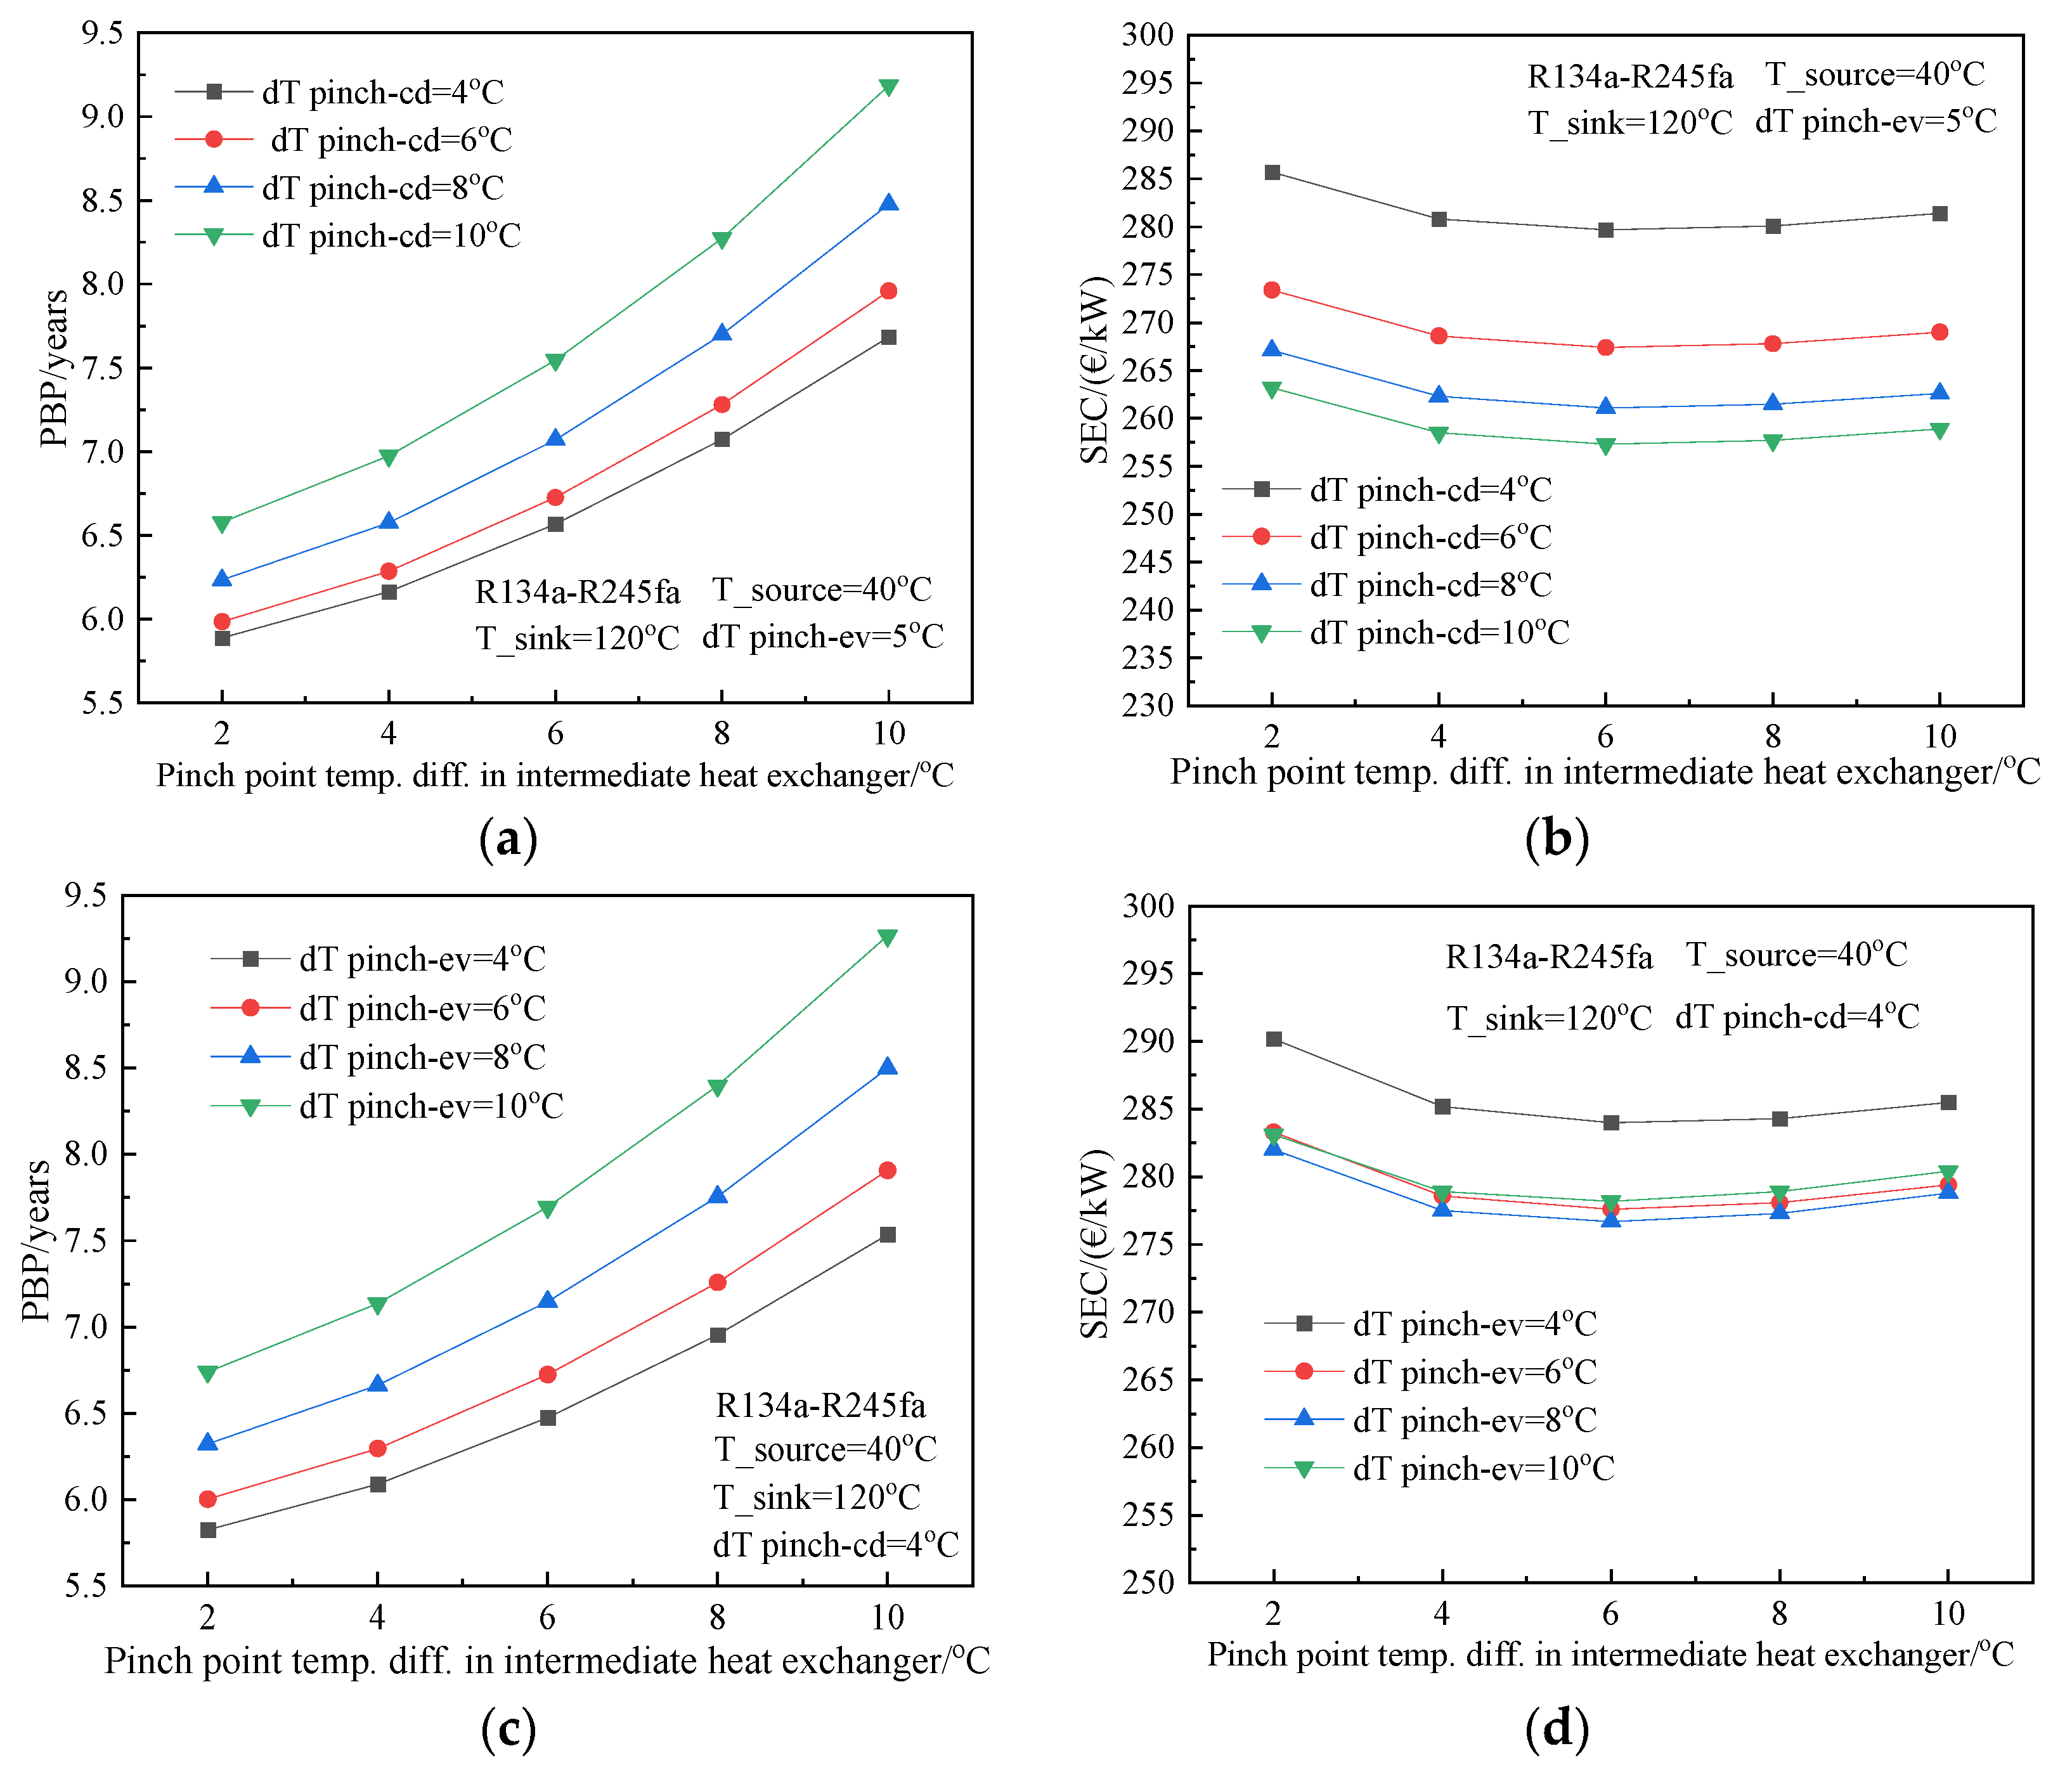
The effect of the pinch point temperature difference on the PBP and SEC is presented in Figure 10 for the reference heat sink/source temperature of 120/40 °C. The PBP is greatly increased with increasing temperature differences at all the heat exchangers, and the higher the temperature difference, the bigger increase rate is. Therefore, the pinch point temperature difference should be kept low enough to shorten the PBP. The effect of the pinch point temperature difference at the three heat exchangers on the SEC is shown in Figure 10b,d. The SEC decreases firstly, then increases slightly with the increase of the pinch point temperature difference at the intermediate heat exchanger. The optimal temperature difference for the SEC at the intermediate heat exchanger is close to 6 °C. The SEC decreases with the increase of the pinch point temperature difference at the condenser, which is mostly attributed to the reduced heat exchange surface of the condenser due to the large pinch point temperature difference. The trend of the SEC varying with the pinch point temperature difference at the evaporator is similar to that at the intermediate heat exchanger. The optimal temperature difference for the SEC at the evaporator is close to 8 °C.

4.5. Effects of Energy Price on the Payback Period

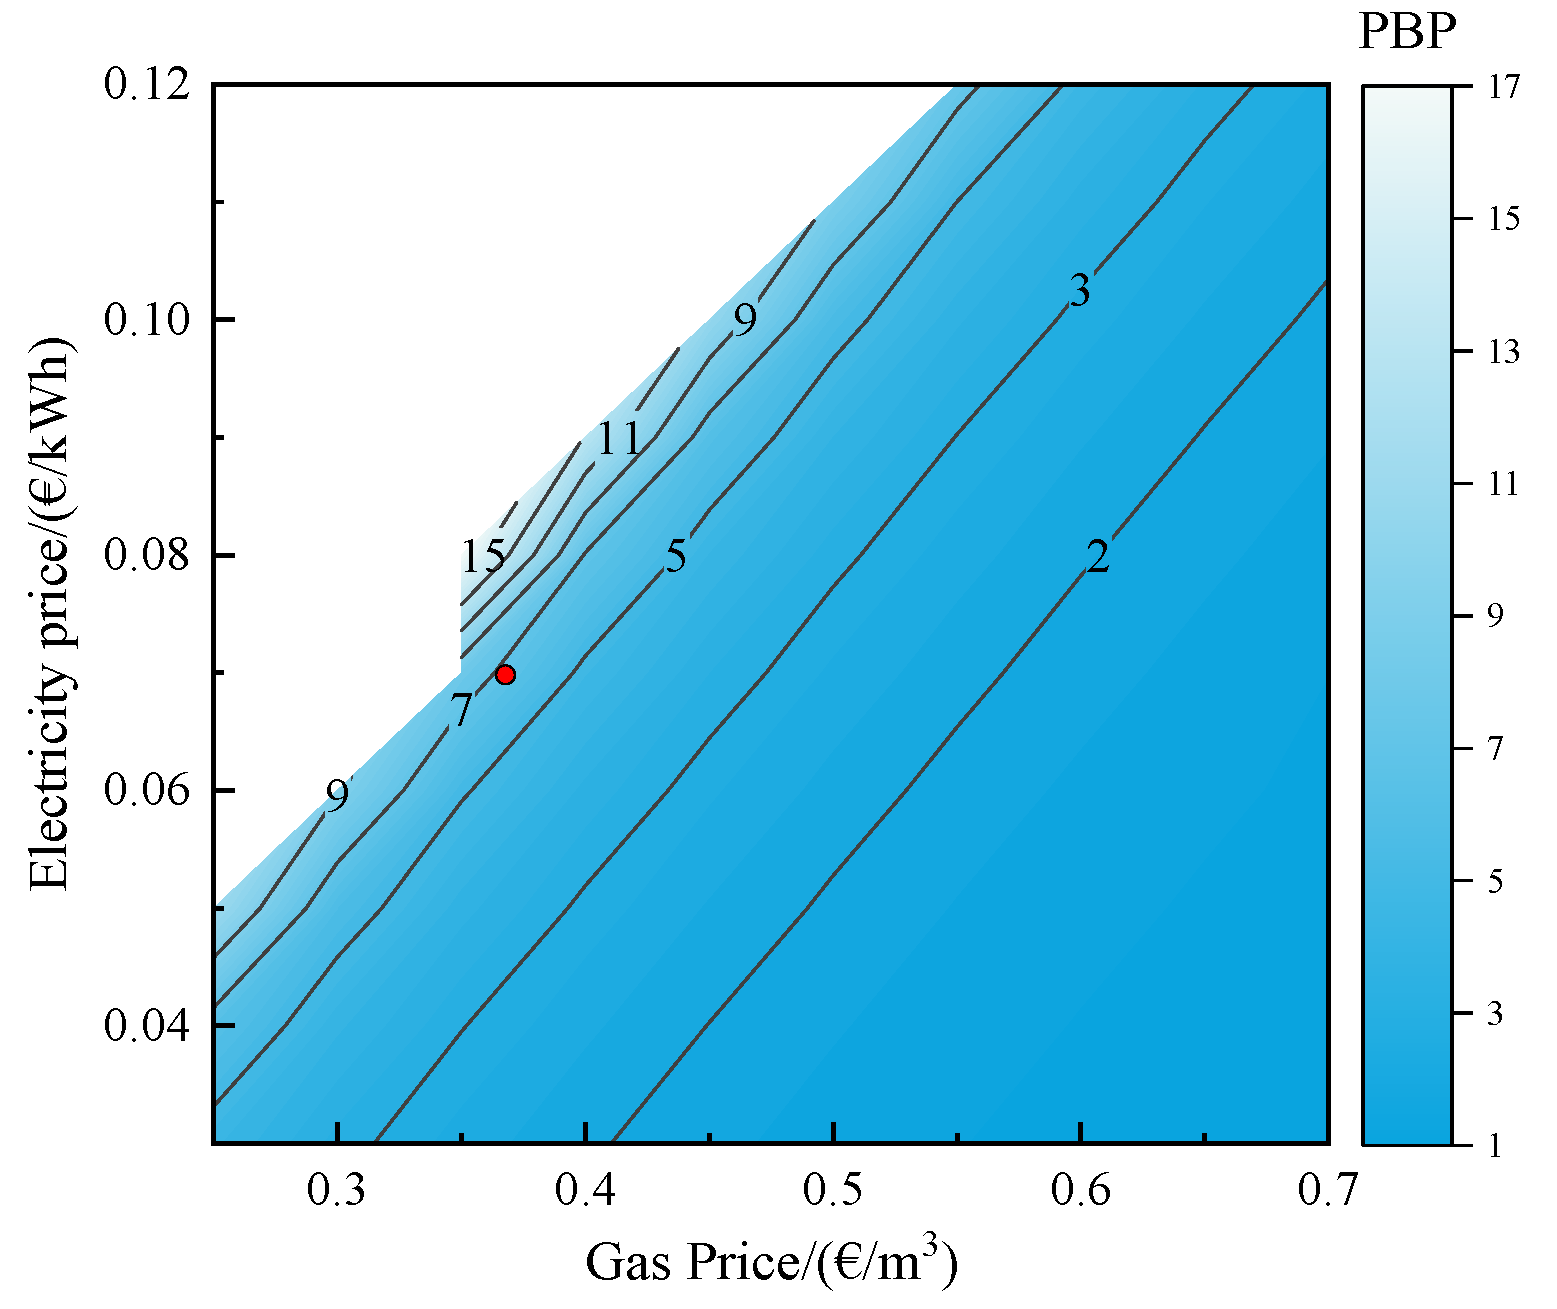
Not only the heat pump performance would affect the cost-effectiveness of the heat pump system, but also the energy price can affect the cost-effectiveness. In the previous results, the reference prices for electricity and gas were 0.07 EUR/kWh and 0.35 EUR/m3, respectively. The PBP contour considering various electricity and gas prices is shown in Figure 11 for the high-temperature cascade heat pump system with R134a and R245fa as the working fluids. The heat sink/source temperature is set to the reference of 120/40 °C. The gas price ranges from 0.25 to 0.7 EUR/m3 and the electricity price from 0.03 to 0.12 EUR/kWh. The PBP is only 1 year when the gas price and electricity price are 0.7 EUR/m3 and 0.03 EUR/kWh. However, when the gas and electricity prices are 0.5 EUR/m3 and 0.11 EUR/kWh, respectively, the PBP reaches 21.4 years, which exceeds the heat pump lifetime, with a typical value of 20 years. It can be concluded that the payback period depends greatly on the ratio between electricity price and gas price.
In China, the gas price and electricity price are different in different provinces. The PBP of the HTCHP system applied in different provinces is shown in Table 4. The energy price ratio is defined as the ratio between the electricity price and gas price, which provides a good indication to analyze the HTCHP’s economic viability. From Table 4, it can be obtained that the use of the HTCHP system in Yunan, Guangdong, Guizhou, and Liaoning achieves PBP in the range from 3.3 to 4.6 years, due to the high gas price in these provinces with an energy price ratio lower than 1.81. The use of this technology seems not to be attractive in Hubei, Qinghai, and Neimenggu because of their very low gas price.

5. Conclusions

The thermodynamic performance and economic viability analysis of a high temperature cascade heat pump system for steam generation is conducted in this paper. The effects of intermediate temperature, heat source temperature, heat sink temperature, working fluids, and the pinch point temperature difference at the evaporator, condenser, and intermediate heat exchanger on the thermodynamic performance and cost-effectiveness of the HTCHP system are investigated. The PBP varying with the gas price and electricity price is evaluated as well.
The results show that optimal ITs exist under different operational conditions, not only for the COP, but also for the PBP. The optimal IT for thew COP is 71.7 °C with the COP reaching 2.31, and that for the PBP is 75.78 °C with the PBP reaching 6.44 at the heat source temperature and the heat sink temperature of 30 °C and 120 °C, respectively. A high heat source temperature and low heat sink temperature are conducive to increasing the COP and shortening the PBP. The compressor suction volume flow rate and the SEC decrease greatly with the heat source, but are slightly affected by the heat sink temperature. The working fluid couple R1234Ze(E)-R1233zd(Z) seems to be a promising selection for the HTCHP system with a relatively high COP and short PBP. Besides, the GWP value of R1234Ze(E)-R1233zd(Z) is lower than 6. A lower pinch point temperature difference is beneficial to increasing the system COP and shortening the PBP. However, a lower pinch point temperature difference will increase the heat exchanger size, which would increase the SEC. The energy price has a great effect on the economic viability of the system. When the price ratio is lower than 1.81, the PBP is lower than 4.6 years.

Author Contributions

Conceptualization, Z.L.; methodology, Z.L.; investigation, G.L.; resources, Y.G.; project administration, Y.G.; validation, W.M.; writing—original draft preparation, Z.L.; writing—review and editing, Y.Y. All authors have read and agreed to the published version of the manuscript.

Funding

This research was funded by the Science and Technology Projects of State Grid Corporation of China (grant number: 5400-202140401A-0-0-00). The authors acknowledge State Grid Corporation of China for the funding.

Institutional Review Board Statement

Not applicable.

Informed Consent Statement

Not applicable.

Data Availability Statement

Not applicable.

Conflicts of Interest

The authors declare no conflict of interest.

Nomenclatures

1,2, …, 8thermodynamic state points
Aheat exchanger surface, m2
Boperating time in a year, h/year
Ccomponent cost, EUR
henthalpy, kJ/kg
kheat transfer coefficient, kW/(m2·K)
m ˙ mass flow rate, kg/s
Pprice, EUR
PBPpayback period, years
Q ˙ thermal capacity, kW
SECspecific equipment cost, EUR/kW
Ttemperature, °C
V ˙ volume flow rate, m3/s
W ˙ mechanical power, kW
Abbreviations
COPcoefficient of performance
GWPglobal warming potential
HCFOhydrochlorofluorocarbon
HEX heat exchanger
HFOhydrofluorocarbon
HTCHigh-temperature circuit
HTHPhigh-temperature heat pump
HTCHP high-temperature cascade heat pump
ITintermediate temperature
LMTDlogarithmic mean temperature difference
LTClow temperature circuit
Subscripts
auxauxiliary equipment
ccompressor
chxcascade heat exchanger
condcondenser
elelectricity
eqequipment
evapevaporator
ggas
pproject
pppinch point
refrefrigerant
SCsubcooling
SHsuperheating
sinkheat sink
sourceheat source
Greek Symbols
ηefficiency
vspecific volume, m3/kg

References

  1. IEA. Net Zero by 2050-a Roadmap for the Global Energy Sector. 2021. Available online: https://www.iea.org/reports/net-zero-by-2050 (accessed on 2 August 2022).
  2. Zhang, J.; Zhang, H.H.; He, Y.L.; Tao, W.Q. A comprehensive review on advances and applications of industrial heat pumps based on the practices in China. Appl. Energy 2016, 178, 800–825. [Google Scholar] [CrossRef]
  3. Park, H.; Kim, D.H.; Kim, M.S. Thermodynamic analysis of optimal intermediate temperatures in R134a–R410A cascade refrigeration systems and its experimental verification. Appl. Therm. Eng. 2013, 54, 319–327. [Google Scholar] [CrossRef]
  4. Kim, D.H.; Park, H.S.; Kim, M.S. Optimal temperature between high and low stage cycles for R134a/R410A cascade heat pump based water heater system. Exp. Therm. Fluid Sci. 2013, 47, 172–179. [Google Scholar] [CrossRef]
  5. Kim, D.H.; Kim, M.S. The effect of water temperature lift on the performance of cascade heat pump system. Appl. Therm. Eng. 2014, 67, 273–282. [Google Scholar] [CrossRef]
  6. Wang, B.M.; Wu, H.G.; Li, J.F.; Xing, Z.W. Experimental investigation on the performance of NH3/CO2 cascade refrigeration system with twin-screw compressor. Int. J. Refrig. 2021, 32, 1358–1365. [Google Scholar] [CrossRef]
  7. Ma, X.; Zhang, Y.; Fang, L.; Yu, X.; Li, X.; Ying, S.; Zhang, Y. Performance analysis of a cascade high temperature heat pump using R245fa and BY-3 as working fluid. Appl. Therm. Eng. 2018, 140, 466–475. [Google Scholar] [CrossRef]
  8. Wang, W.Y.; Lia, Y.Y.; Hu, B. Real-time efficiency optimization of a cascade heat pump system via multivariable extremum seeking. Appl. Therm. Eng. 2020, 176, 115399. [Google Scholar] [CrossRef]
  9. Dai, B.M.; Liu, X.; Liu, S.C.; Zhang, Y.Y.; Zhong, D.; Feng, Y.N.; Nian, V.; Hao, Y. Dual-pressure condensation high temperature heat pump system for waste heat recovery: Energetic and exergetic assessment. Energy Convers. Manag. 2020, 218, 112997. [Google Scholar] [CrossRef]
  10. Yu, X.H.; Zhang, Y.F.; Kong, L.T.; Zhang, Y. Thermodynamic analysis and parameter estimation of a high temperature industrial heat pump using a new binary mixture. Appl. Therm. Eng. 2018, 131, 715–723. [Google Scholar] [CrossRef]
  11. Zhang, Y.; Zhang, Y.F.; Yu, X.H.; Guo, J.; Deng, N.; Dong, S.M.; He, Z.L.; Ma, X.L. Analysis of a high temperature heat pump using BY-5 as refrigerant. Appl. Therm. Eng. 2017, 127, 1461–1468. [Google Scholar] [CrossRef]
  12. Bamigbetan, O.; Eikevik, T.M.; Nekså, P.; Bantle, M.; Schlemminger, C. Theoretical analysis of suitable fluids for high temperature heat pumps up to 125 °C heat delivery. Int. J. Refrig. 2018, 92, 185–195. [Google Scholar] [CrossRef]
  13. Mateu-Royo, C.; Arpagaus, C.; Mota-Babiloni, A.; Navarro-Esbrí, J.; Bertsch, S.S. Advanced high temperature heat pump configurations using low GWP refrigerants for industrial waste heat recovery: A comprehensive study. Energy Convers. Manag. 2021, 229, 113752. [Google Scholar] [CrossRef]
  14. Mateu-Royo, C.; Mota-Babiloni, A.; Navarro-Esbr, J. Semi-empirical and environmental assessment of the low GWP refrigerant HCFO-1224yd(Z) to replace HFC-245fa in high temperature heat pumps. Int. J. Refrig. 2021, 127, 120–127. [Google Scholar] [CrossRef]
  15. Mateu-Royo, C.; Mota-Babiloni, A.; Navarro-Esbrí, J.; Barragán, N. Comparative analysis of HFO-1234ze(E) and R-515B as low GWP alternatives to HFC-134a in moderately high temperature heat pumps. Int J Refrig. 2020, 124, 197–206. [Google Scholar] [CrossRef]
  16. Jiang, J.T.; Hu, B.; Wang, R.Z.; Liu, H.; Zhang, Z.P.; Li, H.B. Theoretical performance assessment of low-GWP refrigerant R1233zd(E) applied in high temperature heat pump system. Int. J. Refrig. 2021, 131, 897–908. [Google Scholar] [CrossRef]
  17. Fukuda, S.; Kondou, C.; Takata, N.; Koyama, S. Low GWP refrigerants R1234ze(E) and R1234ze(Z) for high temperature heat pumps. Int. J. Refrig. 2014, 40, 161–173. [Google Scholar] [CrossRef]
  18. Kosmadakis, G.; Arpagaus, C.; Neofytou, P.; Bertsch, S. Techno-economic analysis of high-temperature heat pumps with low-global warming potential refrigerants for upgrading waste heat up to 150 °C. Energy Convers. Manag. 2020, 226, 113488. [Google Scholar] [CrossRef]
  19. Kondou, C.; Koyam, S. Thermodynamic assessment of high-temperature heat pumps using Low-GWP HFO refrigerants for heat recovery. Int. J. Refrig. 2015, 53, 126–141. [Google Scholar] [CrossRef]
  20. Arpagaus, C.; Bless, F.; Schiffmann, J.; Bertsch, S.S. Multi-temperature heat pumps: A literature review. Int. J. Refrig 2016, 69, 437–465. [Google Scholar] [CrossRef]
  21. Ommen, T.; Jensen, J.K.; Markussen, W.B.; Reinholdt, L.; Elmegaard, B. Technical and economic working domains of industrial heat pumps: Part 1—Single stage vapour compression heat pumps. Int. J. Refrig. 2015, 55, 168–182. [Google Scholar] [CrossRef] [Green Version]
  22. Amalfi, R.L.; Vakili-Farahani, F.; Thome, J.R. Flow boiling and frictional pressure gradients in plate heat exchangers. Part 2: Comparison of literature methods to database and new prediction methods. Int. J. Refrig. 2016, 61, 185–203. [Google Scholar] [CrossRef]
  23. Longo, G.A.; Righetti, G.; Zilio, C. A new computational procedure for refrigerant condensation inside herringbone-type Brazed Plate Heat Exchangers. Int. J. Heat Mass Transf. 2015, 82, 530–536. [Google Scholar] [CrossRef]
  24. Luo, C.; Gong, Y.L.; Ma, W.B. Research on the Heat Transfer Experiment of R245fa(In Chinese). J. Refrig. 2014, 3, 21–25. [Google Scholar] [CrossRef]
  25. Cao, X.Q.; Yang, W.W.; Zhou, F.; He, Y.L. Performance analysis of different high temperature heat pump systems for low-grade waste heat recovery. Appl. Therm. Eng. 2014, 71, 291–300. [Google Scholar] [CrossRef]
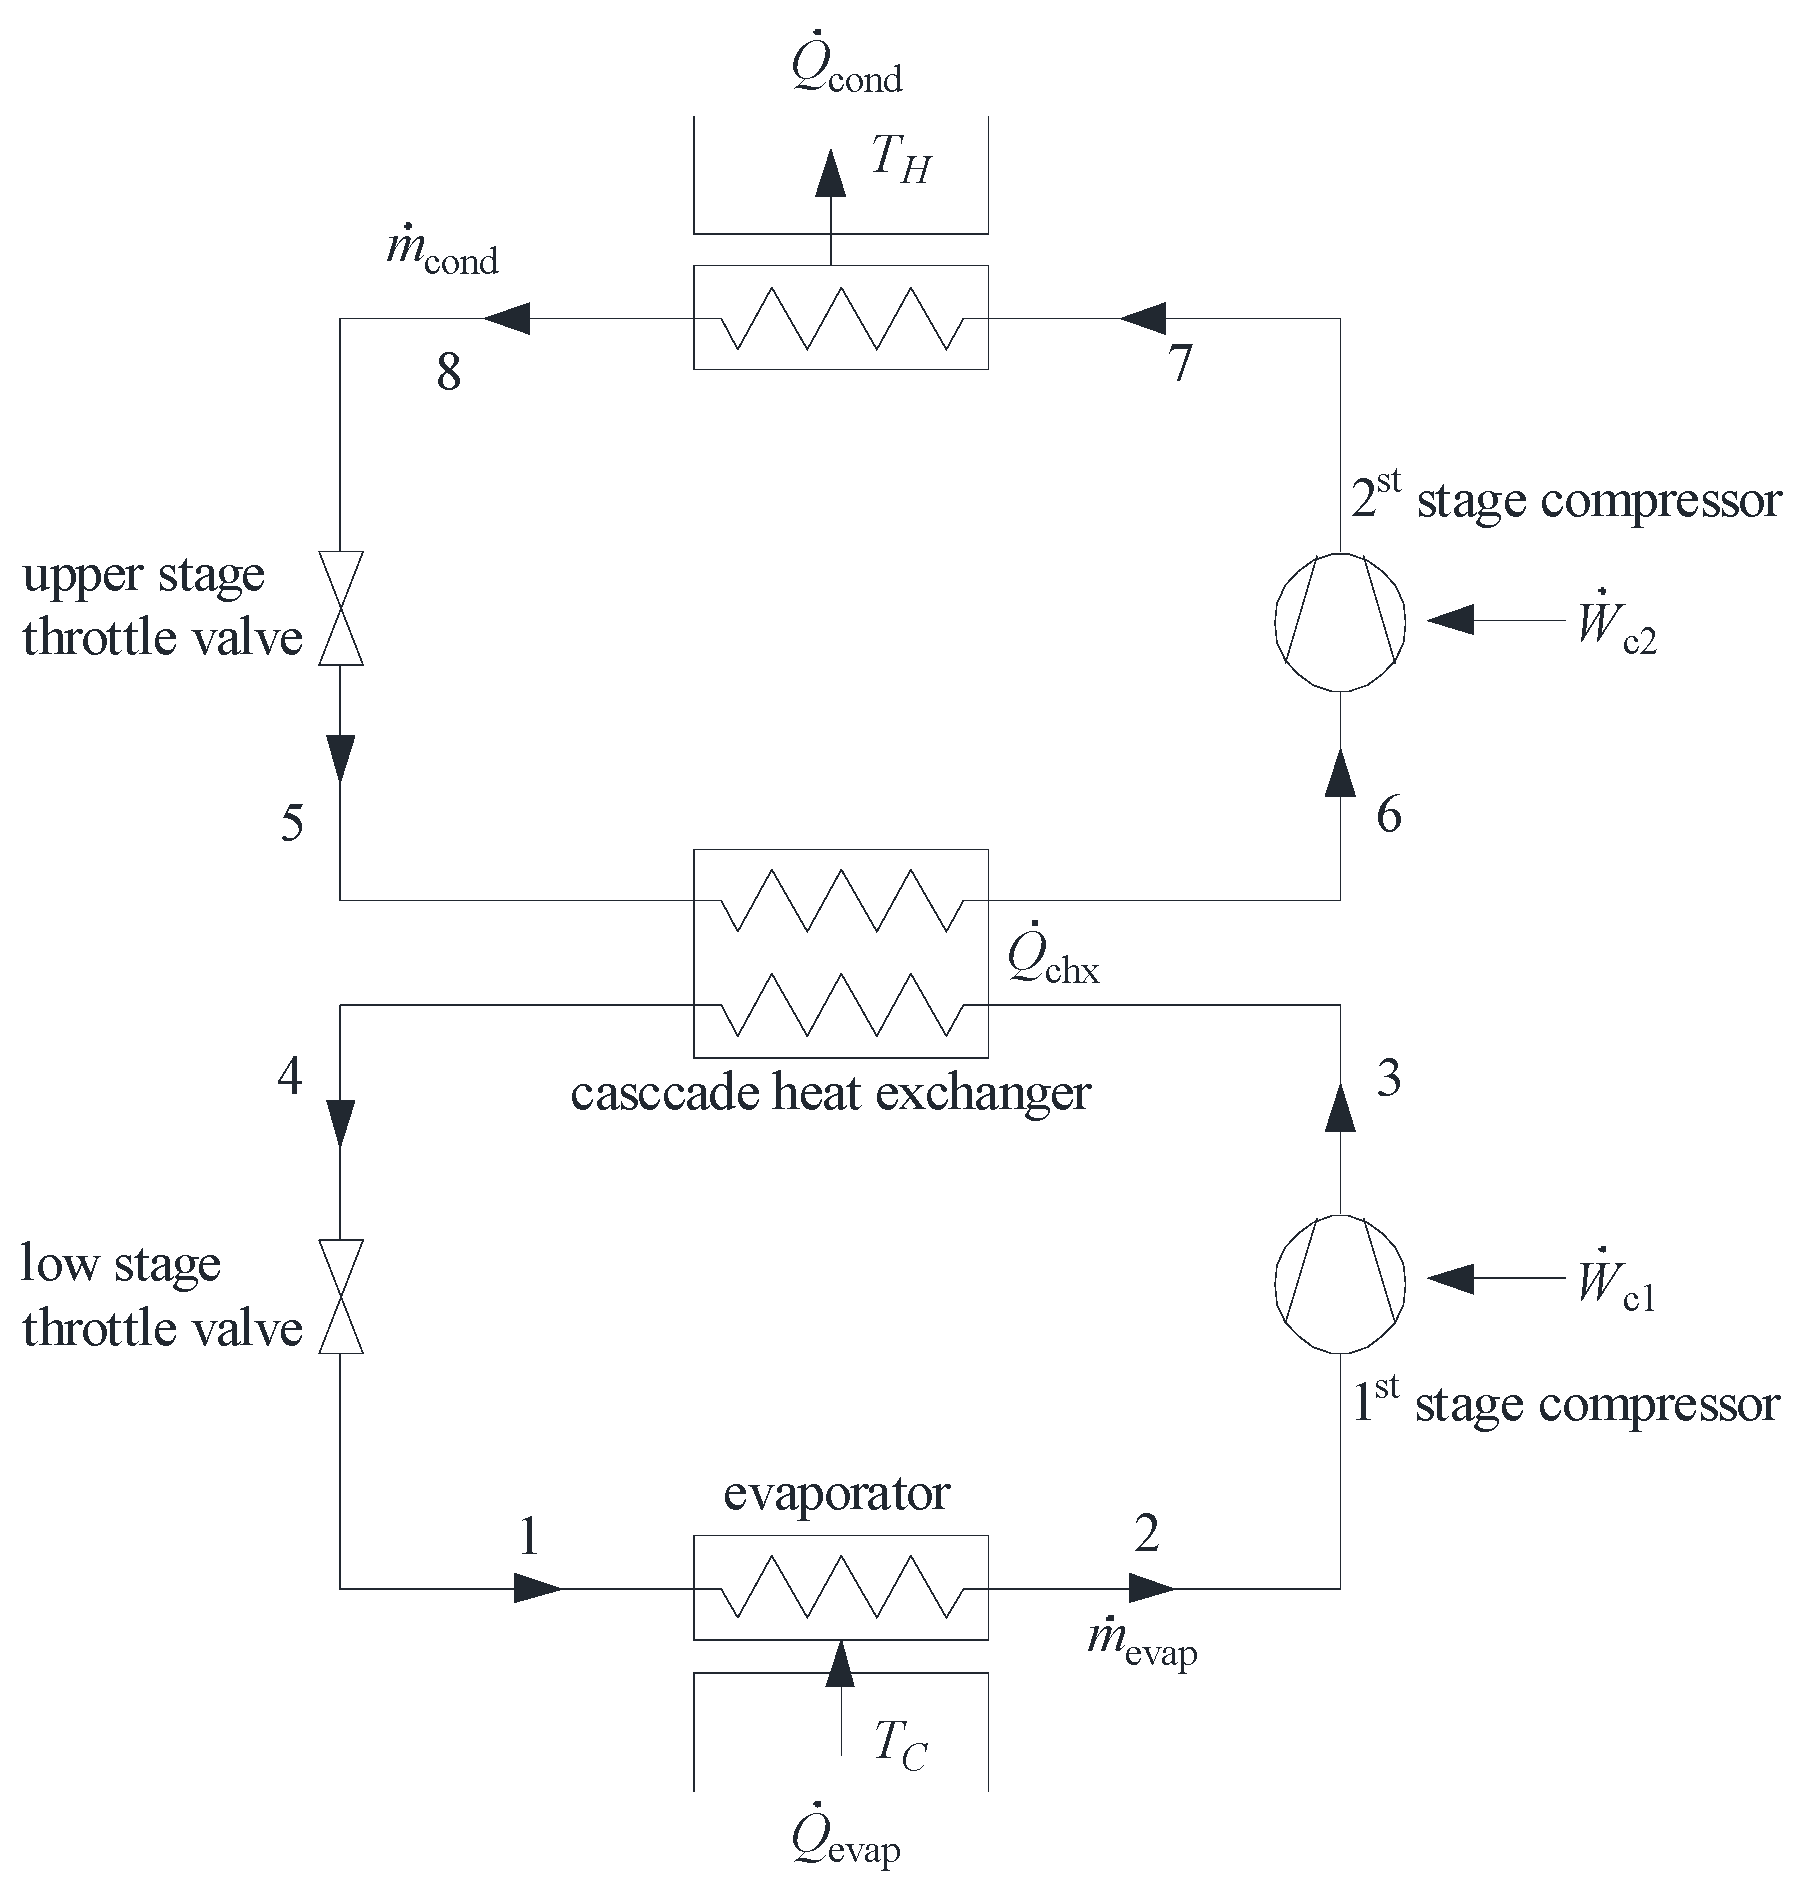
Figure 1. Principle of cascade heat pump system.
Processes 10 01862 g001
Figure 2. Comparison between COP obtained from thermodynamic analysis model and those from experiment.
Processes 10 01862 g002
Figure 3. Effects of the intermediate temperature on the thermodynamic performance. (a) COP at various intermediate temperatures. (b) Suction volume flow rate at various intermediate temperatures.
Processes 10 01862 g003
Figure 4. Effects of the intermediate temperature on the economic performance. (a) PBP at various intermediate temperatures. (b) SEC at various intermediate temperatures.
Processes 10 01862 g004
Figure 5. Effects of heat source/heat sink temperatures on the thermodynamic performance. (a) COP at various heat source/heat sink temperatures. (b) Suction volume flow rate at various heat source/heat sink temperatures.
Processes 10 01862 g005
Figure 6. Effects of heat source/heat sink temperatures on the economic performance. (a) PBP at various heat source/heat sink temperatures. (b) SEC at various heat source/heat sink temperatures.
Processes 10 01862 g006
Figure 7. Effects of working fluids on the thermodynamic performance. (a) COP change with various working fluids. (b) Suction volume flow rate change with various working fluids.
Processes 10 01862 g007
Figure 8. Effects of working fluids on the economic performance. (a) PBP change with various working fluids. (b) SEC change with various working fluids.
Processes 10 01862 g008
Figure 9. Effects of pinch point temperature difference on thermodynamic performance. (a) COP change with pinch point temperature difference at condenser and intermediate heat exchanger. (b) Suction volume flow rate change with pinch point temperature difference at condenser and intermediate heat exchanger. (c) COP change with pinch point temperature difference at evaporator and intermediate heat exchanger. (d) Suction volume flow rate change with pinch point temperature difference at evaporator and intermediate heat exchanger.
Processes 10 01862 g009
Figure 10. Effects of pinch point temperature difference on economic performance. (a) PBP change with pinch point temperature difference at condenser and intermediate heat exchanger. (b) SEC change with pinch point temperature difference at condenser and intermediate heat exchanger. (c) PBP change with pinch point temperature difference at evaporator and intermediate heat exchanger. (d) SEC change with pinch point temperature difference at evaporator and intermediate heat exchanger.
Processes 10 01862 g010
Figure 11. PBP with various electricity and gas prices.
Processes 10 01862 g011
Table 1. Parameters of refrigerants in the HTC.
Working FluidChemical FormulaGroupM (g/mol)tcr (°C)Pcr (bar)NBP (°C)GWPODPSG
R245faCHF2CH2CF3HFC134.0515436.515.38580B1
R1234ze(Z)CF3CH=CHFHFO114.04150.135.3-39.79.7<10A2L (expected)
R1336mzz(Z)CF3CH=CHCF3(Z)HFO164.06171.32933.420A1
R1233zd(E)CF3CH=CHClHCFO130.50166.537.718.310.0002A1 (expected)
Table 2. Parameters of refrigerants in the LTC.
Working FluidChemical FormulaGroupM (g/mol)tcr (°C)Pcr (bar)NBP (°C)GWPODPSG
R134aC2H2F4HFC102.03101.0640.59−26.314300A1
R1234ze(E)C3F4H2HFO114.04109.5136.34−19.060A2L
Table 3. The reference values and the boundary conditions.
ParametersReference ValuesBoundary Conditions
Heat source temperature Tsource (°C)4030~80
Heat sink temperature Tsink (°C)120100~120
Superheating degree ΔTSH (°C)0
Subcooling degree ΔTSC (°C)0
Condenser pinch point temperature difference ΔTpp,sink (°C)44~10
Evaporator pinch point temperature difference ΔTpp,source (°C)54~10
Intermediate heat exchanger pinch point temperature difference ΔTpp,chx (°C)62~10
Electricity cost (EUR/kWh)0.070.03~0.12
Gas prices (EUR/m3)0.350.25~0.7
Table 4. PBP for HTCHP industrial application in different provinces in China.
ProvinceElectricity Price
(Yuan/kWh)
Electricity Price
(EUR /kWh)
Gas Price
(Yuan/m3)
Gas Price
(EUR /m3)
Energy Price RatioPBP
Yunnan0.5320.0783.310.4851.633.3
Guangdong0.6080.0893.450.51.793.8
Guizhou0.5410.0793.050.451.84.3
Liaoning0.5290.0772.950.4341.814.6
Jiangxi0.6190.0913.20.471.965.2
Guangxi0.6260.0923.220.471.975.3
Hainan0.6360.0933.150.462.046.2
Jiangsu0.6420.0943.10.452.17
Shandong0.6170.0930.442.087
Heilongjiang0.5860.0862.80.412.128.1
Jilin0.5870.0862.80.412.128.1
Shanghai0.6710.09830.442.2611.2
Shanxi0.5080.0742.260.3342.2815.4
Zhejiang0.6640.0972.860.422.3516.3
Hebei0.5480.082.40.3542.3116.6
Qinghai0.3670.0541.60.232.3226
Hubei0.6120.092.530.3772.4533.6
Neimenggu0.4490.0661.820.272.577.8
Publisher’s Note: MDPI stays neutral with regard to jurisdictional claims in published maps and institutional affiliations.