Abstract
Conservation of energy usage is essential in chemical process plants due to the expanded energy users and demands alongside the carry-on hike of energy prices. This study analyzed the performance of energy savings in a heat exchanger network (HEN). It is based on decreasing utility usage while increasing process-to-process heat exchange in HEN using a path combination approach at different heat recovery approach temperatures (HRATs). The approach generates different combined path options for heat shifting from utilities to exchangers in a HEN. In terms of cost targeting, the optimal HRAT in a HEN is determined for each path’s combination option. The study focused on the HEN of crude oil preheat trains. Shifting heat load between utilities implies adding and subtracting loads to and from exchangers in a HEN. Therefore, a minor retrofit to compensate for the heat transfer area is required for some HEN exchangers. The optimum HRAT corresponding to the lowest total cost was determined for each option and ranged between 8 °C and 14 °C. Moreover, two out of five options in HEN with low capital investment and a short payback period were found to be promising.
1. Introduction
The intake of energy should always be considered in terms of cost and environmental sustainability. On the other hand, industrial and commercial users are always looking to increase productivity, operability, efficiency, and profitability while sparingly consuming energy [1]. Energy conservation can be achieved by efficient energy use in conjunction with decreased energy consumption and/or reduced consumption from conventional energy sources.
Energy consumption is a critical issue in many ways and especially in chemical processes because energy costs occupy an important share of the overall production cost of chemical processes. Therefore, heat integration studies are to be undertaken for chemical processes to keep the level of energy cost at a minimum.
Currently, and as stated from the concept of pinch technology, a heat exchanger network (HEN) that often results in a trade-off between equipment and operation cost can represent the best design for energy efficiency in a chemical process plant. This is dependent on the choice of the minimum temperature difference between hot and cold streams of the process, which is denoted by ΔTmin [2]. However, incorporating optimal heat exchanger networks into the original plant design or a retrofit design of an existing plant to reduce energy consumption is a difficult engineering problem [3]. The same concept can be further investigated by considering innovative ideas for optimizing an existing HEN of a chemical process plant for further increasing energy efficiency.
The current study adopted the concept of pinch technology for optimizing energy usage in an existing HEN for a pre-heat train of a crude oil distillation unit while generating different options of cost trade-off. The study resulted in different optimal heat recovery approach temperatures (HRATs).
Historical Review
The subject of heat exchanger networks (HENs) has been plentifully investigated during the last decades due to its impacts on energy conservation in chemical process plants. Different methods were developed for the synthesis and retrofit of HENs. The most well-known method is the pinch technology approach. The grass-roots design (synthesis) of HEN is concerned with defining the best exchanger matching between hot and cold streams, in other words, looking for the best matching among process streams with a trade-off between utility and equipment costs. For better management of energy usage in process plants, a number of studies have been employed for the designing of new HENs [1,2].
Aside from the new HEN design, it is sometimes needed to revamp the existing running HEN for what is called HEN retrofit. The drive for HEN retrofit is to increase plant capacity, allow for more feed or product specifications, decrease utility costs, and improve safety or decrease environmental emissions. Conducting a HEN retrofit implies heat loads within the network being altered [4]. In a HEN retrofit, the trade-off between operational utility cost and capital investment cost should be applied to yield the optimum heat transfer driving force, which is the heat recovery approach temperature (HRAT). In chemical processes, crude distillation units (CDUs) are considered major energy consumption units and require broad energy management from time to time. Heat transfer from hot products’ streams to the cold crude feed occurs through the application of HEN to reduce external energy requirements in coolers and furnaces. As a result, while the operating utility cost is reduced, the capital cost for installing a greater exchanger area is increased. Therefore, HEN retrofit is more likely preferred rather than designing new costly HEN for oil refineries [5].
Ahmad and Linnhoff introduced the principle of minimum temperature difference (∆Tmin) ahead of HEN design [6].
A sequential synthesis approach was proposed by Zhu et al., wherein they suggested the partitioning of HENs problems into “blocks” or sets of enthalpy intervals. Moreover, the problem for each set of the network evolved individually [7].
A retrofit potential program was developed by Siemanond and Kosol in 2012 to optimize an existing HEN with thermodynamic property considerations. Operational and capital cost trade-off is applied to obtain optimum heat recovery approach temperature (HRAT). The study was conducted using Visual Basic for Applications (VBA) to obtain the optimum pinch temperature automatically [8].
Ahmad et al. proposed a vertical heat exchange technique to estimate the contribution of each stream to the overall HEN area instead of equally distributing the area between the computed minimum numbers of exchangers. This method allows us to consider the available area for each stream and to manage the fact that some streams may not be active during some periods of operation [6,9].
An approach of path combination was developed by Osman et al. to generate several retrofit options to optimize energy consumption in an existing HEN. The options are sets of combined utility paths in a HEN. The same method of path combination is used to investigate heat recovery enhancement in HEN of variable streams’ temperature. Recently, they applied the same approach to investigate the environmental energy-saving in HEN along with the impact of CO2 emission [10,11,12].
For enhancing the energy recovery system, an energy-area parameter was introduced by Al Hagri et al. [13]. The HEN generated by considering this parameter was found to have less heat transfer area and energy consumption compared with an automated one. Moreover, for enhancing energy recovery in HEN systems, a new idea of mixing HEN streams of azeotrope formation was considered and introduced recently by Zhang et al. [14]. Moreover, Li et al. studied and analyzed heat transfer enhancement and better energy recovery by introducing a target evaluation method for HEN retrofit [15].
Further, and for maximum energy recovery and a minimum number of units in HEN with enhanced mass integration, Ong et al. used different methods to develop HEN for the hydrothermal liquefaction process [16]. The number of exchanger units was shown to be reduced by 50% in their new proposed methods compared to classical ones.
For generating the n-best HEN, Orosz et al. recently considered the P-graph framework to synthesize multiple-solution HEN depending on predefined structural constraints [17]. Alhajri et al. considered the graphical approach of the Pinch analysis method for optimizing an existing real HEN of the crude oil distillation operation to perform energy analysis and retrofit the network [18]. A recent approach that also considered the graphical tool of the pinch technology was proposed by Fu et al. to avoid crossing the pinch point in HENs of different minimum temperature differences. They proposed a shifted temperature driving force plot for retrofitting such kinds of HENs [19].
2. Methodology
The method used to carry out this study was conducted on the basis of utility path and path combination in the heat exchanger network developed by Osman et al. [10]. To prove the approach, it was applied to an existing common example taken from the literature, namely, the HEN of a pre-heat train unit in an industrial refinery [20].
The most critical data needed to conduct the approach involves stream heating and cooling information, as shown on the HEN grid diagram in Figure 1. The HEN includes six hot streams, as shown at the top of the figure running from left to right. The network has only one cold stream running from right to left at the bottom of the figure. Hot and cold streams exchange heat using six heat exchangers (E1–E6). In addition, one heater (H) and five coolers (C1–C5) are shown in the HEN with their heat loads. The temperature profile (°C) along the streams and heat capacity flow rates CP (kW/°C) are shown, as well as the heat load (kW) for each heat exchanger in HEN. The minimum heat transfer driving force between hot and cold streams in the HEN is 35 °C, which is called the heat recovery approach temperature (HRAT).
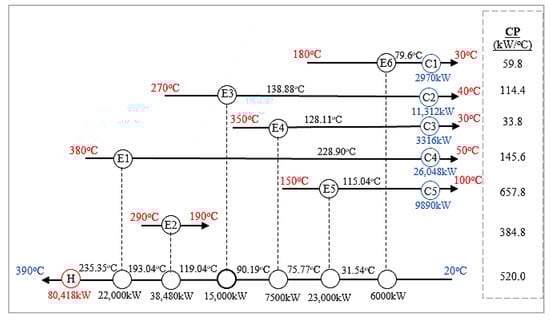
Figure 1.
Existing HEN of refinery pre-heat train.
2.1. Exchangers and Utility Data
All exchangers in the HEN case study were shell-and-tube heat exchangers where cold and hot fluids are allocated in shell side and tube sides, respectively. Table 1 shows the existing HEN stream’s data such as type of fluid, exchanger’ side, exchangers’ area (AE), existing exchangers’ heat loads (QE), and heat transfer coefficients for tube and shell sides (hT and hS). Table 2 shows the existing heater and cooler (QH and QC) heat loads in addition to hot and cold utility prices (HUprice and CUprice). It is worth mentioning that the same case study was previously studied by Ibrahim [21] using the same data in Table 1 and Table 2, in which the case was studied for only one moderate HRAT value.

Table 1.
Existing HEN steams’ data.
Table 2.
Existing HEN utility data.
2.2. Utility Path Identification and Combination for Existing HEN
Logically, a path is a sequence of connected distinct lines. According to pinch technology, utility paths are an imaginary connection between two different utilities in HEN. It is used to shift heat from utilities to increase process-to-process heat exchange on the basis of the (+/−) principle, where the heat load is subtracted and added to and from devices on the path alternatively [2].
In the existing case of HEN, there were 11 utility paths, as defined in the following Table 3. Such individual paths were combined using the math combination Equation (1) as conducted by Elsiddig to describe the diverse ways by which the available utility paths could be grouped for generating different options of the heat shifting process in HEN [22].
where C is combination, and n, r are non-negative integers, and (r ≤ n). n is the number of available utility paths in HEN, where r stands for the set of combined paths beside the options of single paths.
Table 3.
Individual utility paths in the existing HEN case.
The options of all combined paths are defined according to Equation (2) below:
The heat-shifting options must be evaluated for feasibility on the basis of the only parameter that limits the heat-shifting process, i.e., the HRAT value.
Referring to an earlier work conducted by Ibrahim [21] that considered only one moderate value for the HRAT, the total number of options for the same case of HEN investigated in that study was found to be 10 options. Five out of those 10 were found to be economically promising according to energy-area trade-off. The five options were carried out in the present work by considering a wide range of HRAT values from which the optimum can be selected and analyzed.
2.3. Heat Load Shifting Using Combined Paths
Before starting the process of heat shifting, different values of HRAT were set to be from 2.0 °C to 30 °C, instead of one HRAT value for the sake of selecting the most optimum. The process of heat shifting by subtraction and addition (+/−) of heat along the paths for the five options of combined utility paths is detailed in Table 4 below.
Table 4.
The selected combined paths in the HEN case.
To ensure thermodynamic equilibrium, energy balance in the shell and tube sides for each affected device was calculated continuously with any shifted heat load segment using a simple energy balance Equation (3). Since the process was repetitive and applied for different HRAT values, it was conducted using Dev C++ code to simplify the calculation and avoid mistakes. The heat-shifting process continued for each path until the designated HRAT value was reached.
where Q is heat duty (kW) for exchangers, heater and cooler, i.e., QE, QH, and QC. CP is heat capacity flow rate (kw/°C). T1 and T2 are exchanger input and output temperatures (°C), respectively, for either hot or cold stream.
2.4. Pinch Technology Targeting
Due to the heat shifting process, thermodynamic data for all affecting exchangers in HEN were subjected to changes in terms of heat duties and temperatures. The heat transfer area (A) for each exchanger was to be re-found using the area targeting Equation (4). As reported by Smith [4], the targeting stage in HEN retrofit and optimization does not deal with precise area. Instead, it is concerned mostly with area targeting, for which the overall heat transfer coefficient should assumed as U = (1/hS + 1/hT)−1.
where hS and hT are the heat transfer coefficients for shell and tube sides, respectively. LMTD is the logarithmic mean temperature difference for each exchanger in HEN, which is calculated according to Equations (5)–(7).
where TH,in, TH,out, TC,in, and TC,out are in and out temperatures for hot and cold sides, respectively, for each exchanger in HEN.
The total heat transfer area for the HEN (AHEN) is calculated as in Equation (8) before or after the heat-shifting process.
The difference between AHEN before (AHEN,ex) and after shifting heat loads (AHEN,new) is denoted as ΔAHEN, which is the added area penalty due to load distribution and relocation.
After estimating the overall HEN area requirement to overcome the relocation of heat loads, cost targeting was conducted to define the optimality of HRAT. Therefore, annual operating and capital investment costs were calculated in addition to the total cost for each option separately according to pinch technology targeting.
Operating cost is the cost of external heating and cooling utilities that are affected by the heat shifting process while increasing the heat recovery. Operating cost was calculated using a set of Equations (9) to (14).
where HUcost,ex and CUcost,ex are hot and cold utility cost ($/yr) of the existing case before heat shifting, respectively. QH,ex, QC,ex, QH,new, and QC,new are hot and cold utility heat duty (kW) for the existing and new cases (before and after heat shifting), respectively.
The capital cost to be invested for the added area requirement in the whole HEN was calculated using Equation (15).
According to Al-Riyami et al. [23], it is assumed that all HEN exchangers are made of carbon steel. The values of cost coefficients a, b, and c were 33,422, 814, and 0.81, respectively. ΔN is the number of required extra shells, which was found in Equations (16) and (17).
where avshell and Nshell are average size of exchangers shell and number of exchanger shells, respectively. Nshell is the same as the number of exchangers in HEN, which is 6.
The capital investment cost and according to Smith [4] can be expressed on an annual basis. We assumed that the capital was borrowed over a fixed period (n) ranging from 5 to 10 years at a fixed rate of interest (i). Therefore, the annualized capital cost can be calculated using Equation (18), where n is taken to be 5 years and interest i to be 0.05 for the current study.
To determine the optimum HRAT value for each path’s combination option, the total cost profile was to be defined for the lowest cost along with the range of HRAT vales. The total cost was the summation of both operating and annualized costs, as shown in Equation (19) below.
Economic Assessment
Overall, HEN profitability and the comparison between combined paths options were needed for making the right decision. Economic assessment of saving ($/year) and capital investment ($) were calculated as in Equations (10) and (15), respectively. The payback period (year) was calculated using Equation (20). Economic calculations were assessed on the basis of the following hypothesizes:
- Investment was considered only for the required added area.
- No piping or other costs were considered.
The overall method to describe the processes followed in this study can be summarized in the flow diagram shown in Figure 2 below.
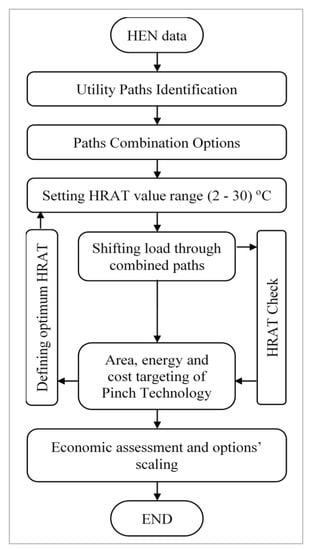
Figure 2.
Method flow diagram.
3. Results and Analysis
The initial results of heat recovery and energy consumption due to the heat-shifting process in the case study are tabulated in Table A1, Table A2, Table A3, Table A4, Table A5, Table A6, Table A7, Table A8, Table A9 and Table A10 located in Appendix A and Appendix B. A graphical representation of important results is interpreted and analyzed in this section.
3.1. Area Targeting
Due to the heat load shifting using combined paths, the obtained results of area targeting are showing the HEN area profile with HRAT values for the five options, as illustrated in Figure 3. The profile showed the total HEN area increasing step-wisely with shrinking HRAT values for each path combination option. Compared with the existing case, all options performed in a prime way, with option 3 taking the least and best area performance along the descending HRAT. Options 2 and 4 showed a typical performance, although they were made of different combinations of utility paths, with a short profile from 10 to 30 °C of HRAT. Before 10 °C, these two options showed excessive heat shifting that resulted in –ve values of utility duties that were not considered logically.
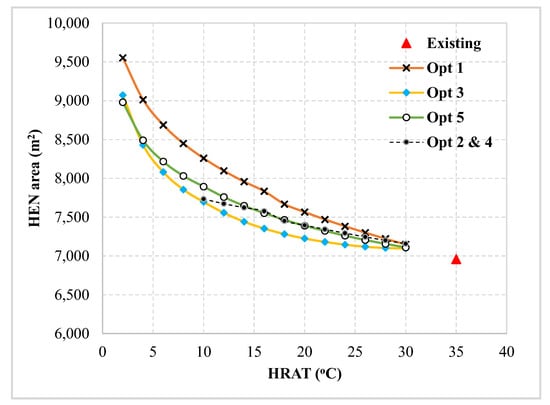
Figure 3.
Total HEN area based on HRAT for path combination options.
For the sake of comparison, Table 5 shows the difference in area targeting between the previous work of Ibrahim [21] and the present work. It is illustrated that the previous work for the same case study suggested only one value for the HRAT that would not reflect the optimality of the required additional area in the HEN and consequently the total investment cost. The high value of HRAT (27 °C) looked attractive for the heat transfer process, less area, and cost requirement in a HEN retrofit. However, it would not reflect the optimum operation of HEN compared to screening a wide range of HRAT and selecting the optimum on the basis of the trade-off between total cost and operating cost, as presented in the current study.
Table 5.
Comparison between previous and present work for area targeting in a HEN.
3.2. Cost Targeting
Optimum design or retrofit of HEN can be achieved by setting a perfect trade-off between capital investment and energy uses that defines optimum heat recovery approach temperature (HRAT). On the other hand, the lower the values of HRAT of HEN, the greater the possible setting for targets of capital and energy costs ahead of HEN retrofit and optimization design.
Figure 4 shows the cost targeting for operating and annual and capital cost profiles as regards path combination option (1). The optimum HRAT was shown to be 8 °C as a minimum heat transfer deriving force between hot and cold streams in a HEN, corresponding to a total cost of 16.1 × 10⁶ $/y.
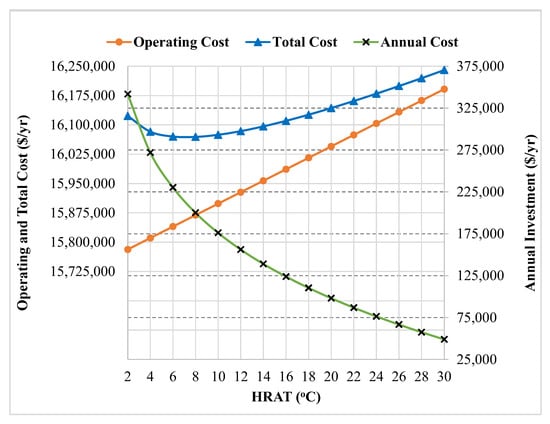
Figure 4.
Economic profile of the optimized HEN using option (1).
Although options (2) and (3) consist of different path combinations, they show a cost targeting of a typical profile, as illustrated in Figure 5. Since HRAT values ranged only between 10 and 30 °C, these options showed a semi-horizontal profile for the total cost. However, the minimum optimum HRAT value seemed to be more operable, namely, 14 °C at a higher total cost of 16.3 × 10⁶ $/y.
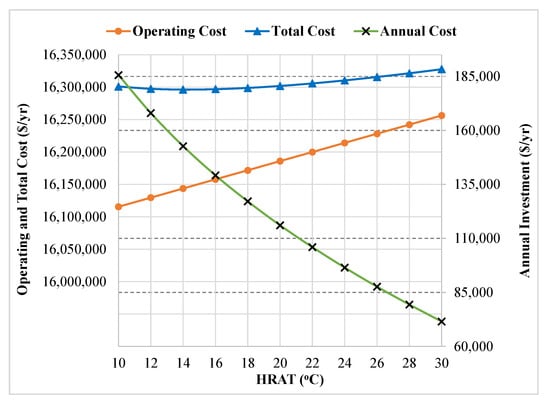
Figure 5.
Economic profile of the optimized HEN using options (2) and (4).
Option (3), as illustrated in Figure 6, showed a clear cost targeting profile summing with a minimum total cost of 16.15 × 10⁶ $/y at an optimum HRAT of 10 °C.
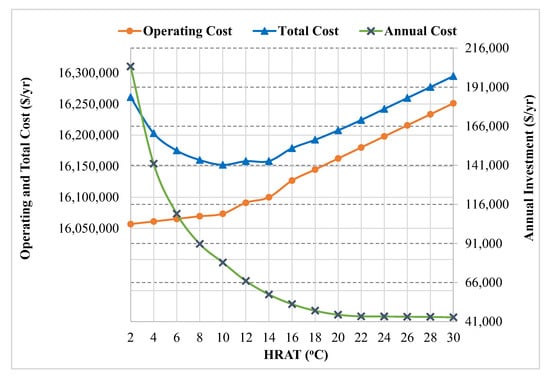
Figure 6.
Economic profile of the optimized HEN using option (3).
Figure 7 also shows a perfect cost profile for option (5), somewhat similar to option (3). The minimum total was 16.18 × 10⁶ $/y at a HRAT of 10 °C.
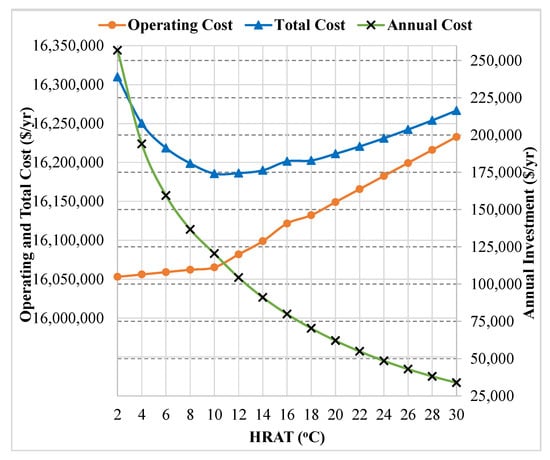
Figure 7.
Economic profile of the optimized HEN using option (5).
For the sake of cost targeting comparison, all path combination options are presented by a single illustration in Figure 8. Option (1) revealed the lowest total cost to be invested for revamping the HEN by adding the surface area to existing exchangers in the network; however, the HRAT was shown to be weak as a heat transfer driving force. Options (2) and (4) exposed stronger HRATs at the high optimum total cost. Options (3) and (5) showed similar optimum HRAT values at different total costs, wherein option (3) is presented to be the best among them all.
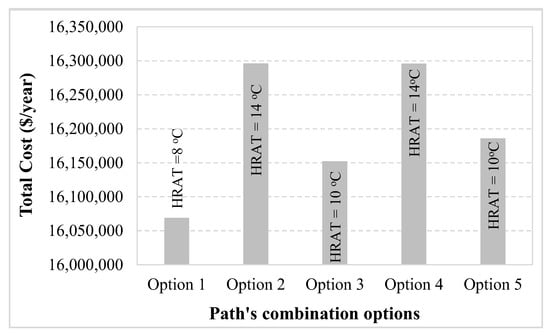
Figure 8.
Comparison between total cost profile and optimum HRAT.
Cost-Effective Analysis
For a more thorough economic analysis, a trade-off must be made between the capital cost of investment and the expected profit from energy savings for each option with the best HRAT.
This could simply be single-minded by taking the investment–savings ratio to obtain the payback period. The lower the payback, the better the expected cost-effective design or retrofit of the HEN.
Comparison and analysis in terms of investment cost and expected savings for each path combination option in a HEN were made on the basis of the payback period as depicted in Figure 9.
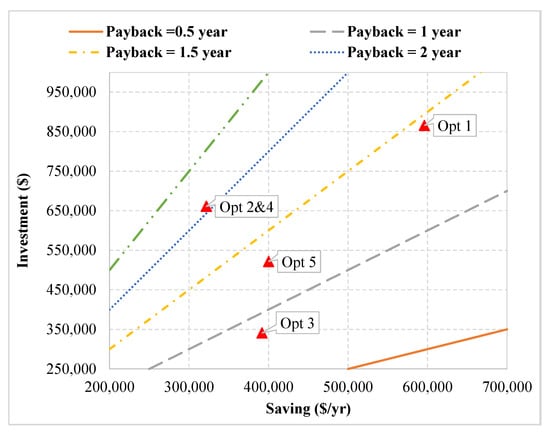
Figure 9.
Investment, saving, and payback at optimum HRAT for retrofit options.
From the figure, option (1) showed the highest savings at the expense of investing USD 850,000 with a 1.45-year payback period. It is worth mentioning that the HRAT for this option was the smallest among the rest of the other options, which restricted the heat transfer operation somewhere in the HEN. Therefore, option (1) will not be considered as an energy-saving option.
The typical readings for options (2) and (4) showed the lowest saving among others, with moderate capital investment and higher payback of more than 2 years.
Options (3) and (5) showed the same energy savings but with different capital investments (USD 341,000 for option (3) and USD 522,000 for option (5)). Therefore, option (3) was preferred and considered the best among others, especially for the payback period of only 0.87 years (about 10 and a half months).
4. Conclusions
A minor retrofit for energy optimization in an existing HEN can be accomplished using the path combination approach within the pinch technology method for minimizing utility consumption at optimum HRAT. The minor retrofit could feature only area addition to the existing exchangers in a HEN.
When using utility paths for energy optimization in a HEN, the related previous work in the literature shows that utility paths are used to shift the heat load between utility devices through considering single paths individually. The idea of using the available utility paths in HEN as clusters to shift the heat load in a simultaneous way makes the heat-shifting process tighter, resulting in a compact, optimized HEN. Moreover, considering the area and energy targeting of pinch technology, together with the idea of combined utility paths, adds new value to the heat integration and optimization process.
On the basis of the suggested method, an excessive heat load shifting process can be conducted in a HEN using different options at different heat recovery approach temperatures (HRATs). Using cost targeting analysis, the optimum HRAT for each option can be defined separately. The cost-effective analysis is a great tool to compare the options for choosing the best for energy optimization in a HEN when making the right decision.
The huge number of repetitions is a drawback that can be resolved if the related software packages are considered.
It is recommended that future work consider sensitivity analysis by applying the same idea to the HEN of variable stream flows and fluctuating utility prices with time.
Author Contributions
Conceptualization, A.O.; Formal Analysis, Investigation, and Methodology, A.O.; Resources, A.O. and M.S.M.; Supervision and Validation, A.O.; Visualization, A.O. and M.S.M.; Writing—Original Draft, M.S.M.; Writing—Review and Editing, A.O. and M.S.M. All authors have read and agreed to the published version of the manuscript.
Funding
This research was funded by Deanship of Scientific Research at Najran University, grant number NU/-/SERC/10/531.
Institutional Review Board Statement
Not applicable.
Informed Consent Statement
Not applicable.
Data Availability Statement
Data will be available upon request.
Acknowledgments
The authors are thankful to the Deanship of Scientific Research at Najran University for funding this work under the General Research Funding program grant code (NU/-/SERC/10/531).
Conflicts of Interest
The authors declare no conflict of interest.
Appendix A
Heat recovery data: The obtained results for heat duty for exchangers in HEN are tabulated for the five heat shifting options in Table A1, Table A2, Table A3, Table A4 and Table A5.
Table A1.
Heat loads at different HRAT values for option (1).
Table A1.
Heat loads at different HRAT values for option (1).
| HRAT (°C) | QE1 (kW) | QE2 (kW) | QE3 (kW) | QE4 (kW) | QE5 (kW) | QE6 (kW) | Total (kW) |
|---|---|---|---|---|---|---|---|
| Existing | 22,000 | 38,480 | 15,000 | 7500 | 23,000 | 6000 | 111,980 |
| 2 | 22,001 | 38,480 | 20,341 | 7500 | 23,000 | 6000 | 117,322 |
| 4 | 22,001 | 38,480 | 20,112 | 7500 | 23,000 | 6000 | 117,093 |
| 6 | 22,001 | 38,480 | 19,884 | 7500 | 23,000 | 6000 | 116,865 |
| 8 | 22,001 | 38,480 | 19,655 | 7500 | 23,000 | 6000 | 116,636 |
| 10 | 22,001 | 38,480 | 19,426 | 7500 | 23,000 | 6000 | 116,407 |
| 12 | 22,001 | 38,480 | 19,197 | 7500 | 23,000 | 6000 | 116,178 |
| 14 | 22,001 | 38,480 | 18,968 | 7500 | 23,000 | 6000 | 115,949 |
| 16 | 22,001 | 38,480 | 18,740 | 7500 | 23,000 | 6000 | 115,721 |
| 18 | 22,001 | 38,480 | 18,511 | 7500 | 23,000 | 6000 | 115,492 |
| 20 | 22,001 | 38,480 | 18,282 | 7500 | 23,000 | 6000 | 115,263 |
| 22 | 22,001 | 38,480 | 18,053 | 7500 | 23,000 | 6000 | 115,034 |
| 24 | 22,001 | 38,480 | 17,824 | 7500 | 23,000 | 6000 | 114,805 |
| 26 | 22,001 | 38,480 | 17,594 | 7500 | 23,000 | 6000 | 114,575 |
| 28 | 22,001 | 38,480 | 17,367 | 7500 | 23,000 | 6000 | 114,348 |
| 30 | 22,001 | 38,480 | 17,138 | 7500 | 23,000 | 6000 | 114,119 |
Table A2.
Heat loads at different HRAT values for option (2).
Table A2.
Heat loads at different HRAT values for option (2).
| HRAT (°C) | QE1 (kW) | QE2 (kW) | QE3 (kW) | QE4 (kW) | QE5 (kW) | QE6 (kW) | Total (kW) |
|---|---|---|---|---|---|---|---|
| Existing | 22,000 | 38,480 | 15,000 | 7500 | 23,000 | 6000 | 111,980 |
| 2 | 22,000 | 38,480 | 15,000 | 7500 | 23,000 | 9449 | 115,429 |
| 4 | 22,000 | 38,480 | 15,000 | 7500 | 23,000 | 9329 | 115,309 |
| 6 | 22,000 | 38,480 | 15,000 | 7500 | 23,000 | 9209 | 115,189 |
| 8 | 22,000 | 38,480 | 15,000 | 7500 | 23,000 | 9090 | 115,070 |
| 10 | 22,000 | 38,480 | 15,000 | 7500 | 23,000 | 8970 | 114,950 |
| 12 | 22,000 | 38,480 | 15,000 | 7500 | 23,000 | 8851 | 114,831 |
| 14 | 22,000 | 38,480 | 15,000 | 7500 | 23,000 | 8731 | 114,711 |
| 16 | 22,000 | 38,480 | 15,000 | 7501 | 23,001 | 8611 | 114,593 |
| 18 | 22,000 | 38,480 | 15,000 | 7501 | 23,001 | 8492 | 114,474 |
| 20 | 22,000 | 38,480 | 15,000 | 7501 | 23,001 | 8372 | 114,354 |
| 22 | 22,000 | 38,480 | 15,000 | 7501 | 23,001 | 8253 | 114,235 |
| 24 | 22,000 | 38,480 | 15,000 | 7501 | 23,001 | 8133 | 114,115 |
| 26 | 22,000 | 38,480 | 15,000 | 7501 | 23,001 | 8013 | 113,995 |
| 28 | 22,000 | 38,480 | 15,000 | 7501 | 23,001 | 7894 | 113,876 |
| 30 | 22,000 | 38,480 | 15,000 | 7501 | 23,001 | 7774 | 113,756 |
Table A3.
Heat loads at different HRAT values for option (3).
Table A3.
Heat loads at different HRAT values for option (3).
| HRAT (°C) | QE1 (kW) | QE2 (kW) | QE3 (kW) | QE4 (kW) | QE5 (kW) | QE6 (kW) | Total (kW) |
|---|---|---|---|---|---|---|---|
| Existing | 22,000 | 38,480 | 15,000 | 7500 | 23,000 | 6000 | 111,980 |
| 2 | 27,693 | 38,480 | 15,000 | 7500 | 22,999 | 3279 | 114,951 |
| 4 | 27,289 | 38,480 | 15,000 | 7500 | 22,999 | 3683 | 114,951 |
| 6 | 26,885 | 38,480 | 15,000 | 7500 | 22,999 | 4047 | 114,911 |
| 8 | 26,480 | 38,480 | 15,000 | 7500 | 22,999 | 4492 | 114,951 |
| 10 | 26,075 | 38,480 | 15,000 | 7500 | 23,000 | 4896 | 114,951 |
| 12 | 25,717 | 38,480 | 15,000 | 7500 | 23,000 | 5135 | 114,832 |
| 14 | 25,359 | 38,480 | 15,000 | 7500 | 23,000 | 5373 | 114,712 |
| 16 | 25,002 | 38,480 | 15,000 | 7500 | 23,000 | 5610 | 114,592 |
| 18 | 24,643 | 38,480 | 15,000 | 7500 | 23,000 | 5850 | 114,473 |
| 20 | 24,286 | 38,480 | 15,000 | 7500 | 23,000 | 6087 | 114,353 |
| 22 | 23,927 | 38,480 | 15,000 | 7500 | 23,000 | 6327 | 114,234 |
| 24 | 23,575 | 38,480 | 15,000 | 7500 | 23,000 | 6564 | 114,119 |
| 26 | 23,212 | 38,480 | 15,000 | 7500 | 23,000 | 6802 | 113,994 |
| 28 | 22,854 | 38,480 | 15,000 | 7500 | 23,000 | 7041 | 113,875 |
| 30 | 22,496 | 38,480 | 15,000 | 7500 | 23,000 | 7279 | 113,755 |
Table A4.
Heat loads at different HRAT values for option (4).
Table A4.
Heat loads at different HRAT values for option (4).
| HRAT (°C) | QE1 (kW) | QE2 (kW) | QE3 (kW) | QE4 (kW) | QE5 (kW) | QE6 (kW) | Total (kW) |
|---|---|---|---|---|---|---|---|
| Existing | 22,000 | 38,480 | 15,000 | 7500 | 23,000 | 6000 | 111,980 |
| 2 | 22,000 | 38,480 | 15,000 | 7500 | 23,000 | 9449 | 115,429 |
| 4 | 22,000 | 38,480 | 15,000 | 7500 | 23,000 | 9329 | 115,309 |
| 6 | 22,000 | 38,480 | 15,000 | 7500 | 23,000 | 9209 | 115,189 |
| 8 | 22,000 | 38,480 | 15,000 | 7500 | 23,000 | 9090 | 115,070 |
| 10 | 22,001 | 38,480 | 15,001 | 7501 | 23,001 | 8970 | 114,950 |
| 12 | 22,001 | 38,480 | 15,001 | 7501 | 23,001 | 8851 | 114,831 |
| 14 | 22,001 | 38,480 | 15,001 | 7501 | 23,001 | 8731 | 114,711 |
| 16 | 22,001 | 38,480 | 15,001 | 7501 | 23,001 | 8611 | 114,595 |
| 18 | 22,001 | 38,480 | 15,001 | 7501 | 23,001 | 8492 | 114,476 |
| 20 | 22,001 | 38,480 | 15,001 | 7501 | 23,001 | 8372 | 114,356 |
| 22 | 22,001 | 38,480 | 15,001 | 7501 | 23,001 | 8253 | 114,237 |
| 24 | 22,001 | 38,480 | 15,001 | 7501 | 23,001 | 8133 | 114,117 |
| 26 | 22,001 | 38,480 | 15,001 | 7501 | 23,001 | 8013 | 113,997 |
| 28 | 22,001 | 38,480 | 15,001 | 7501 | 23,001 | 7894 | 113,878 |
| 30 | 22,001 | 38,480 | 15,001 | 7501 | 23,001 | 7774 | 113,758 |
Table A5.
Heat loads at different HRAT values for option (5).
Table A5.
Heat loads at different HRAT values for option (5).
| HRAT (°C) | QE1 (kW) | QE2 (kW) | QE3 (kW) | QE4 (kW) | QE5 (kW) | QE6 (kW) | Total (kW) |
|---|---|---|---|---|---|---|---|
| Existing | 22,000 | 38,480 | 15,000 | 7500 | 23,000 | 6000 | 111,980 |
| 2 | 22,001 | 38,480 | 21,011 | 7501 | 23,001 | 2961 | 114,955 |
| 4 | 22,001 | 38,480 | 20,718 | 7501 | 23,001 | 3254 | 114,955 |
| 6 | 22,001 | 38,480 | 20,424 | 7501 | 23,001 | 3548 | 114,955 |
| 8 | 22,001 | 38,480 | 20,131 | 7501 | 23,001 | 3841 | 114,955 |
| 10 | 22,001 | 38,480 | 19,837 | 7500 | 23,000 | 4133 | 114,951 |
| 12 | 22,001 | 38,480 | 19,598 | 7501 | 23,001 | 4274 | 114,955 |
| 14 | 22,001 | 38,480 | 19,318 | 7501 | 23,001 | 4414 | 114,715 |
| 16 | 22,001 | 38,480 | 19,059 | 7501 | 23,001 | 4553 | 114,595 |
| 18 | 22,001 | 38,480 | 18,799 | 7501 | 23,001 | 4694 | 114,476 |
| 20 | 22,001 | 38,480 | 18,540 | 7501 | 23,001 | 4833 | 114,356 |
| 22 | 22,001 | 38,480 | 18,280 | 7501 | 23,001 | 4974 | 114,237 |
| 24 | 22,001 | 38,480 | 18,020 | 7501 | 23,001 | 5114 | 114,117 |
| 26 | 22,001 | 38,480 | 17,761 | 7501 | 23,001 | 5253 | 113,997 |
| 28 | 22,001 | 38,480 | 17501 | 7501 | 23,001 | 5394 | 113,878 |
| 30 | 22,001 | 38,480 | 17,242 | 7501 | 23,001 | 5533 | 113,758 |
Appendix B
Energy consumption data: Heat duties of utility devices (heater and coolers) in the case of the HEN example are tabulated in Table A6, Table A7, Table A8, Table A9 and Table A10. This involves external energy requirements for the heat-shifting options before and after the heat-shifting process.
Table A6.
External energy consumption at different HRAT values for option (1).
Table A6.
External energy consumption at different HRAT values for option (1).
| HRAT (°C) | QC1 (kW) | QC2 (kW) | QC3 (kW) | QC4 (kW) | QC5 (kW) | QH (kW) | Total (kW) |
|---|---|---|---|---|---|---|---|
| Existing | 2970 | 11,312 | 3316 | 26,048 | 9890 | 80,418 | 133,954 |
| 2 | 2970 | 5971 | 3316 | 26,047 | 9890 | 75,076 | 123,272 |
| 4 | 2970 | 6200 | 3316 | 26,047 | 9890 | 75,305 | 123,728 |
| 6 | 2970 | 6428 | 3316 | 26,047 | 9890 | 75,533 | 124,184 |
| 8 | 2970 | 6657 | 3316 | 26,047 | 9890 | 75,762 | 124,642 |
| 10 | 2970 | 6886 | 3316 | 26,047 | 9890 | 75,991 | 125,100 |
| 12 | 2970 | 7115 | 3316 | 26,047 | 9890 | 76,220 | 125,558 |
| 14 | 2970 | 7344 | 3316 | 26,047 | 9890 | 76,449 | 126,016 |
| 16 | 2970 | 7572 | 3316 | 26,047 | 9890 | 76,677 | 126,472 |
| 18 | 2970 | 7801 | 3316 | 26,047 | 9890 | 76,906 | 126,930 |
| 20 | 2970 | 8030 | 3316 | 26,047 | 9890 | 77,135 | 127,388 |
| 22 | 2970 | 8259 | 3316 | 26,047 | 9890 | 77,364 | 127,846 |
| 24 | 2970 | 8488 | 3316 | 26,047 | 9890 | 77,593 | 128,304 |
| 26 | 2970 | 8716 | 3316 | 26,047 | 9890 | 77,821 | 128,760 |
| 28 | 2970 | 8945 | 3316 | 26,047 | 9890 | 78,050 | 129,218 |
| 30 | 2970 | 9174 | 3316 | 26,047 | 9890 | 78,279 | 129,676 |
Table A7.
External energy consumption at different HRAT values for option (2).
Table A7.
External energy consumption at different HRAT values for option (2).
| HRAT (°C) | QC1 (kW) | QC2 (kW) | QC3 (kW) | QC4 (kW) | QC5 (kW) | QH (kW) | Total (kW) |
|---|---|---|---|---|---|---|---|
| Existing | 2970 | 11,312 | 3316 | 26,048 | 9890 | 80,418 | 133,954 |
| 2 | −479 | 11,312 | 3316 | 26,048 | 9890 | 77,448 | 127,535 |
| 4 | −359 | 11,312 | 3316 | 26,048 | 9890 | 77,448 | 127,655 |
| 6 | −239 | 11,312 | 3316 | 26,048 | 9890 | 77,448 | 127,775 |
| 8 | −120 | 11,312 | 3316 | 26,048 | 9890 | 77,448 | 127,894 |
| 10 | 0 | 11,312 | 3315 | 26,048 | 9889 | 77,446 | 128,010 |
| 12 | 119 | 11,312 | 3315 | 26,048 | 9889 | 77,565 | 128,248 |
| 14 | 239 | 11,312 | 3315 | 26,048 | 9889 | 77,685 | 128,488 |
| 16 | 359 | 11,312 | 3315 | 26,048 | 9889 | 77,805 | 128,728 |
| 18 | 478 | 11,312 | 3315 | 26,048 | 9889 | 77,924 | 128,966 |
| 20 | 598 | 11,312 | 3315 | 26,048 | 9889 | 78,044 | 129,206 |
| 22 | 717 | 11,312 | 3315 | 26,048 | 9889 | 78,163 | 129,444 |
| 24 | 837 | 11,312 | 3315 | 26,048 | 9889 | 78,283 | 129,684 |
| 26 | 957 | 11,312 | 3315 | 26,048 | 9889 | 78,403 | 129,924 |
| 28 | 1076 | 11,312 | 3315 | 26,048 | 9889 | 78,522 | 130,162 |
| 30 | 1196 | 11,312 | 3315 | 26,048 | 9889 | 78,642 | 130,402 |
Table A8.
External energy consumption at different HRAT values for option (3).
Table A8.
External energy consumption at different HRAT values for option (3).
| HRAT (°C) | QC1 (kW) | QC2 (kW) | QC3 (kW) | QC4 (kW) | QC5 (kW) | QH (kW) | Total (kW) |
|---|---|---|---|---|---|---|---|
| Existing | 2970 | 11,312 | 3316 | 26,048 | 9890 | 80,418 | 133,954 |
| 2 | 5691 | 11,312 | 3316 | 20,356 | 9890 | 77,448 | 128,013 |
| 4 | 5287 | 11,312 | 3316 | 20,759 | 9891 | 77,448 | 128,013 |
| 6 | 4883 | 11,312 | 3316 | 21,163 | 9891 | 77,448 | 128,013 |
| 8 | 4478 | 11,312 | 3316 | 21,568 | 9891 | 77,448 | 128,013 |
| 10 | 4074 | 11,312 | 3316 | 21,973 | 9890 | 77,448 | 128,013 |
| 12 | 3835 | 11,312 | 3316 | 22,331 | 9890 | 77,566 | 128,250 |
| 14 | 3597 | 11,312 | 3316 | 22,689 | 9890 | 77,686 | 128,490 |
| 16 | 3360 | 11,312 | 3316 | 23,046 | 9890 | 77,806 | 128,730 |
| 18 | 3120 | 11,312 | 3316 | 23,405 | 9890 | 77,925 | 128,968 |
| 20 | 2883 | 11,312 | 3316 | 23,762 | 9890 | 78,045 | 129,208 |
| 22 | 2643 | 11,312 | 3316 | 24,121 | 9890 | 78,164 | 129,446 |
| 24 | 2406 | 11,312 | 3316 | 24,478 | 9890 | 78,284 | 129,686 |
| 26 | 2168 | 11,312 | 3316 | 24,836 | 9890 | 78,404 | 129,926 |
| 28 | 1929 | 11,312 | 3316 | 25,194 | 9890 | 78,523 | 130,164 |
| 30 | 1691 | 11,312 | 3316 | 25,552 | 9890 | 78,643 | 130,404 |
Table A9.
External energy consumption at different HRAT values for option (4).
Table A9.
External energy consumption at different HRAT values for option (4).
| HRAT (°C) | QC1 (kW) | QC2 (kW) | QC3 (kW) | QC4 (kW) | QC5 (kW) | QH (kW) | Total (kW) |
|---|---|---|---|---|---|---|---|
| Existing | 2970 | 11,312 | 3316 | 26,048 | 9890 | 80,418 | 133,954 |
| 2 | −479 | 11,312 | 3316 | 26,048 | 9890 | 77,448 | 127,535 |
| 4 | −359 | 11,312 | 3316 | 26,048 | 9890 | 77,448 | 127,655 |
| 6 | −239 | 11,312 | 3316 | 26,048 | 9890 | 77,448 | 127,775 |
| 8 | −120 | 11,312 | 3316 | 26,048 | 9890 | 77,448 | 127,894 |
| 10 | 0 | 11,312 | 3315 | 26,047 | 9889 | 77,444 | 128,007 |
| 12 | 119 | 11,312 | 3315 | 26,047 | 9889 | 77,563 | 128,245 |
| 14 | 239 | 11,312 | 3315 | 26,047 | 9889 | 77,683 | 128,485 |
| 16 | 359 | 11,312 | 3315 | 26,047 | 9889 | 77,803 | 128,725 |
| 18 | 478 | 11,312 | 3315 | 26,047 | 9889 | 77,922 | 128,963 |
| 20 | 598 | 11,312 | 3315 | 26,047 | 9889 | 78,042 | 129,203 |
| 22 | 717 | 11,312 | 3315 | 26,047 | 9889 | 78,161 | 129,441 |
| 24 | 837 | 11,312 | 3315 | 26,047 | 9889 | 78,281 | 129,681 |
| 26 | 957 | 11,312 | 3315 | 26,047 | 9889 | 78,401 | 129,921 |
| 28 | 1076 | 11,312 | 3315 | 26,047 | 9889 | 78,520 | 130,159 |
| 30 | 1196 | 11,312 | 3315 | 26,047 | 9889 | 78,640 | 130,399 |
Table A10.
External energy consumption at different HRAT values for option (5).
Table A10.
External energy consumption at different HRAT values for option (5).
| HRAT (°C) | QC1 (kW) | QC2 (kW) | QC3 (kW) | QC4 (kW) | QC5 (kW) | QH (kW) | Total (kW) |
|---|---|---|---|---|---|---|---|
| Existing | 2970 | 11,312 | 3316 | 26,048 | 9890 | 80,418 | 133,954 |
| 2 | 6009 | 5301 | 3315 | 26,047 | 9889 | 77,444 | 128,005 |
| 4 | 5716 | 5594 | 3315 | 26,047 | 9889 | 77,444 | 128,005 |
| 6 | 5422 | 5888 | 3315 | 26,047 | 9889 | 77,444 | 128,005 |
| 8 | 5129 | 6181 | 3315 | 26,047 | 9889 | 77,444 | 128,005 |
| 10 | 4837 | 6475 | 3316 | 26,048 | 9890 | 77,448 | 128,014 |
| 12 | 4696 | 6734 | 3315 | 26,047 | 9889 | 77,563 | 128,244 |
| 14 | 4556 | 6994 | 3315 | 26,047 | 9889 | 77,683 | 128,484 |
| 16 | 4417 | 7253 | 3315 | 26,047 | 9889 | 77,803 | 128,724 |
| 18 | 4276 | 7513 | 3315 | 26,047 | 9889 | 77,922 | 128,962 |
| 20 | 4137 | 7772 | 3315 | 26,047 | 9889 | 78,042 | 129,202 |
| 22 | 3996 | 8032 | 3315 | 26,047 | 9889 | 78,161 | 129,440 |
| 24 | 3856 | 8292 | 3315 | 26,047 | 9889 | 78,281 | 129,680 |
| 26 | 3717 | 8551 | 3315 | 26,047 | 9889 | 78,401 | 129,920 |
| 28 | 3576 | 8811 | 3315 | 26,047 | 9889 | 78,520 | 130,158 |
| 30 | 3437 | 9070 | 3315 | 26,047 | 9889 | 78,640 | 130,398 |
References
- Linnhoff, B.; Flower, J. Synthesis of heat exchanger networks: Synthesis of heat exchanger networks: II. Evolutionary generation of networks with various criteria of optimality. AICHE J. 1978, 24, 642–654. [Google Scholar] [CrossRef]
- March, L. Introduction to pinch technology. In Targeting House; Targeting House: Cheshire, England, 1998. [Google Scholar]
- Telang, K.; Knopf, F.C.; Pike, R.W. The Heat Exchanger Network; Mineral Processing Research Institute: Baton Rouge, LA, USA, 2001. [Google Scholar]
- Smith, R. Chemical Process: Design and Integration; John Wiley & Sons: New York, NY, USA, 2005. [Google Scholar]
- Pejpichestakula, W.; Siemanond, K. Retrofit of refinery heat exchanger network under different kinds of crude oil by pinch design method using mathematical programming. Chem. Eng. 2013, 32, 1332236. [Google Scholar]
- Linnhoff, B.; Ahmad, S. Cost optimum heat exchanger networks—1: Minimum energy and capital using simple models for capital cost. Comput. Chem. Eng. 1990, 14, 729–750. [Google Scholar] [CrossRef]
- Zhu, X.; O’Neill, B.; Roach, J.; Wood, R. A new method for heat exchanger network synthesis using area targeting procedures. Comput. Chem. Eng. 1995, 19, 197–222. [Google Scholar] [CrossRef]
- Siemanond, K.; Kosol, S. Heat exchanger network retrofit by pinch design method using stage-model mathematical programming. Chem. Eng. Trans. 2012, 29, 367–372. [Google Scholar]
- Ahmad, S.; Linnhoff, B.; Smith, R. Cost optimum heat exchanger networks—2: Targets and design for detailed capital cost models. Comput. Chem. Eng. 1990, 14, 751–767. [Google Scholar] [CrossRef]
- Osman, A.; Mutalib, M.A.; Shuhaimi, M.; Amminudin, K. Paths combination for HENs retrofit. Appl. Therm. Eng. 2009, 29, 3103–3109. [Google Scholar] [CrossRef]
- Osman, A.; Mutalib, M.A.; Shigidi, I. Heat recovery enhancement in HENs using a combinatorial approach of paths combination and process streams’ temperature flexibility. S. Afr. J. Chem. Eng. 2016, 21, 37–48. [Google Scholar] [CrossRef][Green Version]
- Osman, A.; Eltayeb, M.; Rajab, F. Utility paths combination in HEN for energy saving and CO2 emission reduction. Processes 2019, 7, 425. [Google Scholar] [CrossRef]
- Alhajri, I.H.; Gadalla, M.A.; Elazab, H.A. A conceptual efficient design of energy recovery systems using a new energy-area key parameter. Energy Rep. 2021, 7, 1079–1090. [Google Scholar] [CrossRef]
- Zhang, D.; Li, Y.; Sun, H.; Liu, G. Energy recovery enhancement of heat exchanger network by mixing and azeotrope formation. Chem. Eng. Sci. 2020, 228, 115992. [Google Scholar] [CrossRef]
- Li, N.; Wang, J.; Klemeš, J.J.; Wang, Q.; Varbanov, P.S.; Yang, W.; Liu, X.; Zeng, M. A target-evaluation method for heat exchanger network optimisation with heat transfer enhancement. Energy Convers. Manag. 2021, 238, 114154. [Google Scholar] [CrossRef]
- Ong, B.H.; Walmsley, T.G.; Atkins, M.J.; Varbanov, P.S.; Walmsley, M.R. A heat-and mass-integrated design of hydrothermal liquefaction process co-located with a Kraft pulp mill. Energy 2019, 189, 116235. [Google Scholar] [CrossRef]
- Orosz, Á.; How, B.S.; Friedler, F. Multiple-solution heat exchanger network synthesis using P-HENS solver. J. Taiwan Inst. Chem. Eng. 2021, 130, 103859. [Google Scholar] [CrossRef]
- Alhajri, I.H.; Gadalla, M.A.; Abdelaziz, O.Y.; Ashour, F.H. Retrofit of heat exchanger networks by graphical Pinch Analysis–A case study of a crude oil refinery in Kuwait. Case Stud. Therm. Eng. 2021, 26, 101030. [Google Scholar] [CrossRef]
- Fu, D.; Yu, Z.; Lai, Y. Linking pinch analysis and shifted temperature driving force plot for analysis and retrofit of heat exchanger network. J. Clean. Prod. 2021, 315, 128235. [Google Scholar] [CrossRef]
- Panjeshahi, M.; Tahouni, N. Pressure drop optimisation in debottlenecking of heat exchanger networks. Energy 2008, 33, 942–951. [Google Scholar] [CrossRef]
- Ibrahim, M.A.M. Energy Optimization and Retrofit of Heat Exchanger Networks Case Study: Preheat-Train of the Crude Distillation Unit; University of Gezira: Wad Madani, Sudan, 2013. [Google Scholar]
- Elsiddig, A.O. Path Analysis for the Retrofit of Heat Exchanger Networks and the Utility System. Ph.D. Thesis, UTP, Seri Iskandar, Malaysia, 2011. [Google Scholar]
- Al-Riyami, B.A.; Klemes, J.; Perry, S. Heat Integration Retrofit Analysis of a Heat Exchanges Network of a Fluid Catalytic Cracking Plant. Appl. Therm. Eng. 2001, 21, 449–1487. [Google Scholar] [CrossRef]


Publisher’s Note: MDPI stays neutral with regard to jurisdictional claims in published maps and institutional affiliations. |
© 2022 by the authors. Licensee MDPI, Basel, Switzerland. This article is an open access article distributed under the terms and conditions of the Creative Commons Attribution (CC BY) license (https://creativecommons.org/licenses/by/4.0/).