Article

Optimization Strategy of Hybrid Configuration for Volatility Energy Storage System in ADN

1
School of Electronic and Information Engineering, Chongqing Three Gorges University, Chongqing 404100, China
2
School of Big Data and Internet of Things, Chongqing Vocational Institute of Engineering, Chongqing 402260, China
*
Author to whom correspondence should be addressed.
Processes 2022, 10(9), 1844; https://doi.org/10.3390/pr10091844
Submission received: 22 August 2022 / Revised: 2 September 2022 / Accepted: 5 September 2022 / Published: 13 September 2022
(This article belongs to the Special Issue Modeling, Analysis and Control Processes of New Energy Power Systems)

Abstract

:
This study aims to address the issues of volatile energy access to the active distribution network (ADN), which are the difficulty of frequency regulation, the increased voltage deviation of the ADN, the decrease in operational security and stability, etc. In this study, a two-stage majorization configuration model is established to identify and understand how volatility energy affects a hybrid energy storage system (HESS). The ADN and HESS with lead-acid batteries and supercapacitors (SC) are examined using day forecast data for wind, solar, and load. In this planning stage, the integrated cost, network loss, and node voltage deviation are considered as optimal objectives in a multi-objective optimization model, while the revised multi-objective optimization particle swarm approach is used to solve the initial value of capacity configuration. In the operation stage, optimizing objectives like wind output power fluctuations, the frequency deviation of HESS is used to solve the modified value of the configuration capabilities of the SC, and the output of different types of units in ADN is further optimized by the quantum particle swarm with the addition of a chaotic mechanism. The simulation study is conducted to determine the best configuration result based on case 33 node examples, and the simulation results demonstrate the model’s viability.

1. Introduction

Under the background of the worldwide “Carbon Double”, the development of a series of volatile energy [1], like tidal energy and solar energy, has received unprecedented attention. Under the pressure of a high proportion of instability volatility energy consumption, multiple countries have put forward supporting development policies of “volatility energy + ESS”, and the significance of energy storage devices for the heavy penetration of volatility energy sources is totally mirrored. The optimal configuration of ESS incorporates a direct effect on the active control ability of ADN, which makes the ADN preferable to the traditional distribution network (TDN), and realizes the volatile energy interoperability between the grid and the electricity consumption side [2,3].
At present, the configuration strategy of the ESS of the distribution network has been observed in many studies at home and abroad. Wang et al., according to the data from load-side transformers and solar power, established an energy storage capacity allocation scheme with optimal economic efficiency based on intelligent algorithms and energy storage allocation strategies for customer power consumption characteristics [4]. Chen et al. established a model with the highest wind-storage combined system power sales revenue as the optimization objective and used the Ant-Lion algorithm to solve the optimal allocation scheme for wind generation (WG) cluster power backup and energy storage power and capacity [5]. Using dynamic solar planned output data as a constraint and the maximum average annual benefit over the life cycle as the optimization objective, Hong et al. used particle swarm algorithms (PSO) and time-series simulation calculations to solve for the best configuration of ESS [6]. They also considered the energy storage investment cost, operation and maintenance, penalty costs for deviating from the planned output, and revenue from PV plants. Liu et al. analyzed the influence of fluctuations of load power on the distribution network and proposed a model predictive control-based optimization strategy for energy storage allocation and scheduling with the goal of economic efficiency of user-side energy storage operation [7].
However, the above models only formulate the configuration of the ESS in terms of operational economics and none of them take into account the dynamic characteristics of the ESS. Shi et al. analyzed the characteristics of historical wind and solar power output fluctuations at two durations of 15 min and 10 min and studied the capacity allocation strategies of ESSs based on smoothing energy output fluctuations and participating in system frequency regulation [8]. Wu et al. analyzed the output characteristics of the combined power generation farms with wind and solar, and proposed a project comparing the stabilization index and smoothing effect evaluation index to analyze the filtering effects of the sliding average method and least-squares procedure, to decide the output power level of ESS configuration [9]. Wang et al., resting on the historical information characteristics of the WG and PV, proposed a capacity optimization configuration method based on the analysis of the wind and PV output volatility under different capacity allocation schemes to guarantee the chance that the system output change rate satisfies the maximum requirements [10]. In Ref. [11], the ADN energy storage operating approach to smooth out the system’s power fluctuation is suggested. An ESS configuration scheme is structured with fixed expenses and operating expenses in the cycle as the optimization targets, and the dynamic programming arithmetic is needed to calculate the energy storage installation capacity, power, and installation location. The above model takes into consideration the dynamic characteristics of the ESS and additionally smoothed out the volatility to a definite extent; however, the improvement of the configuration results is not obvious when solely one layer model is employed for designing.
In Ref. [12], the authors described the design of a two-level estimate model for allocating storage capacity. The outer layer determines the in-out power and capacity of the ESS with the calculated goal of minimizing the expense to invest in the storage system, the inner layer determines the charging and discharging power of the ESS to minimize the system transit line’s power fluctuation, and a probabilistic approach to multiple scenarios is adopted to calculate the conclusions of the ESS allocation. In Ref. [13], a HESS two-layer planning scheme on account of the operational life span in the operation phase was constructed. In the upper layer, with the objectives of the lowest investment cost, the linear programming algorithm is adopted to estimate the total action domain of HESS, which provides a reference range for the actual operation of HESS and formulates the energy storage operation strategy considering the storage charging and discharging capacity; the lower layer takes the maximum operational life span of the battery during the operation phase as the objective function, and the PSO algorithm is taken to calculate the best configuration of battery and supercapacitor capacity. The works of Refs. [11,12] are based on the use of ESSs within the distribution network for double-layer configuration, purely with the support of the distribution network; however, they did not consider that the role of WG in the configuration of the ESS is the existence of a negative correlation, and provide no analysis on the aspects of wind generation concerned in system frequency.
With the increase of penetration power of wind and PV, the proportion of conventional generating sets is gradually reduced, and the power grid inertia and FM intensity are constantly reduced, which can have an effect on the security and stability of operation within the ADN with comparatively high volatile energy proportion [14]. To take full advantage of the ESS and cut down the cost, this paper takes into account the optimal configuration of the ESS on the ADN side and the energy side, and considers the investment to study the optimal configuration of the HESS of lead-acid batteries and supercapacitors with the idea of “integrated planning of energy storage capacity configuration and dispatching strategy” [15]. It is also contrasted with various battery types used for energy storage and serves as a guide for user-side energy storage designs. Based on the initial values of capacity and power provided by the traditional energy storage allocation method, an operational strategy for volatility energy utilization value enhancement is introduced at the planning level, and an optimal scheduling strategy to take into account the system frequency deviation is introduced at the dispatching level, using the output of WG and ESSs to take part in FM to correct the configuration of planning level supercapacitors energy storage capacity’s initial values. The contributions of this paper are summarized as follows:
(1)
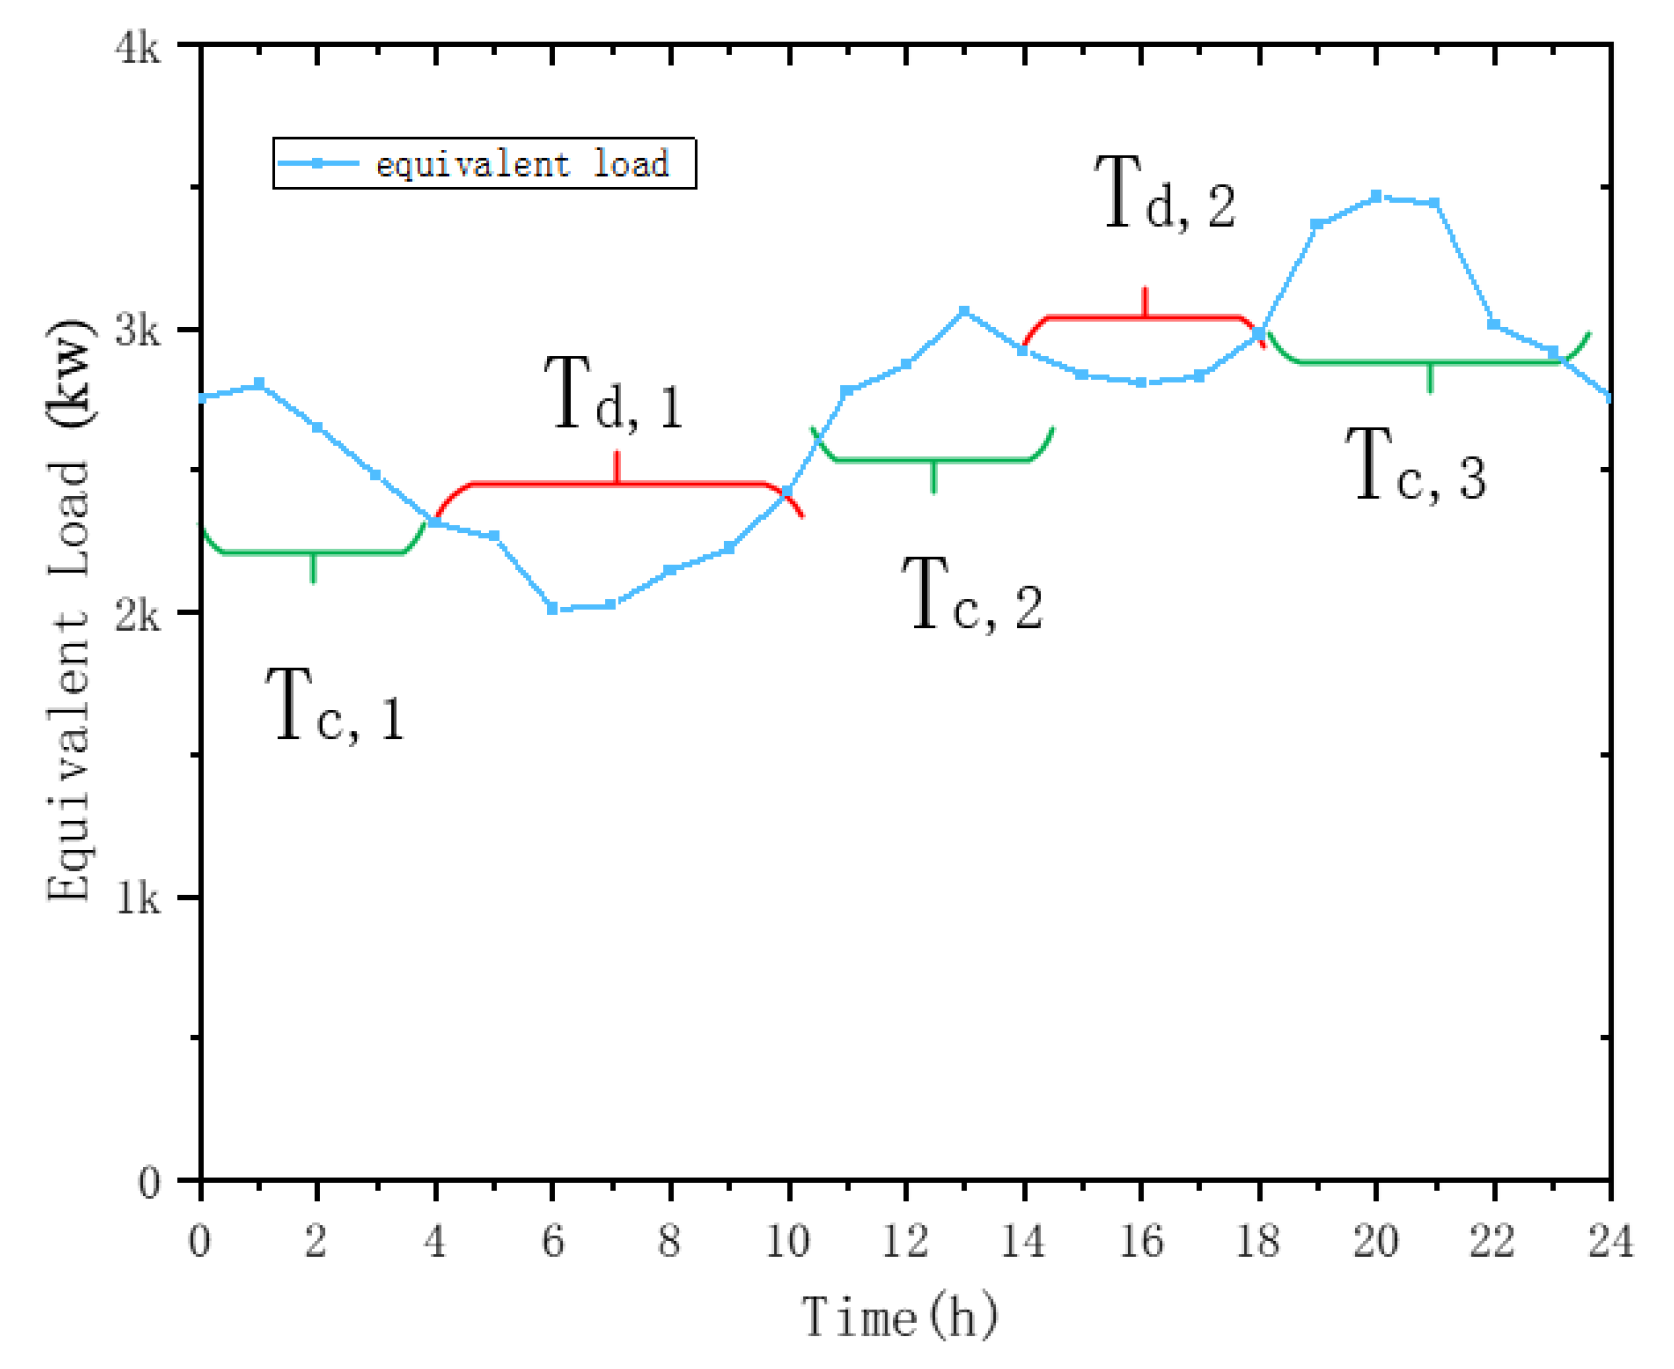
The problem of the impact of fluctuating energy output on the configuration of energy storage systems is analyzed, laying the foundation for the subsequent development of operational dispatching strategies based on equivalent load curves.
(2)
A hybrid energy storage system using lead-acid batteries and supercapacitors is utilized to diversify the types of energy storage and expand the scope of optimization.
(3)
By considering both the distribution grid side and the energy side, a two-tier energy system optimization strategy with joint participation of wind storage in system frequency regulation is proposed. Through day-ahead optimization and intra-day correction multi-timescale hybrid energy storage configuration optimization, the distribution grid economy and renewable energy utilization are improved.

2. Impacts of Volatility Energy Power on ESS and Mathematical Model

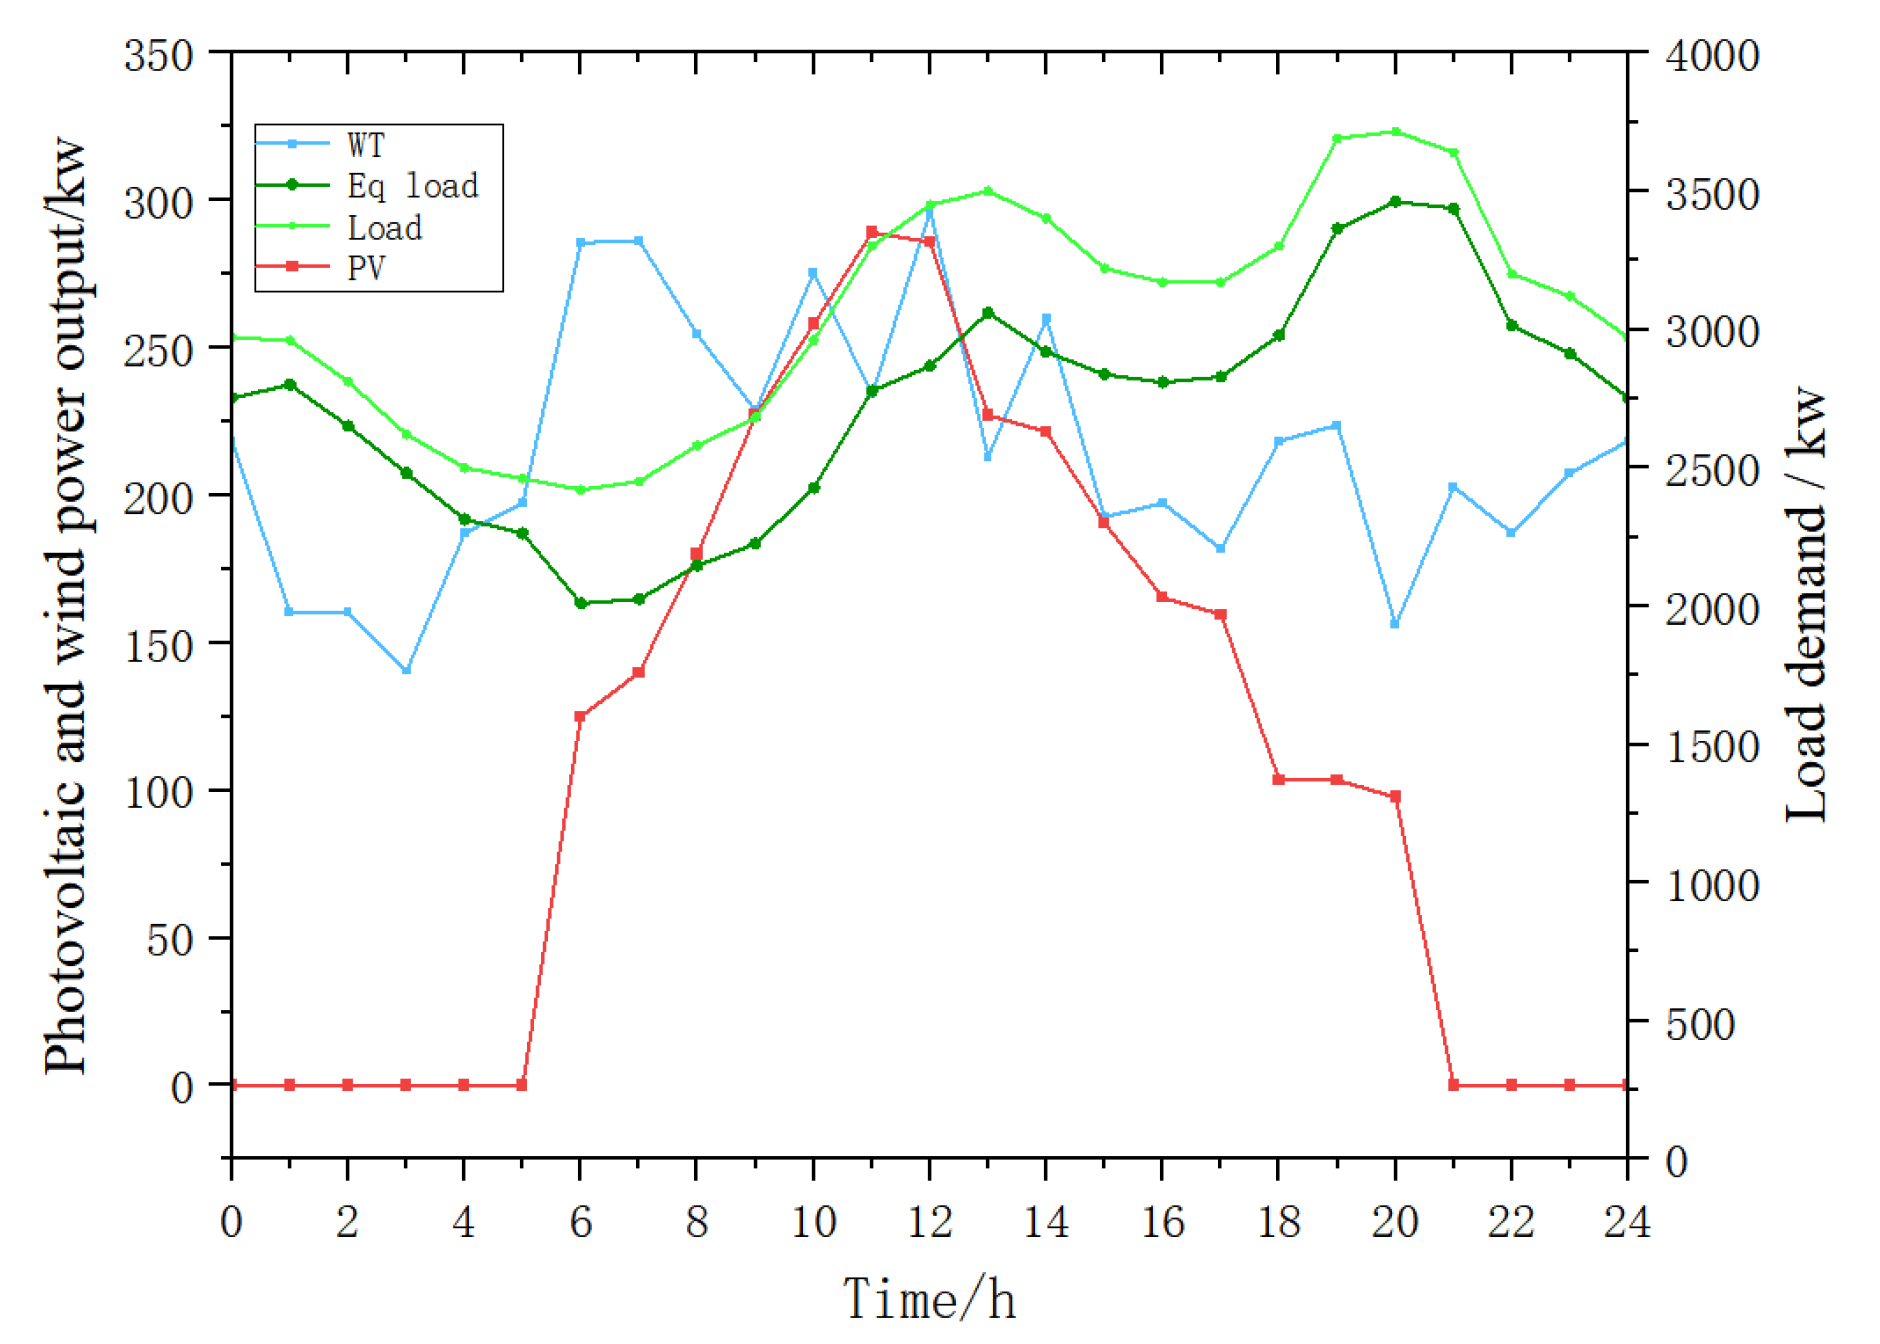
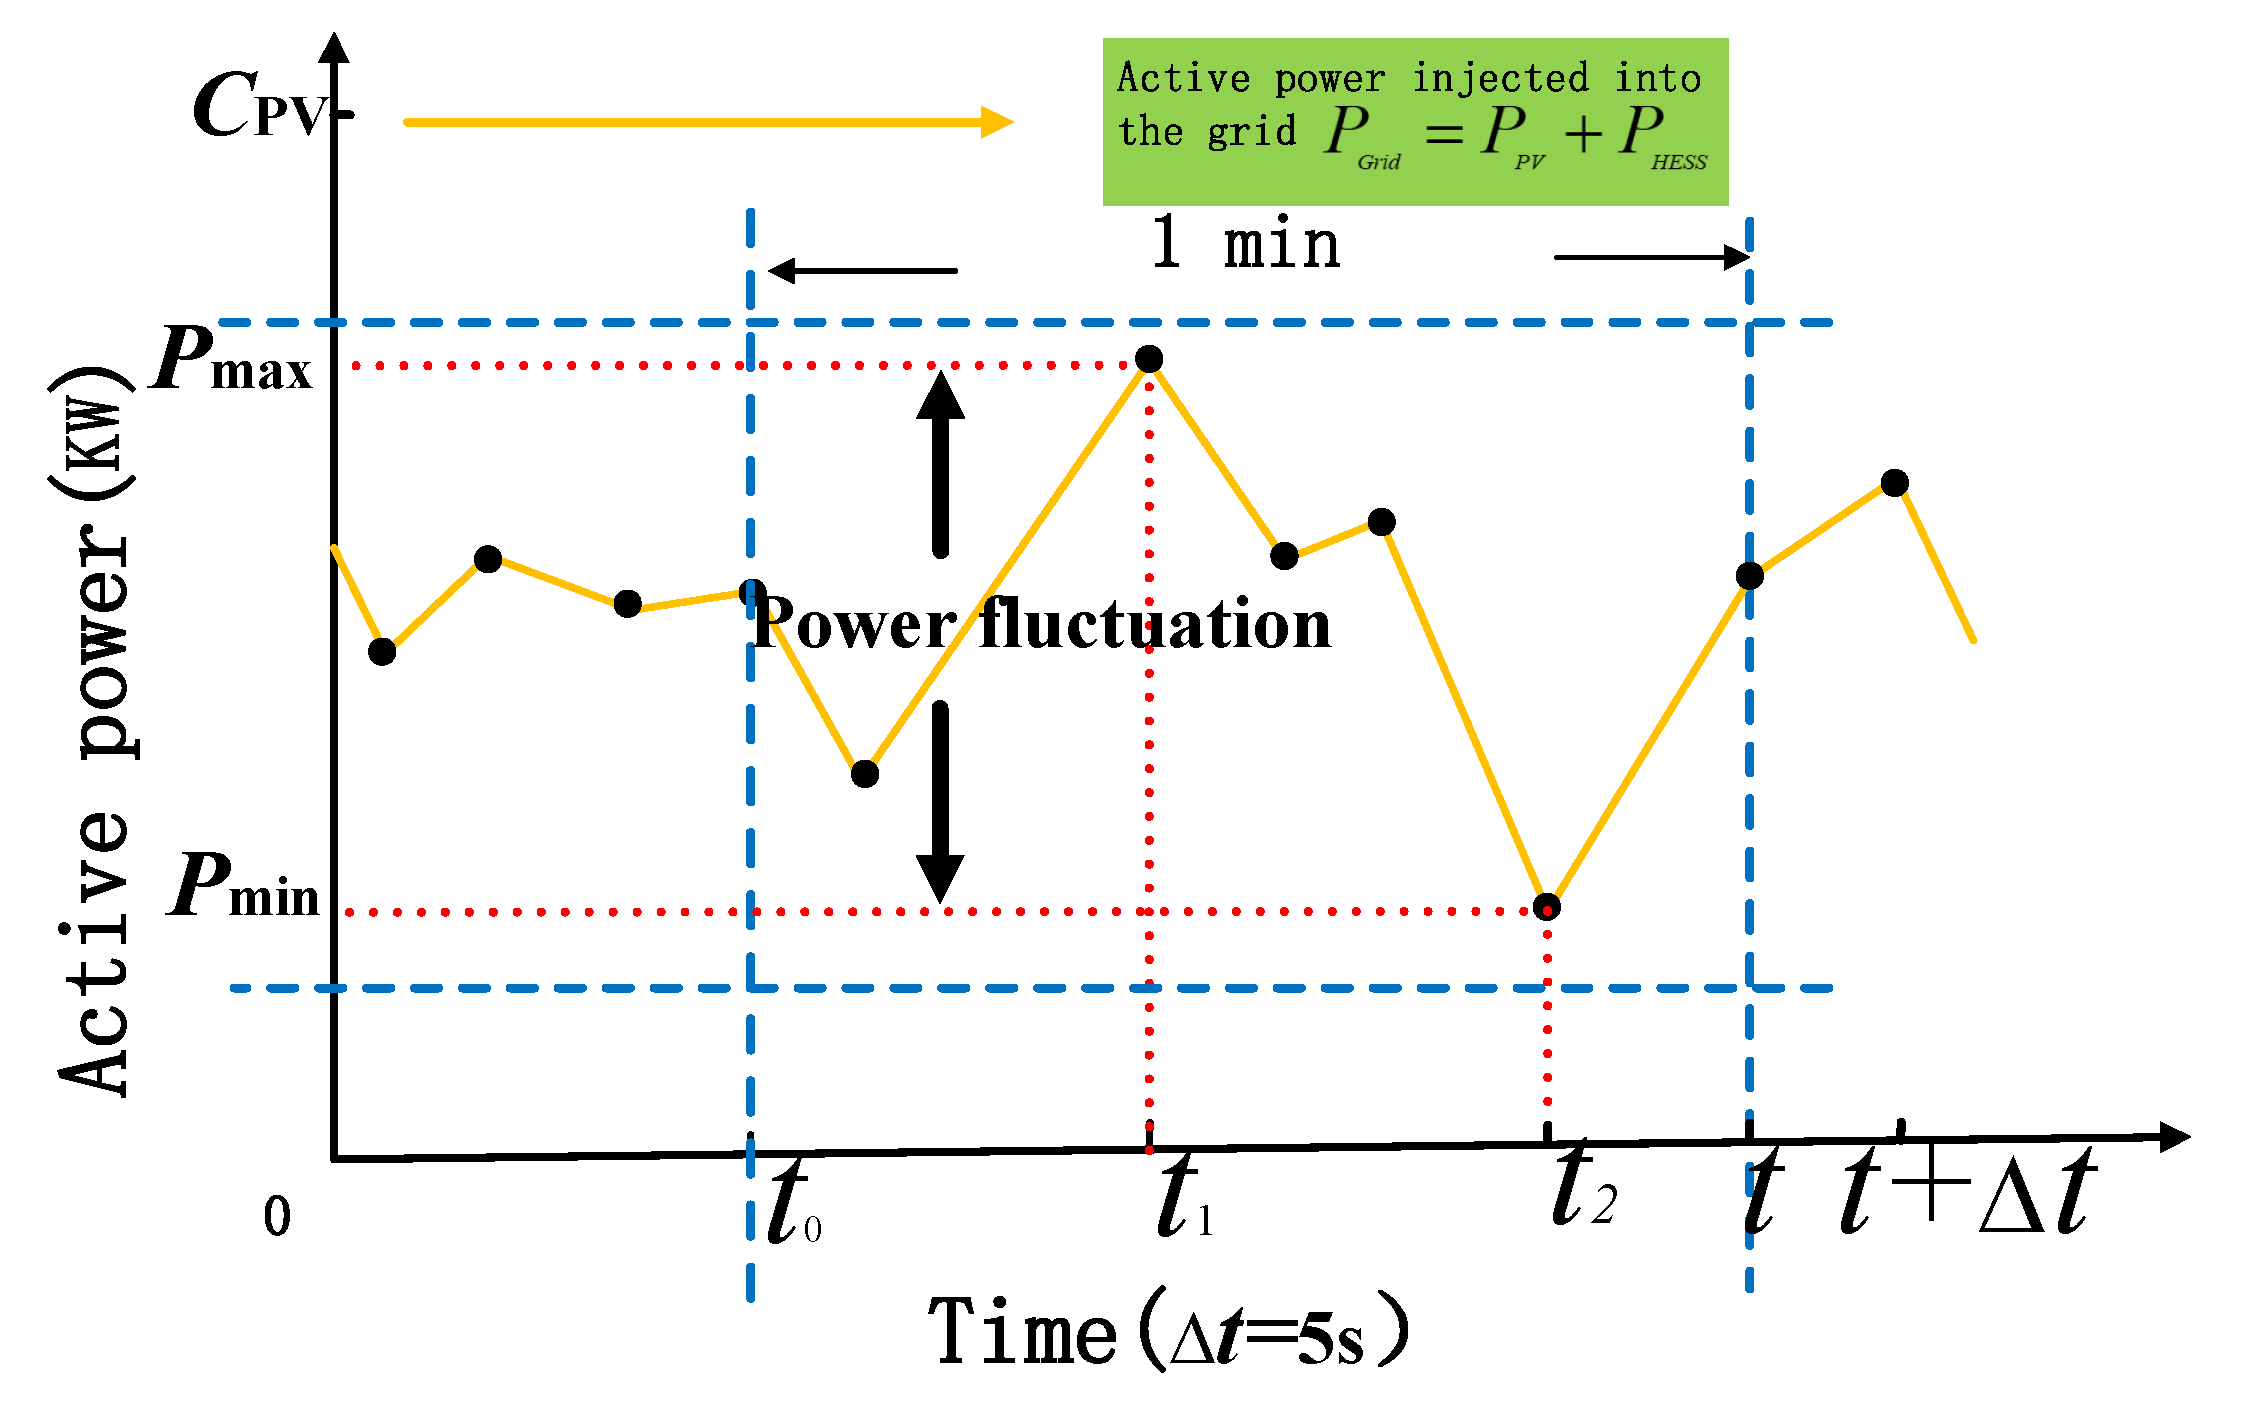
2.1. Analysis of the Impact of Volatility Energy Power on ESS

In this paper, volatility energy mainly adopts WG generation and PV. The sum of actual load and negative load (each power generation) is taken as the equivalent load of volatility energy access to ADN, and the period of charging and discharging of HESS is segmented by the extremal variation of the equivalent load figure.
Equation (1) presents the specific calculation procedure.
P e , l o a d t = P l o a d t P W G t P P V t
where P e , l o a d t , P l o a d t , P W G t and P P V t illustrate the equivalent load, realistic load, WG power, and PV power in period t, respectively.
Currently, the fluctuation of photovoltaics often takes place in intervals of less than 1 min; when considering how to smooth out fluctuations in PV power, control using the energy storage system’s output is frequently used [16]. When PV power fluctuations do not exceed the maximum permissible power of the HESS, the HESS’s power is often employed to smooth these power variations while keeping the PV converter operating in MPPT mode. To put it another way, downward power fluctuations are tamed by discharging (when the power value of HESS greater than 0), and upward power variations are tamed by charging (when HESS power is negative). The details of the coordinated control strategy are discussed in Section 3. Wind power and load fluctuations follow the same pattern.
The variations in PV power throughout a minute is discussed in this paper. The power fluctuations are the interval size between the utmost and minimum power values measured at the purpose of common coupling over the course of 1 min, as described in Figure 1.
The comparison of typical daily PV output and wind output curve and actual load curve in a certain place is shown in Figure 2.
From Figure 1, it is obvious that the peak period of PV output is 9:00–14:00, while the typical daily load curve peaks at around 12:00 and 20:00, indicating that the peak period of PV and the peak period of the load curve during the day coincide. Thus, the peak-to-valley’s distances of the equivalent load curve will be curtailed after the superposition of PV output with realistic load, and PV power generation is positively correlated with the peak-to-valley difference. On the contrary, the peak period of wind and the valley period of load curve at night are similar; the peak-to-valley’s distances after the superposition of wind output and realistic load will be increased, and its influence is negatively correlated.
To sum up, PV output reduces the necessity of energy storage configuration, and wind output increases the necessity. While the HESS is configured with the equivalent load curve, the access of volatility energy will realize peak cutting and valley filling and affect the HESS’s operation strategy.

2.2. Mathematical Model of ESS

The usage of energy storage devices can help to reduce network losses and power quality fluctuations [17] that are brought on by unstable energy sources linked to ADN as well as some of the energy consumption and utilization rate fluctuations. It is challenging to fulfill this need with a single kind [18] of energy storage device, though. The double-layer planning model established in this paper can fully utilize the complementary characteristics of lead-acid batteries and supercapacitors [19] to effectively extend the service life of the system, save cost, improve the overall performance of energy storage, and solve the problem to the greatest extent. This is demonstrated by the low frequency of lead-acid battery charging and discharging and the high frequency of supercapacitor charging and discharging [20].
It is mathematically modeled from the State of Charge (SOC) and the charging/discharging power.
S O C t = 1 η S O C t 1 + P c t Δ t γ E e , c h a r g e 1 η S O C t 1 + P d t Δ t E e λ , d i s c h a r g e
where S O C t evaluates the SOC level in period t , ƞ delineates the loss rate of remaining power per hour, P c t and P d t clarify charging and discharging power, γ and λ are charging and discharging efficiencies, E e is the rated capacity, Δ t is the sampling interval, and the value of this paper is 1 h.

3. A Double-Layer Multi-Objective Optimization Model

This study uses the two-layer decision optimization model to solve the ESS configuration scheme. The two-layer model can comprehensively consider the problems of the configuration of ESS and various problems in the and.

3.1. Planning Layer Optimization Model

According to the load situation of the ADN, the maximum capacity value of the ESS is initially calculated, the day forecasts of wind, solar, and load are used to carry out the preliminary planning of the ESS, and an optimization model is built with the combined cost, network loss, and nodal voltage deviation as the optimal objectives.

3.1.1. Objective Functions

  • Comprehensive cost of a full-day life cycle;
m i n F 1 = C i n v + C r u n + C P V + C W G + C b u y + C p l o s s
where F 1 introduces the daily comprehensive expenses of HESS, C i n v and C r u n are the daily investment expenses and daily operation and maintenance expenses of HESS, C P V , C W G represent the operation and maintenance expenses of PV and wind farms, C p l o s s describes the network loss expenses, and C b u y describes the daily power purchase expenses, which to some extent characterizes the ability of “Peak cut and fulfill valleys”. The calculation formulas of each component are as follows:
C i n v = j = 1 N τ 1 + τ l c p P e s s + c e E e 24 1 + τ l 1 T C r u n = j = 1 N 0 T c o m P e s s t d t C P V = 0 T c P V P P V t d t C W G = 0 T c W G P W G t d t C b u y = 0 T m g P L A B , c t + P S C , c t d t C p l o s s = 0 T m a P p l o s s t d t
where N indicates energy storage units’ amount, P e s s indicates the HESS’s power rating, c p and c e evaluate power and capacity cost coefficients, c o m , c P V , and c W G denote HESS’s, PV’s, and WG’s operation and maintenance cost factor, P e s s t indicates the actual power level of the HESS in period t , P L A B , c t and P S C , c t describe the charge powers of lead-acid batteries and supercapacitors, m g and m a evaluate unit electricity price and unit network loss cost, and P p l o s s t denotes the network active loss power.
  • Network loss
min F 2 = t = 1 T i = 1 I P l o s s , i , t
where F 2 delineates the network loss for 24 h, T defines the dispatching time, I is the nodes’ amount of the ADN, and P l o s s , i , t denotes the power loss of line i at time t.
  • Node voltage deviation
min F 3 = i = 1 I V i V N
where V N denotes the node’s rated voltage, V i is the voltage on node i, and F 3 is smaller, meaning the node voltage is more stable.

3.1.2. Constraint Condition

  • SOC of energy storage constraint;
To avoid over-charging and over-discharging, S O C has a certain range limit, which cannot be fully discharged or fully charged.
S O C min S O C t S O C max
where S O C min and S O C max are the minimum charge level and maximum residual charge level, respectively.
  • Node voltage constraints
U i , min U i U i , max i = 1 , 2 , 3 , I
where U i , min and U i , max are the minimum and maximum voltages at node i, respectively.
  • Branch circuit current constraints
To guarantee the HESSs can operate well and stably.
I i I i , max i = 1 , 2 , 3 , m
where I i , max is the upper limit of the current in the i-th branch, and m is the number of branches.
  • Power balance constraints
P G , i P N , i = U i j = 1 N U j X i j cos ϕ i j + Y i j sin ϕ i j Q G , i Q N , i = U i j = 1 N U j X i j sin ϕ i j Y i j cos ϕ i j
where P G , i and Q G , i indicate the power output of active and reactive to the power supply at nodes i, P N , i   and   Q N , i indicate the power output of active and reactive at nodes i, U i   and   U j are the voltage amplitude at nodes i and j, X i j   and   Y i j evaluate real and virtual parts of the node-admittance matrix elements, and Φ i j evaluates the voltage angular phase difference of nodes i and j.

3.2. Operation Layer Optimization Model

Due to the access of WG and load, there is frequency fluctuation in the distribution network system. This study adds 120 MW of WG in the operation layer to adjust the energy storage system output, using the energy storage output to suppress the fluctuation [21,22]; 5% of the WG output is used for system frequency regulation. When the fluctuation frequency range exceeds 0.2 Hz, the whole capacity of WG is added to the distribution network; otherwise, the energy storage capacity calculated under the optimal strategy is used. In turn, the value of the additional capacity to the operation layer needed for the supercapacitors is calculated.

3.2.1. Objective Function

  • Minimal fluctuations in WG output
min F 4 = 1 n t = 1 n P W G t P ¯ W G 2
where P ¯ W G is the average active power of the all-day life cycle.
  • Minimal system frequency deviation
min F 5 = f t f e f e 100 %
where f t is system frequency at time t, and f e is system-rated frequency.

3.2.2. Constraint Condition

  • Charge and discharge power constraint
P L A B , c , max P L A B t P L A B , d , max
P S C , c , max P S C t P S C , d , max
where P L A B , c , max   and   P L A B , d , max reflect the lead-acid batteries’ charging/discharging powers crest values, P S C , c , max   and   P S C , d , max reflect the supercapacitors’ charging/discharging powers crest values.
  • Charge and discharge times constraint
The life span of energy storage units increase and the costs reduce by reducing the number of charging and discharging occurrences during operation.
0 x N 0 y M
where x, y, N, and M are the number of charging and rated charging of lead-acid batteries and supercapacitors, respectively.

4. Scheduling Strategy and Solution Algorithm

4.1. Scheduling Strategy for Energy Storage Systems

The two components of the scheduling strategy are as follows: the division of continuous charging and discharging periods following the “time-of-day tariff” [23]. The segmentation of charging and discharging periods is used to determine the power of the ESS to charge and discharge in each period.
① HESS is configured according to the load curve, charging at the curve trough, and discharging at the peak. To improve the utilization of the energy storage system, for the flat tariff period, if the period before and after it is a high tariff period then the charging time is T e ; if both the preceding and following periods are low tariff periods, then the discharge time is T d . The charging/discharging periods are distinguished on account of the time-of-day tariff strategy, and the high and low electricity price periods corresponding to the charging and discharging periods; T e , 1   and   T e , 2 are the charging periods and T d , 1 , T d , 2   and   T d , 3 are the discharging periods. The results of the charging and discharging time periods are delineated in Figure 3. The times of 4:00–9:00 and 15:00–19:00 are low electricity prices, while 10:00–14:00 and 20:00–3:00 are high electricity prices, in the known charging and discharging period, considering the SOC.
② The variable power charging/discharging mode is adopted to determine the power values of multiple ESSs when charging and discharging. The specific process is as follows.
The smaller the equivalent load within Δ t , the more energy storage charging is required. The equivalent load values within Δ t for each sampling interval of period T are sorted in order from smallest to largest, and the size of the charging power level of the HESS within Δ t corresponding with the equivalent load is determined, respectively. To make the fluctuation of the equivalent load curve of the HESS after charging as small as possible (except for the HESS within Δ t with the smallest equivalent load, which is charged by the maximum power), the storage system is charged at a variable power less than the maximum power. The calculation is shown in Equation (16).
Charging:
P c t = α P c , max + P L , min P L t P c , e , P L t < P c , max + P L , min , P L t P c , max + P L , min
For each determined charging power, the SOC also increases, and undetermined sampling intervals are charged at zero power until the power magnitude of all sampling intervals is determined and all charging power values for the HESS are output. In contrast, the SOC decreases during the discharging process.
The process of determining the magnitude of the discharge power is similar to the above process. The differences are the larger the equivalent load in Δ t , the greater the need for energy storage discharge, and in order of equivalent load from largest to smallest to determine its corresponding the size of the discharge power of the HESS within Δ t . Except for the Δ t with the largest equivalent load, the HESS is discharged by the maximum power value; during other Δ t the HESS is discharged at a variable power that is less than the maximum power. The calculation is shown in Equation (17).
Discharging:
P c t = β P L t + P d , max P L , max P d , e , P L t > P L , max P c , max , P L t P L , max P c , max
where P c , max , P d , min , P c , e , P d , e are charging/discharging powers in period t, maximum charging power, minimum discharge power, and rated charging/discharging power, respectively. P L t P L , min P L , max α , β are large equivalent load values during the sampling period t, minimum, and maximum, equivalent load values at the sampling interval, and charging and discharging power weights, respectively.

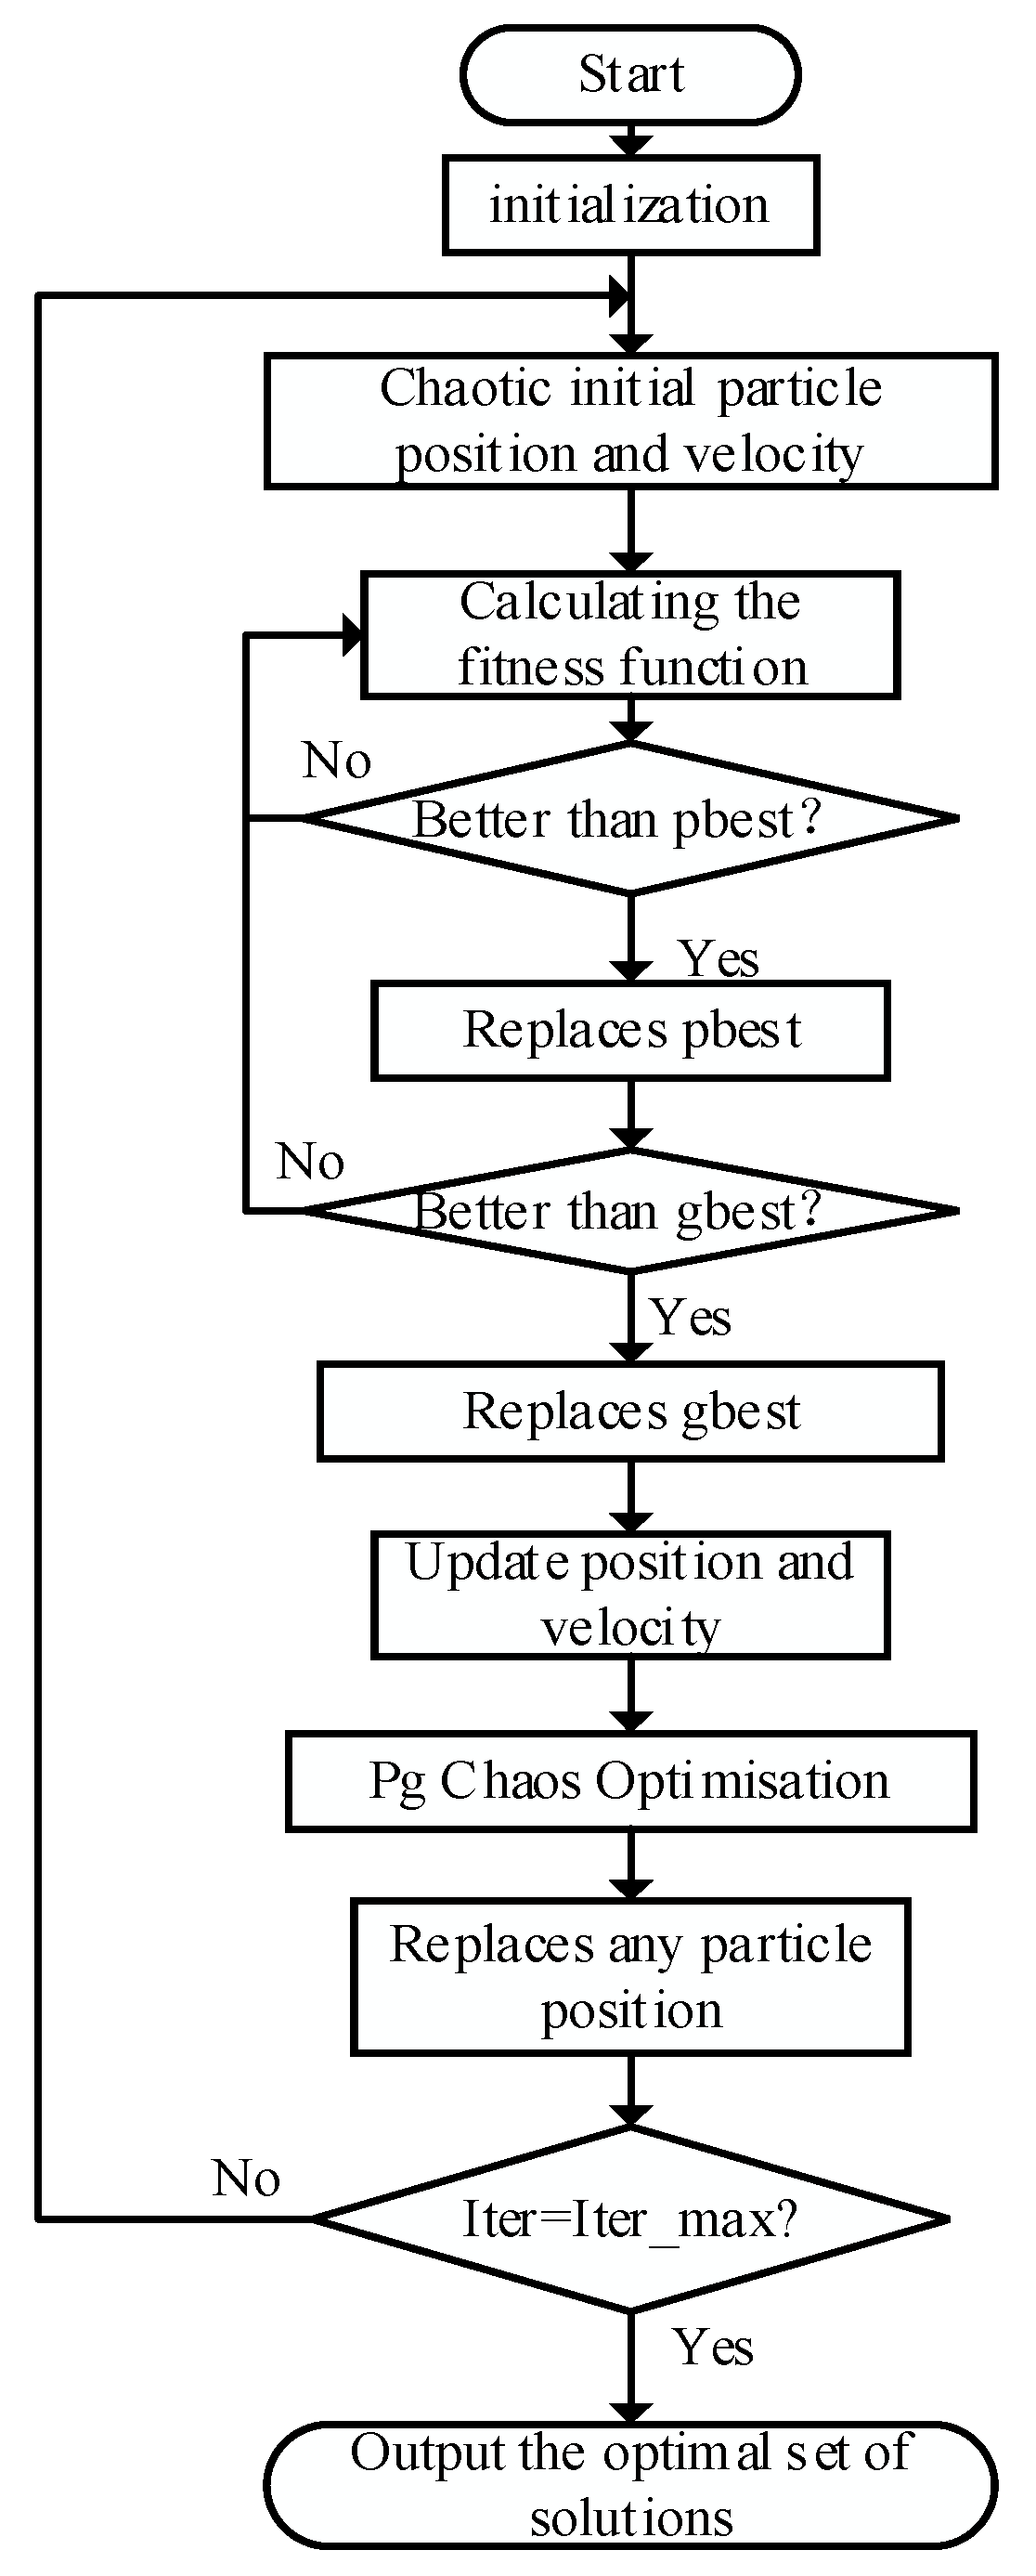
4.2. The Computational Flow of Multi-Objective Chaotic Particle Swarm Algorithm

A mathematical optimization methodology for dealing with multi-layer analytical processes is called Chaos Particle Swarm Optimization (CPSO). According to how well it fits its surroundings, each particle is gradually shifted to a better location. After solving each sub-step or step’s requirement’s part-optimal solution in the correct order, the optimal prescription from the set of local optima is then employed as the optimization’s final output.
Therefore, a modified Chaos Particle Swarm Optimization (MCPSO) is used to solve this problem. The chaotic property is used to improve the diversity of the population and the ergodicity of the particle search, and the inclusion of chaotic states into the optimization variables gives the particles the ability to search continuously. The specific flow chart is presented in Figure 4.
The detailed operations are shown as follows.
Step 1: The maximum allowable times of iterations the range of fitness error values, and the algorithm-related parameters: inertia weights, and learning factors are initialized.
Step 2: Chaotic initialization of particle positions and velocities are determined.
(1) An n-dimensional vector x 1 = x 11 , x 12 , , x 1 n between [0,1] is randomly generated, using the Logistic chaotic system equation by Equation (18) to obtain N vectors x 1 , x 2 , , x N .
x n + 1 = x n 1 x n , n = 0 , 1 , 2 ,
(2) After calculating the fitness function for all particles, Z initial velocities are generated at random from Y initial populations by choosing the Z initial solutions with the best performance.
Step 3: pBest is set as the new position if the particle fitness is greater than the individual extreme.
Step 4: The global extreme gBest is set to the new position if the particle fitness is greater than it.
Step 5: Dynamically update learning factor.
(1) Take the average value of the particle adaptation value.
(2) The particle adaptation value is compared with the average value. When the average value is more than the adaptation, the learning effect maximum value is taken. Otherwise, the learning factor is solved by using Equation (19).
w = w min + w max w min x ¯ x 1 x i x 1
where w min , w max are the learning factor’s minimum and maximum values, and x 1 , x i , x ¯ are the average of the adaptation values of the 1st and ith particle, and the population adaptation values.
Step 6: Redefine the particles’ positions and velocities.
Step 7: Chaos optimization to get the best position.
Calculate the adaptation value for each feasible solution experienced by the chaotic variables in the original solution space, and select the feasible solution with the best performance. Map the vectors in the optimal position to the definition domain of the Logistic equation [0,1], iterate with the Logistic equation to generate a sequence of chaotic variables, then return the generated sequence of chaotic variables to the original solution space through the inverse mapping.
Step 8: Substitute for any one particle’s position present in all particles with p*.
Step 9: The search terminates and the global optimal position is output if the halting condition is met. If not, go back to Step 3.

5. Case Study

5.1. Basic Parameters for the Case

In this research, the modified case 33 node examples system was used as an arithmetic example, and 300 kw WG and 300 kw PV were added to nodes 19 and 26. The system structure is delineated in Figure 5 for the HESS configuration. The WG output, PV output, and load curves for a typical day at a site are described in Figure 2.
A time-of-day tariff was set, with a tariff of RMB 1.0/kWh during peak hours (HESS discharging periods), RMB 0.35/kWh during low hours (HESS charging periods), and a flat tariff of RMB 0.55/kWh for the rest of the day. The parameters related to supercapacitor and lead-acid battery units are expressed in Table 1.

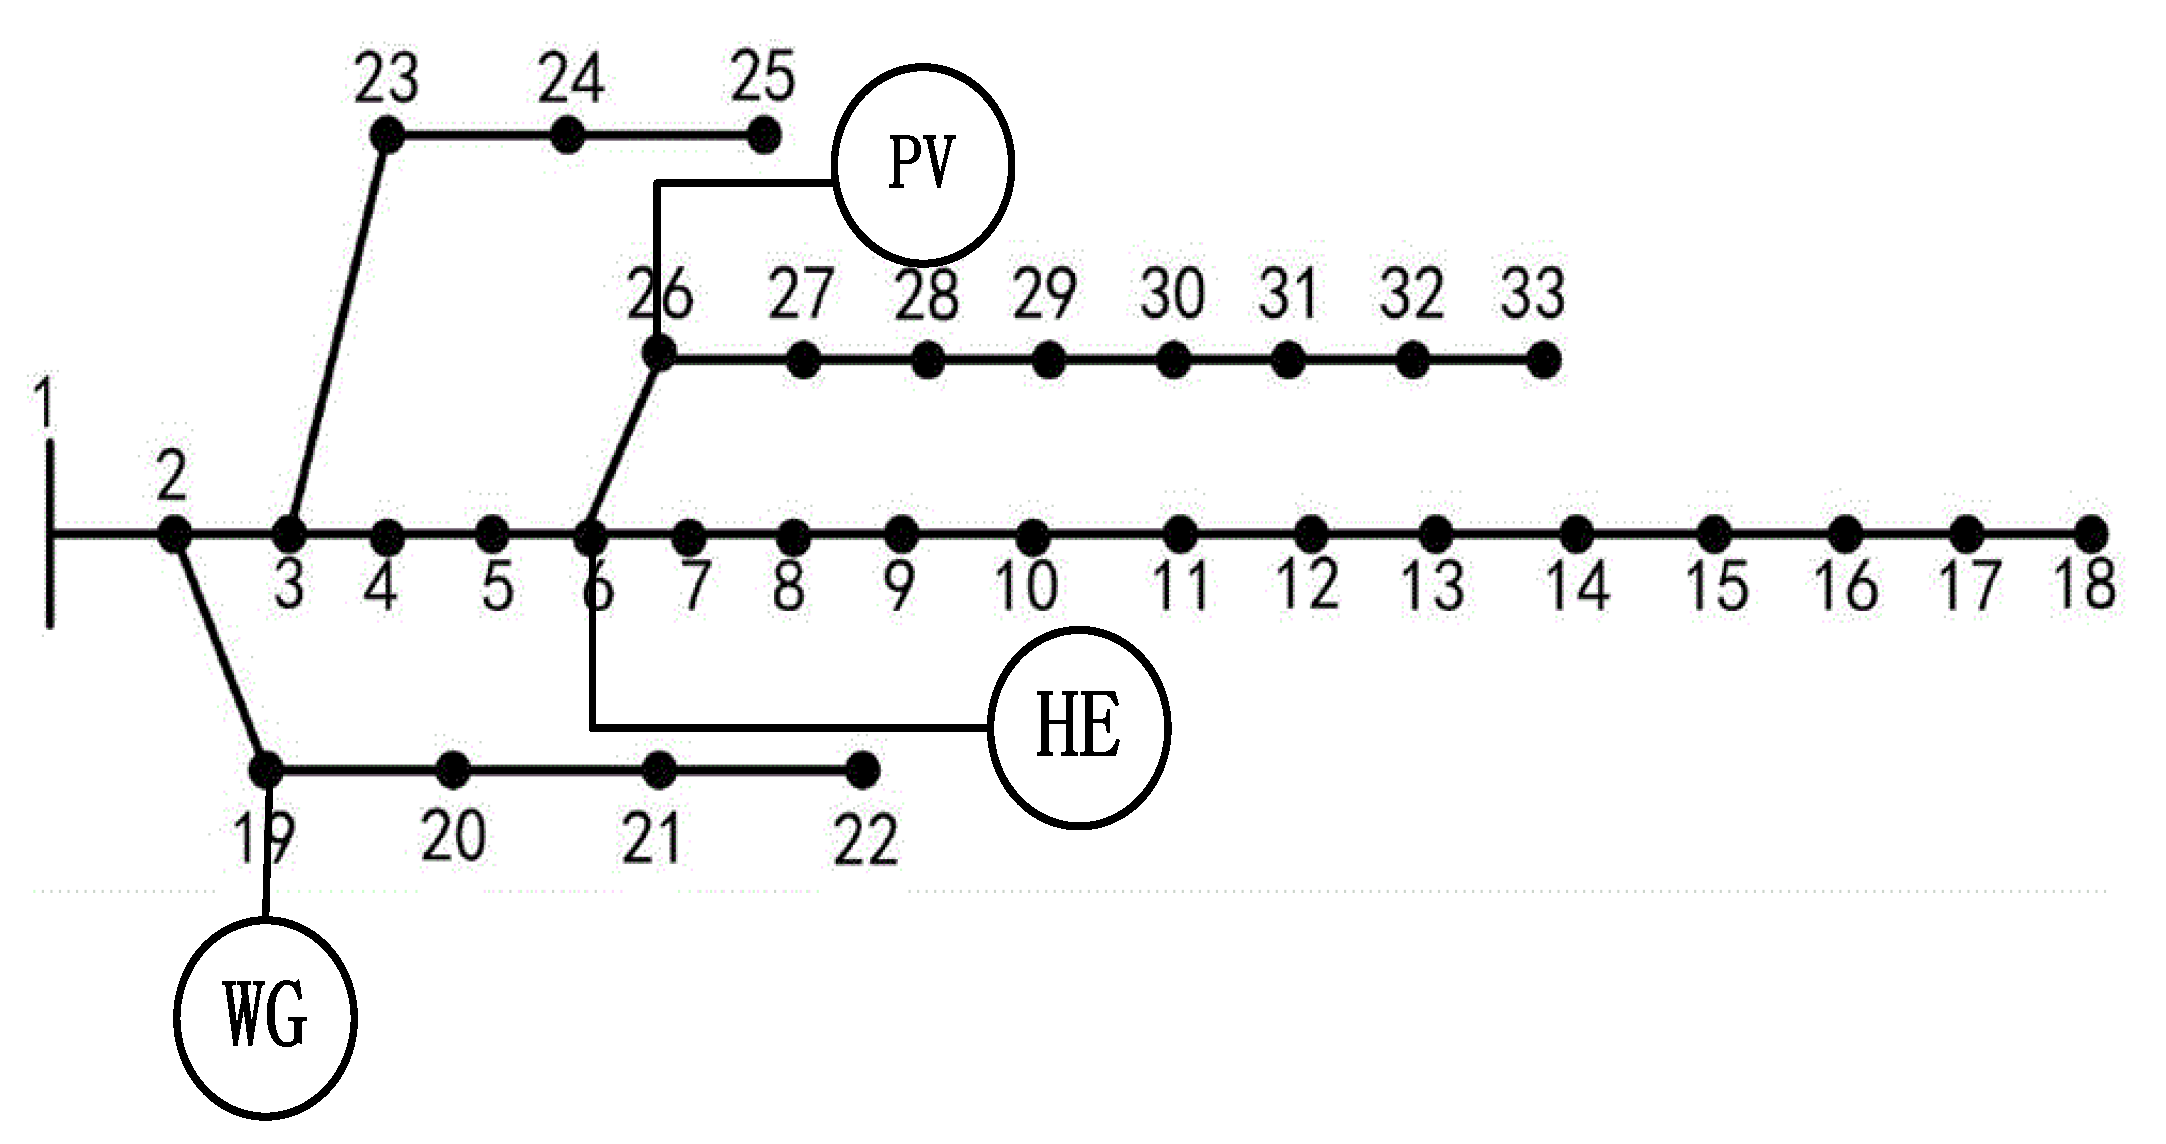
5.2. Analysis of the Impact of Energy Storage System Access Nodes

As shown in Figure 6, when the same capacity (400 kW) energy storage device was connected to different nodes, the voltage stability and minimum voltage difference were obvious. In nodes 8 to 18 and nodes 29 to 33 access, the node voltage was lower but the corresponding voltage stability index was also not high, thus the voltage lifting effect was not obvious. Therefore, it is not conducive to voltage safety and stability. Thus, if only the voltage stability indicators are considered, the nodes in Table 2 can be connected.
Assuming access to one of the nodes first, the size of the active network loss of the energy storage device at different access points of the network-wide 33 nodes is derived, as shown in Figure 7. As can be seen from the figure, the network-wide active network loss values are relatively low at nodes 1, 2, 6, 19–22, 28, and nodes 31–33, so it is possible to choose between these nodes.
After considering both the stability index curve and the active network loss curve, the energy storage device is connected to the above nodes, the tidal current calculation is carried out, and finally node 6 and node 30 are selected. Due to the three branches of the IEEE 33 node distribution system, the position of node 6 can be made the Interaction of energy, generating information faster and more economically secure, which is the interaction between the wind generation systems, PV systems, and loads of the individual nodes.

5.3. Interpretation of Result

5.3.1. Capacity Configuration Results and Economic Analysis

This paper takes a comparison under three scenes and thus judges the validity and reliability of this study. Scene 1 is a single layer multi-objective improved particle swarm optimization algorithm for configuration, without consideration of lower layer optimization. In scene 2, a double-layer optimization configuration model, the upper layer is optimized by a multi-objective chaotic particle swarm algorithm but does not consider that the operation layer wind power does not participate in the impact of system frequency modulation on the configuration. Scene 3 is the proposed solution of this study.
Table 3. Configuration results in the three scenarios (KW).
ParametersScene 1Scene 2Scene 3
capacity of lead-acid batteries464.55425.32157.34
capacity of supercapacitors1100926.93695.64
correction of supercapacitors05.255.95
Figure 8. Charging and discharge strategy of the HESSs in Scene 3.
Processes 10 01844 g008
In addition to lead-acid batteries, other types of hybrid batteries such as Li-Ion batteries and NaS batteries were also tested, demonstrating that the simulation results are rather different. This was done to diversify the forms of energy storage and widen the scope of optimization.
Table 4. The cost profiles of the configuration schemes (RMB).
ParametersScene 1Scene 2Scene 3
Investment costs3.34 × 1062.86 × 1061.91 × 106
operation and maintenance costs201.62176.6184.23
network loss costs3.493.272.67
wind and PV operation and maintenance costs80.3480.3480.34
power purchase costs52.2750.2545.29
correction costs071.1461.06
total costs3,337,137.732,934,047.531,844,656.99
From Table 3 and Table 4 it can be concluded that:
(1)
In Scene 1, a hybrid energy storage equipment is added to the system, and although the operation layer energy storage dispatching strategy does not take into account the system frequency deviation, it has a certain soothing effect on the equivalent load curve, achieving a certain effect of “Peak cut” and optimizing the operation of the grid.
(2)
Scene 2 is based on Scene 1, using a double-layer planning model, with only the lower layer of ESS taking part in the system’s FM. Therefore, the lower layer is used to correct the capacity of supercapacitors, with a correction value of 5.2456 kw, reducing the total cost by RMB 403,090.20. The cost reduction rate is about 12.08%, which achieves integrated planning of capacity dispatch and further improves the effect of peak and valley reduction.
(3)
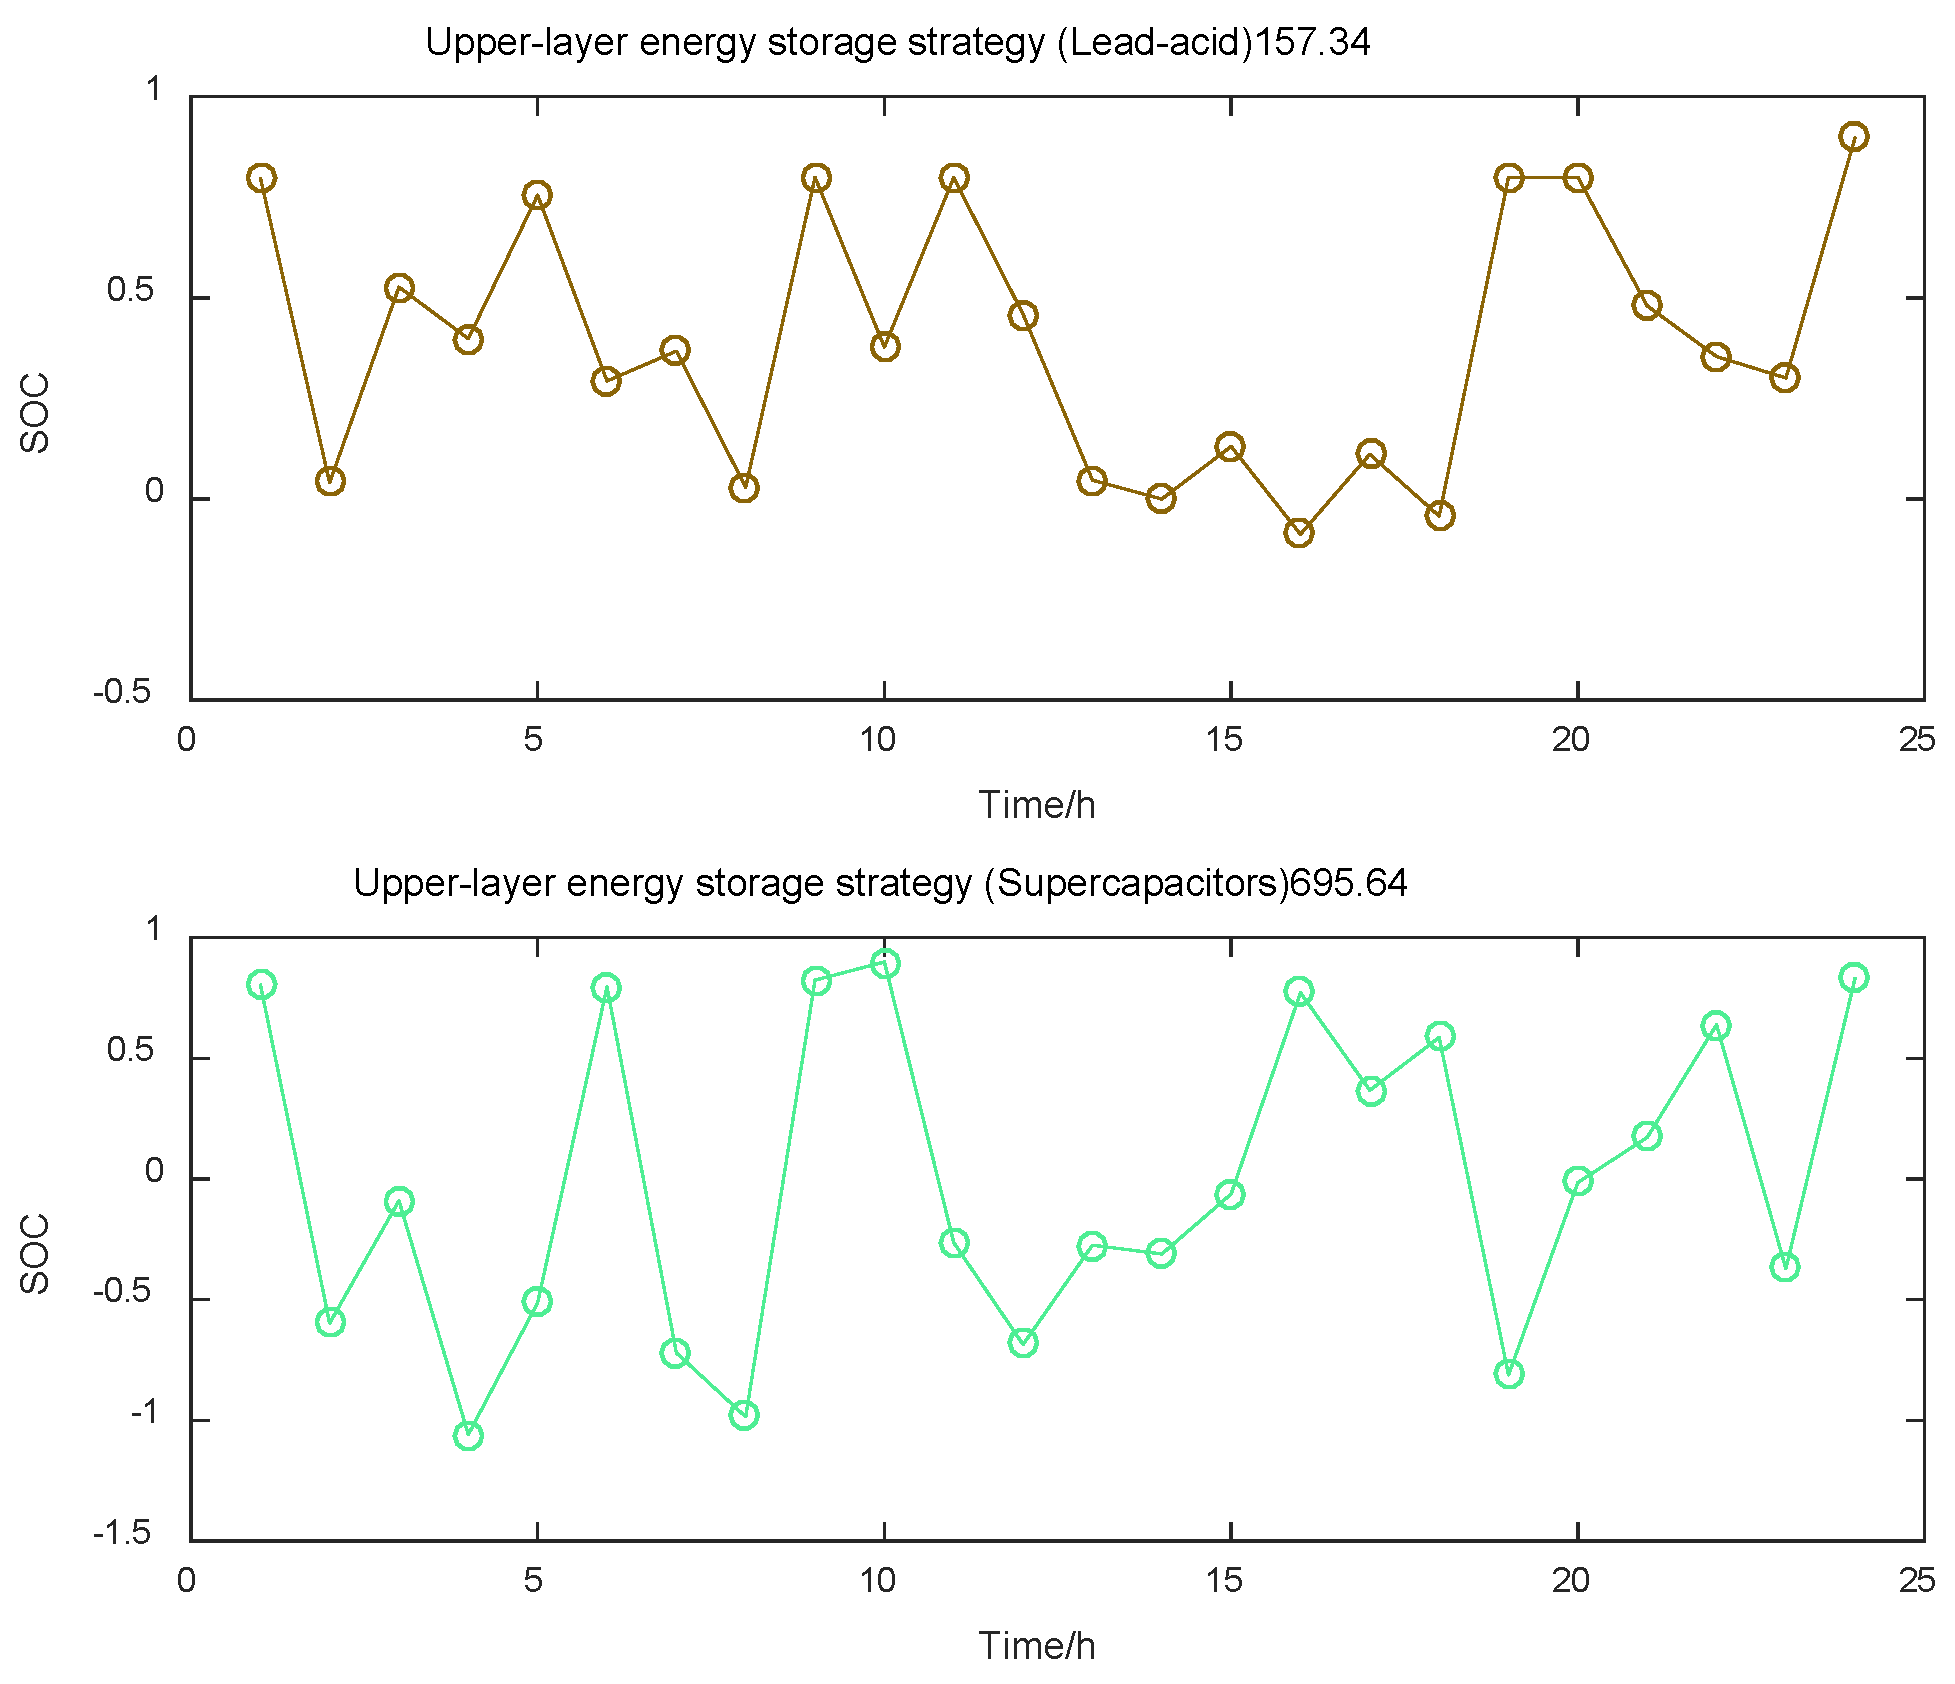
Scene 3 is an optimized configuration of the HESS based on a double-layer planning model, with WG added to the lower layer to participate in system FM, correcting the supercapacitor capacity value of the improvement. The charging and discharging strategy for hess in Scene 3 is introduced in Figure 8. The total costs of Scene 3 relative to Scene 1 and Scene 2 are RMB 1,492,480.74 and RMB 1,089,390.54 saved, respectively. The reduction rates are approximately 44.72% and 37.13%, with a total cost reduction while the effect of network loss optimization is also more obvious.
Table 5. Comparison of the three battery storage costs in Scene 3 (RMB).
ParametersNaSLi-Ion
Investment costs3.40 × 1063.75 × 106
operation and maintenance costs249.38343.32
network loss costs3.263.36
wind and PV operation and maintenance costs61.6061.60
power purchase costs50.9349.93
correction costs63.1256.97
total costs3,399,028.283,748,015.17
The analysis of lithium batteries and sodium-sulfur batteries in Scene 3 of this paper reveals that the life-cycle costs of lithium batteries are RMB 3,747,958.20 and the life-cycle costs of sodium-sulfur batteries are RMB 3,398,965.16, like Table 5, which leads one to the conclusion that lead-acid batteries are more cost-effective than other energy storage batteries because their price per unit capacity and power are lower.

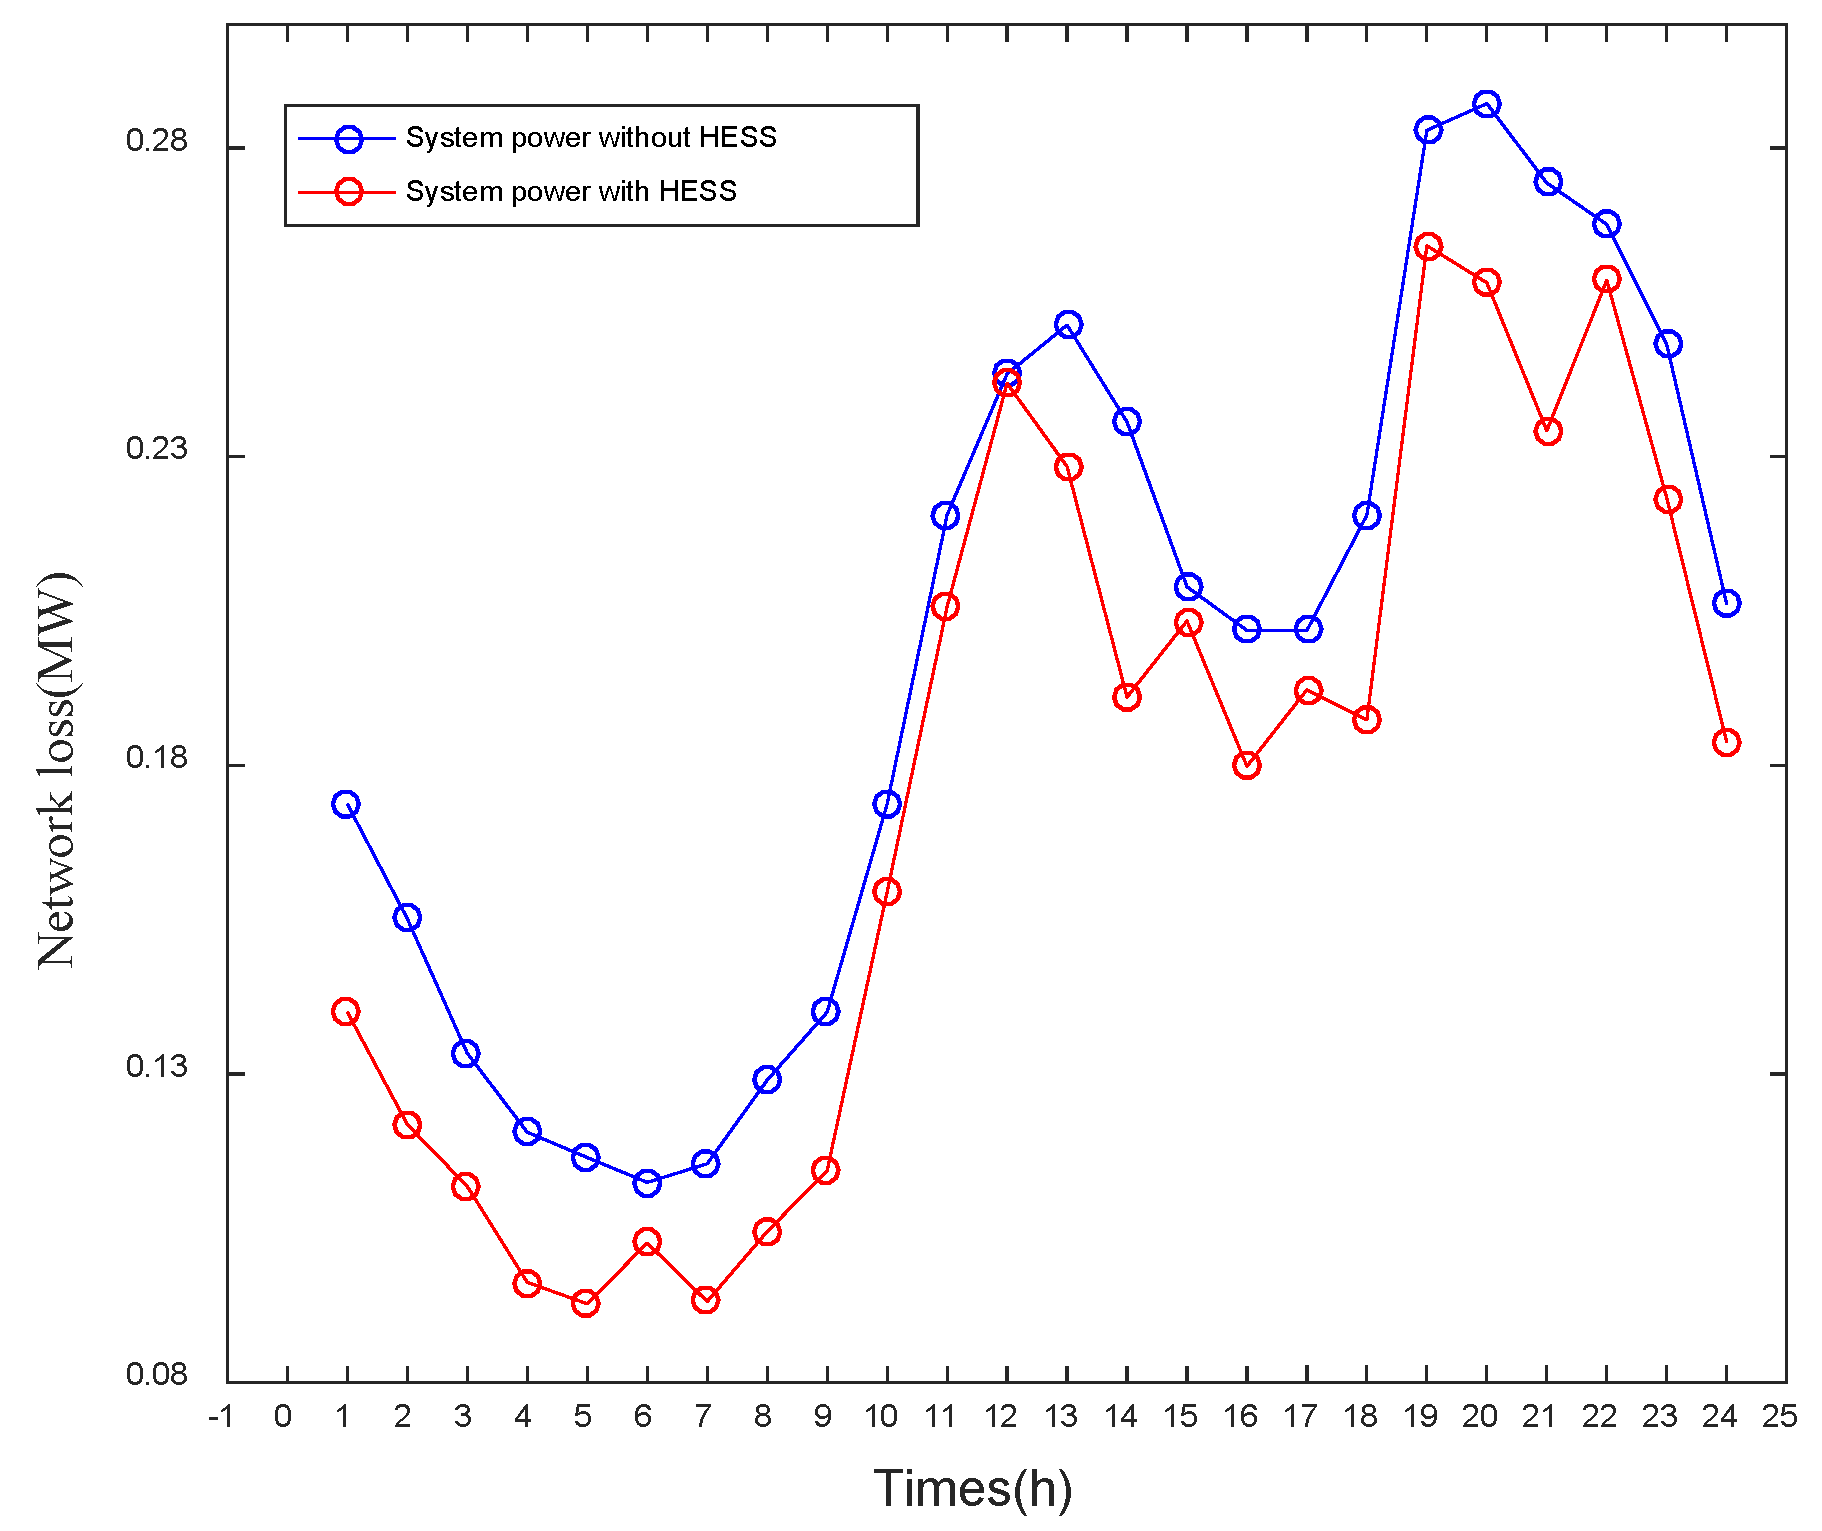
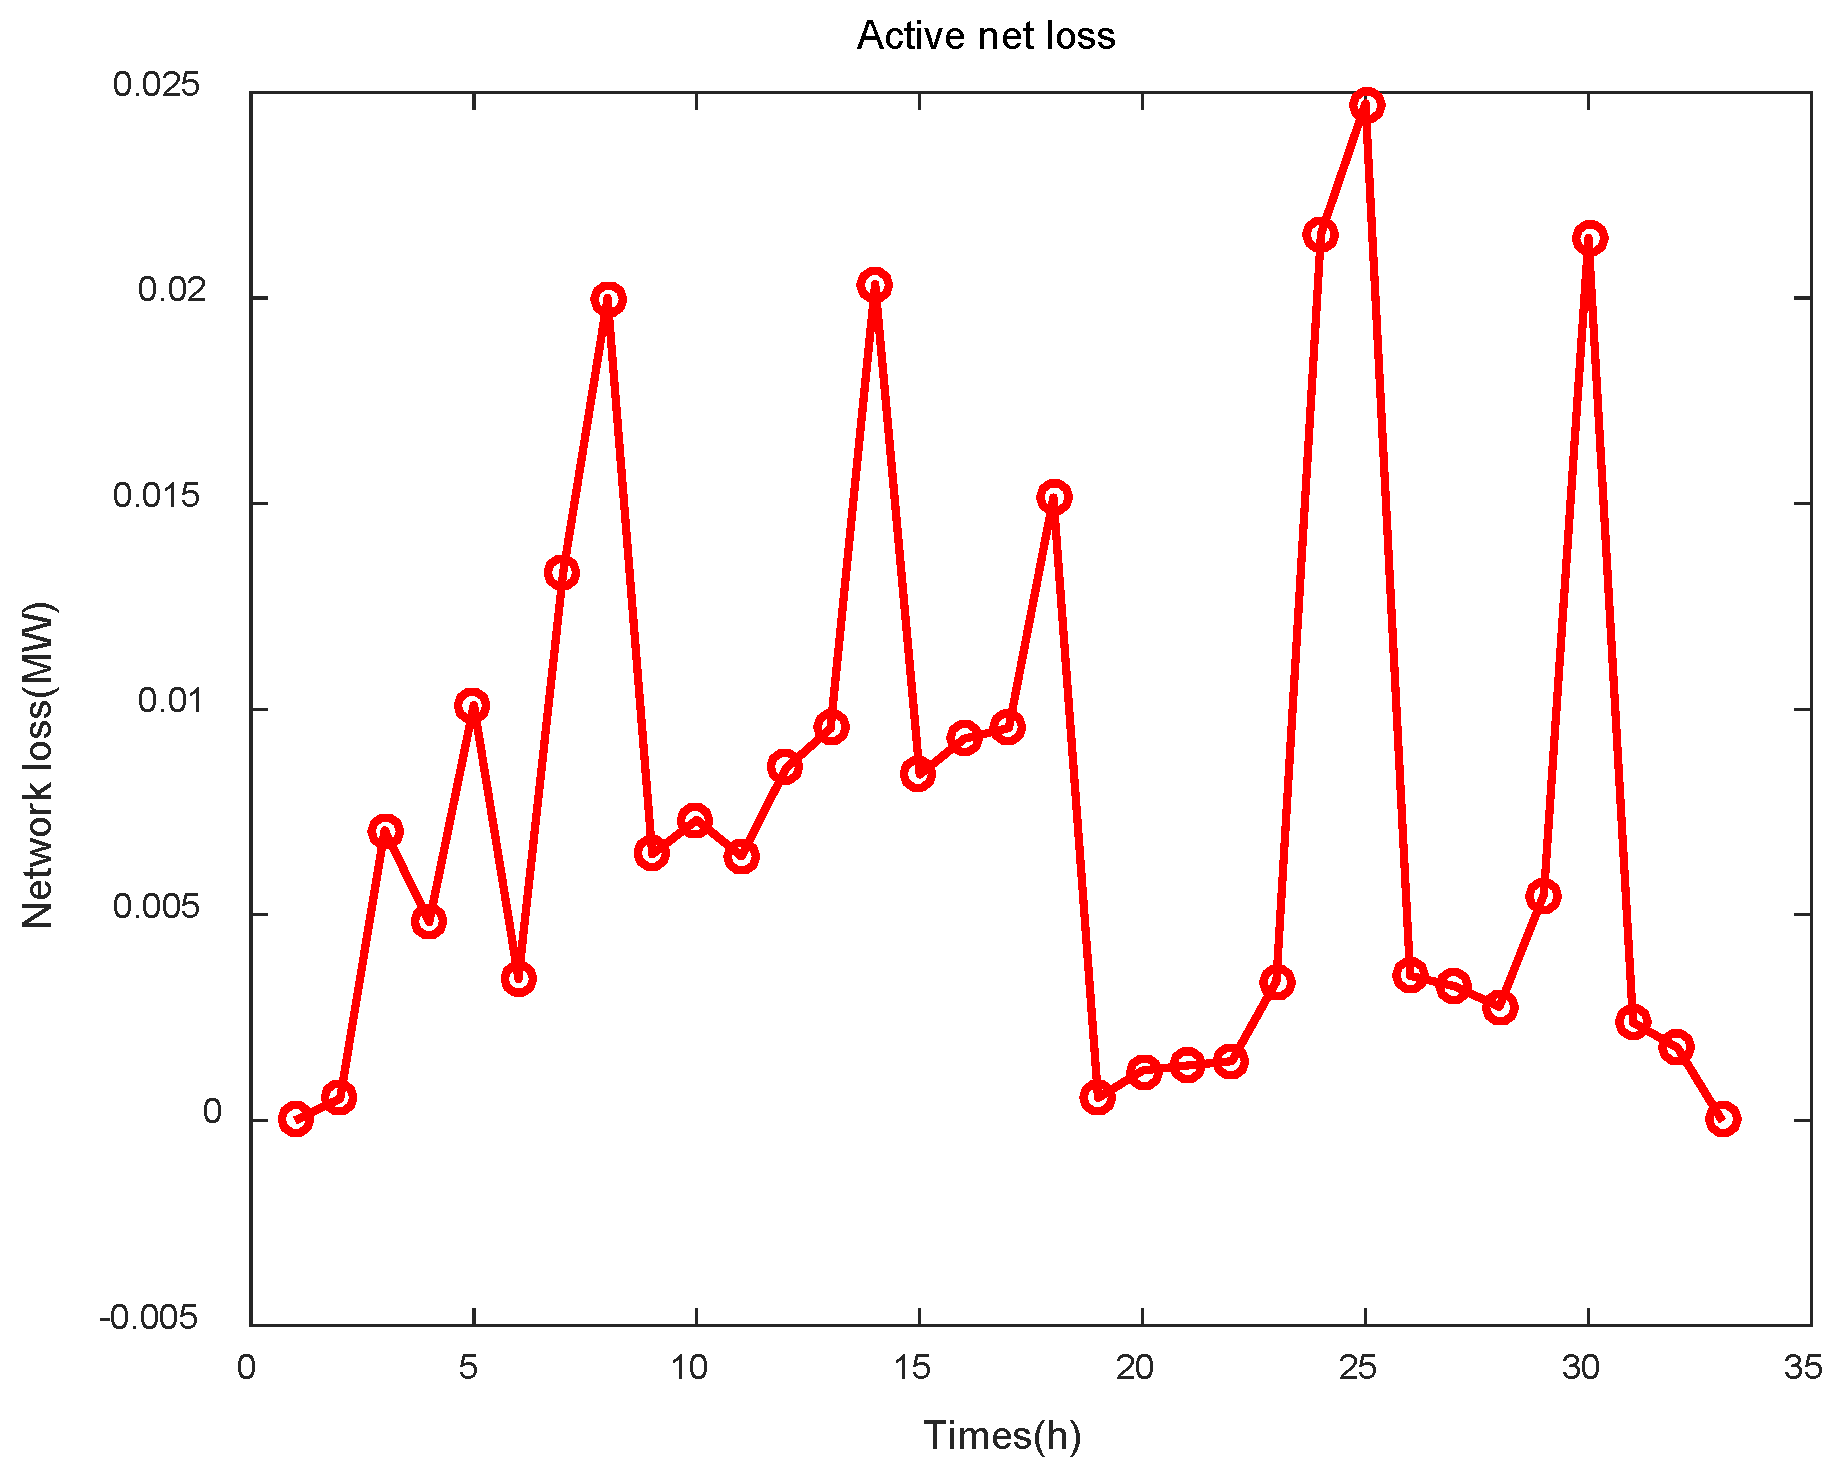
5.3.2. Network Loss Analysis after Optimization

The net loss can be greatly improved after the hybrid energy storage device in node 6 is delineated in Figure 9. The network loss before the configuration optimization is 4.72 MW, after is 4.19 MW, and the net loss is reduced by about 0.53 MW. At node 14, the network loss reduction is the largest, at about 0.045 MW.

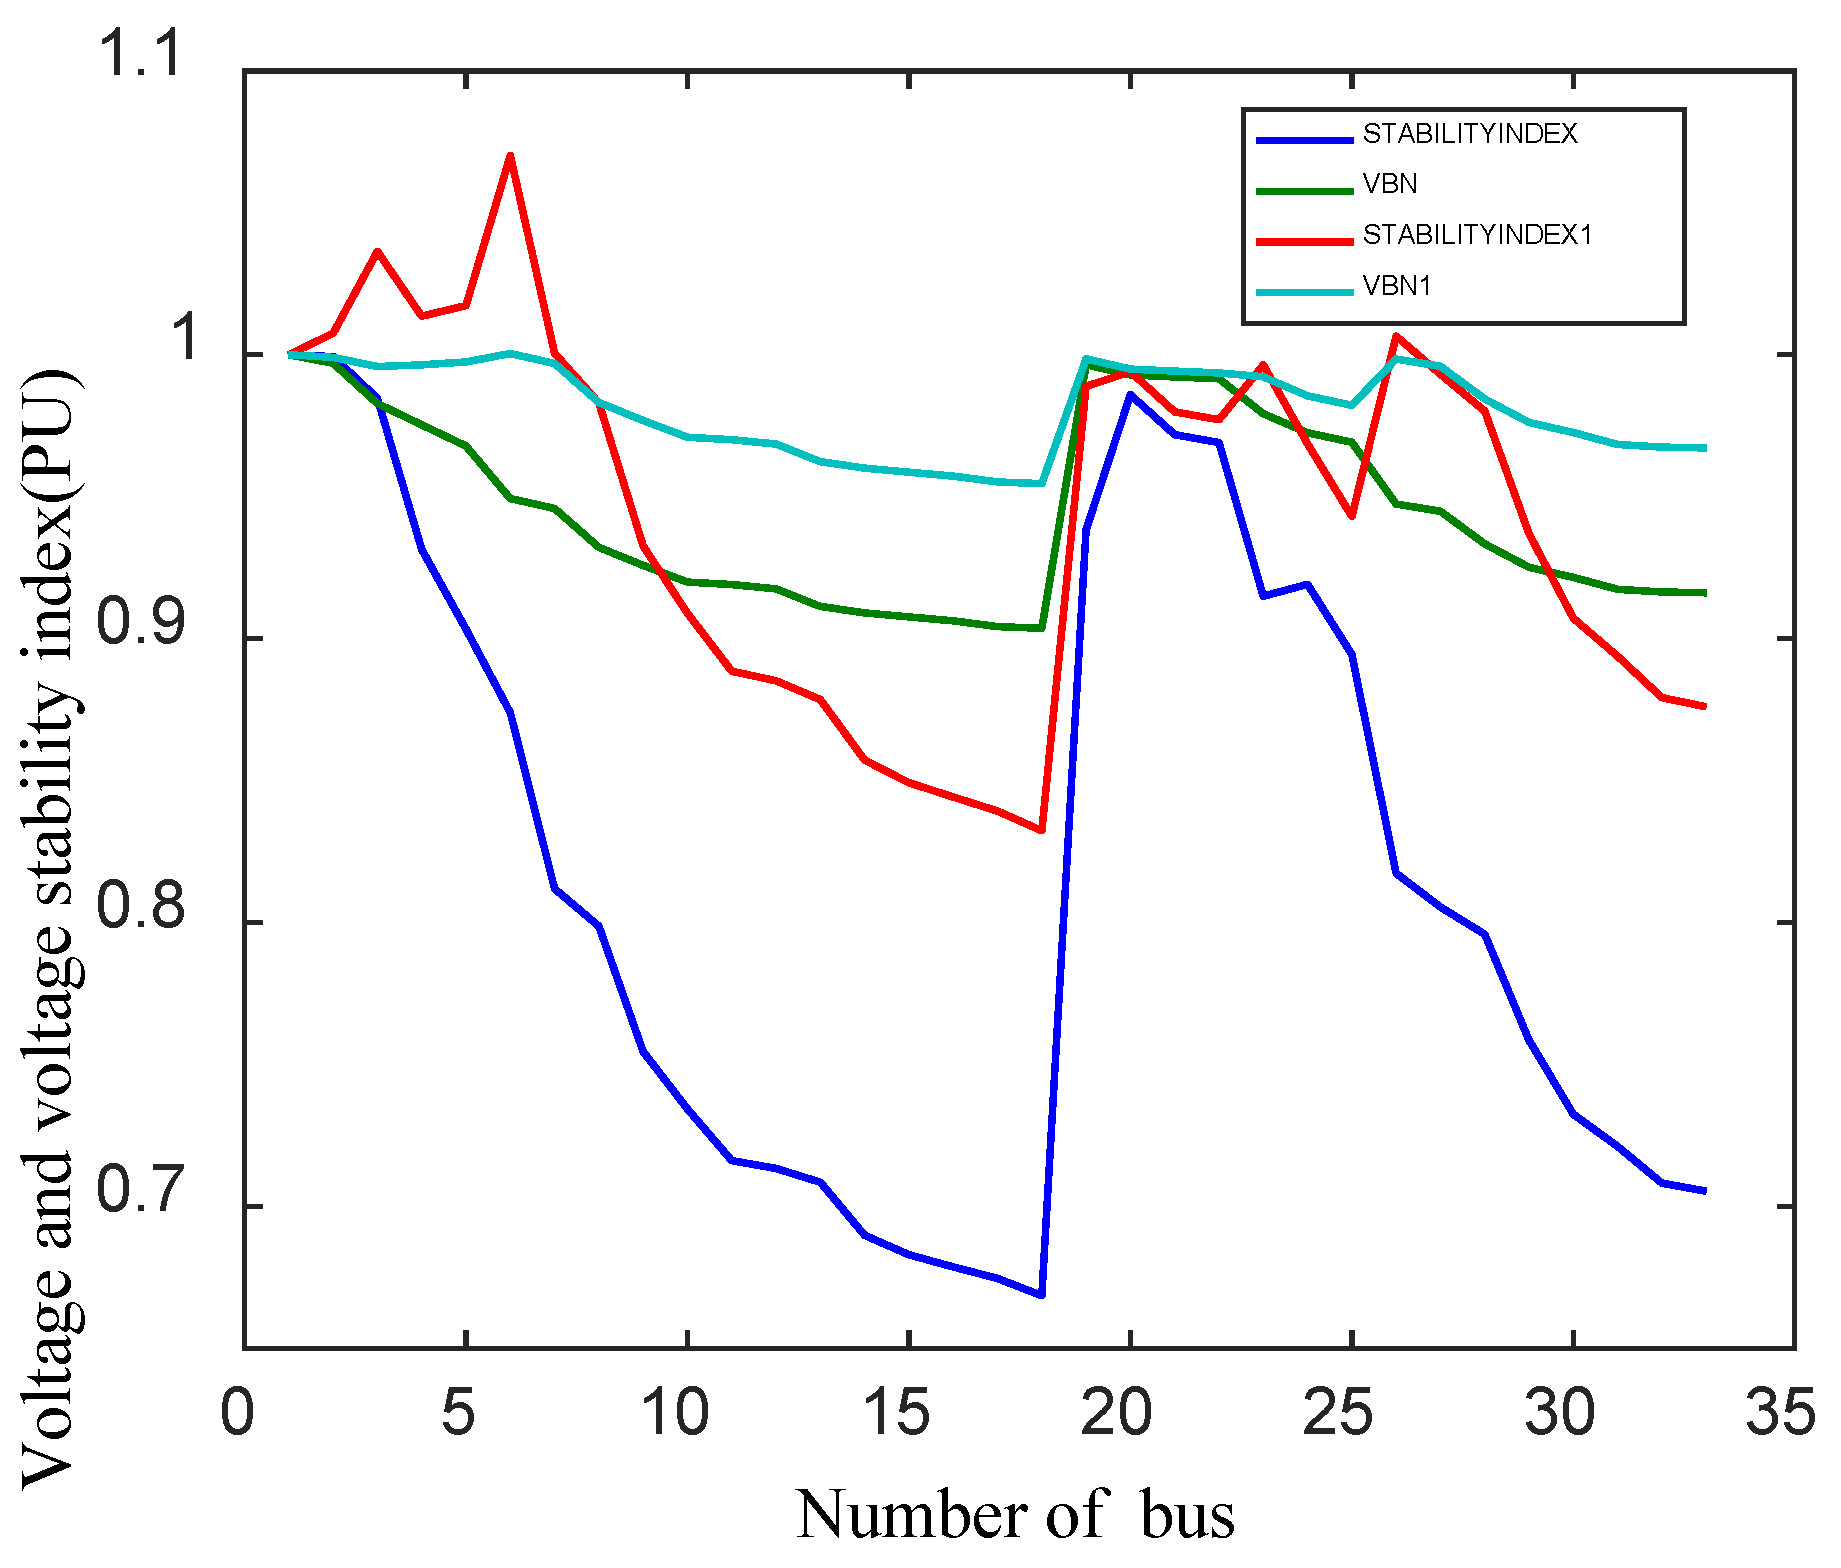
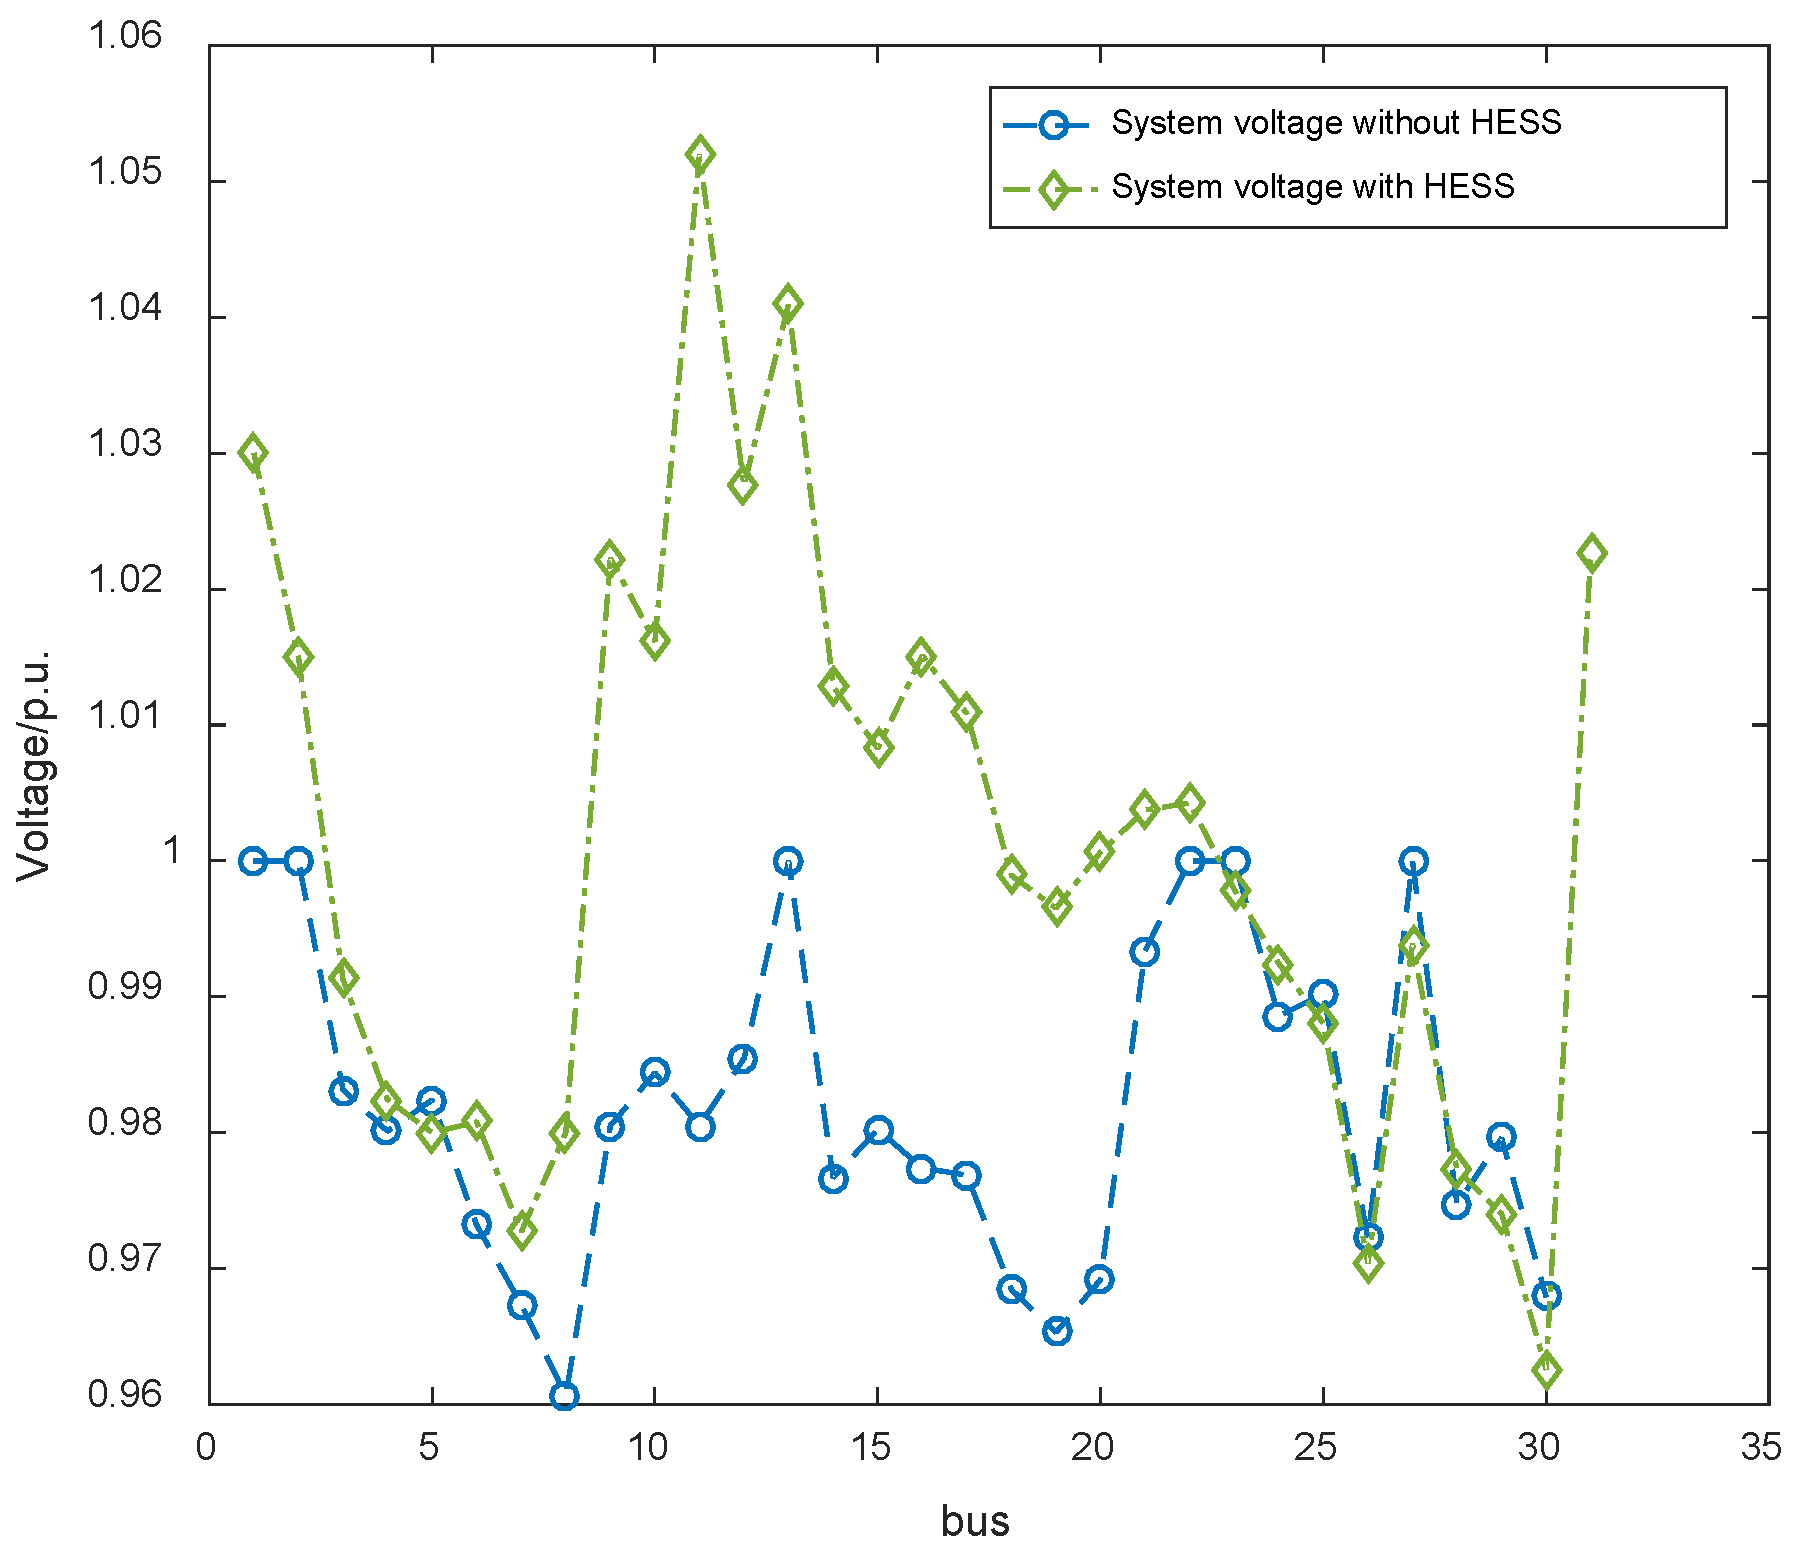
5.3.3. Optimum Voltage Analysis of Distribution Network

After energy storage optimization, the minimum voltage values of multiple nodes of the distribution network system are increased, and the minimum voltage increase at node 11 is the most obvious, which is described in Figure 10. To some extent, it can be explained that the energy storage system configuration has significantly improved the voltage of the network.

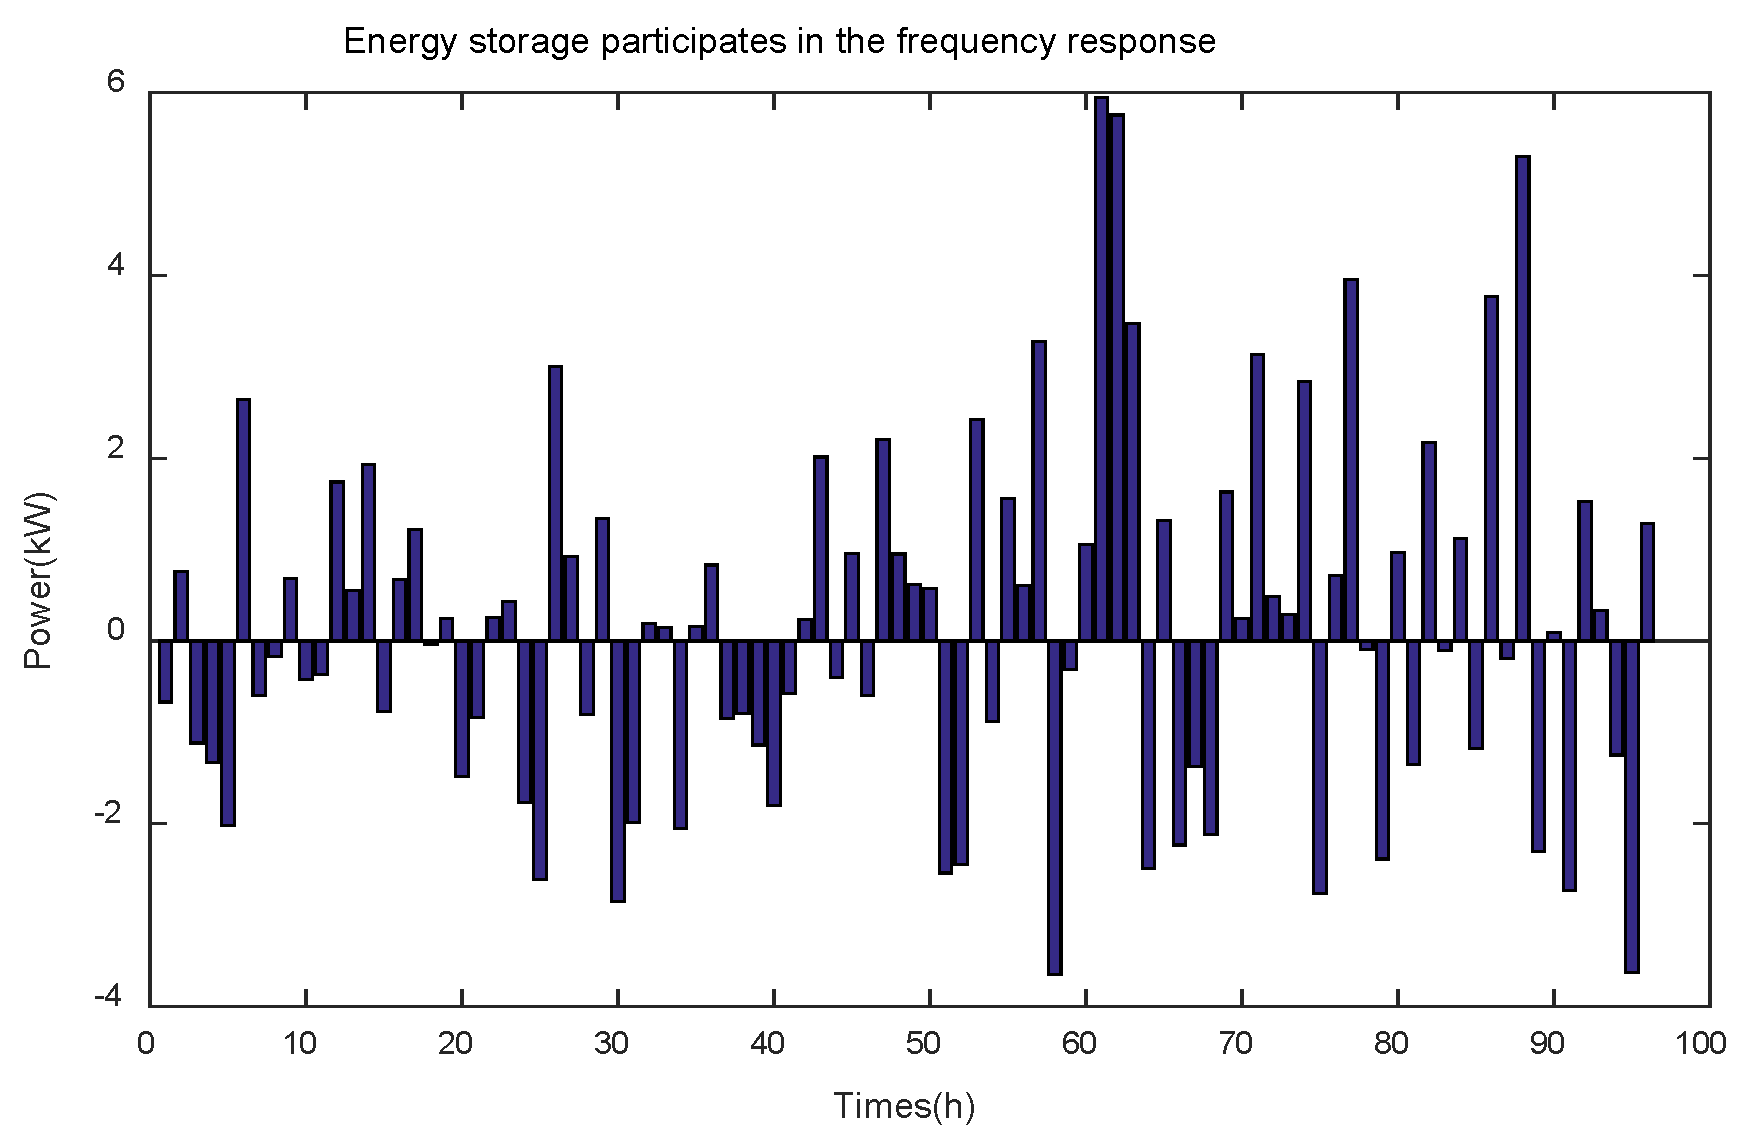
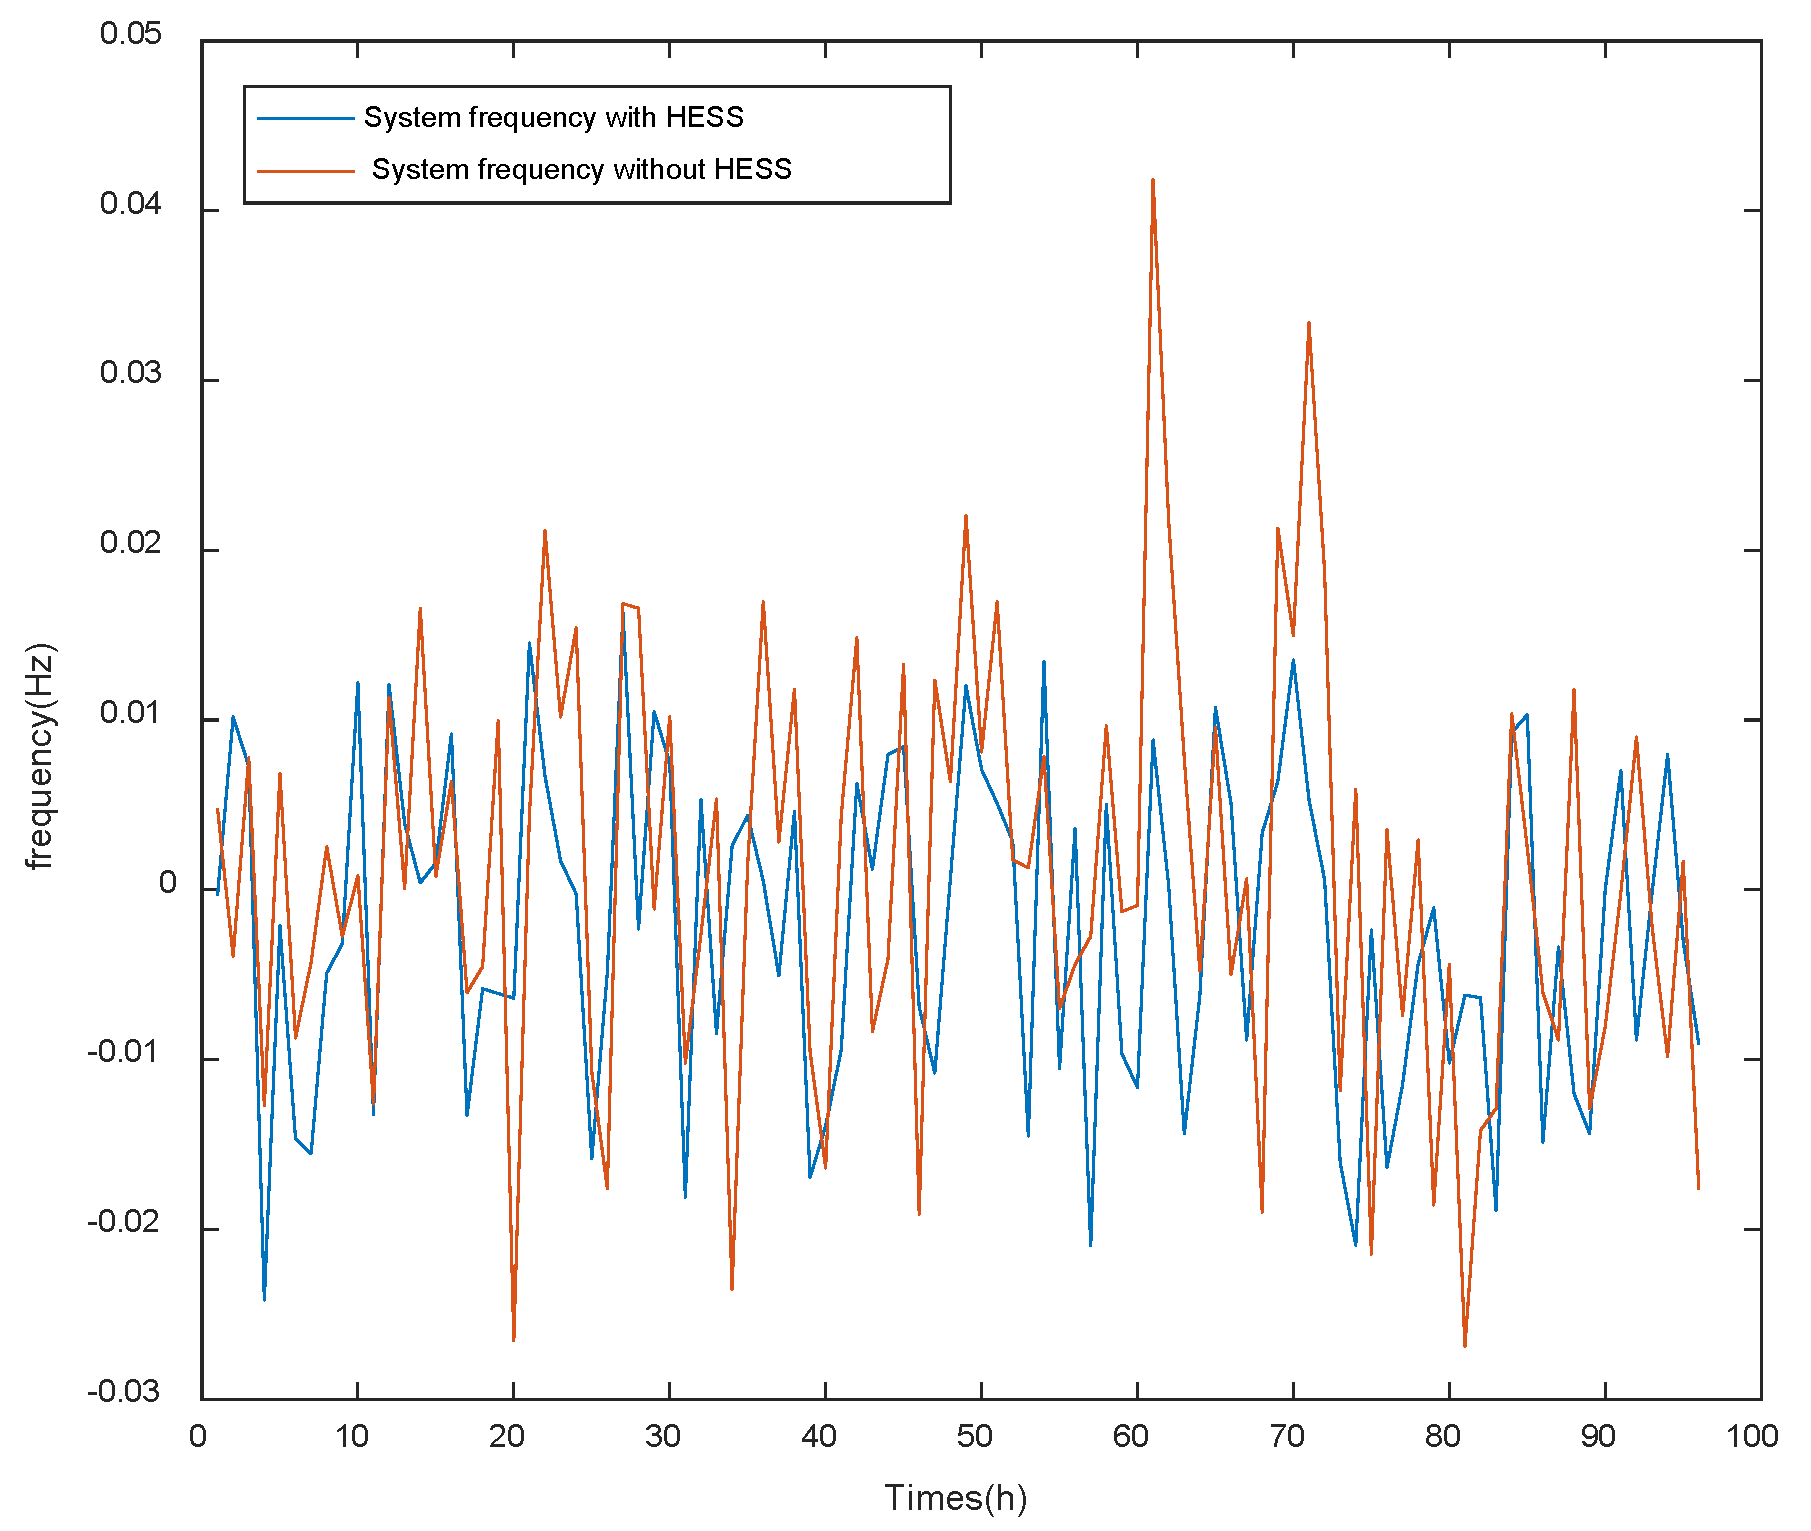
5.3.4. Analysis of the Frequency Bias after Optimization

Under normal frequency fluctuations (within the range of [−0.2,0.2]), the wind generator is effectively adjusted according to the reserved 20% output margin. In emergencies with large fluctuations (outside the range of [−0.2,0.2]), the maximum capacity of the wind generator is used to adjust the system frequency and the load side is demand-responding, with an adjustment factor within the rated value of 1.5.
The WG output during the system frequency modulation is displayed in Figure 11. The supercapacitor energy storage outputs during system frequency modulation are described in Figure 12.
The frequency fluctuation range after optimization is obviously reduced by extending the time for system frequency regulation to 96 h, which is described in Figure 13, with the frequency fluctuating within −0.032~0.042 Hz before optimization and within −0.024~0.016 Hz after optimization. To some extent, the frequency fluctuations of the ADN are abated.

6. Conclusions

This paper studies the effect of energy storage charging/discharging tactics and WG participation in frequency modulation on HESS configuration and operation in ADN containing volatile energy sources, which is solved in MATLAB using a dynamic chaotic particle swarm algorithm. Through the simulation analysis of the improved case 33 nodes power distribution system, the three conclusions are obtained.
(1)
The first layer is developed according to the equivalent load curve and proposes a charging and discharging strategy for the HESS considering the “time-of-day tariff”, while the second layer adopts WG and HESS to suppress fluctuations in the operation strategy, which can achieve better economic results and “Peak cut and fulfill valleys” with less investment and operation costs.
(2)
Optimizing the configuration of the HESS with “integrated planning of the configuration capacity and dispatching strategy” and establishing a mathematical model for the optimal configuration of the capacity ensures that research of energy storage configuration can be more reasonably and accurately grasped, and the risk of over-investment or under-investment can be reduced.
(3)
Consideration of the dynamic characteristics of HESS operation, which can achieve the goal of smoothing fluctuating energy’s power fluctuation, as well as improving the voltage quality of the distribution network and reducing network losses, which is of more practical significance.

Author Contributions

Conceptualization, G.L., Y.H. and C.H.; methodology, G.L.; software, Y.H.; validation, G.L., L.C. and N.D.; formal analysis, Y.H. and L.D.; investigation, L.D. and S.L.; resources, G.L.; writing—review and editing, Y.H. All authors have read and agreed to the published version of the manuscript.

Funding

This research was funded by the Natural Science Foundation Project of Chongqing Science and Technology Commission (grant numbers cstc2021jcyj-msxmX0301, cstc2020jcyj-msxmX0034, 2022NSCQ-MSX4086, and 2022NSCQ-MSX3846), the Science and Technology Research Program of Chongqing Municipal Education Commission (grant numbers KJZD-K202101202 and KJZD-K202103401), and the Wanzhou District Innovation and Entrepreneurship Demonstration Team (No.2021-07).

Institutional Review Board Statement

Not applicable.

Informed Consent Statement

Not applicable.

Data Availability Statement

Not applicable.

Conflicts of Interest

The authors declare no conflict of interest.

References

  1. Paul, S.; Dey, T.; Saha, P.; Dey, S.; Sen, R. Review on the development scenario of renewable energy in different country. In Proceedings of the 2021 Innovations in Energy Management and Renewable Resources (52042), Kolkata, India, 5–7 February 2021; pp. 1–2. [Google Scholar]
  2. Mokryani, G. Energy Storage Systems in Future Distribution Networks. In Future Distribution Networks: Planning, Operation, and Control; AIP Publishing: Melville, NY, USA, 2022. [Google Scholar] [CrossRef]
  3. Guo, X.; Chen, Q.; Liang, W.; Wang, S.; Wang, Y.; Qin, Y. Intelligent Optimization Algorithm of Active Distribution Network Based on Load Storage Cooperative Optimization of Source Network. In Proceedings of the 2021 IEEE 4th International Conference on Automation, Electronics and Electrical Engineering (AUTEEE), Shenyang, China, 19–21 November 2021; pp. 355–360. [Google Scholar]
  4. Wang, H.; Ma, C.; Sheng, W.; Sha, G.; Zhao, C.; Liu, N.; Duan, Q. Energy Storage Configuration Optimization Strategy for Islanded Microgrid Interconnection Based on Energy Consumption Characteristics. Discrete Dyn. Nat. Soc. 2021, 2021, 2826670. [Google Scholar] [CrossRef]
  5. Chen, T.; Yang, J.; Jiang, W.; Sui, Z.; Wang, Y. Optimal configuration of energy storage capacity in wind farms based on cloud energy storage service. IET Renew. Power Gener. 2022, 16, 211–222. [Google Scholar] [CrossRef]
  6. Mao, M.; Hong, J.; Zhang, L. Energy storage optimization configuration method considering conditional forecast error correction. Taiyangneng Xuebao 2021, 42, 410–416. [Google Scholar]
  7. Liu, Y.; Liu, Q.; Guan, H.; Li, X.; Bi, D.; Guo, Y.; Sun, H. Optimization Strategy of Configuration and Scheduling for User-Side Energy Storage. Electronics 2022, 11, 120. [Google Scholar] [CrossRef]
  8. Shi, X.; Shi, X.; Dong, W.; Zang, P.; Jia, H.; Wu, J.; Wang, Y. Research on energy storage configuration method based on wind and solar volatility. In Proceedings of the 2020 10th International Conference on Power and Energy Systems (ICPES), Chengdu, China, 25–27 December 2020; IEEE: New York, NY, USA, 2020; pp. 464–468. [Google Scholar]
  9. Wu, T.; Shi, X.; Li, L.; Zhou, C.; Zhou, H.; Su, Y. A capacity configuration control strategy to alleviate power fluctuation of hybrid energy storage system based on improved particle swarm optimization. Energies 2019, 12, 642. [Google Scholar] [CrossRef]
  10. Wang, D.; Zhao, Y.; Tao, Q.; Xue, J.; Ye, J. Research on Planning and Configuration of Multi-objective Energy Storage System Solved by Improved Ant Colony Algorithm. In Proceedings of the 2018 China International Conference on Electricity Distribution (CICED), Tianjin, China, 17–19 September 2018; pp. 2279–2283. [Google Scholar]
  11. Gong, Q.; Wang, Y.; Fang, J.; Qiao, H.; Liu, D. Optimal configuration of the energy storage system in ADN considering energy storage operation strategy and dynamic characteristic. IET Gener. Transm. Distrib. 2020, 14, 1005–1011. [Google Scholar] [CrossRef]
  12. Li, J.; Xue, Y.; Tian, L.; Yuan, X. Research on optimal configuration strategy of energy storage capacity in grid-connected microgrid. Prot. Control Mod. Power Syst. 2017, 2, 35. [Google Scholar] [CrossRef]
  13. Yao, M.; Cai, X. Energy storage sizing optimization for large-scale PV power plant. IEEE Access 2021, 9, 75599–75607. [Google Scholar] [CrossRef]
  14. Song, J.; Hu, C.; Su, L. Distributed Wind Power and Photovoltaic Energy Storage Capacity Configuration Method under Big Data. In Proceedings of the 2021 International Conference on Electronic Communications, Internet of Things and Big Data (ICEIB), Yilan, Taiwan, 10–12 December 2021; pp. 318–322. [Google Scholar]
  15. Ma, T.; Gu, H.; Zha, Z.; Li, G.; Lou, H. A Two-Layer Optimization Model for Energy Storage Configuration in the Distribution Network. In IOP Conference Series: Earth and Environmental Science; IOP Publishing: Bristol, UK, 2021; Volume 647, p. 012012. [Google Scholar]
  16. Ma, W.; Wang, W.; Wu, X.; Hu, R.; Tang, F.; Zhang, W. Control Strategy of a Hybrid Energy Storage System to Smooth Photovoltaic Power Fluctuations Considering Photovoltaic Output Power Curtailment. Sustainability 2019, 11, 1324. [Google Scholar] [CrossRef]
  17. Wang, P.; Zhang, F.; Chen, Q. Bi-level optimal configuration of hybrid energy storage for wind farms considering battery life. J. Phys. Conf. Ser. 2022, 2247, 012005. [Google Scholar] [CrossRef]
  18. Wang, Y.; Song, F.; Ma, Y.; Zhang, Y.; Yang, J.; Liu, Y.; Zhang, F. Research on capacity planning and optimization of regional integrated energy system based on hybrid energy storage system. Appl. Therm. Eng. 2020, 180, 115834. [Google Scholar] [CrossRef]
  19. Liu, C. Optimal Configuration and Energy Management of Hybrid Energy Storage System with Lithium Battery and Supercapacitor; University of Science and Technology of China: Hefei, China, 2020. [Google Scholar]
  20. Shen, Y.; Hu, W.; Liu, M.; Fang, Y.; Hong, X. Energy storage optimization method for microgrid considering multi-energy coupling demand response. J. Energy Storage 2022, 45, 103521. [Google Scholar] [CrossRef]
  21. Liu, H.; Liu, Y.; Zhang, C.; Sun, L.; Wu, X. Configuration of an Energy Storage System Considering the Frequency Response and the Dynamic Frequency Dispersion. Front. Energy Res. 2022, 9, 807763. [Google Scholar] [CrossRef]
  22. Liu, D.; Jin, Z.; Chen, H.; Cao, H.; Yuan, Y.; Fan, Y.; Song, Y. Peak Shaving and Frequency Regulation Coordinated Output Optimization Based on Improving Economy of Energy Storage. Electronics 2022, 11, 29. [Google Scholar] [CrossRef]
  23. Liu, Y.; Wang, L.; Zeng, Z.; Bei, Y. Optimal charging plan for electric bus considering time-of-day electricity tariff. J. Intell. Connect. Veh. 2022, 5, 123–137. [Google Scholar] [CrossRef]
Figure 1. PV power fluctuations in one minute.
Processes 10 01844 g001
Figure 2. Comparison of the load curve and the volatile energy output.
Processes 10 01844 g002
Figure 3. The strategy of charging and discharging.
Processes 10 01844 g003
Figure 4. An MCPSO flow chart for solving the optimal HESS configuration.
Processes 10 01844 g004
Figure 5. Example system of PV, WG, and HESS access in ADN.
Processes 10 01844 g005
Figure 6. Voltage stability index for different access points.
Processes 10 01844 g006
Figure 7. Effect of different access points on active power network loss.
Processes 10 01844 g007
Figure 9. Network loss comparison after adding HESS to ADN.
Processes 10 01844 g009
Figure 10. Optimized voltage comparison curve after distribution network.
Processes 10 01844 g010
Figure 11. The output of WG participation in frequency regulation.
Processes 10 01844 g011
Figure 12. The output of HESS participation in frequency regulation.
Processes 10 01844 g012
Figure 13. Comparison of frequency response before and after each period.
Processes 10 01844 g013
Table 1. Related parameters of the energy storage unit.
ParametersLead-Acid BatteriesSC
SOCmin0.40.1
SOCmax0.80.9
charging and discharging efficiency (%)9898
capacity cost factor (RMB/kW)15002400
capacity maintenance cost factor (RMB/year)0.0450.015
service life (year)1020
power cost factor (RMB/MW)300300
initial volume of SOC0.40.1
discount rate (%)1010
power factor (%)9898
Table 2. Effect of different access points on grid voltage and stability. VBN: Voltage of the branch node.
Access NodesStability IndexVBN
111
20.990.99
30.980.98
200.980.99
210.970.99
220.960.99
Publisher’s Note: MDPI stays neutral with regard to jurisdictional claims in published maps and institutional affiliations.

