Article

Antioxidative Properties and Phenolic Profile of the Core, Pulp and Peel of Commercialized Kiwifruit by LC-ESI-QTOF-MS/MS

1
School of Agriculture and Food, Faculty of Veterinary and Agricultural Sciences, The University of Melbourne, Parkville, VIC 3010, Australia
2
Centre for Chemistry and Biotechnology, School of Life and Environmental Sciences, Deakin University, Geelong, VIC 3217, Australia
3
Faculty of Biological Sciences, The University of Leeds, Leeds LS2 9JT, UK
*
Author to whom correspondence should be addressed.
Processes 2022, 10(9), 1811; https://doi.org/10.3390/pr10091811
Submission received: 5 August 2022 / Revised: 2 September 2022 / Accepted: 3 September 2022 / Published: 8 September 2022
(This article belongs to the Section Biological Processes and Systems)

Abstract

:
The kiwifruit is cultivated globally due to its diversity of phytochemicals, especially phenolic compounds, which have antioxidant, anti-inflammatory and anti-cancer medical effects. However, only the pulp of the kiwifruit is consumed, while the peels and cores—which are also rich in phytochemicals—are usually wasted. Meanwhile, detailed information on the comparison among the three parts is still limited. In this study, the antioxidant potentials in the core, pulp, and peel of the three most commercialized kiwifruit cultivars (Australian-grown Hayward kiwifruit, New Zealand-grown Zesy002 kiwifruit, and New Zealand-grown organic Hayward kiwifruit) were selected. Their antioxidant capacities were tested, and their phenolic profiles were identified and characterized by liquid chromatography-electrospray ionization quadrupole time-of-flight mass spectrometry (LC-ESI-QTOF-MS/MS). The antioxidant results showed that the peel of New Zealand-grown organic Hayward kiwifruit contained the highest total phenolic content (9.65 mg gallic acid equivalent (GAE) mg/g) and total antioxidant capacity (4.43 mg ascorbic acid equivalent (AAE) mg/g), respectively. In addition, the antioxidant capacity of the peel is generally higher than that of the pulp and cores in all species, especially ABTS (2,2-Azino-bis-3ethylbenzothiazoline-6-sulfonic acid (ABTS) radical scavenging ability), ranging from 13.25 mg AAE/g to 18.31 mg AAE/g. The LC-ESI-QTOF-MS/MS tentatively identified the phenolic compounds present in the three kiwifruit species, including 118 unique compounds in kiwifruit peel, 12 unique compounds in the kiwifruit cores, and three unique compounds in kiwifruit pulp. The comprehensive characterization of the phenolics in the kiwifruits’ parts indicates the importance of their waste part as a promising source of phenolics with antioxidant properties. Therefore, this study can guide the industry with meaningful information on kiwifruit waste, and can provide it with the utilization of food and pharmacological aspects.

1. Introduction

Kiwifruit is now taking its place in the global fruit bowl as a superfood due to its unique flavour, nutrient density and potential health benefits [1]. Considering the fruits’ appearance, taste, storage characteristics and plant disease resistance, “Hayward” and “Zesy002” are two dominant cultivars currently in commercial kiwifruit production [2]. Compared with other commonly consumed fruits, both the green (65–90 mg/100 g) and gold kiwifruit (105–120 mg/100 g) are distinctively high in vitamin C, almost twice as high as orange (53 mg/100 g) and strawberries (57 mg/100 g), ten times higher than banana (9 mg/100 g) and watermelon (10 mg/100 g), and twenty times higher than apple (6 mg/100 g) [3]. Except for vitamin C, kiwifruits are also abundant in other vitamins, such as vitamin K (6.07 mg/100 g), vitamin B (folate form, 30.64 mg/100 g; regular form, 5.5 mg/100 g) and vitamin A (7.18 mg/100 g) [4]. In addition, dietary fibre, minerals and carotenoids also show a high level in both kiwifruit species [3].
Indeed, kiwifruit also contains various types of biologically active compounds, including antioxidants, phytochemicals, and enzymes, which act synergistically to provide functional and metabolic benefits [5]. Despite these high nutritional values, most kiwifruits are consumed without their peels and cores. Different parts of the fruits can provide different levels of bioactive compounds. In particular, kiwifruit peels have higher biological activity compared to the pulp, which may be due to the higher content of some molecules (flavonoids, organic acids and pigments) [6]. Additionally, although the nutritional information of kiwifruit cores was incomplete, they have been described as good sources of proteins, lipids and γ-tocopherol, γ-tocotrienol and ƍ-tocotrienol [7]. Therefore, it is a hopeful challenge to explore the bioactivities of each part of the kiwifruit, which can guide the no-waste food industry for this kind of fruit.
Overall, as a fruit high in phenolic content, kiwifruit provides protection against oxidative stress and supports the cardiovascular system [8], safeguarding people against heart diseases, cancer, diabetes, vascular diseases and central nervous system diseases [5]. Meanwhile, based on some traditional Chinese pharmacopoeias from the Tang Dynasty (AD 618–907), a whole variety of medicinal uses for “macaque fruit”—the Chinese name generally used for Actinidia species—have been predicted, involving digestion aid and irritability reduction [7]. In fact, a range of adult clinical studies also consistently indicated that kiwifruit could act as a dietary intervention to effectively promote laxation and prevent constipation. This was attributed to their high levels of fibre and a protease (actinidin), which help to digest proteins and improve gastric emptying [9]. The regular consumption of gold kiwifruit was also associated with mood improvement [10], and two kiwifruits before bed for four weeks resulted in improved sleep onset, sleep duration and sleep quality in adults with self-reported sleep disturbances [11]. Consuming kiwifruit may also be of benefit in enhancing immunity, in reducing the risk of cold or flu-like illness [12], and in iron deficiency treatment [13]. Therefore, with the increasing interest of consumers in health-promoting foods, kiwifruit has become a dietary supplement, which aids the kiwifruit industry [14].
The kiwifruit (Actinidia spp.) is a respiratory climacteric fruit. Once it enters the mature stage, it will rapidly soften until it rots [15]. This maturation mechanism of kiwifruit results in a very short shelf life for its fresh fruit on the market, and slow sales may trigger a heavy backlog of degraded kiwifruit [16]. Thus, the kiwifruit industry has been committed to the deep processing the fresh fruit into products, such as kiwifruit wine, juice, jam, preserved fruit, fruit powder, and even cosmetics or nutraceuticals to prolong the kiwifruit’s life-span and increase its added value [17,18]. The principle of “zero waste” in agricultural and food industries encourages processing plants to recycle waste and by-products as new raw materials for innovative products and applications to alleviate economic and environmental problems [19]. In kiwifruit industrial deep processing, there are masses of peels which are discarded after the collection of the pulp and juice from the fruits. Kiwifruit seeds are also disposed of as solid waste from food industries, which represent 33–46 g/kg of the edible part of the fruits [20]. However, these rejected kiwifruit, peel and seed residues remain good sources of many bioactive compounds such as carotenoids, terpenoids and polyphenols [21,22], which are associated with antioxidant [23], antimicrobial [24], anti-inflammatory [25] and anti-diabetic [26] activities. The kiwifruit peel and seeds may have a higher nutritional content than the edible parts of the fruits [27]. Kiwifruit seed oil and proteins have been successfully extracted and applied in food, health, and cosmetic industries as nutrient alternatives [28,29]. Although kiwifruit peel has been noted to contain a high phenolic content—i.e., 1273 mg/100 g—when compared with other fruits’ peel, for example, apple peel (329 mg/100 g) and orange peel (473 mg/100 g) [30], its exact phenolic profiles and antioxidant potential are still under exploration. The biological activities of polyphenols extracted from kiwifruit seeds remain unknown. The comparison of the bioactive compounds and antioxidant activities among different parts of the kiwifruit has not been well investigated yet. The kiwifruit’s appearance quality (fruit shape, size, skin type, etc.), organoleptic properties (aroma, flavor, texture, etc.), and nutritional composition (vitamins, amino acids, phenolics, etc.) may significantly vary depending on the kiwifruit cultivars, species, or genotypes, or even differ strikingly within the same species when growing under diverse conditions and at different maturation stages [31,32,33]. Organic foods are usually attributed with a higher antioxidant capacity because more secondary compounds such as polyphenols are thought to be synthesized under the strict ecosystem management in organic farming [34]. As such, investigations into possible differences between organically and conventionally grown fruits are meaningful to the study of kiwifruit polyphenols.
Therefore, considering the nutritional significance of phenolic compounds for their suggested attribution to the kiwifruit’s antioxidant capacity [35,36], as well as the large amount of kiwifruit waste generated by the development of kiwifruit planting and processing on a global scale, we evaluated the antioxidant potential in the core, pulp, and peel of the three most commercialized kiwifruit cultivars, and we characterized their phenolic profiles to provide data as a reference for the fine processing of diverse kiwifruit cultivars, as well as to promote future applications of kiwifruit waste in the food industry. In this study, an optimum extraction method was developed to allow the accurate identification and quantification of the phenolic compounds within extracts. After extraction, the antioxidant activity or capacity was determined using selected assays, such as phenolic estimation methods and potential antioxidant assays. Then, a complete phenolic profile was further characterized through liquid chromatography with electrospray ionization-quadrupole time-of-flight mass spectrometry (LC-ESI-QTOF-MS/MS).

2. Materials and Methods

2.1. Sample Preparation

Class 1 “Hayward” kiwifruit (Actinidia deliciosa var. deliciosa) grown and packed by the Jade Quality growing orchard in Northeast Victoria, Australia (390 Whorouly Bowmans Road Australia, Bowmans Forest, VIC 3735, Australia); Class 1 “Zesy002” marketed as “Zespri® SunGold” kiwifruit (Actinidia chinensis var. chinensis) grown in New Zealand and supplied by Zespri International Limited (400 Maunganui Road, Mount Maunganui 3116, New Zealand); and the organic “Hayward” kiwifruit from Woolworths macro wholefoods market (1 Woolworths Way Bella Vista NSW 2153, Australia), certified by the leading organic certification company BioGro (Digital Nomad (Old Bank Arcade), Customhouse Quay, Wellington 6011, New Zealand) and grown in New Zealand were used. The selection was made in order to study the diversity in phenolics between different kiwifruit species and their different parts when they are grown in these two largest agricultural countries in the Pacific. The samples were all purchased randomly in late August 2019 from a retail market in Melbourne, Australia. The fruits were cleaned, and the peel, pulp and core of the kiwifruits were separated into Australian-grown Hayward kiwifruit peel (AHL), Australian-grown Hayward kiwifruit pulp (AHP), Australian-grown Hayward kiwifruit cores (AHC), New Zealand-grown Zesy002 kiwifruit peel (NZL), New Zealand-grown Zesy002 kiwifruit pulp (NZP), New Zealand-grown Zesy002 kiwifruit cores (NZC), New Zealand-grown organic Hayward kiwifruit peel (OHL), New Zealand-grown organic Hayward kiwifruit pulp (OHP), and New Zealand-grown organic Hayward kiwifruit cores (OHC).
Each sample’s pulp and core were blended into slurries using a 1.5-L blender (Russell Hobbs Classic, model DZ-1613, Melbourne, VIC, Australia). The peels were trimmed into slices and freeze-dried at −20 °C for 48 h, and then lyophilized at −45 °C/50 MPa using a Dynavac engineering FD3 Freeze Drier (W.A., Australia) equipped with an Edwards RV12 oil-sealed rotary vane pump (Bolton, England). The freeze-dried peels were ground into powders. The peel powders, pulps and core slurries were stored at −20 °C.

2.2. Extraction of Phenolic Compounds

The phenolic compounds were extracted from 5.0 ± 0.1 g of each kiwifruit peel, pulp, and core sample with 20 mL 80% ethanol. The mixture was homogenized using an IKA Ultra-Turrax® T25 Homogenizer (Staufen, Germany), sequentially into a ZWYR- 240 shaking incubator (Labwit, Ashwood, Vic, Australia) at 120 rpm, at 4 °C overnight. After incubation, the extracts were centrifuged using a benchtop centrifuge (Hettich Rotina 380R, Tuttlingen, Baden-Württemberg, Germany) at 5000 rpm for 15 min at 4 °C. When the centrifugation was finished, the supernatant was immediately collected and filtered through a 0.45 μm syringe filter (Thermo Fisher Scientific Inc., Waltham, MA, USA). For further analysis, the filtrate was subsequently transferred and stored at −20 °C.

2.3. Estimation of the Phenolic Contents and Antioxidant Assays

According to the methods modified from Gu et al. [37], Suleria et al. [38] and Zhu et al. [39], TPC, TFC and TTC were assessed for the overall phenolic estimation of the extracts, and DPPH, FRAP, ABTS, RPA, OH-RSA, FICA and TAC assays were evaluated for the extracts’ total antioxidant capacity determination. Distilled water was used for color correction, and only the sample was added, without any color reagents. This was intended to avoid the influence of the sample’s inherent colour, such as pigments and other substances. All of the assays were performed in triplicates, and absorption data were attained using a Multiskan® Go microplate photometer (Thermo Fisher Scientific Inc., Waltham, MA, USA). The standard curves were created with R2 > 0.995.

2.3.1. Determination of the Total Phenolic Content (TPC)

Based on the Folin–Ciocalteu reagent method from Wang et al. [40], some modifications were made to determine the TPC in the kiwifruit peel, pulp and core extracts. A 25-μL aliquot of extract was added in triplicate into a 96-well plate (Corning Inc., Midland, NC, USA), followed by 25 μL diluted F-C reagent (Sigma-Aldrich, St. Louis, MO, USA, 1:3 diluted with water) and 200 μL Milli-Q water before incubation at room temperature for 5 min. Next, 25 μL 10% (w:w) sodium carbonate (Thermo Fisher, Scoresby, Melbourne, VIC, Australia) was added to basify the mixture, and the other 60-min incubation in dark condition was needed. The absorbance of the solutions was determined at a 765-nm wavelength using a spectrophotometer (Thermo Fisher Scientific Inc., Waltham, MA, USA). A standard curve of absorbance versus the weight of gallic acid (Sigma-Aldrich, concentrations ranging from 0 to 200 μg/mL) was also plotted. Ultimately, the TPC was calculated with the standard curve and expressed in the form of gallic acid equivalents (GAE) per gram (mg GAE/g) of the freeze-dried sample weight.

2.3.2. Determination of the Total Flavonoid Content (TFC)

The TFC in kiwifruit peel, pulp and core extracts was determined by the indium chloride method developed from Stavrou et al. [41]. An 80-μL aliquot of extract was transferred in triplicate into a 96-well plate, and was then mixed with 80 μL aluminium chloride (Sigma-Aldrich, vani2% diluted with ethanol) together with 120 μL sodium acetate solution (Thermo Fisher, 50 g/L). Incubation was subsequently carried out in a dark place at 25 °C for 150 min. Finally, the absorbance of the solution was measured at a 440-nm wavelength using a spectrophotometer, and the standard curve of absorbance versus the weight of quercetin (Sigma-Aldrich, 0–50 μg/mL) was plotted. The TFC value was calculated based on the standard curve, and was expressed as the mg quercetin equivalent per gram (mg QE/g) of freeze-dried sample weight.

2.3.3. Determination of the Total Tannin Content (TTC)

The modified vanillin–sulfuric acid method of Haile and Kang [42] was used to determine the TTC in kiwifruit peel, pulp and core extracts. First, a 25 μL samples were added in triplicate into a 96-well plate together with 150 μL methanolic vanillin reagent (Sigma-Aldrich, 4%, w/v) and 25 μL methanolic sulfuric acid (32%, v/v), followed by incubation in darkness at 25 °C for 15 min. The absorbance was measured at a 500-nm wavelength using a spectrophotometer, and the standard curve of absorbance versus the weight of catechin (0–1000 μg/mL) was plotted. The TTC value was expressed as the mg of catechin equivalent per gram (mg CE/g) of freeze-dried sample weight.

2.3.4. 2,2-Diphenyl-1-picrylhydrazyl (DPPH) Antioxidant Assay

The DPPH assay from Sogi et al. [43] was improved in this study in order to examine the free radical scavenging ability of kiwifruit peel, pulp and core extracts. A 40-μL aliquot of extract was mixed in triplicate with 260 μL DPPH methanolic solution (Sigma-Aldrich, 0.1 mM) in a 96-well plate. After a vigorous shake and an incubation at 25 °C for 30 min, the absorbance was measured at the 517-nm wavelength using a spectrophotometer, and the standard curve of absorbance versus the weight of ascorbic acid (Sigma-Aldrich, 0–50 μg/mL) was plotted. The radical scavenging capacity of DPPH was calculated based on the standard curve, and was expressed as mg of ascorbic acid equivalents per gram (mg AAE/g) of freeze-dried sample weight.

2.3.5. Ferric Reducing Antioxidant Power (FRAP) Assay

The FRAP assay can indicate kiwifruit peel, pulp, and core extracts’ ability to reduce Fe3+ in the Fe3+-TPTZ complex (ferric-2,4,6-tripyridyl-s-Triazine) into Fe2+-TPTZ. A previous method from Chen et al. [44] was used as a reference for the FRAP assay of this study. The fresh FRAP dye was made using a mix of 300 mM sodium acetate solution, 10 mM TPTZ (2,4,6-tripyridyl-s-triazine, Sigma-Aldrich) solution, and 20 mM ferric chloride solution (Thermo Fisher) in a 10:1:1 (v/v/v) ratio. Then, a 20-μL aliquot of extract was added in triplicate into a 96-well plate together with 280 μL of previously prepared FRAP dye solution. After a 10 min incubation at 37 °C, the absorbance was measured at the 593-nm wavelength by spectrophotometer, and the standard curve of absorbance versus the weight of ascorbic acid (0–50 μg/mL) was plotted. The FRAP results were calculated based on the standard curve, and were expressed as mg of ascorbic acid equivalents per gram (mg AAE/g) of freeze-dried sample weight.

2.3.6. 2,2-Azino-bis-3ethylbenzothiazoline-6-sulfonic Acid (ABTS) Radical Scavenging Assay

The ABTS radical scavenging activity of kiwifruit peel, pulp, and core extracts referrs to the ABTS+ radical cation decolorization assay of Severo et al. [45]. In total, 5 mL ABTS solution (Sigma-Aldrich, 7 mmol/L) and 88 μL potassium persulfate solution (Sigma-Aldrich, 140 mM) were mixed and incubated in a dark place for 16 h in order to prepare the ABTS+ dye stock solution. Then, the prepared ABTS+ solution was diluted with the analytical grade ethanol to acquire an initial absorbance of 0.70 ± 0.02 at 734 nm. After that, a 10-μL aliquot of extract was added in triplicate into a 96-well plate together with 290 μL diluted ABTS solution, followed by a 6-min dark incubation at room temperature. The absorbance was measured at the 734 nm wavelength, and the standard curve of absorbance versus the weight of ascorbic acid (0–150 μg/mL) was plotted. The ABTS results were calculated based on the standard curve, and were expressed as mg of ascorbic acid equivalents per gram (mg AAE/g) of freeze-dried sample weight.

2.3.7. Reducing Power Assay (RPA)

The reducing power activity was determined by modifying the method of Ferreira et al. [46]. First, 10 μL extract, 25 μL 0.2 M sodium phosphate buffer (Thermo Fishers, pH 6.6) and 25 μL K3[Fe(CN)6] (Thermo Fisher) were added in triplicate sequentially, followed by incubation at 25 °C for 20 min. Then, 25 μL 10% TCA solution (Thermo Fisher) was added to stop the reaction, and an additional 85 μL water together with 8.5 μL FeCl3 was mingled in the reagent. After that, the solution required further incubation for 15 min at 25 °C. Then, the absorbance was measured at 750 nm. Ascorbic acid from 0 to 500 μg/mL was used to obtain a standard curve, and the data were presented as the mg AAE/g of freeze-dried sample weight.

2.3.8. Hydroxyl Radical Scavenging Activity (OH-RSA)

The Fenton-type reaction method of Smirnoff and Cumbes [47] was used to determine the OH-RSA, with some modifications. In total, 50 μL extract was mixed in triplicate with 6 mM FeSO4·7H2O and 6 mM H2O2 (Thermo Fisher, 30%) in the ratio of 1:1:1 (v/v/v), followed by incubation at 25 °C for 10 min. After incubation, 50 μL 6 mM 3-hydroxybenzoic acid (Thermo Fisher) was added, and absorbance was measured at a wavelength of 510 nm. Ascorbic acid from 0 to 300 μg/mL was used to obtain a standard curve, and the data were presented as mg AAE/g of the freeze-dried sample weight.

2.3.9. Ferrous Ion Chelating Activity (FICA)

The Fe2+ chelating activity of the sample was measured according to the method of Dinis et al. [48], with modifications. In total, 15 μL extract was mixed in triplicate with 85 μL water, 50 μL 2 mM ferrous chloride (Thermo Fisher, with an additional 1:15 dilution in water) and 50 μL 5 mM ferrozine (Thermo Fisher, with an additional 1:6 dilution in water), followed by incubation at 25 °C for 10 min. Then, the absorbance was measured at a wavelength of 562 nm. Ethylenediaminetetraacetic acid (EDTA, Thermo Fisher) in concentrations from 0 to 30 μg/mL was used to obtain a standard curve, and the data were presented as mg EDTA/g of the freeze-dried sample weight.

2.3.10. Total Antioxidant Capacity (TAC) Assay

The phosphomolybdate method with slight modifications from Subbiah et al. [49] was applied to assess the TAC of kiwifruit peel, pulp, and core extracts in this study. The phosphomolybdate dye was made by mixing 0.6 M H2SO4, 28 mM Na3PO4 and 4 mM ammonium molybdate in the ratio of 1:1:1. Then, a 40-μL aliquot of extract was added in triplicate into a 96-well plate together with 260 μL prepared phosphomolybdate reagent, followed by a 90-min incubation at 95 °C and a 10-min cooling at room temperature. The absorbance was measured at the 695-nm wavelength, and the standard curve of absorbance versus the weight of ascorbic acid (0–200 μg/mL) was plotted. The TAC results were calculated based on the standard curve, and were expressed as mg of ascorbic acid equivalents per gram (mg AAE/g) of the freeze-dried sample weight.

2.4. LC-ESI-QTOF-MS/MS Analysis

The phenolic profile characterization was conducted using an Agilent 6520 Accurate-Mass Q-TOF LC-MS/MS (Agilent Technologies, CA, USA), and the method was adapted from Zhong et al. [50]. A Synergi™ Hydro-RP 80 Å, LC reversus-phase column with a diameter of 250 × 4.6 mm inside and a particle diameter of 4 μm (Phenomenex, Torrance, CA, USA) was utilized for the compound separation. Mobile phase A was prepared with a mix of acetic acid/water (in the ratio of 0.5:99.5, v/v), and mobile phase B was made using a mix of acetonitrile/water/acetic acid (in the ratio of 50:49.5:0.5, v/v/v). Both mobile phases A and B were degassed at 25 °C for 15 min. Before they were transferred into the vials, all of the extracts were filtered using a syringe (Kinesis, Redland, QLD, Australia) coupled with a 0.45-μm syringe filter (Thermo Fisher Scientific Inc., Waltham, MA, USA). The injection volume of each sample was set to 6 μL, and the flow rate was set at 0.8 mL/min. The gradient elution was achieved by changing the ratio of mobile phases A and B as follows: 0 to 20 min with 10% phase B, 20 to 30 min with 25% phase B, 30 to 40 min with 35% phase B, 40 to 70 min with 40% phase B, 70 to 75 min with 55% phase B, 75 to 77 min with 80% phase B, 77 to 79 min with 100% phase B, 79 to 82 min with 100% phase B, and 82 to 85 min with isocratic 10% phase B. The mass spectrometry conditions were set as 45 psi atomizing gas pressure, 300 °C nitrogen gas with a flow rate of 5 L/min, and 250 °C sheath gas with the flow rate of 11 L/min. The capillary voltage was 3.5 kV, and the nozzle voltage was 500 V. The extrapolation of the peak area values obtained for the components of each juice analysed from the calibration curve of the standard for each phenolic group led to the measurement of the polyphenols. For the MS/MS peak identification and analyses, electrospray ionization (ESI) was utilized in the operation of both the negative and positive ion modes, and the mass spectra were obtained over the m/z range of 50–1300 amu in automatic mode with multiple collision energies (10, 15 and 30 eV) for fragmentation. The data collection and subsequent analysis used Agilent Mass Hunter Qualitative Software-B.03.01 (Agilent Technologies, Santa Clara, CA, USA). By comparing the retention times, ionization mode, and mass spectra of unknown peaks with those of real standards or with data from the literature, the primary phenolic components of the samples were identified.

2.5. Statistical Analysis

All of the results were reported as the mean ± standard deviation (SD). The mean differences between different samples were analyzed by one-way analysis of variance (ANOVA) and Tukey’s honestly significant differences (HSD) multiple rank test at p ≤ 0.05. ANOVA was carried out by Minitab for Windows 64 bit version 20.2 (Minitab, LLC, State College, PA, USA). Correlations between the polyphenol content and antioxidant activities were analyzed using Pearson’s correlation coefficient.

3. Results and Discussion

3.1. Phenolic Estimation (TPC, TFC and TTC)

Table 1 indicates the phenolic estimation measured as the TPC, TFC and TTC from kiwifruit cultivars and fruit parts.
The value of TPC was clearly higher in all of the kiwifruit cultivars’ peel than their pulp and core, and the content of tannins was too marginal to be detected in the kiwifruit pulp and cores. The peel of New Zealand organic “Hayward” had the largest TPC value, 9.65 ± 0.44 mg GAE/g dry weight (d.w.), followed by Australian ordinary “Hayward” (7.99 ± 0.10 mg GAE/g) and New Zealand “Zosy002” (6.61 ± 0.24 mg GAE/g). There were detectable differences between each type, which suggested that the plant growth conditions are contributors to fruit phenolic compounds. However, comparing our results with previous studies, the values fluctuated greatly. Korean Golden kiwifruits presented a 50.10 ± 2.90 mg GAE/g value in their peel parts, which was almost five-fold higher than our results [51]. This proved that the sample origin played a vital role in phenolic compound distribution. In addition, they used metaphosphoric acid as an extraction solvent, which required future single-factor experiments to evaluate whether it has a greater extraction efficiency than 80% ethanol. Meanwhile, a three-times-higher value (28.79 mg GAE/g) also proved the rules of environmental conditions, as shown in the peel of “Nongdamixiang (ND)”, a representative Actinidia genus of kiwifruit in Yangling, Shaanxi, China [27]. In general, the TPC value of “Zesy002” peel was more than 10 times larger than those of its pulp and core. Complete data were lacking regarding the remaining two species, due to the undetectable values in their pulps and cores. However, compared with the existing data, similar trends could be hypothesized. For Australian “Hayward”, the TPC of the peel was almost 18 times higher than its flesh; in organic “Hayward” the difference was even more significant, by more than 21 times.
Furthermore, the value in the core was slightly larger than that in the pulp. This was assumed to be a contribution from the edible black seeds, which was especially obvious in “Zesy002” cultivar and organic “Hayward”. In terms of the TPC variation driven by the organic environment from different kiwifruit cultivars’ pulp and cores, organic “Hayward” did not exhibit many advantages. It was speculated that the influence of the organic environment on plant crops is permeable, with greater effects on the outside than the inside. However, huge differences were found among several pieces of published research. An inconstant result was reported regarding Actinidia chinensis Planch. species: the TPC values of the peels were 53.73 mg GAE/g [52]. The discovery of higher values suggests the feasibility of optimizing the extraction method of kiwifruit phenolics. Meanwhile, this overturned the point that the genotype has little role in the phenolic compound content. To sum up, organic “Hayward” had a better performance in the peel TPC, while “Zesy002” flesh contained more TPC overall.
Flavonoids are known to be another typical phenolic possessing antioxidant activity. However, in our study, most of our TFC results were too low to be detected, particularly in all of the kiwifruit pulp and the “Hayward” core. Australian “Hayward” peel had the highest TFC level, with 0.42 ± 0.04 mg QE/g d.w., but the organic “Hayward” peel obtained no TFC. Generally, the total flavonoids of the peel samples should be higher than those in the pulps and cores, which was verified by the preceding study [27]. Even though they used a different equivalent, rutin, the trend was obvious. The TFC of the peels ranged from 4 mg RE/g to 14 mg RE/g among all of the selected kiwifruits. While the pulp samples showed virtually unchanged values of around 1 mg RE/g to 2 mg RE/g, the core samples varied from 2 mg RE/g to 9 mg RE/g. The main reason may lie in our extraction method; for example, the number of polyphenols extracted by enzymatic hydrolysis may contrast totally with the methanol extraction because of deglycosylation or the disruption of specific linkages in the phenolic compounds. Moreover, our extraction of phenols may neglect the bound flavonoid content.
Besides this, tannins could only be detected in the kiwifruit peels. There was no significant difference in the same kiwifruit cultivar under different growing conditions. “Zesy002” cultivar peel had a significant higher TTC, with 10.99 ± 0.12 mg CE/g, than both the conventional and organic “Hayward” cultivar (7.67 ± 0.34 mg CE/g and 7.00 ± 0.56 mg CE/g, respectively). Presumably, “Zesy002” was a new disease-resistant upgraded cultivar from “Hort16A” after suffering from Pseudomonas syringae pv. actinidiae (PSA) bacterium, and had a sourer flavor because the tannin compounds played an important role in its higher plant protection from insects’ predation, and were the main source of the fruit’s astringency. Overall, despite the cultivar diversity or the way the agricultural products were grown, in kiwifruit peel, abundant phenolic compounds can be found.

3.2. Antioxidant Activity (DPPH, FRAP, ABTS, FICA, OH-RSA, RPA, and TAC)

The continuous Table 1 lists the DPPH, FRAP, ABTS, FICA, OH-RSA, RPA, and TAC assays’ results, which included the different parts and various cultivars of kiwifruit. Each of these assays is based on different aspects of antioxidant activities, including radical/reactive oxygen (ROS) scavenging (DPPH, ABTS, FICA, OH-RSA) and non-radical redox potential abilities (FRAP, RPA and TAC). Depending on the mechanism of the chemical reactions involved, assays can be further categorized as (i) electron transfer (ET), (ii) hydrogen atom transfer (HAT) reaction-based assays, or (iii) the chelation of transition metals [53]. DPPH, ABTS, OH-RSA and TAC assays are based on the HAT/ET mixed-mode assays, while FRAP and RPA are ET assays. There is no absolute advantage for certain assays to conclude all of the antioxidant properties of all of the phenolic compounds. The more antioxidant activity assays we performed, the more comprehensive phenolic compounds we would consider.
In general, each of the kiwifruit cultivars’ peels revealed remarkably higher antioxidant activity than their pulp and core parts in the DPPH, FRAP, ABTS, FICA, OH-RSA and RPA assays. Separately, “Zesy002” kiwifruit peel had the highest DPPH scavenging capacity (12.33 ± 1.18 mg GAE/g), which was followed by its core (1.04 ± 0.06 mg GAE/g) and pulp (0.25 ± 0.01 mg GAE/g). A similar trend was also reported: the DPPH radical inhibition of kiwifruit accounted for 95.16%, which took the dominant status [27]. However, they found the pulp’s value was higher than the core’s, which was inconstant with our results. That was probably based on the cultivars’ maturity and collection conditions. In relation to a species comparison of peel samples, “Zesy002” still showed the highest antioxidant properties; the following were Australian “Hayward” (7.88 ± 0.11 mg GAE/g) and New Zealand “Hayward” (6.69 ± 0.09 mg GAE/g). Except for the peel, the DPPH scavenging ability was extremely low in the other two parts, ranging from 0.08 ± 0.01 mg GAE/g to 0.31 ± 0.01 mg GAE/g. Additionally, in the FRAP assay, Australian “Hayward” peel extract showed a significantly higher FRAP value compared to “Zesy002” peel, at 3.12 ± 0.11 mg GAE/g and 2.64 ± 0.03 mg GAE/g, respectively. Regarding the ABTS assay, no obvious difference was obtained among most of the groups (NZa & AHa, AHb & OHb). Organic “Hayward” peel did not emerge with significantly stronger antioxidant activity in any of the three DPPH, FRAP and ABTS assays, as expected. However, organic peel was the only peel sample for which we could obtain the TAC result, with 4.43 ± 0.11 mg AAE/g. The phosphomolybdate assay for TAC was originally used to quantify the vitamin E in seeds, and is quite sensitive to lipophilic plant extracts, which did not show good DPPH activity. As such, the peel from organic “Hayward” may contain more fat-soluble bioactive compounds, such as carotenoids and α-tocopherol. Furthermore, the core parts from different cultivars with black seeds all had a more pronounced TAC than their corresponding pulp part. Both the “Zesy002” pulp and core present good performance in TAC, which may be correlated with their high content of carotenoids.
The reaction media for the DPPH assay in our research was methanol, whilst the ABTS assay was carried out in ethanol plus methanol conditions. The molecular polarity of methanol is greater than that of ethanol, such that the polar components in the methanol extract of plants should be greater than that of the ethanol extract. The phenol extraction efficiency of ABTS under ethanol plus methanol conditions was increased considerably for “Hayward” peels and all of the kiwifruit pulp samples at least two times. However, the values of ABTS analyzed with DPPH for all of the kiwifruit cores except the organic one, the antioxidant expression was not noticeable, leading us to suspect that the deviation was mainly due to certain bioactive compounds in the kiwifruit seeds. Most of the polyphenols in the seeds may fall into bound polyphenols, which may not be soluble in reaction media and cannot express their radical scavenging activities. Further improvements in kiwifruit core phenol extraction are dry degreasing and then selecting the appropriate extraction solvents or hydrolyzing the residue properly and then releasing the bound polyphenols. Theoretically, FRAP should be the most effective method to appraise much of the antioxidant power showing in the sample extracts, but ABTS reflected more exactly the general antioxidant activity in the kiwifruit samples. A speculation on why the TAC values of “Zesy002” and “Hayward” peel were too low to be detected is that the phosphomolybdate assay was conducted in aqueous conditions, where the phenolic compounds’ extraction is not sufficient for these two peel samples. Under such circumstances, organic products appeared to have a strong advantage in oxidation resistance in general over conventional produce.
In the FRAP assay, “Zesy002” pulp had an obviously higher antioxidant level than its core, with 0.32 ± 0.01 mg AAE/g wet weight (w.w.) for pulp and 0.04 ± 0.00 mg AAE/g for the core. In the ABTS assay, Australian “Hayward” had a similar low antioxidant level in both its core and pulp, with 0.21 ± 0.02 mg AAE/g and 0.15 ± 0.00 mg AAE/g. Meanwhile the organic “Hayward” core (0.32 ± 0.02 mg AAE/g) showed a two-times-larger value than the non-organic “Hayward” core in the ABTS assay, along with a more excellent antioxidant performance in all of the sample parts, in contrast to the ordinary “Hayward” samples. FICA was considered in this study for the measurement of the heavy and transition metal free radical elimination of the samples. However, only in the organic peel did we detect metal chelating ability, which suggested the limitation of this assay, which was a poor correlation with the FRAP, ABTS, and DPPH assays. Hydroxyl radicals are extremely reactive oxygen species that can react with every possible molecule in living organisms, especially with proteins, DNA, and lipids [54]. Hydroxyl radicals are capable of the rapid initiation of the lipid peroxidation process by extracting hydrogen atoms from unsaturated fatty acids [55]. In our study, the OH-RSA results showed that the ethanolic extracts of organic “Hayward” pulp did not have the scavenging ability of OH-free radicals. The highest activity was noted for the “Zesy002” peel extract (0.37 ± 0.04 mg AAE/g), followed by organic “Hayward” peel (0.21 ± 0.07 mg AAE/g) and “Zesy002” cores (0.12 ± 0.09 mg AAE/g). There is no significant difference between the pulp OH- free radical scavenging ability of “Zesy002” and Australian “Hayward” cultivars, with 0.04 ± 0.01 mg AAE/g and 0.05 ± 0.03 mg AAE/g, respectively. For the RPA results, the peel of all of the kiwifruit cultivars dominated at a higher level than the core parts, followed by the pulps, which was the same tendency as the OH-RSA results.
Overall, most of the kiwifruit peels had a much more powerful antioxidant activity than the same cultivar’s core, followed by its pulp. Generally, in the DPPH, ABTS, FICA and OH-RSA assays, “Zesy002” kiwifruit cultivar’s peel, pulp and core had the strongest antioxidant activity compared to the other two kiwifruit samples. In the FRAP assay, Australian “Hayward” peel and cores showed the higher antioxidant capacity compared with other cultivars’ corresponding parts. However, for the kiwifruit pulp FRAP assay, the “Zesy002” pulp sample still dominated with the largest value. On the other hand, in the pulp RPA results, Australian “Hayward” had a significantly high level. Kiwifruit cores had a stronger antioxidant activity than the pulps in the DPPH, ABTS, OH-RSA, RPA and TAC assays. Meanwhile, in the FRAP and FICA assays, the kiwifruit pulps had an overall stronger antioxidant activity than the cores.

3.3. LC-ESI-QTOF-MS/MS Characterization

In this study, a qualitative analysis of the phenolic compounds from date seed and date pulp extracts was conducted using LC-ESIQTOF-MS/MS in the negative and positive ionization modes. A total of 107 different phenolic compounds were identified in all of the kiwifruit samples, which included 30 phenolic acids, 57 flavonoids, and 20 other polyphenols, as shown in Table 2.

3.3.1. Phenolic Acids

Most of the phenolic acid compound ionization in this study was presented in a negative mode because the ESI mode is more sensitive for phenolic acid characterization [56]. Suleria, Barrow and Dunshea [38] described in their research that the hydrogen atom donation ability provides phenolic acid radical scavenging activity, which means these compounds can be natural antioxidants. In this study, a total of 30 phenolic acids were identified, including eight hydroxybenzoic acids, 18 hydroxycinnamic acids, two hydroxyphenylacetic acids, and two hydroxyphenylpentanoic acids.
  • Hydroxybenzoic acids
Compound 1 was tentatively identified as gallic acid in this test in sample OHL and AHL at m/z 169.0148. As Peng et al. [57] mentioned in their studies, this compound was also found in mango peel byproducts. Furthermore, Yang et al. [58] reported the existence of this compound in ginger extracts. Furthermore, 2,3-dihydroxybenzoic acid (Compound 2), was tentatively identified in samples AHL and OHL, showing product ions at m/z 109. In the MS/MS fragmentation, the peaks at m/z 109, representing the loss of CO2 (44 Da), were observed from precursor ions in 2,3-dihydroxybenzoic acid [59]. As Abu-Reidah et al. [60] mentioned, ingredients with high hydroxybenzoic acid content have a high potential in medical and industrial areas due to their naturally versatile antioxidant ability. Many hydroxybenzoic acid types were found in AH and OH peel samples which showed the potential to recover phenolic compounds from these fruit wastes. However, the content of these compounds has not been quantified, which could be further analyzed by quantifying methods like HPLC in the future.
  • Hydroxycinnamic acids
A total of 18 hydroxycinnamic acids were found which is the largest among all four subgroups of phenolic acids identified in the kiwifruit samples.
Ferulic acid (Compound 18) was found in samples AHL, OHC, and OHP. This compound showed m/z at 193.0505, and was further confirmed by the product ions at m/z 178, which represented the loss of SO3 (95 Da) [61]. According to the study performed by Mukherjee and Chakraborty [62], ferulic acid is a kind of phenolic acid that widely appears in daily foods like rice, oats, and coffee. Compound 22 was found in samples OHL, OHC, and NZP, and was tentatively identified as caffeic acid with observed [M−H] m/z at 179.0349. This compound was further confirmed by the product ions at m/z 143 and m/z 133, representing the loss of 2H2O and HCOOH [49]. Previous studies have shown that caffeic and ferulic acids were detected in palm, garlic and cherry [37,63]. In this analysis, a total of nine hydroxycinnamic acids were found in both AH and OH, showing the similarities of the phenolic compound composition between Australian- and New Zealand-grown Haward kiwifruit. However, there are unique hydroxycinnamic acids like 1,5-Dicaffeoylquinic acid (Compound 9) which were only found in OH samples, including OHL, OHP, and OHC, 1-Sinapoyl-2,2′-diferuloylgentiobiose (Compound 21), and Ferulic acid 4-O-glucoside (Compound 25) only existed in AHL. This phenomenon showed that similar fruit wastes from the same cultivars might contain a lot of similar phenolic compounds, but due to the growing environment, unique compounds may also exist.

3.3.2. Flavonoids

In this study, a total of 57 flavonoids were identified as the largest phenolic compound group. The flavonoids identified in this study include nine flavanols, seven flavones, six flavanones, 12 flavonols, three dihydrochalcones, two dihydroflavonols, six anthocyanins, and 12 isoflavonoids.
  • Dihydrochalcones, Dihydroflavonols, and Anthocyanins
In the present work, a total of three dihydrochalcones, two dihydroflavonols, and six anthocyanins were found in the kiwifruit samples. Compound 66 was tentatively identified as 3-Hydroxyphloretin 2′-O-glucoside, which was found in samples AHL, OHL, NZC, NZL, and OHC, showing m/z at 451.1249. Previously, 3-Hydroxyphloretin 2′-O-glucoside was also found in other fruit peels, according to research performed by Suleria, Barrow and Dunshea [38]. Cyanidin 3-O-(6″-p-coumaroyl-glucoside) (Compound 70) was identified in samples NZL, AHP, OHL, AHL, and AHC with [M+H]+ at m/z 596.1523. Previously, this compound was detected in Camellia oleifera Abel [64].
  • Flavanols, Flavones, and Flavaones
A total of nine flavanols, seven flavones, and six flavaones were detected in the kiwifruit samples in this study. For flavanols, Compound 34 was tentatively identified as 4′-O-Methyl-(-)-epigallocatechin 7-O-glucuronide, with m/z at 495.1163 being further confirmed by product ions at m/z 451 and m/z 313. This compound was only detected in the AHL sample. Procyanidin dimer B1 (m/z 577.1338) and procyanidin trimer C1 (m/z 865.2002) were both detected in samples AHL, OHL, and NZL, but procyanidin trimer C1 was also found in the OHC sample, which was a core sample. A high amount of these three types of flavonoids was distributed mainly in peel samples, and AHL had the highest number of unique flavonoids, which included 4′-O-Methyl-(-)-epigallocatechin 7-O-glucuronide (Compound 36), Apigenin 6,8-di-C-glucoside (Compound 42), Cirsilineol (Compound 43), Hesperetin 3′,7-O-diglucuronide (Compound 50), and Hesperetin 3′-O-glucuronide (Compound 52), but these compounds were not reported in kiwifruits in previous studies.
  • Flavonols
Flavonol was one of the largest groups of flavonoids detected in this test. A total of 12 flavonols were detected. Compounds 59, 63 and 64, which had precursor ions at m/z 609.1477, 581.1503, and 739.2072, were tentatively characterized as kaempferol 3,7-O-diglucoside, kaempferol 3-O-xylosyl-galactoside, and kaempferol 3-O-(2″-rhamnosyl-galactoside) 7-O-rhamnoside. What these three kaempferol derivatives have in common is that they all appeared in kiwifruit peel samples, though only kaempferol 3,7-O-diglucoside was also detected in the OHC sample. NZ samples had the richest types of flavonols, followed by OH samples, and a total of three unique ones were found in NZL. Most of the flavonols were found in peel samples, and only limited numbers of them were found in kiwifruit pulp and cores, which proves the potential of developing kiwifruit waste as a source of antioxidants.
  • Isoflavonoids
Isoflavonoid was also the largest group of flavonoids, with a total of 12 compounds detected in this test. Compound 77 was tentatively identified as violanone, which was detected in samples OHL, AHC, OHC, and NZL, as confirmed by the product ions of m/z 300, m/z 285 and m/z 135, representing the loss of CH3 (15 Da), 2CH3, (30 Da), and C10H12O3 [65]. Furthermore, 3′-Hydroxygenistein (Compound 85) was only found in sample OHC at m/z 287.0548. In the MS/MS fragmentation, peaks at m/z 269 and m/z 259, representing the loss of H2O and CO, were observed from precursor ions [66]. The distribution of isoflavonoids was still mainly in the fruit peels. As flavonols, 6″-O-Malonyldaidzin (Compound 82), 6″-O-Acetylglycitin (Compound 83), and 3′-Hydroxydaidzein were the three unique isoflavonoids found in NZL. However, there was one isoflavonoid which was only found in OHC, namely 3′-Hydroxygenistein (Compound 85), and one which was only found in AHP, which was 2′-Hydroxyformononetin (Compound 86).

3.3.3. Lignans, Stilbenes and Other Polyphenols

A total of eight lignans, one stilbene, and 11 other polyphenols were detected in the kiwifruit samples. Lignans, stilbenes and other polyphenols were not the main phenolics but were widely distributed in the kiwifruit pulp, seeds and cores, and they also contribute to the antioxidant capacity. Isopimpinellin (Compound 94) was the only furanocoumarin detected in kiwifruit at m/z 247.0607 which existed in sample NZL and OHL according to the [M+H]+ m/z at 247.0611. In the MS/MS fragmentation, the product ions at m/z 232, m/z 217, m/z 205 and m/z 203 represent the loss of CH3 (15 Da), 2CH3 (30 Da), CH2 (42 Da) and CO2 (44 Da) [67]. Compound 101 with [M+H]+ at m/z 433.2221 was tentatively assigned as schisandrin in sample NZP. Compound 106 with [M+H]+ at m/z 537.2115 was tentatively assigned as schisantherin A in sample NZL.

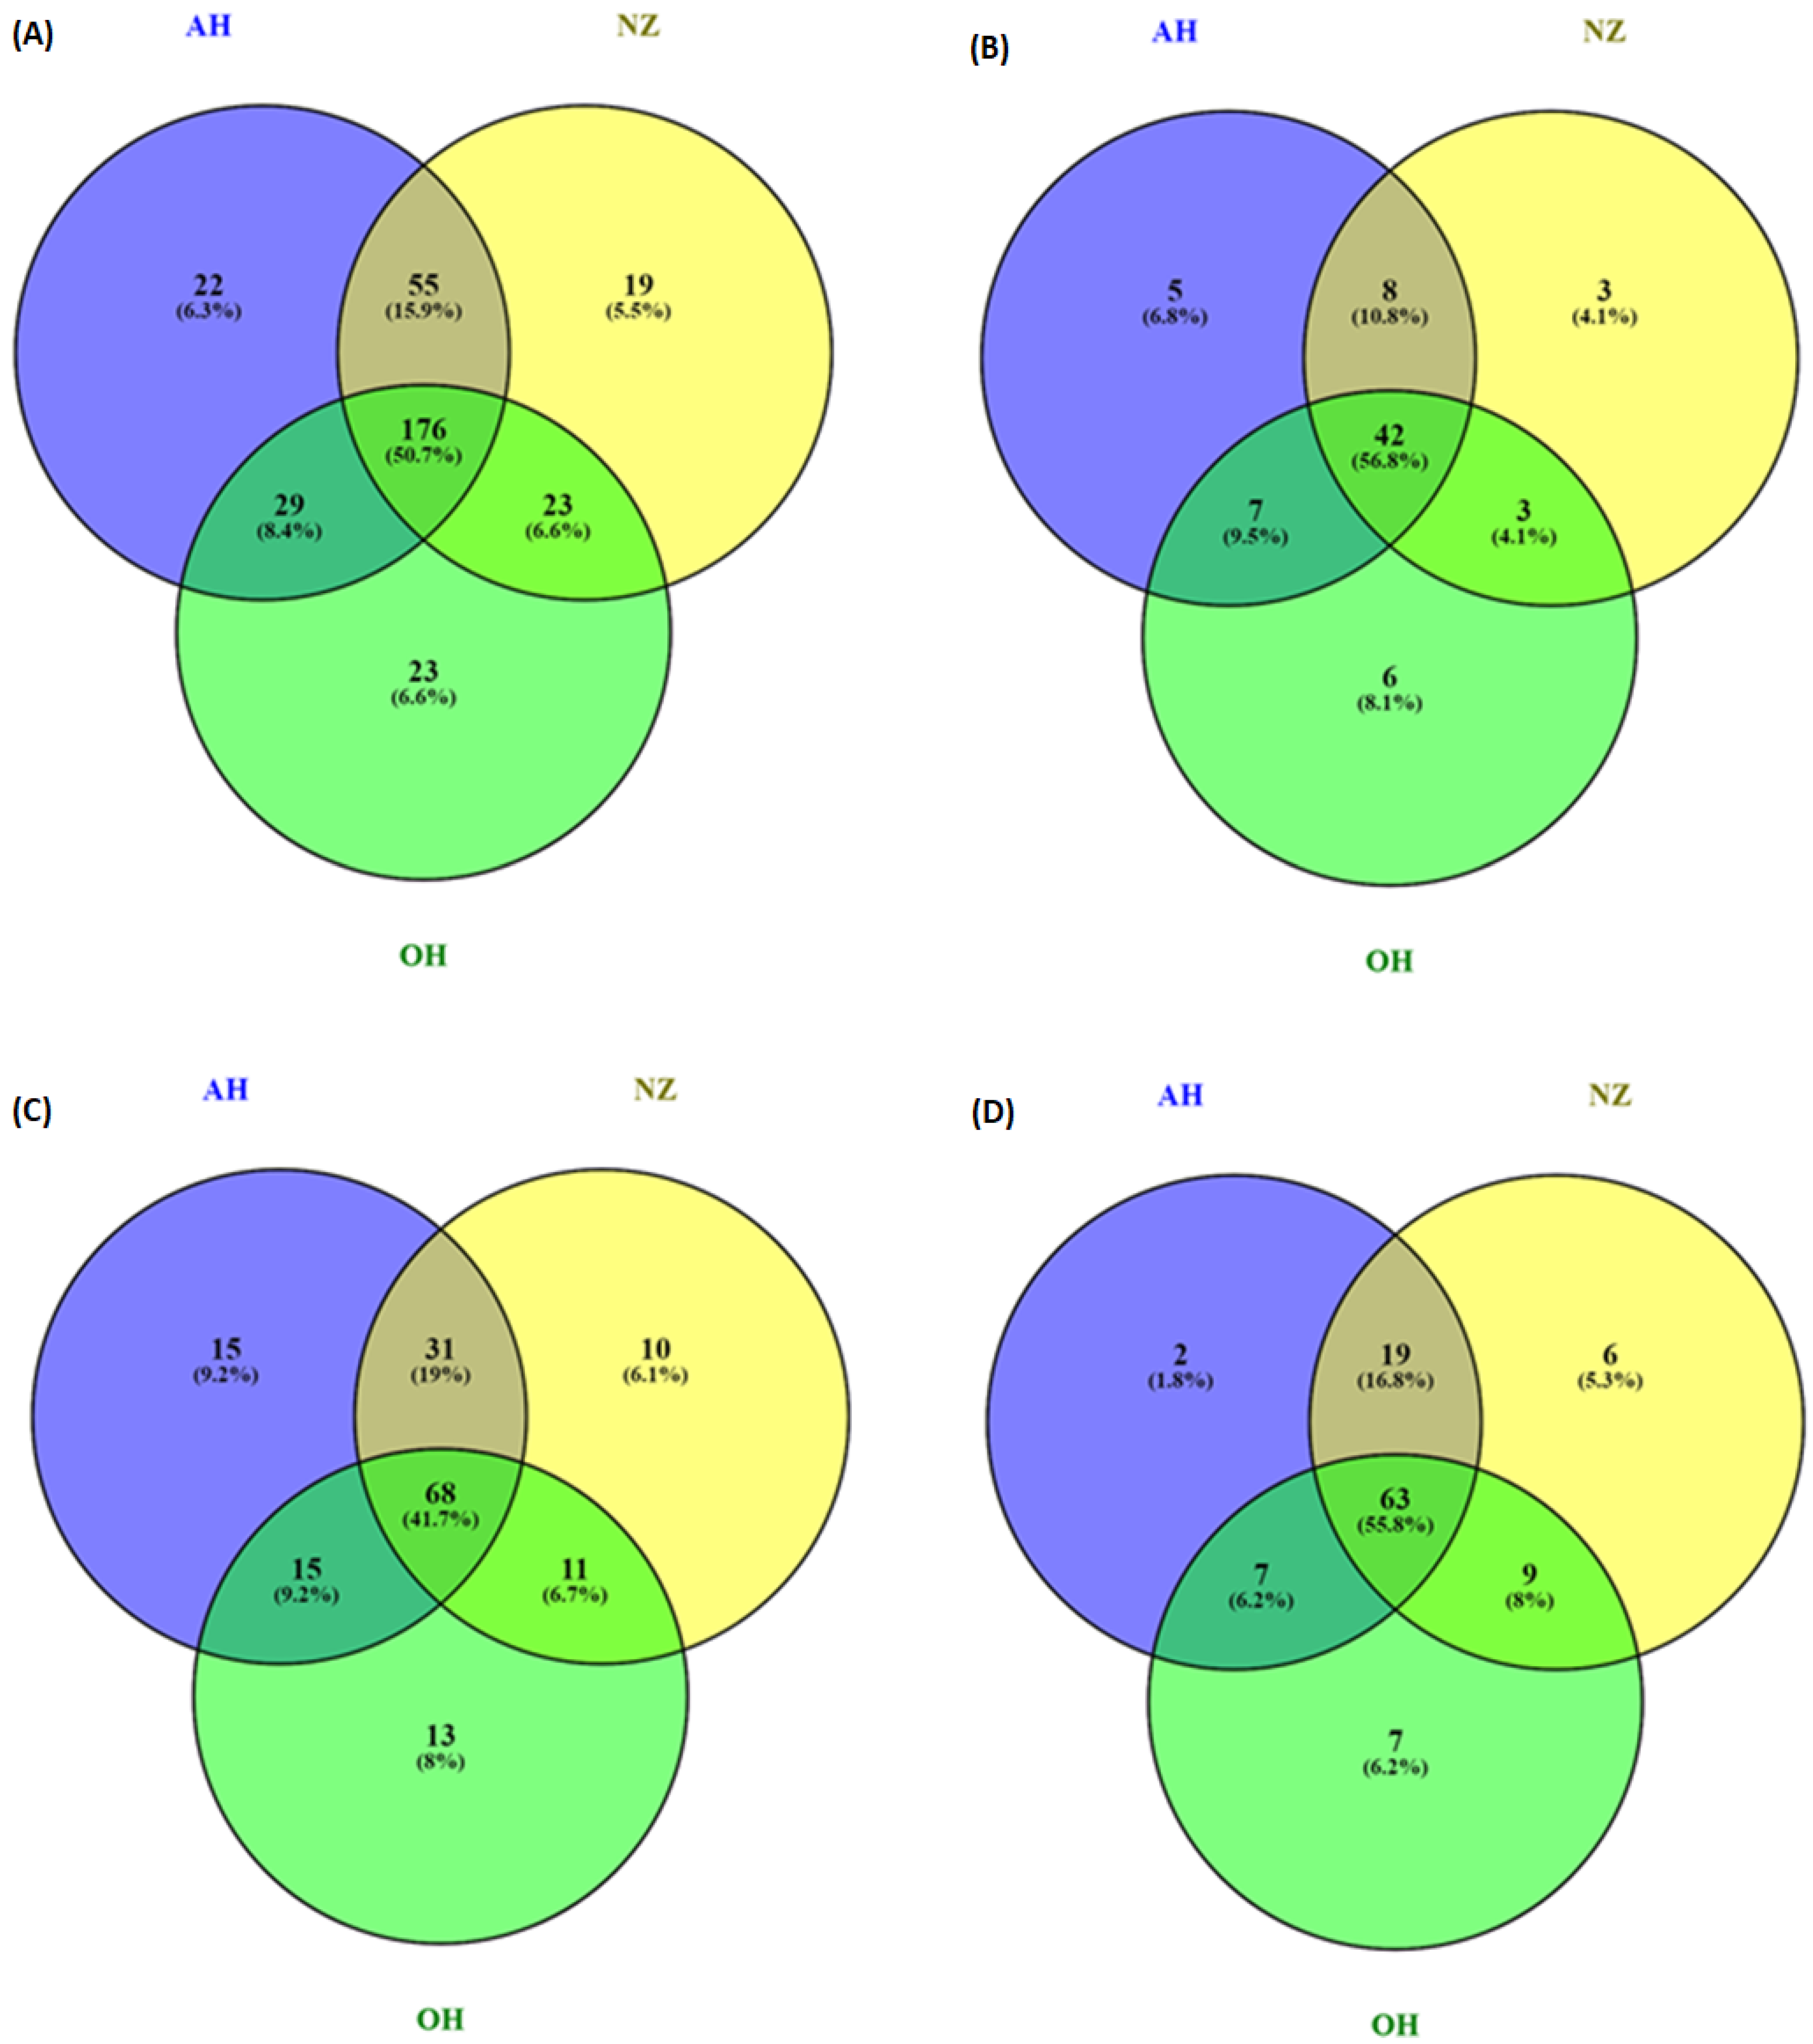
3.4. Distribution of Phenolic Compounds—Venn Diagram

Various polyphenols that exist in kiwifruit samples have conjugated structures in their forms, and there are differences in their distribution in different cultivars and their fruit parts. Therefore, analyzing these contents’ species variability in different kiwifruit samples at the same time would be a complex task. Venn diagrams (Figure 1 and Figure 2) were applied in this study to offer a synopsis of different phenolic compounds’ distributions, which were labeled with different colors in kiwifruit AH, NZ, and OH, and in the kiwifruit pulp, core, and peel.
As the Venn diagram (Figure 1A) shows, OH contained 23 unique compounds, which account for 6.6% of the total phenolic compounds. Meanwhile, the kiwifruits AH and NZ contain 22 (6.3%) and 19 (5.5%), respectively. The maximum value of overlapping total phenolic compounds was 176 (50.7%) distributed in all of the kiwifruit cultivars. The minimum value of overlapping total phenols was 23 (6.6%), which was present in kiwifruit NZ and OH. A total of 55 (15.9%) shared phenolics were found in AH and NZ, showing the high similarity in contained phenolic types. The phenolic acid distribution is shown in Figure 1B; the highest value of unique phenolic acids was contained by OH, which was 6 (8.1%). The maximum value of overlapping total phenolic acids was 42 (56.8%), distributed in all of the kiwifruit cultivars. For flavonoids, AH contained the maximum value of unique flavonoids, which was 15 (9.2%), and the maximum value of overlapping total flavonoids was 68 (41.7%), which was distributed in all of the kiwifruit cultivars. In Figure 1D, OH contained seven (6.2%) other unique polyphenols, which was the highest value. The maximum value of other overlapping total polyphenols was 63 (55.8%), which was distributed in all of the kiwifruit cultivars.
As shown in Figure 2A, kiwifruit peel had the highest value of unique phenolic compounds, which was 118 (34%) of the total phenolic compounds found in kiwifruit samples. The minimum value of total unique phenolic compounds was 3 (0.9%), which was presented in kiwifruit pulp. The maximum value of overlapping total phenolic compounds was 120 (34.6%), which was distributed in kiwifruit pulp, core and peel, followed by 60 (17.3%) in the core and peel. A similar situation also appeared in the phenolic acid distribution among all of the fruit parts in Figure 2B. The highest value of unique total phenolic acids was found in kiwifruit peel, which was 19 (25.7%), and the maximum value of overlapping total phenolic acids was 31 (41.9%) in all of the kiwifruit parts. For flavonoids, kiwifruit peel contained 76 (46.6%) unique flavonoids, while kiwifruit pulp contained no unique flavonoids, and the kiwifruit cores contained two (1.2%) unique flavonoids. The highest value of overlapping total flavonoids was 40 (24.5%), distributed in all of the fruit parts, while the second highest overlapping total flavonoid value was 32 (19.6%), distributed in kiwifruit core and peel. The highest level of unique other polyphenols in fruit parts was found in kiwifruit peel, which was 24 (21.2%). The maximum overlapping other total polyphenol value was 49 (43.4%), distributed in the kiwifruit pulp, core and peel. This was followed by 20 (17.7%), distributed in the kiwifruit core and peel.
As a result, the overlapping phenolics of all three cultivars had a high value, showing the rich phenolic types contained in kiwifruit. The distribution of the phenolic compounds in different fruit parts also indicated that most types of the phenolic compounds were stored in the kiwifruit peel, proving that kiwifruit waste can be a good source of phenolic compounds.

3.5. Correlation between the Antioxidant Assays and Phenolic Content

A correlation between the phenolic content and antioxidant activity assays was performed with Pearson’s correlation test (Table 3), and a principal components analysis (PCA, Figure 3) was also performed simultaneously.
A total of 100% of the variability of the initial data can be explained by the first two factors (F1 and F2) in Figure 3. Regarding antioxidant assays, TAC and FRAP, RPA and ABTS were strongly related to each other, with a significance level smaller than 0.05. For the phenolic contents, TPC was mostly negatively related to the antioxidant assays that appeared in this test, including DPPH, FRAP, ABTS, FICA, OH-RSA, and RPA (r = −0.904, −0.885, −1.000, −0.948, −0.769, and –0.998, respectively). This phenomenon was opposite to the previous report, because Talukder, Talapatra, Ghoshal and Sen Raychaudhuri [23] reported that the antioxidant capacity should be positively related to the phenolic compound content. A possible explanation might be that the antioxidant capacity of kiwifruit was not provided by phenolics.
TTC had a relatively strong correlation with most of the antioxidant assays except FRAP and TAC (r = 0.291, −0.217, respectively), which suggested that tannins are strongly related to the antioxidant activity of the kiwifruit samples. Strong correlations were also observed between TFC with FRAP (r = 0.911), which indicated that flavonoids also significantly contribute to the metal ion reduction and antioxidant activities. However, the correlation between TFC with most of the antioxidant assays was not significant, indicating that flavonoids contribute less to the antioxidant potential of kiwifruit samples. In conclusion, kiwifruit’s antioxidant activity was mainly provided by the contained tannins and flavonoids, while the total phenolic content seemed to be negatively related to most of the values of the antioxidant assays.

4. Conclusions

In conclusion, we found a richer variety of phenolic compounds in all three cultivars of kiwifruit peel, which makes the recovery of phenolic compounds from kiwifruit waste worthwhile. The results of the antioxidant assays also indicated that kiwifruit peel, compared with kiwifruit pulp and cores, has a very high in vitro antioxidant potential. The highest TPC value was found in OHL, which was 9.65 mg GAE/g, which was significantly higher than the TPC value of OHP and OHC (0.33 mg GAE/g and 0.44 mg GAE/g, respectively). The phenolic compounds were characterized through LC-ESI-QTOF-MS/MS in different kiwifruit extracts, and a total of 107 phenolic compounds was found in this test. A wide variety of phenolic compounds were characterized in kiwifruit peel. From the Venn graphs, we found that the differences in unique phenolic numbers among cultivars were not so big, but a total of 55 (15.9%) overlapping phenolics were found in AH and NZ, showing a high similarity of the phenolic types they contained. A total of 118 (34%) unique phenolic compounds, including 19 (25.7%) unique phenolic acids, 76 (46.6%) unique flavonoids and 24 (21.2%) other unique polyphenols were found in kiwifruit peel, all with higher values in core and pulp. Due to the rich types and content of phenolic compounds, kiwifruit wastes have the potential to be a food processing agent and nutritional supplement. The source of the antioxidant capacity of kiwifruit seemed to mainly be provided by tannins and flavonoids. However, in Pearson’s correlation table, most of the assays’ values were negatively related to the total phenolic compounds, which was contrary to previous reports, which is worth further study. In the following research, modified phenolic content estimations could be performed in order to evaluate the relationship between phenolic compounds and the antioxidant capacity, in vitro digestibility and bioavailability, in order to further test the values of the kiwifruit waste.

Author Contributions

Conceptualization, methodology, formal analysis, validation and investigation, Z.L., L.S., Y.Q. and H.A.R.S.; resources, H.A.R.S.; writing—original draft preparation, Z.L. and H.A.R.S.; writing—review and editing, Z.L., L.S., Y.Q. and H.A.R.S.; supervision, H.A.R.S., C.J.B. and F.R.D.; idea sharing, H.A.R.S.; funding acquisition, H.A.R.S. All authors have read and agreed to the published version of the manuscript.

Funding

Hafiz Suleria is the recipient of an “Australian Research Council-Discovery Early Career Award” (ARC-DECRA-DE220100055) funded by the Australian Government. This research was funded by the University of Melbourne under the “McKenzie Fellowship Scheme” (Grant No. UoM-18/21), the “Future Food Hallmark Research Initiative Funds” (Grant No. UoM-21/23) and the “Collaborative Research Development Grant” (Grant No. UoM-21/23) funded by the Faculty of Veterinary and Agricultural Sciences, the University of Melbourne, Australia.

Institutional Review Board Statement

Not applicable.

Informed Consent Statement

Not applicable.

Acknowledgments

We would like to thank Nicholas Williamson, Shuai Nie and Michael Leeming from the Mass Spectrometry and Proteomics Facility, Bio21 Molecular Science and Biotechnology Institute, the University of Melbourne, VIC, Australia for providing access and support for the use of the HPLC-PDA, LC-ESI-QTOF-MS/MS and data analysis. We would like to thank “The Future Food Hallmark Research Initiative” at the University of Melbourne, Australia. We would like to thank the researchers of the Hafiz Suleria group from the School of Agriculture and Food, Faculty of Veterinary and Agricultural Sciences, the University of Melbourne for their incredible support.

Conflicts of Interest

The authors declare no conflict of interest.

References

  1. Sanz, V.; López-Hortas, L.; Torres, M.; Domínguez, H. Trends in kiwifruit and byproducts valorization. Trends Food Sci. Technol. 2021, 107, 401–414. [Google Scholar] [CrossRef]
  2. Ferguson, A.R. Kiwifruit: The wild and the cultivated plants. Adv. Food Nutr. Res. 2013, 68, 15–32. [Google Scholar] [PubMed]
  3. Vissers, M.C.; Carr, A.C.; Pullar, J.M.; Bozonet, S.M. The bioavailability of vitamin C from kiwifruit. Adv. Food Nutr. Res. 2013, 68, 125–147. [Google Scholar] [PubMed]
  4. Sivakumaran, S.; Huffman, L.; Sivakumaran, S.; Drummond, L. The nutritional composition of Zespri® SunGold Kiwifruit and Zespri® Sweet Green Kiwifruit. Food Chem. 2018, 238, 195–202. [Google Scholar] [CrossRef]
  5. Tyagi, S.; Nanher, A.; Sahay, S.; Kumar, V.; Bhamini, K.; Nishad, S.; Ahmad, M. Kiwifruit: Health benefits and medicinal importance. Rashtriya Krishi 2015, 10, 98–100. [Google Scholar]
  6. Chamorro, F.; Carpena, M.; Fraga-Corral, M.; Echave, J.; Riaz Rajoka, M.S.; Barba, F.J.; Cao, H.; Xiao, J.; Prieto, M.A.; Simal-Gandara, J. Valorization of kiwi agricultural waste and industry by-products by recovering bioactive compounds and applications as food additives: A circular economy model. Food Chem. 2022, 370, 131315. [Google Scholar] [CrossRef]
  7. Richardson, D.P.; Ansell, J.; Drummond, L.N. The nutritional and health attributes of kiwifruit: A review. Eur. J. Nutr. 2018, 57, 2659–2676. [Google Scholar] [CrossRef]
  8. Leontowicz, H.; Leontowicz, M.; Latocha, P.; Jesion, I.; Park, Y.-S.; Katrich, E.; Barasch, D.; Nemirovski, A.; Gorinstein, S. Bioactivity and nutritional properties of hardy kiwi fruit Actinidia arguta in comparison with Actinidia deliciosa ‘Hayward’and Actinidia eriantha ‘Bidan’. Food Chem. 2016, 196, 281–291. [Google Scholar] [CrossRef]
  9. Drummond, L.; Gearry, R.B. Kiwifruit modulation of gastrointestinal motility. Adv. Food Nutr. Res. 2013, 68, 219–232. [Google Scholar]
  10. Carr, A.C.; Bozonet, S.M.; Pullar, J.M.; Vissers, M.C. Mood improvement in young adult males following supplementation with gold kiwifruit, a high-vitamin C food. J. Nutr. Sci. 2013, 2, e24. [Google Scholar] [CrossRef]
  11. Lin, H.-H.; Tsai, P.-S.; Fang, S.-C.; Liu, J.-F. Effect of kiwifruit consumption on sleep quality in adults with sleep problems. Asia Pac. J. Clin. Nutr. 2011, 20, 169–174. [Google Scholar] [PubMed]
  12. Skinner, M.A.; Bentley-Hewitt, K.; Rosendale, D.; Naoko, S.; Pernthaner, A. Effects of kiwifruit on innate and adaptive immunity and symptoms of upper respiratory tract infections. Adv. Food Nutr. Res. 2013, 68, 301–320. [Google Scholar] [PubMed]
  13. Beck, K.; Conlon, C.A.; Kruger, R.; Coad, J.; Stonehouse, W. Gold kiwifruit consumed with an iron-fortified breakfast cereal meal improves iron status in women with low iron stores: A 16-week randomised controlled trial. Br. J. Nutr. 2011, 105, 101–109. [Google Scholar] [CrossRef] [PubMed]
  14. Baranowska-Wójcik, E.; Szwajgier, D. Characteristics and pro-health properties of mini kiwi (Actinidia arguta). Hortic. Environ. Biotechnol. 2019, 60, 217–225. [Google Scholar] [CrossRef]
  15. Pratt, H.K.; Reid, M.S. Chinese gooseberry: Seasonal patterns in fruit growth and maturation, ripening, respiration and the role of ethylene. J. Sci. Food Agric. 1974, 25, 747–757. [Google Scholar] [CrossRef]
  16. Wang, J.; Vanga, S.K.; Raghavan, V. High-intensity ultrasound processing of kiwifruit juice: Effects on the ascorbic acid, total phenolics, flavonoids and antioxidant capacity. LWT 2019, 107, 299–307. [Google Scholar] [CrossRef]
  17. Wang, Z.; Feng, Y.; Yang, N.; Jiang, T.; Xu, H.; Lei, H. Fermentation of kiwifruit juice from two cultivars by probiotic bacteria: Bioactive phenolics, antioxidant activities and flavor volatiles. Food Chem. 2021, 373, 131455. [Google Scholar] [CrossRef]
  18. Guroo, I.; Wani, S.; Wani, S.; Ahmad, M.; Mir, S.; Masoodi, F. A review of production and processing of kiwifruit. J. Food Processing Technol. 2017, 8, 10. [Google Scholar]
  19. Mirabella, N.; Castellani, V.; Sala, S. Current options for the valorization of food manufacturing waste: A review. J. Clean. Prod. 2014, 65, 28–41. [Google Scholar] [CrossRef]
  20. Schieber, A.; Stintzing, F.C.; Carle, R. By-products of plant food processing as a source of functional compounds—Recent developments. Trends Food Sci. Technol. 2001, 12, 401–413. [Google Scholar] [CrossRef]
  21. Santana-Méridas, O.; González-Coloma, A.; Sánchez-Vioque, R. Agricultural residues as a source of bioactive natural products. Phytochem. Rev. 2012, 11, 447–466. [Google Scholar] [CrossRef]
  22. Latocha, P.; Krupa, T.; Wołosiak, R.; Worobiej, E.; Wilczak, J. Antioxidant activity and chemical difference in fruit of different Actinidia sp. Int. J. Food Sci. Nutr. 2010, 61, 381–394. [Google Scholar] [CrossRef] [PubMed]
  23. Talukder, P.; Talapatra, S.; Ghoshal, N.; Sen Raychaudhuri, S. Antioxidant activity and high-performance liquid chromatographic analysis of phenolic compounds during in vitro callus culture of Plantago ovata Forsk. and effect of exogenous additives on accumulation of phenolic compounds. J. Sci. Food Agric. 2016, 96, 232–244. [Google Scholar] [CrossRef] [PubMed]
  24. Soquetta, M.B.; Stefanello, F.S.; da Mota Huerta, K.; Monteiro, S.S.; da Rosa, C.S.; Terra, N.N. Characterization of physiochemical and microbiological properties, and bioactive compounds, of flour made from the skin and bagasse of kiwi fruit (Actinidia deliciosa). Food Chem. 2016, 199, 471–478. [Google Scholar] [CrossRef]
  25. Li, W.; Sun, Y.N.; Yan, X.T.; Yang, S.Y.; Kim, S.; Chae, D.; Hyun, J.W.; Kang, H.K.; Koh, Y.-S.; Kim, Y.H. Anti-inflammatory and antioxidant activities of phenolic compounds from Desmodium caudatum leaves and stems. Arch. Pharmacal Res. 2014, 37, 721–727. [Google Scholar] [CrossRef]
  26. Ali Asgar, M. Anti-diabetic potential of phenolic compounds: A review. Int. J. Food Prop. 2013, 16, 91–103. [Google Scholar] [CrossRef]
  27. Wang, Y.; Li, L.; Liu, H.; Zhao, T.; Meng, C.; Liu, Z.; Liu, X. Bioactive compounds and in vitro antioxidant activities of peel, flesh and seed powder of kiwi fruit. Int. J. Food Sci. Technol. 2018, 53, 2239–2245. [Google Scholar] [CrossRef]
  28. LIsa, M.; Holcapek, M.; Bohac, M. Statistical evaluation of triacylglycerol composition in plant oils based on high-performance liquid chromatography−atmospheric pressure chemical ionization mass spectrometry data. J. Agric. Food Chem. 2009, 57, 6888–6898. [Google Scholar] [CrossRef]
  29. Deng, J.; Sun, T.; Cao, W.; Fan, D.; Cheng, N.; Wang, B.; Gao, H.; Yang, H. Extraction optimization and functional properties of proteins from kiwi fruit (Actinidia chinensis Planch.) seeds. Int. J. Food Prop. 2014, 17, 1612–1625. [Google Scholar] [CrossRef]
  30. Wojdyło, A.; Nowicka, P.; Oszmiański, J.; Golis, T. Phytochemical compounds and biological effects of Actinidia fruits. J. Funct. Foods 2017, 30, 194–202. [Google Scholar] [CrossRef]
  31. Guo, J.; Yuan, Y.; Dou, P.; Yue, T. Multivariate statistical analysis of the polyphenolic constituents in kiwifruit juices to trace fruit varieties and geographical origins. Food Chem. 2017, 232, 552–559. [Google Scholar] [CrossRef]
  32. Xie, Q.; Zhang, H.; Yan, F.; Yan, C.; Wei, S.; Lai, J.; Wang, Y.; Zhang, B. Morphology and molecular identification of twelve commercial varieties of kiwifruit. Molecules 2019, 24, 888. [Google Scholar] [CrossRef] [PubMed]
  33. Lee, I.; Im, S.; Jin, C.-R.; Heo, H.J.; Cho, Y.-S.; Baik, M.-Y.; Kim, D.-O. Effect of maturity stage at harvest on antioxidant capacity and total phenolics in kiwifruits (Actinidia spp.) grown in Korea. Hortic. Environ. Biotechnol. 2015, 56, 841–848. [Google Scholar] [CrossRef]
  34. Faller, A.; Fialho, E. Polyphenol content and antioxidant capacity in organic and conventional plant foods. J. Food Compos. Anal. 2010, 23, 561–568. [Google Scholar] [CrossRef]
  35. Lim, Y.J.; Oh, C.-S.; Park, Y.-D.; Eom, S.H.; Kim, D.-O.; Kim, U.-J.; Cho, Y.-S. Physiological components of kiwifruits with in vitro antioxidant and acetylcholinesterase inhibitory activities. Food Sci. Biotechnol. 2014, 23, 943–949. [Google Scholar] [CrossRef]
  36. Park, Y.-S.; Leontowicz, H.; Leontowicz, M.; Namiesnik, J.; Suhaj, M.; Cvikrová, M.; Martincová, O.; Weisz, M.; Gorinstein, S. Comparison of the contents of bioactive compounds and the level of antioxidant activity in different kiwifruit cultivars. J. Food Compos. Anal. 2011, 24, 963–970. [Google Scholar] [CrossRef]
  37. Gu, C.; Howell, K.; Dunshea, F.R.; Suleria, H.A. Lc-esi-qtof/ms characterisation of phenolic acids and flavonoids in polyphenol-rich fruits and vegetables and their potential antioxidant activities. Antioxidants 2019, 8, 405. [Google Scholar] [CrossRef]
  38. Suleria, H.A.; Barrow, C.J.; Dunshea, F.R. Screening and characterization of phenolic compounds and their antioxidant capacity in different fruit peels. Foods 2020, 9, 1206. [Google Scholar] [CrossRef]
  39. Zhu, C.; Chou, O.; Lee, F.Y.; Wang, Z.; Barrow, C.J.; Dunshea, F.R.; Suleria, H.A. Characterization of phenolics in rejected kiwifruit and their antioxidant potential. Processes 2021, 9, 781. [Google Scholar] [CrossRef]
  40. Wang, Z.; Barrow, C.J.; Dunshea, F.R.; Suleria, H.A. A comparative investigation on phenolic composition, characterization and antioxidant potentials of five different australian grown pear varieties. Antioxidants 2021, 10, 151. [Google Scholar] [CrossRef]
  41. Stavrou, I.J.; Christou, A.; Kapnissi-Christodoulou, C.P. Polyphenols in carobs: A review on their composition, antioxidant capacity and cytotoxic effects, and health impact. Food Chem. 2018, 269, 355–374. [Google Scholar] [CrossRef] [PubMed]
  42. Haile, M.; Kang, W.H. Antioxidant activity, total polyphenol, flavonoid and tannin contents of fermented green coffee beans with selected yeasts. Fermentation 2019, 5, 29. [Google Scholar] [CrossRef]
  43. Sogi, D.S.; Siddiq, M.; Greiby, I.; Dolan, K.D. Total phenolics, antioxidant activity, and functional properties of ‘Tommy Atkins’ mango peel and kernel as affected by drying methods. Food Chem. 2013, 141, 2649–2655. [Google Scholar] [CrossRef] [PubMed]
  44. Chen, X.-X.; Feng, H.-L.; Ding, Y.-M.; Chai, W.-M.; Xiang, Z.-H.; Shi, Y.; Chen, Q.-X. Structure characterization of proanthocyanidins from Caryota ochlandra Hance and their bioactivities. Food Chem. 2014, 155, 1–8. [Google Scholar] [CrossRef]
  45. Severo, J.; Tiecher, A.; Chaves, F.C.; Silva, J.A.; Rombaldi, C.V. Gene transcript accumulation associated with physiological and chemical changes during developmental stages of strawberry cv. Camarosa. Food Chem. 2011, 126, 995–1000. [Google Scholar] [CrossRef]
  46. Ferreira, I.C.; Baptista, P.; Vilas-Boas, M.; Barros, L. Free-radical scavenging capacity and reducing power of wild edible mushrooms from northeast Portugal: Individual cap and stipe activity. Food Chem. 2007, 100, 1511–1516. [Google Scholar] [CrossRef]
  47. Smirnoff, N.; Cumbes, Q.J. Hydroxyl radical scavenging activity of compatible solutes. Phytochemistry 1989, 28, 1057–1060. [Google Scholar] [CrossRef]
  48. Dinis, T.C.; Madeira, V.M.; Almeida, L.M. Action of phenolic derivatives (acetaminophen, salicylate, and 5-aminosalicylate) as inhibitors of membrane lipid peroxidation and as peroxyl radical scavengers. Arch. Biochem. Biophys. 1994, 315, 161–169. [Google Scholar] [CrossRef]
  49. Subbiah, V.; Zhong, B.; Nawaz, M.A.; Barrow, C.J.; Dunshea, F.R.; Suleria, H.A. Screening of phenolic compounds in australian grown berries by lc-esi-qtof-ms/ms and determination of their antioxidant potential. Antioxidants 2021, 10, 26. [Google Scholar] [CrossRef]
  50. Zhong, B.; Robinson, N.A.; Warner, R.D.; Barrow, C.J.; Dunshea, F.R.; Suleria, H.A. Lc-esi-qtof-ms/ms characterization of seaweed phenolics and their antioxidant potential. Mar. Drugs 2020, 18, 331. [Google Scholar] [CrossRef]
  51. Lee, M.-Y.; Yoo, M.-S.; Whang, Y.-J.; Jin, Y.-J.; Hong, M.-H.; Pyo, Y.-H. Vitamin C, total polyphenol, flavonoid contents and antioxidant capacity of several fruit peels. Korean J. Food Sci. Technol. 2012, 44, 540–544. [Google Scholar] [CrossRef]
  52. Deng, J.; Liu, Q.; Zhang, C.; Cao, W.; Fan, D.; Yang, H. Extraction Optimization of Polyphenols from Waste Kiwi Fruit Seeds (Actinidia chinensis Planch.) and Evaluation of Its Antioxidant and Anti-Inflammatory Properties. Molecules 2016, 21, 832. [Google Scholar] [CrossRef] [PubMed]
  53. Santos, J.S.; Brizola, V.R.A.; Granato, D. High-throughput assay comparison and standardization for metal chelating capacity screening: A proposal and application. Food Chem. 2017, 214, 515–522. [Google Scholar] [CrossRef] [PubMed]
  54. Mohamed, H.; Ons, M.; Yosra, E.T.; Rayda, S.; Neji, G.; Moncef, N. Chemical composition and antioxidant and radical-scavenging activities of Periploca laevigata root bark extracts. J. Sci. Food Agric. 2009, 89, 897–905. [Google Scholar] [CrossRef]
  55. Aruoma, O.I. Free radicals, oxidative stress, and antioxidants in human health and disease. J. Am. Oil Chem. Soc. 1998, 75, 199–212. [Google Scholar] [CrossRef] [PubMed]
  56. Spínola, V.; Pinto, J.; Castilho, P.C. Identification and quantification of phenolic compounds of selected fruits from Madeira Island by HPLC-DAD–ESI-MSn and screening for their antioxidant activity. Food Chem. 2015, 173, 14–30. [Google Scholar] [CrossRef]
  57. Peng, D.; Zahid, H.F.; Ajlouni, S.; Dunshea, F.R.; Suleria, H.A. Lc-esi-qtof/ms profiling of australian mango peel by-product polyphenols and their potential antioxidant activities. Processes 2019, 7, 764. [Google Scholar] [CrossRef]
  58. Yang, D.; Dunshea, F.R.; Suleria, H.A. LC-ESI-QTOF/MS characterization of Australian herb and spices (garlic, ginger, and onion) and potential antioxidant activity. J. Food Processing Preserv. 2020, 44, e14497. [Google Scholar] [CrossRef]
  59. Escobar-Avello, D.; Lozano-Castellón, J.; Mardones, C.; Pérez, A.J.; Saéz, V.; Riquelme, S.; von Baer, D.; Vallverdú-Queralt, A. Phenolic profile of grape canes: Novel compounds identified by lc-esi-ltq-orbitrap-ms. Molecules 2019, 24, 3763. [Google Scholar]
  60. Abu-Reidah, I.M.; Ali-Shtayeh, M.S.; Jamous, R.M.; Arráez-Román, D.; Segura-Carretero, A. HPLC–DAD–ESI-MS/MS screening of bioactive components from Rhus coriaria L. (Sumac) fruits. Food Chem. 2015, 166, 179–191. [Google Scholar] [CrossRef]
  61. Piazzon, A.; Vrhovsek, U.; Masuero, D.; Mattivi, F.; Mandoj, F.; Nardini, M. Antioxidant activity of phenolic acids and their metabolites: Synthesis and antioxidant properties of the sulfate derivatives of ferulic and caffeic acids and of the acyl glucuronide of ferulic acid. J. Agric. Food Chem. 2012, 60, 12312–12323. [Google Scholar] [CrossRef] [PubMed]
  62. Mukherjee, C.; Chakraborty, S. Study of dietary polyphenols from natural herbal sources for providing protection against human degenerative disorders. Biocatal. Agric. Biotechnol. 2021, 33, 101956. [Google Scholar] [CrossRef]
  63. Ma, C.; Dunshea, F.R.; Suleria, H.A. Lc-esi-qtof/ms characterization of phenolic compounds in palm fruits (jelly and fishtail palm) and their potential antioxidant activities. Antioxidants 2019, 8, 483. [Google Scholar] [CrossRef] [PubMed]
  64. Feng, M.; Zhu, Z.; Zuo, L.; Chen, L.; Yuan, Q.; Shan, G.; Luo, S.-Z. A strategy for rapid structural characterization of saponins and flavonoids from the testa of Camellia oleifera Abel seeds by ultra-high-pressure liquid chromatography combined with electrospray ionization linear ion trap-orbitrap mass spectrometry. Anal. Methods 2015, 7, 5942–5953. [Google Scholar] [CrossRef]
  65. Li, Z.; Zhang, X.; Liao, J.; Fan, X.; Cheng, Y. An ultra-robust fingerprinting method for quality assessment of traditional chinese medicine using multiple reaction monitoring mass spectrometry. J. Pharm. Anal. 2021, 11, 88–95. [Google Scholar] [CrossRef] [PubMed]
  66. Hussain, F.; Jahan, N.; Rahman, K.-U.; Sultana, B.; Jamil, S. Identification of hypotensive biofunctional compounds of Coriandrum sativum and evaluation of their angiotensin-converting enzyme (ACE) inhibition potential. Oxidative Med. Cell. Longev. 2018, 2018. [Google Scholar] [CrossRef] [Green Version]
  67. Wan, M.; Zhang, Y.; Yang, Y.; Liu, X.; Jia, L.; Yang, X. Analysis of the chemical composition of Angelicae Pubescentis Radix by ultra-performance liquid chromatography and quadrupole time-of-flight tandem mass spectrometry. J. Chin. Pharm. Sci. 2019, 28, 145. [Google Scholar]
Figure 1. Venn diagram of the total phenolic compounds presented in different kiwifruit samples. (A) A comparison of the total phenolic compounds present in different kiwifruit cultivars. (B) A comparison of the total phenolic acids present in different kiwifruit cultivars. (C) A comparison of the total flavonoids present in different kiwifruit cultivars. (D) A comparison of the total other polyphenols present in different kiwifruit cultivars. AH: Australian-grown Hayward kiwifruit. NZ: New Zealand-grown Zesy002 kiwifruit. OH: New Zealand-grown organic Hayward kiwifruit.
Processes 10 01811 g001
Figure 2. Venn diagram of the total phenolic compounds presented in different kiwifruit parts. (A) A comparison of the total phenolic compounds present in different kiwifruit parts. (B) A comparison of the total phenolic acids present in different kiwifruit parts. (C) A comparison of the total flavonoids present in different kiwifruit parts. (D) A comparison of the total other polyphenols present in different kiwifruit parts. AH: Australian-grown Hayward kiwifruit. NZ: New Zealand-grown Zesy002 kiwifruit. OH: New Zealand-grown organic Hayward kiwifruit.
Processes 10 01811 g002
Figure 3. Correlations of ten antioxidant assays. Principal component analysis (PCA) of phenolic content (TPC, TFC and TCT) and antioxidant activities (FICA, OH−RSA, RPA, DPPH, ABTS, FRAP and TAC) of twelve date samples.
Processes 10 01811 g003
Table 1. Estimation of the phenolic content and antioxidant potential of different kiwifruit samples.
Assays Peel Pulp Core
NZAHOHNZAHOHNZAHOH
TPC (mg GAE/g)6.61 ± 0.24 c7.99 ± 0.10 b9.65 ± 0.44 a0.58 ± 0.05 a0.45 ± 0.03 ab0.33 ± 0.02 b0.66 ± 0.05 a0.45 ± 0.01 b0.44 ± 0.03 b
TFC (mg QE/g)0.21 ± 0.00 b0.42 ± 0.04 a----0.01 ± 0.00--
TTC (mg CE/g)10.99 ± 0.12 a7.00 ± 0.56 b7.67 ± 0.34 b------
DPPH (mg AAE/g)12.33 ± 1.18 a7.88 ± 0.11 b6.69 ± 0.09 b0.25 ± 0.00 a0.13 ± 0.00 b0.08 ± 0.00 c1.04 ± 0.06 a0.31 ± 0.00 b0.22 ± 0.00 b
FRAP (mg AAE/g)2.64 ± 0.03 b3.12 ± 0.11 a0.03 ± 0.00 c0.32 ± 0.01 a0.03 ± 0.00 b0.03 ± 0.00 b0.04 ± 0.00 b0.10 ± 0.00 a0.03 ± 0.00 b
ABTS (mg AAE/g)18.31 ± 0.79 a17.01 ± 0.81 ab13.25 ± 0.35 b0.71 ± 0.01 a0.21 ± 0.02 b0.16 ± 0.00 b0.85 ± 0.02 a0.15 ± 0.00 c0.32 ± 0.02 b
FICA (mg EDTA/g)0.31 ± 0.07 a0.12 ± 0.02 b0.09 ± 0.01 c0.14 ± 0.04 a0.08 ± 0.02 b-0.09 ± 0.01 a0.03 ± 0.01 b-
OH-RSA (mgAAE/g)0.37 ± 0.04 a0.09 ± 0.02 c0.21 ± 0.07 b0.04 ± 0.01 a0.05 ± 0.03 a-0.12 ± 0.09 a0.09 ± 0.01 b0.04 ± 0.02 c
RPA (mg AAE/g)1.24 ± 0.01 a0.98 ± 0.07 b0.74 ± 0.02 c0.18 ± 0.08 b0.24 ± 0.03 a0.04 ± 0.07 c0.72 ± 0.04 a0.51 ± 0.01 b0.19 ± 0.03 c
TAC (mg AAE/g)--4.43 ± 0.110.37 ± 0.01 a0.03 ± 0.00 c0.12 ± 0.00 b0.51 ± 0.02 a0.11 ± 0.00 c0.28 ± 0.00 b
The results are displayed as the mean ± standard deviation (n = 3); a, b, c indicates the means in a row with significant difference (p < 0.05) using one-way analysis of variance (ANOVA) and Tukey’s test. GAE, gallic acid equivalents; QE, quercetin equivalents; CE, catechin equivalents; AAE, ascorbic acid equivalents; EDTA, ethylenediaminetetraacetic acid; TPC, total phenolic content; TFC, total flavonoid content; TTC, total tannin content; DPPH, 2,2′-diphenyl-1-picrylhydrazyl; FRAP, reducing antioxidant power; ABTS, 2,2′-azinobis-(3-ethylbenzo-thiazoline-6-sulfonic acid; RPA, reducing power assay; OH-RSA, hydroxyl radical scavenging activity; FICA, ferrous ion chelating activity; TAC, total antioxidant content. NZ, New Zealand-grown Zesy002 kiwifruit; AH, Australian-grown Hayward kiwifruit; OH, New Zealand-grown organic Hayward kiwifruit.
Table 2. Characterization of the phenolic compounds in the different kiwifruit samples by LC-ESI-QTOF-MS/MS.
No.Proposed CompoundsMolecular
Formula
RT
(min)
Ionization
(ESI+/ESI)
Molecular
Weight
Theoretical
(m/z)
Observed
(m/z)
Error
(ppm)
MS2 Product
Ions
Samples
Phenolic acids
Hydroxybenzoic acids
1Gallic acidC7H6O56.956** [M−H]170.0215169.0142169.01483.5125* OHL, AHL
2Gallic acid 4-O-glucosideC13H16O1010.236** [M−H]332.0743331.0670331.0655−4.5169, 125* OHL, OHC
33-O-Methylgallic acidC8H8O511.694[M+H]+184.0372185.0445185.0444−0.5170, 142* OHC, AHL
4Protocatechuic acid 4-O-glucosideC13H16O912.539** [M−H]316.0794315.0721315.0707−4.4153* OHL, OHC, AHL
52,3-Dihydroxybenzoic acidC7H6O415.580[M−H]154.0266153.0193153.01951.3109* AHL, OHL
63,4-O-Dimethylgallic acidC9 H10 O517.965** [M+H]+198.0528199.0601199.06020.5153, 139, 125, 111AHL
72-Hydroxybenzoic acidC7H6O322.943** [M−H]138.0317137.0244137.0242−1.593* OHL, AHL, NZL, OHP
8PaeoniflorinC23H28O1134.151** [M−H]480.1632479.1559479.15784.0449, 357, 327* AHL, OHL, OHP
Hydroxycinnamic acids
91,5-Dicaffeoylquinic acidC25H24O124.106[M−H]516.1268515.1195515.11980.6353, 335, 191, 179* OHL, OHP, OHC
103-Caffeoylquinic acidC16H18O94.458** [M−H]354.0951353.0878353.0873−1.4253, 190, 144* NZC, NZP, AHL, OHL, NZL, AHP, OHP
113-Feruloylquinic acidC17H20O94.653** [M−H]368.1107367.1034367.10381.1298, 288, 192, 191* OHL, NZC, NZP, AHP, OHP, NZL
12Ferulic acid 4-sulfateC10H10O7S7.041[M−H]274.0147273.0074273.00812.6193, 178NZL
13Caffeoyl glucoseC15H18O97.589[M−H]342.0951341.0878341.0874−1.2179, 161* NZC, AHL
14Ferulic acid 4-O-glucuronideC16H18O1018.512** [M−H]370.0900369.0827369.08311.1193* AHL, OHL
15Caffeic acid 3-O-glucuronideC15H16O1022.273** [M−H]356.0743355.0670355.06710.3179* AHL, OHL
16m-Coumaric acidC9H8O322.306** [M−H]164.0473163.0400163.04031.8119* AHL, OHL, NZL
17Rosmarinic acidC18H16O822.323** [M−H]360.0845359.0772359.0755−4.7179* AHL, OHC, NZL
18Ferulic acidC10H10O423.366** [M−H]194.0579193.0506193.0505−0.5178, 149, 134* AHL, OHC, OHP
19p-Coumaric acid 4-O-glucosideC15H18O823.764** [M−H]326.1002325.0929325.0924−1.5163* AHL, NZC, NZP
20Sinapic acidC11H12O526.166** [M−H]224.0685223.0612223.0604−3.6205, 163* AHL, NZL
211-Sinapoyl-2,2′-diferuloylgentiobioseC43H48O2126.763[M−H]900.2688899.2615899.2579−4.0613, 201AHL
22Caffeic acidC9H8O428.724** [M−H]180.0423179.0350179.0349−0.6143, 133* OHL, OHC, NZP
231,2,2′-TriferuloylgentiobioseC42H46O2031.127[M−H]870.2582869.2509869.2506−0.3693, 517OHL
243-p-Coumaroylquinic acidC16H18O832.031** [M−H]338.1002337.0929337.0923−1.8265, 173, 162* AHL, NZC, NZP, OHL, AHC
25Ferulic acid 4-O-glucosideC16H20O935.526[M−H]356.1107355.1034355.10401.7193, 178, 149, 134AHL
265-5′-Dehydrodiferulic acidC20 H18 O839.819** [M+H]+386.1002387.1075387.1064−2.8369* OHC, AHL, OHL
Hydroxyphenylacetic acids
273,4-Dihydroxyphenylacetic acidC8H8O424.874[M−H]168.0423167.0350167.0349−0.6149, 123* AHL, OHL
282-Hydroxy-2-phenylacetic acidC8H8O388.387** [M−H]152.0473151.0400151.0397−2.0136, 92* AHC, OHL, AHL
Hydroxyphenylpropanoic acids
29Dihydrocaffeic acid 3-O-glucuronideC15H18O1012.340[M−H]358.0900357.0827357.0818−2.5181OHL
30Dihydroferulic acid 4-O-glucuronideC16H20O1033.025[M−H]372.1056371.0983371.09901.9195AHL
Flavnoids
Flavanols
313′-O-MethylcatechinC16H16O611.736** [M−H]304.0947303.0874303.0873−0.3271, 163* OHC, NZC, NZL, OHC, AHC
32(-)-EpigallocatechinC15H14O714.222** [M−H]306.0740305.0667305.06742.3261, 219* AHL, NZL, OHP
33(-)-EpicatechinC15H14O624.211** [M−H]290.0790289.0717289.07221.7245, 205, 179* AHL, OHL
34(+)-Gallocatechin 3-O-gallateC22H18O1125.099** [M−H]458.0849457.0776457.07862.2305, 169* NZL, AHP
35Procyanidin dimer B1C30H26O1226.498** [M−H]578.1424577.1351577.1338−2.3451* AHL, OHL, NZL
364′-O-Methyl-(-)-epigallocatechin 7-O-glucuronideC22H24O1327.607[M−H]496.1217495.1144495.11633.8451, 313AHL
37Cinnamtannin A2C60H50O2435.444** [M−H]1154.26921153.26191153.26290.9739* AHL, NZL
38Procyanidin trimer C1C45H38O1836.239** [M−H]866.2058865.1985865.20022.0739, 713, 695* AHL, OHL, OHC, NZL
39Prodelphinidin dimer B3C30 H26 O1442.775** [M+H]+610.1323611.1396611.13970.2469, 311, 291* NZC, AHL, OHL, AHC, AHP
Flavones
40Chrysoeriol 7-O-glucosideC22 H22 O117.398** [M+H]+462.1162463.1235463.12544.1445, 427, 409, 381* AHP, AHL
41Apigenin 7-O-glucuronideC21H18O1115.812[M+H]+446.0849447.0922447.09301.8271, 253* AHL, NZL
42Apigenin 6,8-di-C-glucosideC27H30O1525.520[M−H]594.1585593.1512593.1489−3.9503, 473AHL
43CirsilineolC18H16O726.744[M+H]+344.0896345.0969345.0962−2.0330, 312, 297, 284AHL
44RhoifolinC27H30O1442.644[M−H]578.1636577.1563577.15833.5413, 269NZC
45Apigenin 6-C-glucosideC21H20O1051.563** [M−H]432.1056431.0983431.09963.0413, 341, 311* AHL, NZL
466-Hydroxyluteolin 7-O-rhamnosideC21H20O1151.811** [M−H]448.1006447.0933447.09462.9301* AHL, OHL, NZL
Flavanones
47NarirutinC27H32O144.189** [M−H]580.1792579.1719579.1707−2.1271* OHL, NZL
488-PrenylnaringeninC20H20O54.431[M+H]+340.1311341.1384341.1382−0.6323, 137* NZC, OHC, NZL
49NeoeriocitrinC27H32O1513.168** [M−H]596.1741595.1668595.16741.0431, 287* OHL, NZL
50Hesperetin 3′,7-O-diglucuronideC28H30O1821.163[M−H]654.1432653.1359653.13600.2477, 301, 286, 242AHL
51HesperidinC28 H34 O1537.033** [M+H]+610.1898611.1971611.19821.8593, 465, 449, 303* NZL, OHP, OHC, AHC
52Hesperetin 3′-O-glucuronideC22H22O1252.673[M−H]478.1111477.1038477.10390.2301, 175, 113, 85AHL
Flavonols
53Myricetin 3-O-rhamnosideC21H20O1211.810** [M−H]464.0955463.0882463.08932.4317* OHL, OHC, NZL
54Myricetin 3-O-galactosideC21H20O1312.754** [M−H]480.0904479.0831479.08412.1317* OHL, AHC
553-MethoxysinensetinC21 H22 O815.633** [M+H]+402.1315403.1388403.1384−1.0388, 373, 355, 327* OHL, OHP, OHC
56Quercetin 3-O-(6”-malonyl-glucoside)C24H22O1516.395[M+H]+550.0959551.1032551.1020−2.2303NZL
57Patuletin 3-O-glucosyl-(1->6)-[apiosyl(1->2)]-glucosideC33H40O2224.452** [M−H]788.2011787.1938787.19491.4625, 463, 301, 271NZL
58Quercetin 3-O-(6”-malonyl-glucoside) 7-O-glucosideC30H32O2028.900[M+H]+712.1487713.1560713.15610.1551, 303NZL
59Kaempferol 3,7-O-diglucosideC27H30O1629.820** [M−H]610.1534609.1461609.14772.6447, 285* NZL, OHC, OHL
60Myricetin 3-O-arabinosideC20H18O1230.606[M−H]450.0798449.0725449.07423.8317AHL
61Quercetin 3-O-xylosyl-rutinosideC32 H38 O2041.157** [M+H]+742.1956743.2029743.1992−5.0479, 317* NZL, OHL
62Quercetin 3-O-xylosyl-glucuronideC26 H26 O1743.207** [M+H]+610.1170611.1243611.12552.0479, 303, 285, 239* AHL, OHP, AHC
63Kaempferol 3-O-xylosyl-glucosideC26H28O1551.675** [M+H]+580.1428581.1501581.15030.3419, 401, 383* NZL, OHL, AHL
64Kaempferol 3-O-(2″-rhamnosyl-galactoside) 7-O-rhamnosideC33H40O1960.187** [M−H]740.2164739.2091739.2072−2.6593, 447, 285* NZL, OHL
Dihydrochalcones
65DihydroquercetinC15H12O712.382** [M−H]304.0583303.0510303.0508−0.7285, 275, 151* OHC, AHL, NZL
663-Hydroxyphloretin 2′-O-glucosideC21H24O1124.659** [M−H]452.1319451.1246451.12490.7289, 273* AHL, OHL, NZC, NZL, OHC
67PhloridzinC21H24O1056.168[M−H]436.1369435.1296435.1295−0.2273* AHL, OHL, NZC, OHP
Dihydroflavonols
68Dihydromyricetin 3-O-rhamnosideC21H22O1223.549** [M−H]466.1111465.1038465.1032−1.3301* AHL, OHL
69Dihydroquercetin 3-O-rhamnosideC21H22O1153.650** [M−H]450.1162449.1089449.10951.3303* AHL, NZL
Anthocyanins
70Cyanidin 3-O-(6″-p-coumaroyl-glucoside)C30 H27 O1320.618** [M+H]+595.1452596.1525596.1524−0.2287* NZL, AHP, OHL, AHL, AHC
71Isopeonidin 3-O-arabinosideC21H21O1022.324[M+H]+433.1135434.1208434.1196−2.8271, 253, 243NZL
72Delphinidin 3-O-glucosyl-glucosideC27H31O1725.952[M+H]+627.1561628.1634628.1607−4.3465, 303NZL
73Pelargonidin 3-O-rutinosideC27 H31 O1426.267** [M+H]+579.1714580.1787580.1775−2.1271, 433* NZL, NZC, AHC, NZP, AHP, OHC, OHL
74Delphinidin 3-O-glucosideC21 H21 O1245.278** [M+H]+465.1033466.1106466.11131.5303* AHL, NZL
75Cyanidin 3,5-O-diglucosideC27 H31 O1688.305** [M+H]+611.1612612.1685612.16931.3449, 287* AHC, AHL, OHL, NZL
Isoflavonoids
766″-O-MalonylglycitinC25 H24 O1311.939** [M+H]+532.1217533.1290533.12991.7285, 270, 253* NZL, OHC, OHC
77ViolanoneC17H16O612.572** [M−H]316.0947315.0874315.0872−0.6300, 285, 135* OHL, AHC, OHC, NZL
783′-O-MethylviolanoneC18H18O613.790[M−H]330.1103329.1030329.1027−0.9314, 299, 284, 256* OHC, NZC, NZP, AHC, OHL
795,6,7,3′,4′-PentahydroxyisoflavoneC15 H10 O715.260** [M+H]+302.0427303.0500303.0497−1.0285, 257* AHC, AHL, NZL, OHC, NZL
802-Dehydro-O-desmethylangolensinC15H12O417.749** [M−H]256.0736255.0663255.0657−2.4135, 119* OHC, OHL, AHP
81Dihydrobiochanin AC16H14O522.255[M+H]+286.0841287.0914287.09253.8269, 203, 201, 175AHL
826″-O-MalonyldaidzinC24H22O1222.772[M+H]+502.1111503.1184503.12023.6255NZL
836″-O-AcetylglycitinC24H24O1123.815[M+H]+488.1319489.1392489.1385−1.4285, 270NZL
842′,7-Dihydroxy-4′,5′-dimethoxyisoflavoneC17 H14 O633.008**[M+H]+314.0790315.0863315.0849−4.4300, 282*NZL, OHL
853′-HydroxygenisteinC15H10O633.575[M+H]+286.0477287.0550287.0548−0.7269, 259OHC
862′-HydroxyformononetinC16H12O537.908[M+H]+284.0685285.0758285.0755−1.1270, 229AHP
873′-HydroxydaidzeinC15H10O542.979[M+H]+270.0528271.0601271.06061.8253, 241, 225NZL
Other polyphenols
Hydroxycoumarins
88ScopoletinC10H8O47.678** [M−H]192.0423191.0350191.03552.6176* NZP, AHP, OHP, NZL
89EsculinC15H16O921.132[M+H]+340.0794341.0867341.0863−1.2179, 151* NZL, OHL, AHC
90EsculetinC9H6O427.267[M−H]178.0266177.0193177.0190−1.7149, 133, 89* OHL, AHL
Hydroxybenzaldehydes
91p-AnisaldehydeC8 H8 O213.770** [M+H]+136.0524137.0597137.0595−1.5122, 109* AHC, AHL, OHL, NZL
Curcuminoids
92DemethoxycurcuminC20H18O520.648[M−H]338.1154337.1081337.10913.0217OHC
93BisdemethoxycurcuminC19H16O432.721[M+H]+308.1049309.1122309.11261.3291, 263NZC
Furanocoumarins
94IsopimpinellinC13H10O527.757[M+H]+246.0528247.0601247.06072.4232, 217, 205, 203* NZL, OHL
Phenolic terpenes
95RosmanolC20 H26 O510.856** [M+H]+346.1780347.1853347.18530.0301, 241, 231* OHP, OHL
Tyrosols
96Hydroxytyrosol 4-O-glucosideC14H20O820.180** [M−H]316.1158315.1085315.10881.0153, 123* NZC, AHL, AHC
973,4-DHPEA-ACC10H12O425.537** [M−H]196.0736195.0663195.0658−2.6135* AHL, NZL
Other polyphenols
98ArbutinC12H16O74.148** [M−H]272.0896271.0823271.08240.4109* OHC, NZL
Lignans
99EnterolactoneC18 H18 O44.234** [M+H]+298.1205299.1278299.12790.3281, 187, 165* AHL, OHP, OHC
100PinoresinolC20H22O611.189[M−H]358.1416357.1343357.1331−3.4342, 327, 313, 221* OHC, AHC
101SchisandrinC24H32O714.899[M+H]+432.2148433.2221433.22210.0415, 361NZP
102EpisesaminC20H18O615.348** [M−H]354.1103353.1030353.1029−0.3338, 163* NZP, AHC, AHP, NZC, OHL, OHC, OHP
1037-HydroxymatairesinolC20H22O715.773[M−H]374.1366373.1293373.12940.3343, 313, 298, 285* NZC, AHC, OHL
1047-OxomatairesinolC20 H20 O727.502** [M+H]+372.1209373.1282373.12963.8358, 343, 328, 325* OHP, OHC, OHL, NZP
105Schisandrin CC22 H24 O632.561** [M+H]+384.1573385.1646385.16511.3370, 315, 300* NZL, OHP
106Schisantherin AC30 H32 O937.579** [M+H]+536.2046537.2119537.2115−0.7519, 415, 385, 371NZL
Stilbenes
1074′-Hydroxy-3,4,5-trimethoxystilbeneC17H18O441.207[M+H]+286.1205287.1278287.1275−1.0271, 241, 225* NZL, NZC
* Compound was detected in more than one kiwifruit sample; the data presented in this table are from an asterisk sample. ** Compounds were detected in both the negative [M−H] and positive [M+H]+ mode of ionization, while only single-mode data are presented. The kiwifruit samples were mentioned in the abbreviations. Australian-grown Hayward kiwifruit peel (AHL), Australian-grown Hayward kiwifruit pulp (AHP), Australian-grown Hayward kiwifruit core (AHC), New Zealand-grown Zesy002 kiwifruit peel (NZL), New Zealand-grown Zesy002 kiwifruit pulp (NZP), New Zealand-grown Zesy002 kiwifruit core (NZC), New Zealand-grown organic Hayward kiwifruit peel (OHL), New Zealand-grown organic Hayward kiwifruit pulp (OHP), and New Zealand-grown organic Hayward kiwifruit core (OHC).
Table 3. Pearson’s correlation between the antioxidant capacities given by different antioxidant assays.
TPCTFTTTCDPPHFRAPABTSFICAOH-RSA RAP
TFT−0.614
TTC−0.703−0.13
DPPH−0.9040.2170.940
FRAP−0.8850.9110.2910.600
ABTS−1.000 *0.6110.7050.9050.883
FICA−0.9480.3300.8930.9930.6900.949
OH-RSA−0.769−0.0320.9950.9690.3830.7710.933
RAP−0.998 *0.6610.6580.8760.9120.998 *0.9270.729
TAC0.847−0.940−0.217−0.537−0.997 *−0.845−0.633−0.311−0.878
* Significance level alpha 0.05.
Publisher’s Note: MDPI stays neutral with regard to jurisdictional claims in published maps and institutional affiliations.

