Article

Techno-Economic Analysis and Feasibility of Industrial-Scale Activated Carbon Production from Agricultural Pea Waste Using Microwave-Assisted Pyrolysis: A Circular Economy Approach

Department of Chemical Engineering, Faculty of Science and Engineering, University of Hull (UoH), Kingston upon Hull HU6 7RX, UK
*
Author to whom correspondence should be addressed.
Processes 2022, 10(9), 1702; https://doi.org/10.3390/pr10091702
Submission received: 19 June 2022 / Revised: 19 August 2022 / Accepted: 23 August 2022 / Published: 26 August 2022
(This article belongs to the Section Environmental and Green Processes)

Abstract

:
This paper examines a novel approach to activated carbon (AC) production that uses pea waste (PW) and to what extent it is economically competitive with current production methods. Additionally, the outcome is to provide a detailed economic analysis to understand whether this process is viable. The focus of this production route and the economic analysis will be on a United Kingdom (UK) basis. The plant will be located within the north UK to minimise storage and transportation costs. It also has extensive links to other clusters of nearby industries that would produce from this process in air pollution control or wastewater treatments. The overall production process is detailed, and detailed equipment specifications, including the sizing of equipment and utility requirements, were also given. Material balance calculations are carried out to assess the performance and improve process design. An economic analysis is performed to study the potential of biomass-to-AC conversion costs and commercialisation viability. The project’s investment is about £100 million. The cost of the plant can be recovered from year 3 (mid) for the 20-year life of the plant. The Net Present Value (NPV) is based on cumulative cash flow. The NPV is calculated as GBP 4,476,137,297.79 for 2020, and the associated internal rate of return (IRR) and the return on investment (ROI) for the project are 55% and 52%, respectively.

1. Introduction

Converting waste into value-added compounds such as activated carbon (AC) is stemmed from the growing negative environmental impact and increasing limitations of fossil fuel resources. Research in this field has accelerated as energy consumption increases over time [1]. Utilising biomass provides a path to combat or mitigate the increasing worldwide demands for energy [2]. This international effort intends to utilise new and alternative technologies, which would lower the changes associated with environmental pollution and, in turn, global climate change through the development of industrial and agricultural technologies from renewable means such as biomass waste. The transition to cleaner energy or materials from renewable resources can be enhanced, allowing nations to have energy security and achieve sustainable development [3]. The significant challenges include integrating with the petrochemical industry, utilising robust technologies, and providing a surplus amount of biomass feedstock for valorisation. Determining a viable and sustainable process route can help increase stakeholder cooperation across value chains.
Biomass is predicted to play a key role in driving the energy transition towards ‘green energy’ and lessening the hold on limited fossil fuel supplies. The global energy production from biomass has expanded progressively, accounting for 70% of the total renewable supply in 2017, with a technical potential estimated to be as high as 1500 EJ/year by 2050 [4]. Tripathi et al. [5] reported increasing interest and development to utilise biomass residues, explicitly concentrating on the bioenergy sector. This would require significant research and development investments in specialist product development for alternative fuels and biochar production. The global annual generation of biomass waste is estimated to be 140 Gt [5]. These can be feedstocks for various products ranging from the production of fuel, polymers, and wastewater treatment materials. The selection of using biomass from agricultural waste is an interesting route. There is a keen interest in using biomass to produce AC. It provides a two-fold solution for tackling the growing pollution strategy, considering global food waste statistics are estimated to be 1.3 billion tons annually [6]. The carbon derived from biomass prevents the production of carbon dioxide (CO2) or methane (CH4). Furthermore, it can produce industrially more useful AC and enter the natural carbon cycle process [7]. This development of utilising harvest waste will also implement a circular economy by utilising wastes as resources, which current policies have adapted in Europe [8]. Reducing waste levels and finding the most sustainable solution with an efficient valorisation route to manage the remaining harvest waste will close the loop. [9]. We recently demonstrated pea waste as a new and promising treatment for wastewater. A cost-effective alternative to AC is widely available. This will be particularly useful in newly industrialised countries facing high water pollution and needing a rapid, inexpensive, and efficient solution [10].
In 2017, 40,000 hectares of peas were grown in the UK, and more than 30% (w/w) of waste is produced during pea harvesting [11]. The remaining unavoidable waste from harvesting leaves behind other parts of the plant: pods, stalks, vines, and leaves [12]. Danish and Ahmad [7] studied the potential applications of biomass waste from harvest as a viable alternative to the expensive production process of AC from coal. In India, pea peel waste was used to produce cellulose as it was cheap and readily available. It was a valuable and unused form of energy to produce cellulase [13].
The potential of utilising agricultural waste to produce carbonaceous materials such as AC (derived from biochar) can be an efficient process. There are different routes to produce biochar, including fast pyrolysis, slow pyrolysis, flash pyrolysis, torrefaction and hydrothermal carbonization, and microwave-assisted pyrolysis (MAP) [14,15,16,17,18]. MAP uses microwave irradiation for pyrolysing biomass to produce bio-oil and biochar products. Ge et al. [19] reviewed the feasibility of using MAP on agricultural waste. Besides, MAP offers fast heating of the extraction mixture via microwave irradiation [20]. Touhami et al. [21] used rice husk as a heterogeneous acid catalyst and established 30 min for the optimal carbonisation duration of the MAP. Currently, using MAP large scale has not been understood for continuous production in terms of product yield and reactor design. Fodah et al. [18] compared the literature values of corn stover biomass (similar proximate analysis of PW) products yielded from a catalytic and non-catalytic MAP. It was found that the yield of biochar decreased when the MAP was increased from 500 W to 900 W. The bio-oil yield increased from 500 W to 700 W and decreased to 900 W. The relation between the lignocellulosic content of varying agricultural waste is important for MAP’s biochar and bio-oil product yield. Similar lignocellulosic content to PW was compared with that undergoing a valorisation process. Results indicate a 20-40% yield of biochar and bio-oil each. Xia et al. [12] utilised MAP on pea vine to produce bio-oil and biochar. The optimal production conditions were 300 °C, 250 psi, and 300 W for 15 min. It was found that the bio-oil had a high content of phenolic compounds, and the biochar had a gross calorific value of 26.6 MJ kg−1. The calorific value indicates a viable and efficient method of utilising PW to produce AC and bio-oil in conjunction (due to its phenolic content). Currently, biochar’s main uses include applying biochar to the soil to improve soil fertility [22] and ‘energy production, livestock production, carbon sequestration, wastewater treatment, toxins remediation’ [23]. However, AC is the main desired product for this plant. It has scope for many adsorptions and catalysis applications due to its high surface area, pore volume, and pore size distribution [24]. Biochar can also be used as a precursor of value-added AC. There are various methods of activation processes of biochar, including mechanical, physical, and chemical activation, which leads to different properties of AC. Chemical activation involves treating with acids, bases, and oxidisers, and thermal activation involves re-pyrolysing at a greater temperature than the initial production temperature of pyrolysis [25]. Chemical activation has gained increased attention. It has one-step and two-step methods, and the latter has an increased purity of 99.9% in terms of porosity and yield (higher surface area and pore volume) [26].
Currently, there is no solid work or investments to utilise harvest waste biomass application of chars. The economic analysis will be novel as Kaczor et al. [9] reported that a comprehensive route has not been determined on an industrial scale, as the known production of biomass supply within the UK is unclear. One reason could be that there is a lack of industrial-scale plants [23] for this intended use. There is an absence of a comprehensive cost analysis for the whole biomass supply chain derived from harvest. The economic analysis identifies favourable scenarios in the valorisation process [27,28].
Detailed economic analysis of the production plant from PW must consider the pyrolyser’s purchased and operating cost, feedstock’s price, and energy requirements. The capital costs will be similar for all biomasses [22]. Optimum operation performance will be the lowest possible temperature and the fastest time. Stella Mary [29] reported the optimum temperature for char yield was 300 °C, where maximum values in the pea pod were 21.14 %, and the fixed carbon content pod were lower when compared to peel and vine. It is also very important to consider the yield of biochar production. These parameters can be estimated based on TGA analysis [30]. The feedstock price will be the most significant difference and impact the costs of biochar production. The biochar produced through the pyrolysis process in biorefineries will be combusted to meet energy needs, and any excess energy can be sold to the electricity grid. The economic value of biochar can be improved by upgrading it to activated carbon.
Tadda et al. [31] reported that in 2014, there were about 1.1 million metric tons of AC from AC industries, with a 10% increase in the projected demand. In the USA, there is an expected increase in demand for AC due to new federal laws requiring the removal of heavy metals from effluent streams. The world demand shows that the Global AC Market is forecasted to be worth USD 14.07 Billion by 2027, as reported by Emergen Research. The main applications are water treatment and air purification. This increase in demand can introduce and enforce standards and legislation of various countries in the global effort to combat air and water pollution caused by fast industrialisation [32]. The increasing manufacturing activity in developing countries will also be a factor in the increased demand for AC. The commercial application of AC is one of the most widely used industrial adsorbents for separation, purification, and recovery processes [33]. The main route of producing AC from wood, petroleum coke, carbon black, coal, and lignite has high production costs. Hence, this generated the interest in utilising the low-cost agricultural wastes with relatively high carbon as the raw materials substitute for AC. The requirement for sewage and wastewater treatment is generating demand for AC. This can be due to the rising global pollution levels due to the growing population and requiring purification. Despite the growing demand, the high price of raw materials impedes the market growth.
This paper intends to determine an applicable route to produce AC from agricultural pea waste (PW) in the UK due to its multipurpose in industry processes (adsorption, wastewater treatments, and soil fertilisation) and to what extent it is economically competitive. This differs from the conventional route of slow pyrolysis to produce biochar, a precursor of AC. This route utilises microwave power for better heat transfer as well as uniformity. An extra activation unit will produce AC with a higher surface area. In addition, a bio-oil produced from the process can still be used as a valuable commodity to be sold. The process can provide economic, social, and environmental benefits [34]. It will raise the issues of suitable infrastructure and require more integration within the food supply chain rather than working independently to allow for efficient food waste management and a more sustainable solution. The plant’s location will be based in the UK, near the availability of peas [35]. Minimising transport costs will allow for sustainable infrastructure for future operations to decrease the biochar technology’s carbon footprint, enabling it to meet Net Zero standards. In addition, a process model to produce AC from agricultural PW will be delivered and, in turn, quantify, as far as possible, the potential effect of the selected through the costs and advantages of AC from agricultural PW within the UK. The economic analysis will be more conducive to determining whether using PW from the industry with the newly designed infrastructure can better manage the waste supply chain. Moreover, it will also indicate whether it can compete with the already current production method of AC from agricultural waste.

2. Overall Process

The overall process will be discussed, including pre-treatment, pyrolysis, separation, and activation. Considerations into heat and mass transfer will be explained for the main unit operations (this will be shown on the process flow diagram). Mass balance is provided as it is essential to control processing in terms of the yields of the products.

2.1. Process Route

MAP involves storing feedstock, drying, pre-treatment, separation of biochar, bio-oil, and gas; the chemical activation of biochar, refining the oil, and storing and transporting the products sold. The PW is initially dried and then shredded or milled through multiple grinders. It is dried typically using a rotary dryer with a moisture content of 5% [14]. Then the dry biomass goes through a MAP reactor such as a fluidised bed or fixed bed reactor. The reacted products then go through the cyclone, separating the products into gases. The liquid (bio-oil) is collected and condensed in a condenser to produce bio-oil [36]. The non-condensable gases (NCG) may be used for heating purposes or sold off. The biochar collected undergoes chemical activation and subsequent washing, drying, and storing of the final carbonaceous product. The porosity of biochar produced from MAP is higher than that produced from conventional pyrolysis. Furthermore, the following assumptions were made due to the challenges of measuring a transient temperature within the heated feedstock.
  • Uniform distribution of electromagnetic waves;
  • All the heated materials are non-magnetic;
  • Variations in volume and physical/electrical properties are considered negligible;
  • Neglect any effect related to a chemical reaction;
  • Need a microwave absorber energy balance/requirement—the energy streams in and out of the pyrolysis system are considered in the control volume and considered a closed system.

2.2. Pre-Treatment Process

Pre-treatment methods are important for biomass as they make it more compatible with the specific energy conversion of pyrolysis and enhance its properties. The overall cost of the production process can be reduced by increasing the pre-treatment efficiency. Size reduction and pre-treatment process are significant for thermochemical conversion.
Drying is the primary step as the quality of biochar or biofuel can be affected by the moisture content [12]. Reducing the water content to a level low enough can also prevent the growth of microorganisms, reduce enzymatic reactions, and improve the combustion performance [37,38]. The PW chosen for the study is assumed to have a moisture content of 12.7% on dry basis from farmland drying, which needs to be dried further to 6-8% as this was ideal for optimum biochar characteristics [30] for pyrolysis. The dryer type selection is based on the bed height and airflow velocity at the specified temperature. This determines the energy requirement. Fluidised bed drying is most common as this can be batch or in continuous mode. This will be useful when scaling up this process [39]. Equation (1) gives the weight change within drying.
Δ W = W f     W o = 1 / 100 M f M f   M o   M o W o
where ∆W = change in weight, Wf = final weight, Wo = initial weight, Mf = final moisture content (% wet basis), and Mo = initial moisture content (% wet basis).
After drying, milling is an important step despite the high energy requirements [40,41,42]. The PW is shredded, ground, and sieved to 0–200 mesh (0–0.090 mm). After the necessary physical pre-treatment method steps, chemical pre-treatment is often used to prepare the biomass using an alkali, such as NaOH, and acids, such as H2SO4. These were found to be the most effective [41].

2.3. MAP Pyrolysis for PW

Microwave heating is used for pyrolysis at medium speed with an effective heat transfer profile. The appeal is the increased process yield, environmental ease, and lower space and capital equipment [43,44,45]. Ethaib et al. [46] summarised the pyrolysis reaction of biomass. However, there are currently no reports on the economic viability/feasibility of MAP reactors for large-scale applications of biomass pyrolysis for bio-oil and biochar production. Furthermore, the main operation mode of MAP was found to be a batch reaction on an experimental scale. The aim is to transfer this to a continuous mode carried out MAP of biomass in continuous mode with a higher rate of biomass recycling.

2.3.1. Microwave Absorbers

MAP of biomass not only needs catalysts, but it also requires microwave absorbers as biomass is generally not a good absorber of microwave [14,26,47].

2.3.2. Catalyst Selection

The proposed plant is designed and modelled using the proximate, elemental analysis, and calorific value assumptions. The feedstock is entered at 1443 kg/hr, and the biochar produced is assumed to be at 35% of the initial feedstock at 498 kg/hr. The selection of catalysts is critical [48,49].

2.3.3. Separation

The next step after the MAP reaction is separating the three main products. Separating the char is essential as it can act as a vapour cracking catalyst at lower temperatures. Moreover, it can form polycyclic aromatic hydrocarbons (PAHs) in pyrolysis processes. Multiple cyclones can separate the sold product (char) and condensed to separate the non-condensable gases and the bio-liquid. The initial separation can be operated similar to a flash drum at a temperature of 100 °C and pressure of 1.01325 bars [50]

2.3.4. Activation

The operating conditions of physical activation that affect the quality and yield of the AC produced are the activation time, the activation temperature and the vapour mass ratio of the char. Table 1 gives chemical activation process parameters for MAP. The activating agents affect activated biochar’s porosity (e.g., microporous, mesoporous). The main activating agents used are H3PO4, ZnCl2, NaOH, KOH, Na2CO3, and K2CO3. The main advantages of H3PO4 are maximizing yield and surface area while minimizing activating agents and microwave energy [24]. The biochar is treated with H3PO4., heated between 300 °C and 600 °C, and then washed with acid or base to remove the activating agent [51]. The intensive washing required after activating can generate a significant amount of wastewater. Studies by Azargohar and Dalai [52] tested activation times between 0.9 h and 4 h, activation temperatures ranging from 600 °C to 900 °C, and mass ratios of steam to char between 0.4 and 2.

2.4. Main Unit Operations and Overall Process

The main unit operations of this process will be outlined, and a detailed description of the overall production process, with relevant design specifications of equipment that include the sizing of equipment and utility requirements, were also given. Table 2 provides equipment operating conditions. The process flow diagram and material balance are given in Figure 1 and Table 3, respectively.
Dryer (V-101) is the first operation after PW transport and storage. Biomass was assumed to have a 12.7% moisture content after naturally drying. Then, 183.26 kg/hr of moisture content is removed from the feedstock. Hence, the initial amount of PW is 1260 kg/hr. The dryer uses air-drying to reduce the moisture content to 1% (ideal for MAP). The required air for the drying was calculated at 5129.66 kg/hr. The air was heated with low-pressure steam at 210 °C calculated using Tube-Shell Heat Exchanger Design Calculation Software. It was modelled as a shell and tube heat exchanger (E-101) and can be calculated using air temperature, moisture content, and humidity ratio [54]. A rotary dryer would then be required to remove the water before entering the miller unit operation (V-102). The dryer operates at 200 °C at close to atmospheric pressure. It operates by utilising the gravitational forces to rotate the machinery. Rotary driers have high thermal efficiency. They also have relatively low capital and labour costs [55]. The remaining water is collected and utilised to optimise the plant operation. The calculation of air gas flow rate is provided in Appendix A. This is crucial because the higher moisture content in the feed consumes process heat downstream and contributes to lower process yields. A rotary dryer was selected as it is the most common for commercial processes. It also is beneficial as it is less sensitive to particle size. The final dried product has a composition of 12 kg/hr of water.
Miller unit operation (V-102) is intended for size reduction. It is an expensive and energy-intensive process. The intention is to reduce the dried PW of average 8 mm to 3 mm. Without this unit operation, the feedstock would not be suitable for thermochemical conversion. The selection of the grinder is important for reducing energy. For example, if the grinding device is a knife, the geometry and direction of the cut affect the resulting feedstock’s configuration. This will reduce power requirements and the quality of the surface of the feedstock. The grinding type affects the reaction’s efficiency as the raw biomass harvested from fields undergoes a coarse grinding process [56]. Newbolt [57] reported that the hammer mill is the most preferred for biomass size reduction. The tested variables were screen size, angular velocity, time, feed rate, type, feed size, load, moisture content, and process. The main measured factors for grinding are particle size distribution, specific grinding energy, geometric mean particle size, moisture content, bulk density, and absolute density [56].
The solvent extraction of chemical pre-treatment (V-103) involves mixing the H2SO4 and water with the dried PW. The extractor operates at 121 °C and 2 bara. Chemical pre-treatment is a useful process after a mechanical operation. It is generally done to eliminate ash and hemicellulose [58]. The liquid to solid ratio is 1 to 10 with 20 wt% as H2SO4 and 80 wt% water (dilute acidic system). Since acid can cause corrosion to the equipment, corrosion-resistant construction material is required, such as stainless steel 304 [55], which is generally expensive. A centrifuge system is typically used for a solid-liquid system. The extraction unit is assumed to have 98% efficiency but can reach 99%. This stream is now entering the reactor.
The most common reactor for MAP is the fixed bed and fluidised bed (R-101). Ge et al. [19] reported that biomass waste with a smaller particle size has a higher pyrolysis rate, achieving higher temperature with lesser heat loss. In that context, the fluidised bed reactor is more economical than a fixed bed reactor as large particles promote volumetric heating. However, there is a concern if rapid gas sparging in a fluidised bed reactor leads to significant heat loss, meaning the reactor requires a higher energy input (3.5–4.2 kJ/g) than the fixed bed reactor (2.2–2.5 kJ/g) for MAP. These reactors are proposed in terms of batch processing. The reactor configuration for continuous mode would be a rotary kiln, conveyor belt, or auger screw conveyor. The operating conditions of the reactor are at 300 °C, 500 W, and 1.5 bar, this reaction assumes something like batch operation, and in literature, it was reported that continuous mode has not been robust. The product conversion is assumed to be 35% for oil and char and 30% for gas [14,15,16,17]. Due to higher pressure, nitrogen is mixed with 20% of the feed as inert to minimise explosions. Further, the graphite catalyst is going at a bed volume factor of 0.2, and a calcium oxide microwave absorber is placed in the reactor as 10% of the feed.
The solid separator is designed as a cyclone (V-104) operating at 350 °C. The particle size of char is important as it affects the design and performance of cyclones and filters. More than one solid separator can be used. Cyclone is the most appropriate equipment to separate solid from gas streams for particulates with diameters greater than 0.01 mm. A mesh pad is used to separate liquids from gases. Ideally, it should be designed as a vertical drum with sieve plates to collect the oil. It was found that char can be collected more as the cylinder height is increased with a high flow rate. The safety issues are associated with the vertical orientation; therefore, wall thickness is important. The cyclone can be made from low alloy steel as the gas contains hydrogen, and the sieve plates are made out of stainless steel as the gas is corrosive [59]. The operation efficiency of the separator is assumed at 98%.
A quenching tower is used (V-105) to allow for a rapid condensing of the oil stream operating at 50 °C, allowing the volatile vapours to quench and avoid secondary reactions that convert condensable vapours to non-condensable gases [60]. The gas products go into the compressor (C-101) to maintain pressure. A centrifugal compressor is assumed to have an efficiency of 75% and can also be cooled to 43 °C. Condensers (CO-101) in this process are assumed to be only one; however, for greater efficiency, there should be three condensers and varying temperatures of 80, 50, and 30 °C in which the oil would be collected. Direct contact condensers are used for this process as they have lower capital and maintenance costs. It is simple to design high heat transfer rates and transfer areas. There is a reduction in the occurrence of problems with fouling and corrosion, especially in the pyrolysis environment.
Activating unit is a fixed bed reactor (R-102) where the mixing of activating reagent H3PO4 and water is entered at a 1:2 ratio with 85 wt% of acid. The reactor operates at atmospheric conditions of 550 °C, which is ideal for harvesting feedstock. Complete conversion of char was assumed. This could vary from 70 to 80%, depending on the reaction temperatures and reagent ratio. The subsequent washing and extraction were conducted in V-106 and 107, in which KOH and de-ionised water entered 3 times the AC flowrate with KOH at 10wt%. Drying (V-109) for the activated carbon is a crucial step due to the crystalline structure of the AC. Fluidised bed dryers are suitable for granular and crystalline structures and ranges of 1–3 mm particle size. They are also suitable for continuous operation. Furthermore, they are also appealing due to their short residence times and faster and uniform heat transfer; however, these dryers’ power requirements will be higher [55]. The amount of air required for the dryer was calculated based on humidity ratio and moisture content assumptions in Appendix B. The final product flow of AC is 433 kg/hr.

3. Economic Analysis

The economic analysis is crucial to determine the viability of the selected process to be applied on an industrial scale. The proposed plant is based in the UK. The economic analysis will also identify the current market conditions and the pyrolysis plant, provide the investment requirements, and evaluate the sustainability of a project. Financial calculations will be provided to show baseline projections of the plant using the economic tools and relevant equations and assumptions.

3.1. Location of Plant

The location of the plant is a crucial factor. It was already stated that the plant would be based in the UK. When choosing the UK location, it must consider its corporation tax and yearly revenues. It should factor in the location factor in the construction of equipment that would affect the capital cost of the plant [27]. Another factor that could be considered is the safety aspect of constructing the plant.

3.2. Biochar Feedstock

The main factors in the cost of the biochar process include biochar production (feedstock, transport, utilities, maintenance and operation, labour, and capital cost), transportation and storage (equipment, labour, and new covered storage facilities), and energy production (electricity value and heat energy value). The profit of the biochar process includes process benefits and refinement, carbon abatement, and pollution abatement.

3.3. Cost Analysis

The cost approximation will be based on variables from [55]. A class 5 estimate was given with an accuracy of 40%. The factors considered will be the operation cost, payback period (PBP), Net profit loss and internal rate of return. The breakeven point (BEP) also shows the correlation between the potential plant cost and the rate of return. The breakeBEP is the point at which total cost and revenue are equal. The major three cost areas are the total project investment (capital investment) and the operating cost, which are the variable operating costs and fixed operating costs. Variable operating costs were determined from the material and energy balance. The economic feasibility of the process will be evaluated using a discounted cash flow rate of return (DCFROR) calculation [55]. An internal rate of return (IRR) of 10% was specified for the plant life of 20 years and straight-line depreciation over 10 years. The economic analysis will be handled by examining the total financial costs associated with activated carbon production to the specified capacity. It would briefly consider induvial parameters, such as fixed cost of production and variable cost of production, as the lack of information could contribute to expenses. The additional products are produced to benefit the process. These products can be sold after different processes or used for plant energy generation. Table 4 outlines the estimated production and operational hours per year. The initial feedstock of PW is 10080 tonnes/yr, not including initial water content. This can be found in the attached material balance document. The total capital investment summary (CAPEX) is given in Table 5.

3.4. Total Capital Investment

The total capital investment is calculated as the sum of the fixed capital investment required for constructing the plant, the working capital essential for the early operation of the plant, and the starting expenses.

3.4.1. Inside Battery Limits

Bridgewater’s method uses a correlation of plant cost against the number of processing steps and is suitable for plants that process liquids and solids [55]. The information required for this method is the plant capacity in metric tonnes per year. The reactor conversion (based on the mass of the desired product per mass fed into the reactor) and the number of main unit operations (11) would have substantial costs, such as pressure vessels. Similarly, the plant capacity is 3468 tonnes per year of AC, where the reactor conversion is estimated to be 30–35% for biochar. Since the plant capacity for this project is less than 60,000 metric tonnes per year and the plant location is in North England, so the equation has to account for this instead of the US Gulf Coast on a 2003 basis [55] for the location factor. The location factors are based on the International Construction Cost Factor Location Manual. The factor for the US Gulf Coast is 1.00, and for the UK, it is 1.02. The cost escalation index is from Chemical Engineering Journal—Chemical Engineering Plant Cost Index (CEPCI). The CEPCI value published for 2000 is 394.1, and for 2020 is 604.1. The cost has also been inflated for the plant in 2020. Equation (2) is used for the ISBL cost estimation [55].
C = 280,000 N Q S 0.3
where C = ISBL capital cost, Q = plant capacity, S = reactor conversion (mass of desired product per mass fed to the reactor), and N = number of functional units.
ISBL cost estimation ((Equation (2)) also must consider the cost of major equipment based on equipment specifications. The cost of installation can add to the accuracy of the cost estimate using the proposed installation factors, such as the Lang factor or Hand factor [55]. However, this could change the estimated cost based on electrical construction, piping, instrumentation, and control factors.

3.4.2. Offsite Battery Limits (OSBL)

The offsite battery limits cost is associated with the alteration and upgrades required for the site infrastructure. This cost is taken as an estimated proportion of the ISBL. This process is taken as 40% of the ISBL due to the unavailability of information on the site condition and knowledge of the additions required for the site’s infrastructure.

3.4.3. Engineering and Construction Cost

The engineering and construction cost is taken as 10% of the direct capital cost (ISBL + OSBL). This is a highly dependent on the depends on the economic climate. The costs include the contactor’s profit, detailed engineering design, and administrative charges.

3.4.4. Contingency Charges

Contingency charges are a useful component for cost estimates if unexpected events occur. There would be suitable provisions to mitigate the high cost of preventing bankruptcy. This constitutes 10% of the direct capital cost but can increase by 50%. The unexpected events could be changes in project scope, currency fluctuation, and labour disputes.

3.4.5. Fixed Capital Cost

Fixed capital is the total cost of designing, constructing, installing, and modifying a plant [55]. This helps provide realistic budgeting to assume that a detailed risk analysis is performed in the early design stages. The fixed capital investment is calculated as the sum of the ISBL, OSBL, engineering, and contingency costs.

3.4.6. Working Capital

This is the cost associated with the plant’s operation, design, build, and commissioning. Taking the working capital as an estimate based on the forecast cost of production as the working capital is recovered at the end of the project. However, working capital is estimated as 15% of the direct capital cost (ISBL + OSBL).

3.4.7. Start-up Expense

The start-up expenses are taken as 10% of the direct capital cost (ISBL + OSBL).

3.5. Operating Expenditure Summary

The operating cost comprises the fixed and variable costs of production. Table 6 provides Operating Expenditure (OPEX) summary.

3.5.1. Fixed Cost of Production

The fixed production costs are fixed regardless of the running of the plant and can affect the cost estimations associated with the project. These categories are listed in Table 6. One of the main factors is labour costs and wages to plant operators and supervisors during operating hours. This is independent of the production rate. Labour cost is a function of the operators per shift position within the process plant. This is estimated on a UK basis, GBP 40,000 salary per year. The estimation of the minimum number of shift positions 4 shifts. Supervision is taken as 25% of operating labour. Overhead cost is taken as 50% of operating labour + supervision. Maintenance cost is taken as 5% of the ISBL investment cost. The property taxes and insurance are taken 1.5% of the ISBL. The rent of land is assumed and not purchased. Therefore, the cost is not added to the fixed capital investment and is recovered in the end. The overhead charges are taken as 65% of the sum of operating labour, supervision, direct overhead, and maintenance. The environmental charge is taken as 1% of ISBL + OSBL.

3.5.2. Variable Cost of Production

The variable cost of production; the raw materials required for the process, the utilities, the consumables needed, disposal of the waste streams produced, and the packing and shipping costs needed for the distribution of the products. Optimisation in terms of design and operation may decrease cost. It was assumed that the pea waste could be purchased for GBP 15 per tonne. The reagents such as phosphoric acid, and sulfuric acid could be purchased for GBP 40 per kg and GBP 79.80 per litre. MW absorbers are accounted for in the raw materials. The utilities required to produce AC are electricity, microwave power, cooling water, and Low-pressure steam. It is assumed that the cost associated with the utilities is 20% of the total quantity of biodiesel produced. Both Packaging and disposal were taken as 10% of product revenue.
The revenue for the process is the sale of by-products produced (gas and oil) that could require purification of this stream if it does not meet the required standards. Additional units such as condensers and filters would be required, increasing the capital cost. Table 7 summarises the revenues for the project. Margin is considered the same as total revenue.
The gross margin is also calculated using Equation (3), and the result is provided in Table 8.
G r o s s   M a r g i n = R e v e n u e s     R a w   M a t e r i a l   C o s t
Profits need to be determined. Hence, the cost of making the product without the return on the equity capital investment needs to be known. The cash cost of production is the sum of all the variable production costs. The profit produced is subjected to UK corporation tax set at 19%. To determine the cash flow after tax has been taken, the net profit is calculated by subtracting the tax from the gross profit. The amount of tax that would need to be paid every year would vary; therefore, it might require to be inflated and would need to be determined to get the best representation of after-tax cash flow. The taxable income is determined by subtracting the tax allowance from the gross profit. The annual depreciation allowance was calculated for the tax allowance. For the cash flow diagram to understand the net present value, ROI, and IRR, the interest rate was set at 11% and the discounting factor set at 12%. The cash flow initially flows out of the company to pay for the costs of engineering, equipment procurement, and plant construction (typically 3 years). When the plant is constructed and begins operation, the revenues from the product’s sales will be included. The cash flow diagram for 20 years is given in Figure 2. From the cash flow diagram, various components were gathered, such as NPV, IRR, ROI, and PBP.
The NPV is the net present value of the project. It helps understand the desirability of a potential project in terms of the cash flow and the associated risks of the selected discount rate. The method involves calculating the discounted net cash flow. A positive NPV would indicate the project is desirable and would gain a return. A negative NPV would show that the project is not going forward as it would be worthless. The discount rate is essential, mainly for the IRR, showing the minimum acceptable return. The discount rate and NPV can be inversely proportional [55]. The NPV is calculated using Equation (4), where CFn is the cash flow in the year (n), t is the project life in years, and i is the interest rate [55].
N P V = Σ n = 1 n = t C F n 1 + i n
The IRR indicates the efficiency of the capital investment. This shows that the maximum capital cost value before the project is considered unacceptable by equating the NPV to 0 by testing different discount rates. This is known as the discounted cash flow rate of return (DCFROR). It shows the maximum interest rate that the project will pay and still break even at the end of the project. The IRR equation is given in Equation (5) where i’ is the discounted cash flow rate of return [55].
I R R = n = 1 n = t C F n 1 + i n = 0
The return on investment (ROI) indicates the efficiency of the initial investment into the project. The objective is to get a high ROI, indicating a gain from the investment. The ROI does not account for the time value of money. Therefore, a pre-cash tax flow is used, so this cannot be the only indicator used. The pre-tax ROI is calculated using Equation (6)
t a x   R O I =   c u m u l a t i v e   p r e t a x   c a s h   f l o w p l a n t   l i f e × i n t i a l   i n v e s t m e n t   × 100  

3.6. Sensitivity Analysis and Economics Summary

The sensitivity analysis usually accounts for the volatile parameters and examines the effects of these uncertainties and their impact on the project’s viability. This would indicate when the NPV would be most affected due to variations in parameters such as material prices, as they can vary depending on the demand. More sophisticated analysis is necessary to recognise the variables with the largest influences. The sensitivity analysis will evaluate the discount rate’s effect on the NPV, and the increase in a discount rate decreased the net present value. The NPV was done for 20 yrs. With a 12% discount rate and was calculated at GBP 4,476,137,297.79. Therefore, this process is viable and can go ahead. The revenue was changed based on a typical start-up schedule. Year one is the designing phase of the project (starting point of the cash flow), which is taken as 30% of fixed capital. The second year is construction, which is taken as 50% of fixed capital. The third year is an ongoing construction cost taken as 20% of fixed capital and working capital, the full fixed cost of production (FCOP), and 30% of the variable cost of production (VCOP). The fourth year is FCOP and 70% of VCOP. The fifth year is FCOP + VCOP is 100% of design basis revenue. FCOP + VCOP is the cash cost of production (CCOP). The revenue is then inflated for each year. The cash flow diagram was constructed by accounting for tax allowance and discount flow. The financial summary indicated IRR and ROI to be 55 and 52%, respectively. The payback is 3 years. The NPV profile against varying discount rates for sensitivity analysis is given in Figure 3.
The deployment and supply of biochar feedstock in UK need to be evaluated as this requires a ‘breakeven selling point’ for biochar [61]. Currently, there is difficulty in understanding the extent of feasibility, which will cause difficulties in determining these uncertainties due to the lack of data from demonstration or commercial facilities. Shackley et al. [61] demonstrated the costs and benefits associated with pyrolysis-biochar systems in which the total cost of producing, delivering, and applying biochar is considered for the UK and total benefits (selling value of biochar). The main factors in the cost of the biochar process include:
  • Biochar production—feedstock, transport, utilities, maintenance and operation, labour, and capital cost;
  • Transportation and storage—equipment, labour, and new covered storage facilities;
  • Energy production—electricity value and heat energy value;
  • Profit of the biochar process include:
  • Process benefits and refinement;
  • Carbon abatement;
  • Pollution abatement.
Since there are limited data on large-scale MAP-biochar systems, there will be a degree of uncertainty. However, experimental work will be relied upon to recommend unit operations. In the context of techno-economic feasibility MAP system can only be economically viable if it has a sustainable feedstock supply (PW), scalable technology (from lab to pilot), and the capability for continuous operation for the long term (20-year plant life). In terms of optimisation, the process should aim to have a lower pyrolysis temperature with a shorter residence time without affecting the yield of char and AC.

4. Conclusions

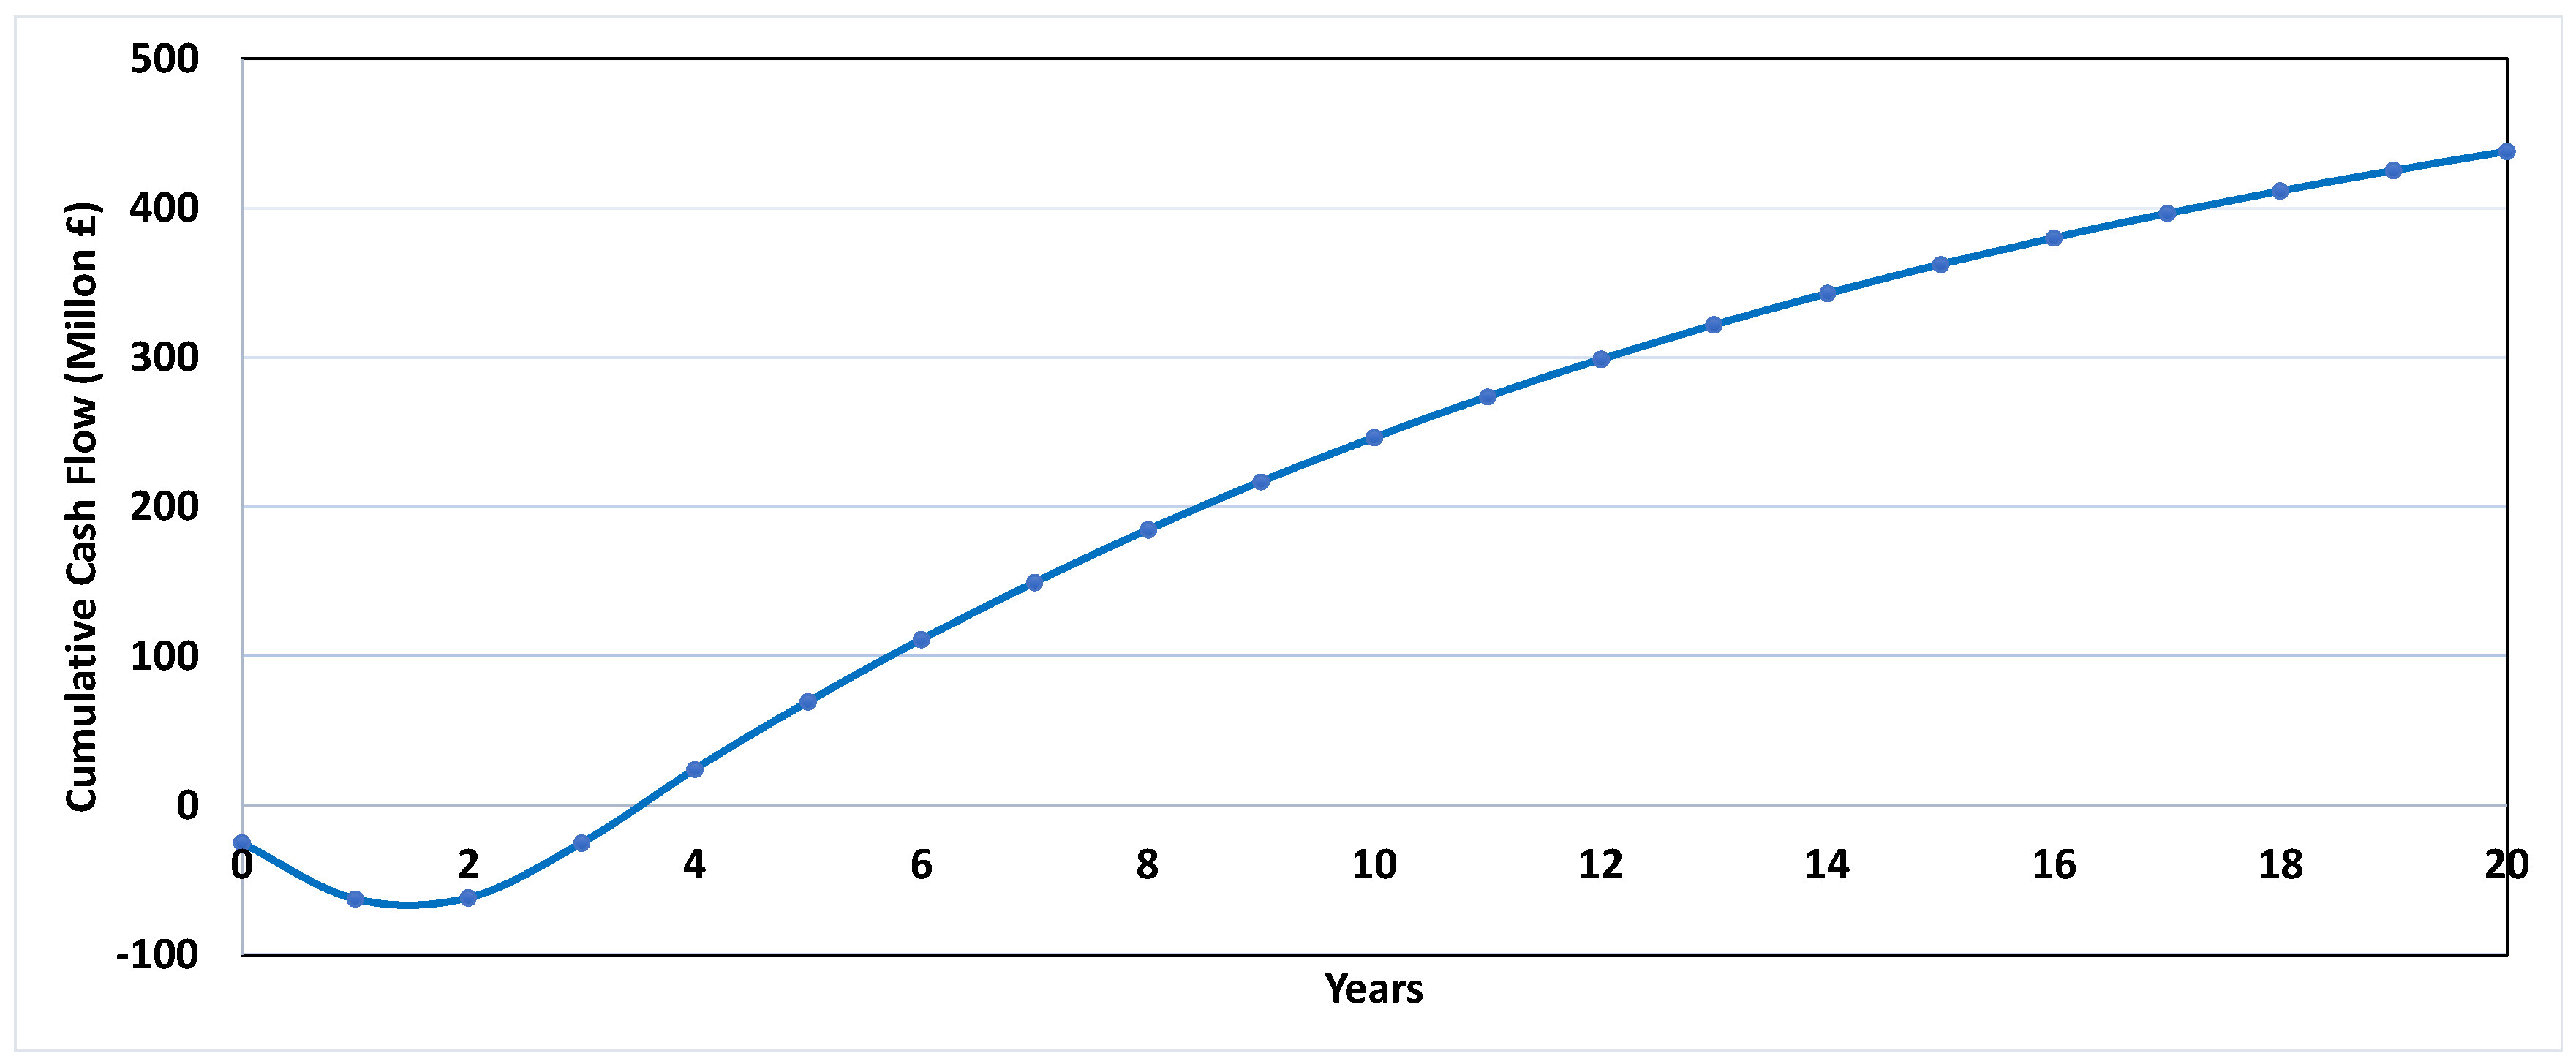
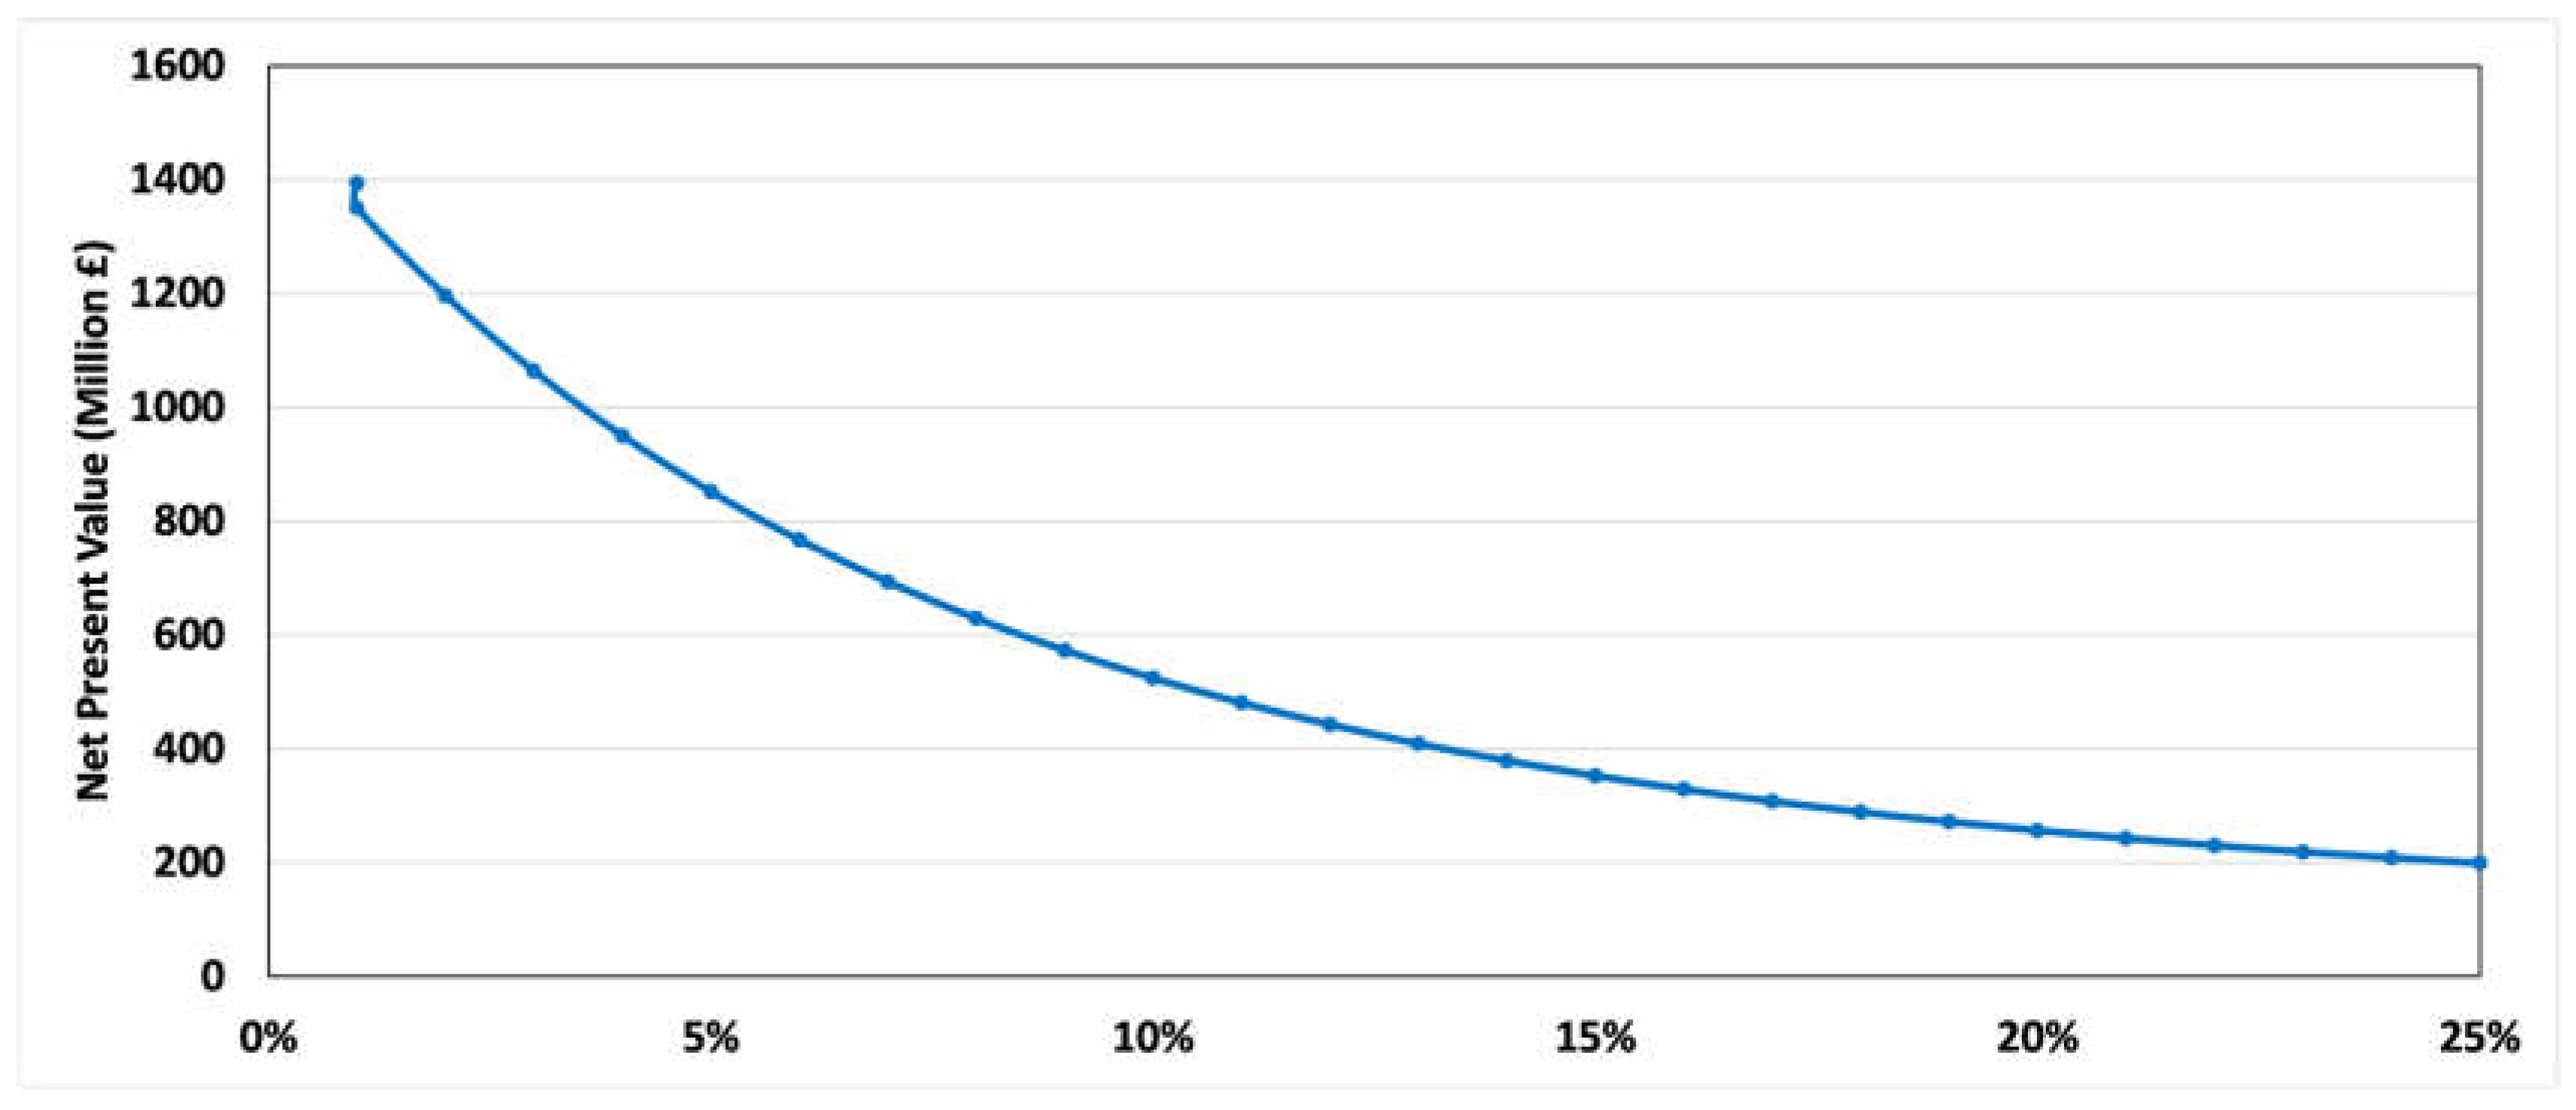
The study concludes with AC production currently viable based on these baseline productions. However, the bio-oil (unrefined) price is relatively high and might not be practical. The study aimed to perform an economic analysis to identify the viability of producing activated carbon from pea waste. The total investment required for the project is GBP 100,953,124.99. The plant cost can be recovered from year 3 (mid) for the 20-year life. The NPV calculated is GBP 4,476,137,297.79 for 2020, and the associated IRR for the project is 55%. The ROI in 2020 is 52%.
The study concludes that bio-oil production is not viable based on baseline productions. However, with detailed process economic calculations taken into account, a much better judgement can be made. The fault can lie with bio-oil price, with the sale price having to be substantially larger per quantity to generate a positive profit. Additional alternative scenarios need to be examined, with the highest sensitivity identified, to assess bio-oil production’s overall viability from PW accurately, explain the bio-oil quality, and improve profitability.
To further assess the appropriateness of this production method for commercial AC, environmental issues should be considered when designing the process and the unit operations, along with their associated mitigating methods. This would affect the plant costing estimation. Similarly, process control piping and instrumentation and start-up and shut-down equipment need to be considered. A simulation package such as Aspen HYSYS to simulate the whole process and include a detailed sizing of the equipment should be used. This would allow for a better understanding of the purchase cost and installation of the process equipment appropriate for the process. This would also better inform the carbon dioxide emissions of the process for a better understanding of its ‘sustainability.

Author Contributions

S.H.Z.: Conceptualisation, Supervision, Writing—Original draft preparation, Reviewing and Editing. A.A.: Investigation, Data curation, Writing—Report. All authors have read and agreed to the published version of the manuscript.

Funding

This research received no external funding.

Institutional Review Board Statement

Not applicable.

Informed Consent Statement

Not applicable.

Data Availability Statement

Not applicable.

Conflicts of Interest

On behalf of all authors, the corresponding author states that there is no conflict of interest.

Abbreviations

ACActivated carbon
BEPBreakeven Point
CAPEXCapital Expenditure
CCOPCash Cost of Production
CEPCIChemical Engineering Plant Cost Index
DCFRORDiscounted Cash Flowrate of Return
DTGDerivative Thermogravimetry Peak Temperature
FCOPFixed Cost of Production
IRRInternal Rate of Return
ISBLInside Battery Limits
MAPMicrowave-Assisted Pyrolysis
NCGnon-condensable gases
NPVNet Present Value
OPEXExpenditure
OSBLOffsite Battery Limits
PAHsAromatic Hydrocarbons
PBPPayback Period
PWPea Waste
ROIReturn on Investment
SiCSilicon Carbide
UKUnited Kingdom
VCOPVariable Cost of Production
ΔGFree Gibbs Energy
ΔHEnthalpy
ΔSChanges in Entropy

Appendix A. Calculation of Air Gas Flow Rate

Unit Operation: Rotary Dryer
Processes 10 01702 i001
Dyer one for the initial drying of feedstock as part of pretreatment method, The air flowrate needs to be calculated for the amount of moisture to be dried.
Information known:
Outlet Temperature (Solids) = 200 °C
Outlet Temperature (Air) = 210 °C
Inlet Temperature (Solids) = 20 °C
Inlet Temperature (Air) = 210 °C
Cp,g (Air) = 1.1 kJ/kg retrieved form Perry’s handbook
Cp (solids) = 1.5 kJ/kg (average value from literature)
Cp (liquids) = 4.18 kJ/kg as this is assumed to be only water
Stream 1 (pea waste flow in) = 1260 kg/hr
Xin = 0.127
X out = 0.01
Yin = 0
Unknown Information
Y out = Unknown
Stream 3 = Unknown
λ = Latent heat of the liquid @ 210 °C = 1899.62 (from steam tables)
Mass balance general equation for dryer
Steam 3 *(Yin) + Steam 1*(Xin) = Stream 3 *Y out + Steam 5 X out
(S3 × 0) + (1260 × 0.127) = (S3 Yout) + (1260 × 0.01)
0 + 160.2 = S3 Yout + 12.6
S3Y out = 147.42
General Energy Balance for the dryer
S3Hin air + S5 H in, solids pw = S3 Hout, air + S5 H out, solid pw
Enthalpies given as follows for solids (pea waste);
Hi = Cp, solid*(Ti, solid − 0) + Cp, liquid*Xi*(Ti, liquid − 0)
H in, solids = 1.5(293.15 − 0) + (4.18 × 0.127)(293.15 – 0 − 0) = 595.35 kJ/kg
H in = 595.35 kJ/kg
H out, solids = 1.5* (483.15 − 0) + (0.07 × 4.18)*(483.15 − 0) = 866.09 kJ/kg
H out = −866.09 kJ/kg
Enthalpies given as follows for Air;
Hi = (Cp, air + Cp, liquid*Yi)(Ti, air − 0) + Yi
H in, air = (1 + 4.18 × 0)(483.15 − 0) + 0 × 1899.62 = 483.15 kJ/kg
H out, air = (1 + 4.18 *Y out)(323.15 − 0) + Y out × 1899.62 = 483.15 kJ/kg + * 233,769.94 kJ/kg
Substituting the answer calculated from the mass balance into the energy balance equation and rearranging to find Air flow rate
S3*483.15 + 1260 × 595.35 = S3*(325.15 + 3290.467*Y out) + 1260 × 866.09
483.15*S3 + 749,700 = 325.15*S3 + 3250.39*S3*Y out + 1,091,273.40
160.15*S3 + 749,700 = 3250.39*S3*Y out + 1,091,273.40
From previous calculations S3*Y out = 147.42
160.15*S3 + 749,700 = 479172.05 + 1,091,273.40
160.15*S3 = 820,745.45
S 3 = 820745.45 160.15
Air flow in is = 5129.66 kg/hr

Appendix B. Activated Carbon Dryer

(Unit Operation: Rotary Dryer)
Processes 10 01702 i002
General energy balance based on humidity ratio, moisture content
m ˙ air *W2 + m ˙ AC*w1 = m ˙ air*W1+ m ˙ AC*w2
W = absolute humidity
W = moisture content
m ˙ (air) = mass flow rate of air = 2948.63 kg/hr
m ˙ (AC) = mass flow rate of activated carbon = 493 kg/hr
Moisture content on dry basis
M o s t u r e   c o n t e n t   w 1 = W w W d
Ww is water weight = 66.2 kg/hr
Wd is the dry weight of AC = 432.24 kg/hr
Moisture content (w1) is 0.153
From the psychometric chart [62], it assumed that that AC stream has 60% humidity at 50 °C, this streams leaves 35 °C.From graph humidity (W1) is 0.022
From the psychometric chart [62], it assumed that that Air stream has 30% humidity at 60 °C, this streams leaves 35 °C.From graph humidity(W2) is 0.002
The final moisture content (w2) of the AC product is 0.02

References

  1. Xu, Z.; Xiao, X.; Fang, P.; Ye, L.; Huang, J.; Wu, H.; Tang, Z.; Chen, D. Comparison of Combustion and Pyrolysis Behavior of the Peanut Shells in Air and N2: Kinetics, Thermodynamics and Gas Emissions. Sustainability 2020, 12, 464. [Google Scholar] [CrossRef]
  2. Rowena, C.; Tanquilut, M.; Genuino, H.C.; Wilbers, E.; Amongo, R.M.C.; Suministrado, D.C.; Yaptenco, K.F.; Elauria, M.M.; Elauria, J.C.; Heeres, H.J. Biorefining of Pigeon Pea: Residue Conversion by Pyrolysis. Energies 2020, 13, 2778. [Google Scholar] [CrossRef]
  3. Chen, Q.; Tan, X.; Liu, Y.; Liu, S.; Li, M.; Gu, Y.; Zhang, P.; Ye, S.; Yang, Z.; Yang, Y. Biomass-derived porous graphitic carbon materials for energy and environmental applications. J. Mater. Chem. A 2020, 8, 5773–5811. [Google Scholar] [CrossRef]
  4. Popp, J.; Lakner, Z.; Harangi-Rakos, M.; Fari, M. The effect of bioenergy expansion: Food, energy, and environment. Renew. Sustain. Energy Rev. 2014, 32, 559–578. [Google Scholar] [CrossRef]
  5. Tripathi, N.; Hills, C.D.; Singh, R.S.; Atkinson, C.J. Biomass waste utilisation in low-carbon products: Harnessing a major potential resource. Clim. Atmos. Sci. 2019, 2, 35. [Google Scholar] [CrossRef]
  6. Abiad, M.G.; Meho, L.I. Food loss and food waste research in the Arab world: A systematic review. Food Secur. 2018, 10, 311–322. [Google Scholar] [CrossRef]
  7. Danish, M.; Ahmad, T. A review on utilization of wood biomass as a sustainable precursor for activated carbon production and application. Renew. Sustain. Energy Rev. 2018, 87, 1–21. [Google Scholar] [CrossRef]
  8. Foundation, E.M. Delivering the Circular Economy: A Toolkit for Policymakers; Ellen MacArthur Foundation: Cowes, UK, 2015. [Google Scholar]
  9. Kaczor, Z.; Buliński, Z.; Werle, S. Modelling approaches to waste biomass pyrolysis: A review. Renew. Energy 2020, 159, 427–443. [Google Scholar] [CrossRef]
  10. Holliday, M.C.; Parsons, D.R.; Zein, S.H. Agricultural Pea Waste as a Low-Cost Pollutant Biosorbent for Methylene Blue Removal: Adsorption Kinetics, Isotherm and Thermodynamic Studies. Biomass Conv. Bioref. 2022. [Google Scholar] [CrossRef]
  11. Nimbalkar, P.R.; Khedkar, M.A.; Chavan, P.V.; Bankar, S.B. Biobutanol production using pea pod waste as substrate: Impact of drying on saccharification and fermentation. Renew. Energy 2018, 117, 520–529. [Google Scholar] [CrossRef] [Green Version]
  12. Xia, H.; Houghton, J.A.; Clark, J.H.; Matharu, A.S. Potential Utilization of Unavoidable Food Supply Chain Wastes–Valorization of Pea Vine Wastes. ACS Sustain. Chem. Eng. 2016, 4, 6002–6009. [Google Scholar] [CrossRef]
  13. Verma, N.; Bansal, M.; Kumar, V. Pea peel waste: A lignocellulosic waste and its utility in cellulase production BY Trichoderma reesei under solid state cultivation. BioResources 2011, 6, 1505–1519. [Google Scholar] [CrossRef]
  14. Li, J.; Dai, J.; Liu, G.; Zhang, H.; Gao, Z.; Fu, J.; He, Y.; Huang, Y. Biochar from microwave pyrolysis of biomass: A review. Biomass Bioenergy 2016, 94, 228–244. [Google Scholar] [CrossRef]
  15. Motasemi, F.; Afzal, M.T. A review on the microwave-assisted pyrolysis technique. Renew. Sustain. Energy Rev. 2013, 28, 317–330. [Google Scholar] [CrossRef]
  16. Gezae, A.; Chandraratne, M. Biochar Production from Biomass Waste-Derived Material. In Encyclopedia of Renewable and Sustainable Materials; Hashmi, S., Choudhury, I.A., Eds.; Elsevier: Amsterdam, The Netherlands, 2020; Volume 4, pp. 370–378. ISBN 9780128131961. [Google Scholar]
  17. Kung, C.-C.; Mu, J.E. Prospect of China’s renewable energy development from pyrolysis and biochar applications under climate change. Renew. Sustain. Energy Rev. 2019, 114, 109343. [Google Scholar] [CrossRef]
  18. Fodah, A.E.M.; Ghosal, M.K.; Behera, D. Bio-oil and biochar from microwave-assisted catalytic pyrolysis of corn stover using sodium carbonate catalyst. J. Energy Inst. 2021, 94, 242–251. [Google Scholar] [CrossRef]
  19. Ge, S.; Yek, P.N.Y.; Cheng, Y.W.; Xia, C.; Mahari, W.A.W.; Liew, R.K.; Peng, W.; Yuan, T.Q. Progress in microwave pyrolysis conversion of agricultural waste to value-added biofuels: A batch to continuous approach. Renew. Sustain. Energy Rev. 2021, 135, 110148. [Google Scholar] [CrossRef]
  20. Zein, S.H.; Asenso, B.; Skoulou, V.K. Nanocarbons from Acid pre-treated Waste Coffee Grounds using Microwave Radiation. Mater. Lett. 2017, 193, 46–49. [Google Scholar] [CrossRef]
  21. Touhami, D.; Zhu, Z.; Balan, W.S.; Janaun, J.; Haywood, S.; Zein, S. Characterization of rice husk-based catalyst prepared via conventional and microwave carbonization. J. Environ. Chem. Eng. 2017, 5, 2388–2394. [Google Scholar] [CrossRef]
  22. Kwoczynski, Z.; Čmelík, J. Characterization of biomass wastes and its possibility of agriculture utilization due to biochar production by torrefaction process. J. Clean. Prod. 2020, 280, 124302. [Google Scholar] [CrossRef]
  23. Khiari, B.; Jeguirim, M.; Limousy, L.; Bennici, S. Biomass derived chars for energy applications. Renew. Sustain. Energy Rev. 2019, 108, 253–273. [Google Scholar] [CrossRef]
  24. Villota, E.M.; Lei, H.; Qian, M.; Yang, Z.; Villota, S.M.A.; Zhang, Y.; Yadavalli, G. Optimizing Microwave-Assisted Pyrolysis of Phosphoric Acid-Activated Biomass: Impact of Concentration on Heating Rate and Carbonization Time. ACS Sustain. Chem. Eng. 2018, 6, 1318–1326. [Google Scholar] [CrossRef]
  25. Gámiz, B.; Hall, K.; Spokas, K.A.; Cox, L. Understanding Activation Effects on Low-Temperature Biochar for Optimization of Herbicide Sorption. Agronomy 2019, 9, 588. [Google Scholar] [CrossRef]
  26. Foong, S.Y.; Liew, R.K.; Yang, Y.; Cheng, Y.W.; Yek, P.N.Y.; Mahari, W.A.W.; Lee, X.Y.; Han, C.S.; Vo, D.V.N.; Van Le, Q.; et al. Valorization of biomass waste to engineered activated biochar by microwave pyrolysis: Progress, challenges, and future directions. Chem. Eng. J. 2020, 389, 124401. [Google Scholar] [CrossRef]
  27. Waudby, H.; Zein, S.H. A circular economy approach for industrial scale biodiesel production from palm oil mill effluent using microwave heating: Design, simulation, techno-economic analysis and location comparison. Process Saf. Environ. Prot. 2021, 148, 1006–1018. [Google Scholar] [CrossRef]
  28. Thoppil, Y.; Zein, S.H. Techno-economic analysis and feasibility of industrial-scale biodiesel production from spent coffee grounds. J. Clean. Prod. 2021, 307, 127113. [Google Scholar] [CrossRef]
  29. Stella Mary, G.; Sugumaran, P.; Niveditha, S.; Ramalakshmi, B.; Ravichandran, P.; Seshadri, S. Production, characterization and evaluation of biochar from pod (Pisum sativum), leaf (Brassica oleracea) and peel (Citrus sinensis) wastes. Int. J. Recycl. Org. Waste Agric. 2016, 5, 43–53. [Google Scholar] [CrossRef]
  30. Müsellim, E.; Tahir, M.H.; Ahmad, M.S.; Ceylan, S. Thermokinetic and TG/DSC-FTIR study of pea waste biomass pyrolysis. Appl. Therm. Eng. 2018, 137, 54–61. [Google Scholar] [CrossRef]
  31. Tadda, M.A.; Ahsan, A.; Shitu, A.; ElSergany, M.; Arunkumar, T.; Jose, B.; Razzaque, M.A.; Daud, N.N.N. A review on activated carbon: Process, application and prospects. J. Adv. Civ. Eng. Pract. Res. 2016, 2, 7–13. [Google Scholar]
  32. Cukierman, A.L. Development and Environmental Applications of Activated Carbon Cloths. ISRN Chem. Eng. 2013, 2013, 261523. [Google Scholar] [CrossRef]
  33. Zhou, J.; Luo, A.; Zhao, Y. Preparation and characterisation of activated carbon from waste tea by physical activation using steam. J. Air Waste Manag. Assoc. 2018, 68, 1269–1277. [Google Scholar] [CrossRef] [PubMed]
  34. Garcia-Garcia, G.; Stone, J.; Rahimifard, S. Opportunities for waste valorisation in the food industry—A case study with four UK food manufacturers. J. Clean. Prod. 2019, 211, 1339–1356. [Google Scholar] [CrossRef]
  35. Tomczyk, A.; Sokołowska, Z.; Boguta, P. Biochar physicochemical properties: Pyrolysis temperature and feedstock kind effects. Rev. Environ. Sci. Bio. Technol. 2020, 19, 191–215. [Google Scholar] [CrossRef]
  36. Huang, Y.-F.; Chiueh, P.-T.; Lo, S.-L. A review on microwave pyrolysis of lignocellulosic biomass. Sustain. Environ. Res. 2016, 26, 103–109. [Google Scholar] [CrossRef]
  37. Kostas, E.T.; Beneroso, D.; Robinson, J.P. The application of microwave heating in bioenergy: A review on the microwave pretreatment and upgrading technologies for biomass. Renew. Sustain. Energy Rev. 2017, 77, 12–27. [Google Scholar] [CrossRef]
  38. Liu, H.; E, J.; Ma, X.; Xie, C. Influence of microwave drying on the combustion characteristics of food waste. Dry. Technol. 2016, 34, 1397–1405. [Google Scholar] [CrossRef]
  39. Haque, N.; Somerville, M. Techno-Economic and Environmental Evaluation of Biomass Dryer. Procedia Eng. 2013, 56, 650–655. [Google Scholar] [CrossRef]
  40. Bai, X.; Wang, G.; Yu, Y.; Wang, D.; Wang, Z. Changes in the physicochemical structure and pyrolysis characteristics of wheat straw after rod-milling pretreatment. Bioresour. Technol. 2018, 250, 770–776. [Google Scholar] [CrossRef]
  41. Kalita, E. Recent Trends in the Pretreatment of Lignocellulosic Biomass for Value-Added Products. Front. Energy Res. 2018, 6, 141. [Google Scholar]
  42. Rehman, A.; Gulfraz, M.; Raja, G.K.; Haq, M.U.; Anwar, Z. A Comprehensive Approach to Utilize an Agricultural Pea peel (Pisum sativum) Waste as a Potential Source for Bio-ethanol Production. Rom. Biotechnol. Lett. 2015, 20, 10422–10430. [Google Scholar]
  43. Zhang, B.; Xiu, S.; Shahbazi, G. Microwave-Assisted Pyrolysis Oil: Process, Characterization, and Fractionation; Nova Science Publishers, Inc.: New York, NY, USA, 2012; pp. 131–143. [Google Scholar]
  44. Wu, C.; Budarin, V.L.; Gronnow, M.J.; De Bruyn, M.; Onwudili, J.A.; Clark, J.H.; Williams, P. Conventional and microwave-assisted pyrolysis of biomass under different heating rates. J. Anal. Appl. Pyrolysis 2014, 107, 276–283. [Google Scholar] [CrossRef]
  45. Miura, M.; Kaga, H.; Tanaka, S.; Takahashi, K.; Ando, K. Rapid microwave pyrolysis of wood. J. Chem. Eng. Jpn. 2000, 33, 299–302. [Google Scholar] [CrossRef]
  46. Ethaib, S.; Omar, R.; Kamal, S.M.M.; Awang Biak, D.R.; Zubaidi, S.L. Microwave-Assisted Pyrolysis of Biomass Waste: A Mini Review. Processes 2020, 8, 1190. [Google Scholar] [CrossRef]
  47. Zhao, X.; Wang, M.; Liu, H.; Zhao, C.; Ma, C.; Song, Z. Effect of temperature and additives on the yields of products and microwave pyrolysis behaviors of wheat straw. J. Anal. Appl. Pyrolysis 2013, 100, 49–55. [Google Scholar] [CrossRef]
  48. Doucet, J.; Laviolette, J.P.; Farag, S.; Chaouki, J. Distributed Microwave Pyrolysis of Domestic Waste. Waste Biomass Valorization 2014, 5, 1–10. [Google Scholar] [CrossRef]
  49. Chen, T.; Liu, R.; Scott, N.R. Characterization of energy carriers obtained from the pyrolysis of white ash, switchgrass and corn stover—Biochar, syngas and bio-oil. Fuel Process. Technol. 2016, 142, 124–134. [Google Scholar] [CrossRef]
  50. Srinophakun, T.; Hansirisawat, P. Techno-Economic of 100 kW Power Plant from Microwave-Assisted Biodiesel Pyrolysis. Int. J. Renew. Energy Res. 2020, 10, 1021–1030. [Google Scholar]
  51. Johnston, K. The Production, Characterization, and Upgrading of Biochars into Activated Carbon; The Honors College University of Maine: Orono, ME, USA, 2018. [Google Scholar]
  52. Azargohar, R.; Dalai, A.K. Steam and KOH activation of biochar: Experimental and modeling studies. Microporous Mesoporous Mater. 2008, 110, 413–421. [Google Scholar] [CrossRef]
  53. Del Campo, B.G. Production of Activated Carbon from Fast Pyrolysis Biochar and the Detoxification of Pyrolytic Sugars for Ethanol Fermentation. Ph.D. Thesis, Iowa State University, Ames, IA, USA, 2015. [Google Scholar]
  54. Gebreegziabher, T.; Oyedun, A.O.; Hui, C.W. Optimum biomass drying for combustion—A modeling approach. Energy 2013, 53, 67–73. [Google Scholar] [CrossRef]
  55. Sinnott, R.K.L.; Towler, G. Chemical Engineering Design, 6th ed.; Elsevier: Amsterdam, The Netherlands, 2019. [Google Scholar]
  56. Tumuluru, J.S.; Heikkila, D. Biomass Grinding Process Optimization Using Response Surface Methodology and a Hybrid Genetic Algorithm. Bioengineering 2019, 6, 12. [Google Scholar] [CrossRef]
  57. Newbolt, G.S. Modelling of Biomass Milling. Ph.D. Thesis, University of Nottingham, Nottingham, UK, 2018. [Google Scholar]
  58. Mohammed, I.Y.; Abakr, Y.A.; Kazi, F.K.; Yusuf, S. Effects of Pretreatments of Napier Grass with Deionized Water, Sulfuric Acid and Sodium Hydroxide on Pyrolysis Oil Characteristics. Waste Biomass Valorization 2017, 8, 755–773. [Google Scholar] [CrossRef]
  59. Hung, J. The Production of Activated Carbon from Coconut Shells Using Pyrolysis and Fluidized Bed Reactors. Bachelor’s Thesis, The University of Arizona, Tucson, AZ, USA, 2012. [Google Scholar]
  60. Papari, S.; Hawboldt, K. A review on condensing system for biomass pyrolysis process. Fuel Process. Technol. 2018, 180, 1–13. [Google Scholar] [CrossRef]
  61. Shackley, S.; Hammond, J.; Gaunt, J.; Ibarrola, R. The feasibility and costs of biochar deployment in the UK. Carbon Manag. 2011, 2, 335–356. [Google Scholar] [CrossRef] [Green Version]
  62. Legg, R. Chapter 1—Properties of Humid Air. In Air Conditioning System Design; Butterworth-Heinemann: Oxford, UK, 2017; pp. 1–28. [Google Scholar]
Figure 1. Overall process flow diagram of production of AC from PW.
Processes 10 01702 g001
Figure 2. Cash flow diagram.
Processes 10 01702 g002
Figure 3. Net present value profile against varying discount rates for sensitivity analysis.
Processes 10 01702 g003
Table 1. Chemical activation process parameters for MAP.
Activation Process ParametersReference
Activating Agents Phosphoric Acid (H3PO4)
Activation agent to biochar ratio 1:2 [52]
Activation temperature (°C)300–600 [51]
Activation time (min)5–20[24,53]
Table 2. Equipment list summary for the process including operating conditions.
Equipment DescriptionOperating Conditions
C-101Compressor To be used for non-condensable gases
CO-101Condenser To be used bio-oil (unrefined); 30 °C; 1 bara (close to atmospheric conditions)
E-101TEMA shell and tube -Heat exchanger LP steam. Inlet: 650 °C; Outlet: 322 °C; Pressure: 1 Bar; 249.7 kg/h Air (for dryer); Inlet: 20 °C; Outlet: 210 °C; Pressure: 1.2 Bar; 5129.66 kg/hr (Values calculated using Tube-Shell Heat Excanger Design Calculation Software);
E-102CoolerCooler required after miller operation
Cooled to 121 °C; 1 bara
E-103HeaterHeater for H2SO4; Heated to 120 °C
E-104HeaterNitrogen heated from 50 °C to reaction temperature
E-105HeaterReactants heated to 300 °C; 1.5 bara
E-106CoolerProducts heated after reactor for separation; Heated to 350 °C
E-107HeaterHeated to 550 °C for activating reaction temperature
E-108CoolerExtractor temperature. 200 °C; 2 bara
E-109CoolerCarbon washing temperature. 80 °C
M-101Mixer Chemical pre-treatment process. 121°C; 1.5 bara
M-102MixerMixer for reactant, including inert nitrogen. 150 °C; 1.5 bara
P-101PumpIncrease the pressure of H2SO4 for the mixer to 1.5 bara from atmospheric pressure
P-102Pump Increase the pressure of nitrogen for the mixer to 1.5 bara from atmospheric pressure
P-103PumpIncrease the pressure for extractor operation
R-101MAP reactor Fluidised bed reactor Voidage = 0.8; Catalyst = Graphite; 300 °C; 500 W (microwave power); 1.5 bara
R-102Reactor Fixed bed Activating unit: Allows for impregnation of H3PO4 into biochar. 550 °C; 1 bara
TK-101Pea waste tank storage 20 °C; 1 bara
TK-102Tank for H2SO4Dilute H2SO41.5% wt.
TK-103Tank Tank Holding Nitrogen. Atmospheric conditions
TK-104Tank Calcium oxide tank; Microwave absorber; Does not take part in reactions
TK-105TankActivating agent. 85 wt.% H3PO4; 15 wt.% water; 50% of biochar feed flow rat; Atmospheric conditions
TK-105TankUnrefined bio-oil (tar also possibly present). 30 °C; 1 bara
TK-107TankKOH tank. 10 wt.% KOH; 90 wt.% water; Mass flowrate at 3 times the AC flowrate
TK-108Tank Final activated carbon tank
TK-109TankBiogas in gas storage
V-101Rotary dryer Air dryer. Removes water content to leave 1% moisture content for dry feedstock. 210 °C; 1.5 bara
V-102Miller/Grinder Dryer outlet conditions. Atmospheric pressure
V-103Extractor2 bara
V-104Cyclone Solid separator. 350 °C
V-105Quenching tower50 °C; 1 bara
V-106Extractor2 bara; 80 °C
V-107Vessel Carbon washing. 80 °C
V-108Filter50 °C; 1 bara
V-109Dryer Air Dryer. 1 bara; 50 °C
Table 3. Material balance across the process for Activated carbon from pea.
Stream no.
Components1234567891011121314151617181920212223242526272829
Raw Feed PW1260 1260 1260 12601260
Nitrogen 252.5605252.5605 2.525605250.03492.5256052.5003490.025256
Water183.299 249.7427.512.83093101.8265114.6574112.36432.2931482.293148 2.293148 2.2931480.0229312.270217 32.9096332.9096331.264141.6454811202.5181202.5181142.39260.12588 58.923371.202518
Biochar 441 2.205 2.205438.795 438.7954.38795434.4071
Bio-oil 441 4412.205438.795
Biogas 378 378376.111.89
Potassium Hydroxide 133.6131133.6131126.93246.680654 0.5344520.133613
Phosphoric Acid 186.4879186.4879177.16359.324394 9.3243948.8581740.46622 0.4568950.009324
Sulphuric Acid 25.4566225.4566224.947490.5091320.509132 0.509132 0.5091320.0050910.504041
Calcium Oxide 126.2802
Activated Carbon 434.40712.172035432.235 432.235
Air 22056.21 2948.6352948.635
Total (kg/hr)1443.29922056.21249.7427.51272.831127.28311400.114137.31171262.8021515.363252.5605126.28021265.328250.0349826.5329380.8434445.6895438.795219.3975658.1925212.8156445.37691336.1311779.8621280.354499.50782948.6353008.55433.5805
Temperature (°C)205012521020020121121121121121253003003505050550251001008030808050503535
Pressure (bara)111.31.51.51221.51.5111.51.5121111221111111
Table 4. Estimated production of plant and assumptions.
ParametersLevel
Plant Running Hours
Scheduled hours per year8000
Scheduled operating hours per day22
Feedstock requirement
Initial feedstock of PW (tonne/yr)10,080
Product Yields (% of Prepared Feedstock Weight)
Bio-oil35
Biochar35
Biogas30
Estimated Production (tonne/yr)
Bio-oil production3565.516
AC production3468.644
Biogas production3046.747
Table 5. Total capital investment summary (CAPEX).
Cost Parameters Cost (GBP)Reference/Assumptions
Inside Battery Limits (ISBL)GBP 49,730,603.44Bridgewater equation
Offsite Battery Limits (OSBL)GBP 19,892,241.38Based on 40% of ISBL
Engineering and Construction Cost GBP 6,962,284.48Based on 10% of the direct capital cost (ISBL + OSBL).
Contingency Charges GBP 6,962,284.48Based on 10% of the direct capital cost (ISBL + OSBL).
Fixed Capital Cost GBP 83,547,413.78Sum of the inside battery limits (ISBL), the offsite battery limits (OSBL), the engineering cost, and the contingency cost.
Working Capital GBP 10,443,426.72Based on 15% of the direct capital cost (ISBL + OSBL).
Start-Up Expense GBP 6,962,284.48Based on 10% of the direct capital cost (ISBL + OSBL).
Total Capital Investment GBP 100,953,124.99Sum of fixed capital cost, working capital, and start-up expense.
Table 6. Operating Expenditure (OPEX) summary.
Cost Parameters Cost (GPB)References/Assumptions
Fixed Cost of Production Operating labour GBP 1,344,000.00UK plant operator wages
Supervision GBP 336,000.0025% of operating labour
Overhead GBP 840,000.0050% of operating labour + supervision
Maintenance GBP 2,486,530.175% of ISBL
Property taxes and insurance GBP 745,959.051.5 % of ISBL
Rent of landGBP 1,044,342.671.5% of ISBL and OSBL
General plant overheadGBP 3,254,244.6165% of operating labour, supervision, overhead, and maintenance
Environmental chargesGBP 696,228.451% of ISBL and OSBL
Variable cost of ProductionRaw materials GBP 2,212,387.62Prices from market value and forecast
Utilities GBP 225,086.3120% of revenue
Consumables GBP 393,901.0435% of revenue
Effluent disposable GBP 112,543.1510% of revenue
Packaging and shipping GBP 112,543.1510% of revenue
Table 7. Revenue summary for project.
Products Quantity (Tonne/yr.) Price Revenue
Activated Carbon3468.64GBP 100 per tonneGBP 346,864.38
Bio-oil3565.52GBP 150 per tonneGBP 534,827.42
Biogas3046.75GBP 80 per tonneGBP 243,739.76
Total Revenue GBP 1,125,431.55
Table 8. Gross margin of process.
Cost (GBP)/yr
Gross Margin 731,530.51
Total Revenue1,125,431.55
Raw Material Cost GBP 393,901.04
Publisher’s Note: MDPI stays neutral with regard to jurisdictional claims in published maps and institutional affiliations.

