Article

The Anti-Fatigue Design of 80 t Depressed-Center Gondola Car Body

1
School of Intelligent Manufacture, Taizhou University, Taizhou 318000, China
2
Baotou Beifang Chuangye Co., Ltd., Baotou 014032, China
*
Authors to whom correspondence should be addressed.
Processes 2022, 10(8), 1618; https://doi.org/10.3390/pr10081618
Submission received: 30 June 2022 / Revised: 11 August 2022 / Accepted: 12 August 2022 / Published: 16 August 2022

Abstract

:
In view of the problem that special gondola cars are generally insufficient for the actual transportation of coke, and in order to improve the transportation efficiency and reduce the transportation cost, the 80 t depressed-center gondola car for coke transportation is designed by the anti-fatigue design method in this paper. The car body with a supporting bar and the car body without a supporting bar are simulated and analyzed by the finite element method; the results show that there are stress mutations at the transition area of the two key welds, especially at the 110 mm of weld 1. The fatigue lives of the two car body schemes are evaluated by Miner linear cumulative damage theory, spectrum and S-N curve in AAR standard, and load spectrum of the Daqin line and S-N curve in BSI standard. The results show that the 80 t depressed-center gondola car body with a supporting bar is the best scheme. In addition, the fatigue damage results show that the vertical load spectrum of AAR is worse than that of the Daqin line, and the longitudinal load spectrum of the Daqin line is worse than that of AAR. This conclusion will provide a basis for an anti-fatigue design of heavy haul wagon bodies or bogies.

1. Introduction

At present, the loading capacities of special gondola cars for coke transport are mainly 60t and 70t in China [1]. Owing to the fact that coke density is relatively low, the effective volume of the coke transport gondola car is insufficient, which has led to the problem that the coke weight in the actual transportation process is less than the marked load. In addition, in order to improve coke transportation efficiency and reduce the transportation cost, it is urgent to design the gondola car with a larger loading capacity. Due to the limit of gauge and station length, the length of the coke transport gondola car cannot exceed 16.5 m. Therefore, the structure of the 80t gondola car body for coke transportation can only replace the conventional flat floor with the depressed-center floor.
At present, the research on structural design and the optimization of railway vehicles is mainly concentrated on high-speed trains [2,3,4], and the research on wagon structure is relatively less [5,6]. The research on wagons is mainly concentrated on structural static strength design, structural fatigue analysis, manufacturing process, welding process method, etc. [7,8,9,10], and the research on the anti-fatigue design of wagons is less [11,12]. The stress condition of a depressed-center structure is worse than that of a flat bottom structure, especially under the condition of a heavy load. Meanwhile, structural fatigue reliability is an important evaluation index for the safe operation of wagons. Therefore, the structure of the car body is designed from the perspective of fatigue strength evaluation.
First, the finite element simulation of the two schemes’ car bodies is carried out. According to the design experience and finite element simulation results, the key welds are determined, and the stress distribution of the key welds is analyzed. Then the fatigue lives of key positions are evaluated by using the load spectrum and S-N curve in AAR, the load spectrum of the Daqin line and the S-N curve in BSI standard. Finally, the fatigue lives at the key positions in the two car bodies are compared and analyzed, and the most reasonable and optimal scheme of the 80t depressed-center gondola car body is determined.

2. Theoretical Background

2.1. Palmgren-Miner Cumulative Damage Theory

At present, the commonly used fatigue cumulative damage theories are: Palmgren–Miner, Manson, Corten-Dolan, etc. [13,14,15], and the Palmgren–Miner theory is most widely used in fatigue damage assessment of wagons and bogies [16,17,18].
Palmgren first proposed the assumption of linear fatigue damage accumulation when estimating the life of rolling bearings. Miner formulated Palmgren’s hypothesis, which eventually resulted in the Palmgren–Miner linear cumulative damage theory. The basic assumption of the cumulative damage theory is that the damage is independent of the load history, and its mathematical expression is:
W / N = W 1 / N 1
where W is the total energy absorbed by the structure before fatigue failure, N is the total number of load cycles that the structure bears before fatigue failure, W 1 is the energy absorbed by the structure under load cycle N 1 before fatigue failure and N 1 is the number of certain load cycles that the structure bears before fatigue failure.
In practical engineering applications, the fatigue damage is mainly determined by the load frequency and load amplitude, the damages generated under different loads are independent of each other, and each damage can be accumulated. The method is Miner’s linear cumulative damage theory; then Equation (1) can be rewritten as follows:
D = i = 1 k n i N i
where D is the total fatigue damage of the structure, N i is the fatigue life of the structure at each stress level and n i is the number of cycles at each stress level.

2.2. The Fatigue Assessment Method of BSI Standard

The standard (Guide to fatigue design and assessment of steel products) [19] is the most representative of the anti-fatigue design and evaluation methods based on nominal stress. The applicable range of material yield strength corresponding to the S-N curve data provided in this standard is 200–960 MPa, which shows that the fatigue strength of welded structures is different from that of metal fatigue strength and has nothing to do with the yield strength of materials. The standard considers that although the damage to the structure is small, the small load still needs to be included in the total damage, which is relatively safe. Therefore, the S-N curve in this standard has no cut-off line, which is shown in Figure 1.
The fatigue resistance design and evaluation method of steel structures given in this standard is based on the Palmgren–Miner cumulative damage theory, and the damage ratio is defined as:
n i N i = { n i 10 7 ( Δ σ i Δ σ 0 ) m ( Δ σ i > Δ σ 0 ) n i 10 7 ( Δ σ i Δ σ 0 ) m + 2 ( Δ σ i Δ σ 0 )
where Δ σ i is the stress range, n i is the number of cycles with stress range Δ σ i in the load spectrum, N i is the total number of cycles that lead to structural damage when the stress range is Δ σ i and n i is the number of cycles at each stress level. Δ σ 0 is the stress range when the evaluation point is 1 × 10 7 , and m is the slope of the S-N curve.
According to the actual condition of the weld on the welded joint and the relationship between the load and the weld, the BSI standard provides the corresponding level of fatigue data, which also includes the requirements for the structure and process, the details of the specific welded joint and its fatigue performance parameters. The specific welding joint details and fatigue performance parameters refer to this standard.

2.3. The Fatigue Assessment Method of AAR Standard

At present, the AAR standard [20] contains a relatively complete set of wagon load spectrum and S-N curves’ parameters, and the standard gives the fatigue life evaluation method of the railway freight car. Therefore, this standard is widely used in the fatigue strength assessment of wagons in China. The theoretical basis of this standard is Miner’s cumulative damage theory. According to Miner’s hypothesis, when the cumulative damage reaches 1, it is considered that the vehicle body has suffered fatigue damage. The calculation formula is:
N i N i = 1
where N i is the number of cycles at the i-th level of stress, and N i is the total number of stress cycles when the structure fails under the i-th stress.
If N T represents the total number of cycles to failure of a component under a spectrum of loads, it is convenient to denote the fraction of the total number of cycles applied at each stress level by α . Therefore, Equation (4) can be rewritten as follows:
N T = 1 α i N i
The standard points out that the classical S-N curve is a straight line on double logarithmic graph paper between 1 × 10⁴ and 2 × 10⁶ cycles for steel, as shown in Figure 2.
where S e is the fatigue limit of the material, N e is the number of cycles for which damage occurs at stress level S e , S i is the fatigue limit calculated according to the damage of N i cycles, N i is the number of cycles where damage occurs at each stress level and K is the absolute value of the slope of the S-N curve.
According to the S-N curve, we can get the following formula:
log S i log S e log N e log N i = K
Equation (6) can be rewritten as follows:
N i = N e ( S i / S e ) 1 / K
In practice, stress range S r (or S m a x if mean stress effects are included) replaces S i , Equation (7) can be rewritten as follows:
N i = N e ( S r / S e ) 1 / K
The S e of Equation (8) can be obtained from the modified Goodman diagram, which is shown in Figure 3.
where b is the fatigue limit when R = 0, m is the slope of the Goodman curve. The two rays on both sides of the ordinate represent the fatigue limit when R = −1 and R = +1, respectively.
According to Figure 3, we can get the following formula:
S m a x = m S m i n + b
By definition, R = S m i n / S m a x , and S m a x = S e at fatigue limit, Equation (9) can be rewritten as follows:
S e = b 1 m R
From Equations (5), (8) and (10), the number of cycles for each component to reach damage can be obtained, then the life of the component is:
L = N T / β = 1 β 1 α i N i = N e b 1 / K β α i [ S m a x ( 1 m R ) ] 1 / K
where N T is the total number of cycles to reach damage, and β is the total spectrum cycles per mile.

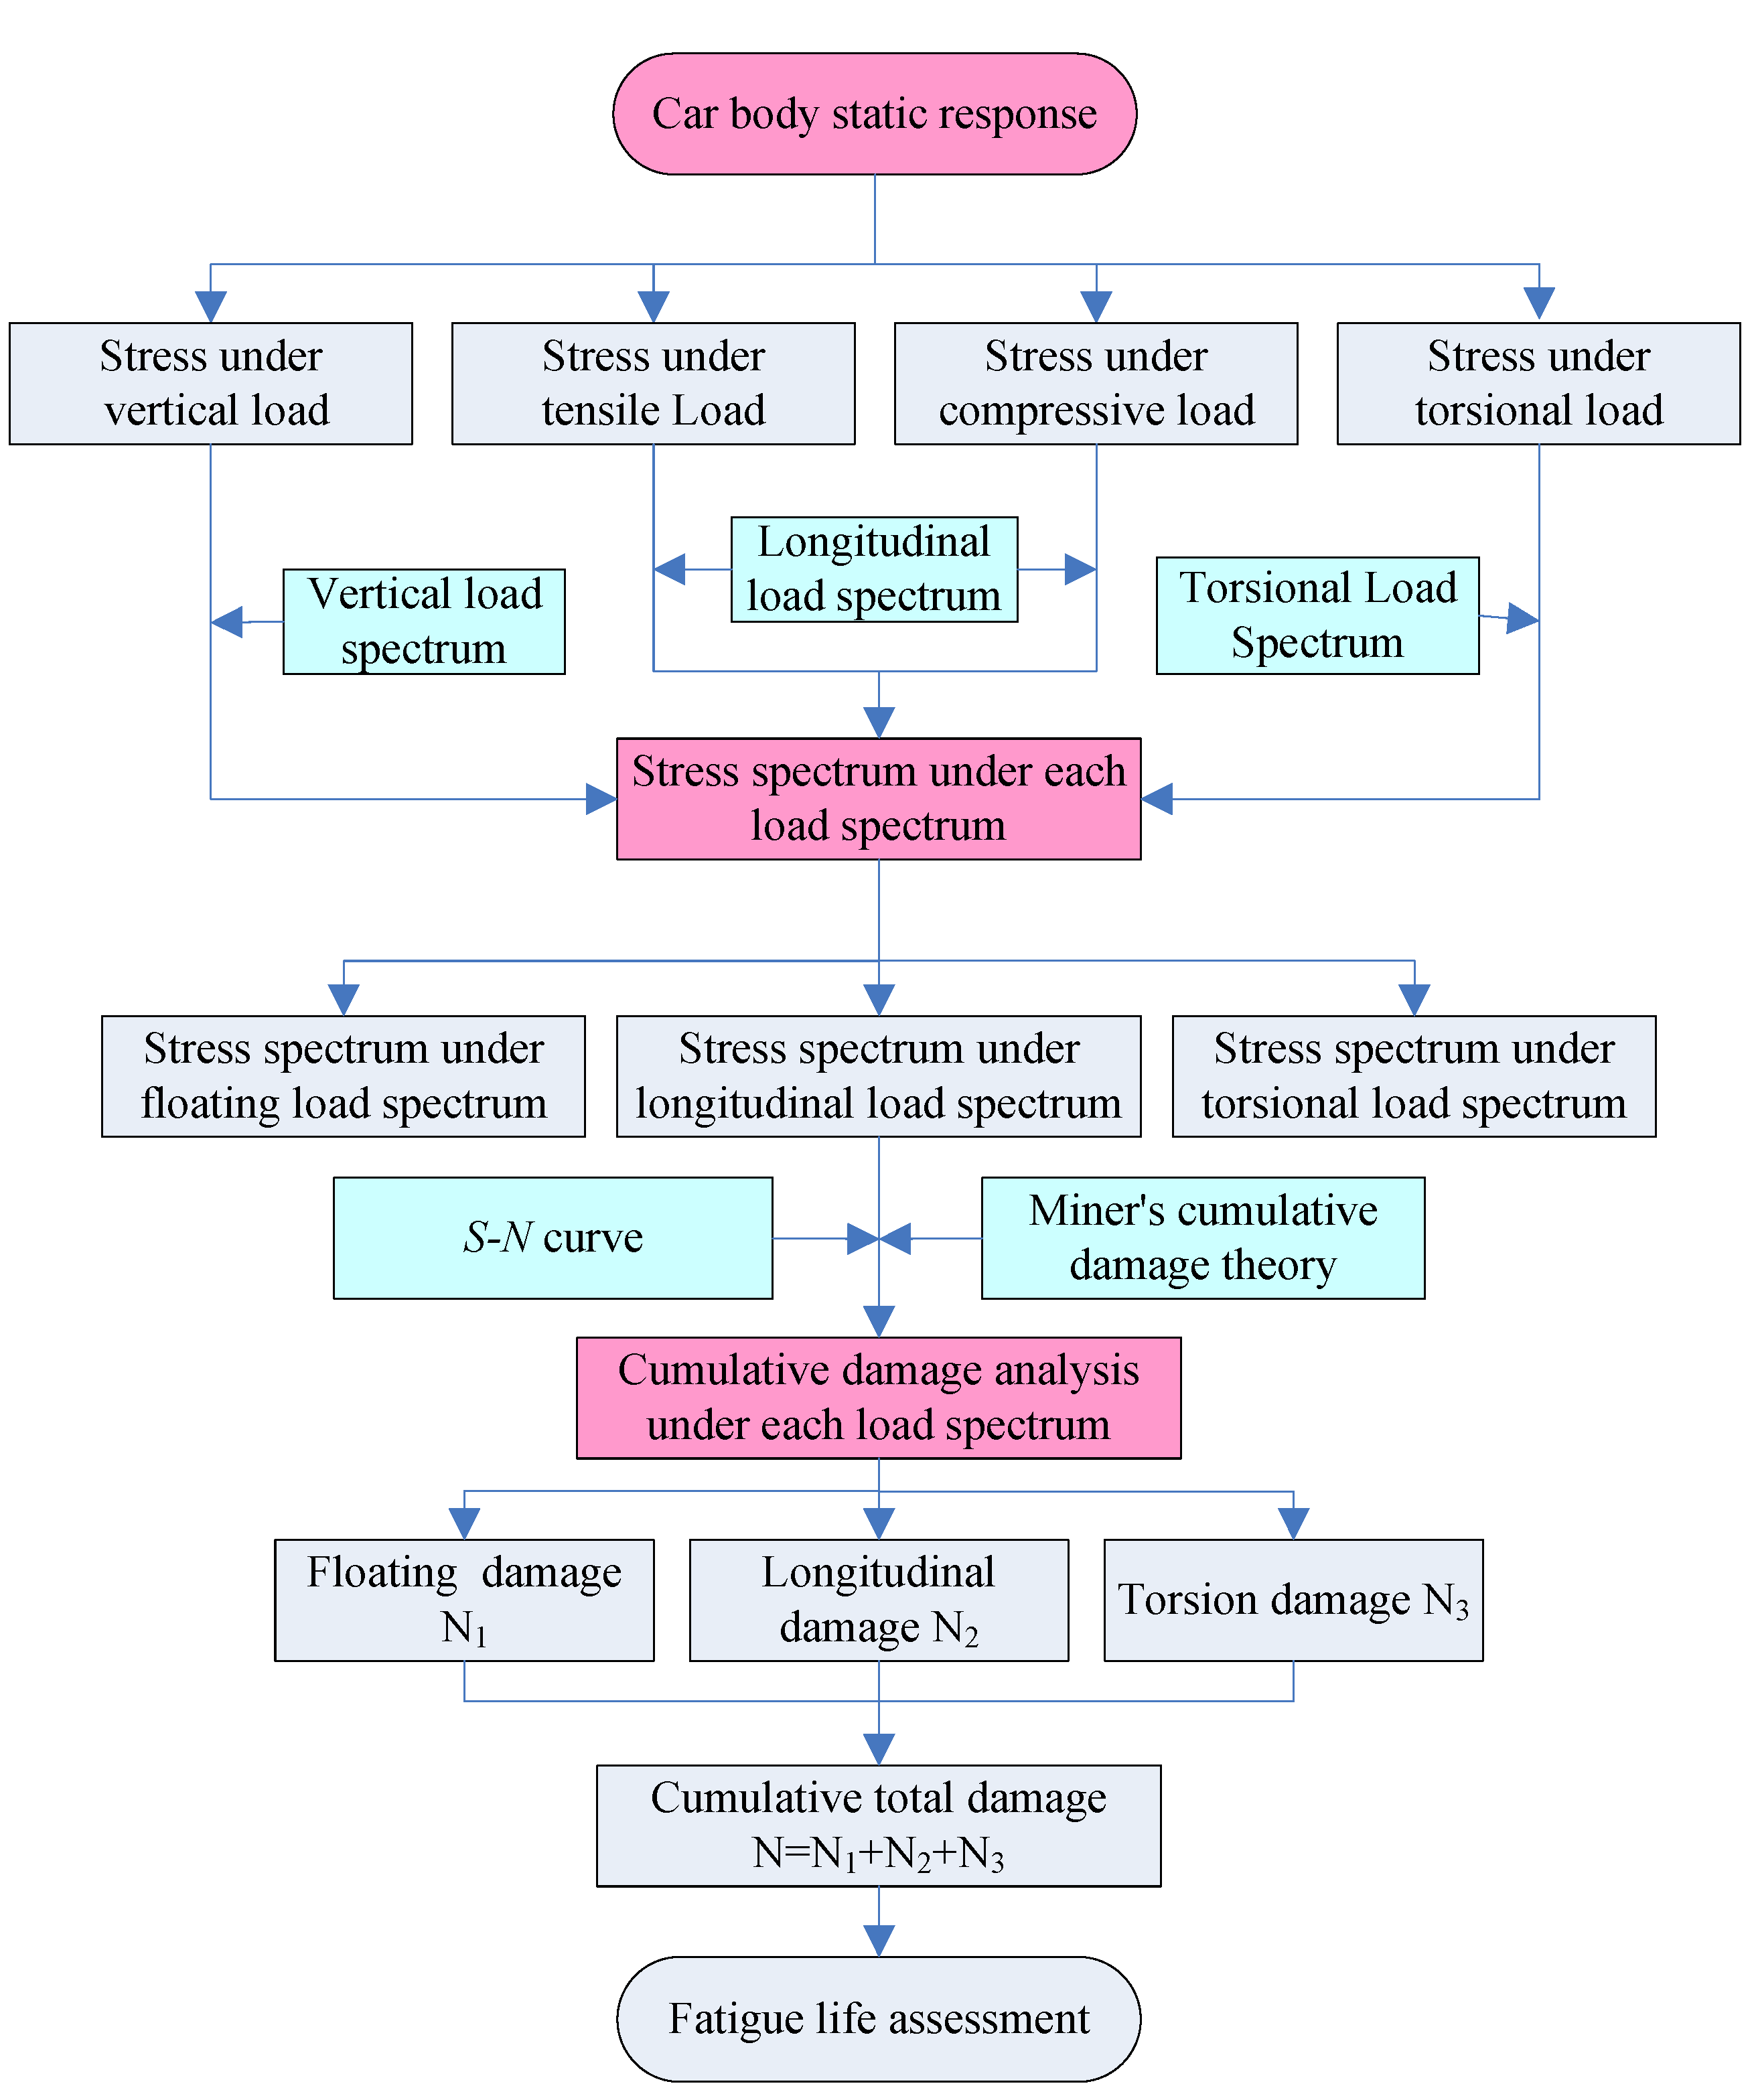
2.4. Fatigue Strength Evaluation Method Based on Load Spectrum

When the wagon body is evaluated for fatigue life, it is necessary to focus on two aspects, namely the load spectrum and the S-N curve. For comparative analysis, the load spectrum and S-N curve’s related parameters of the AAR standard are used to evaluate the fatigue strength of the key positions of the car body; then, the measured line load spectrum of China’s Daqin Line and the S-N curve’s related parameters in the BSI 7608 standard are used to evaluate the fatigue strength of the key positions of the car body. Finally, the calculation results of the two are compared and analyzed.
The calculation process of the fatigue strength evaluation is shown in Figure 4, which is described in detail as follows:
(1)
First, the car body is simulated by the finite element method.
(2)
Secondly, according to the simulation results, the vertical load spectrum, the longitudinal load spectrum, the torsion load spectrum in the AAR load spectrum and the measured load spectrum of the Daqin Line are used. The stress spectrum of each component is calculated separately from the load spectrum.
(3)
Finally, relevant parameters of the S-N curve in the AAR standard and BSI standard are adopted, and the cumulative damage is calculated by Miner’s linear cumulative damage theory.

3. Finite Element Simulation Analysis of 80 t Depressed-Center Gondola Car Body

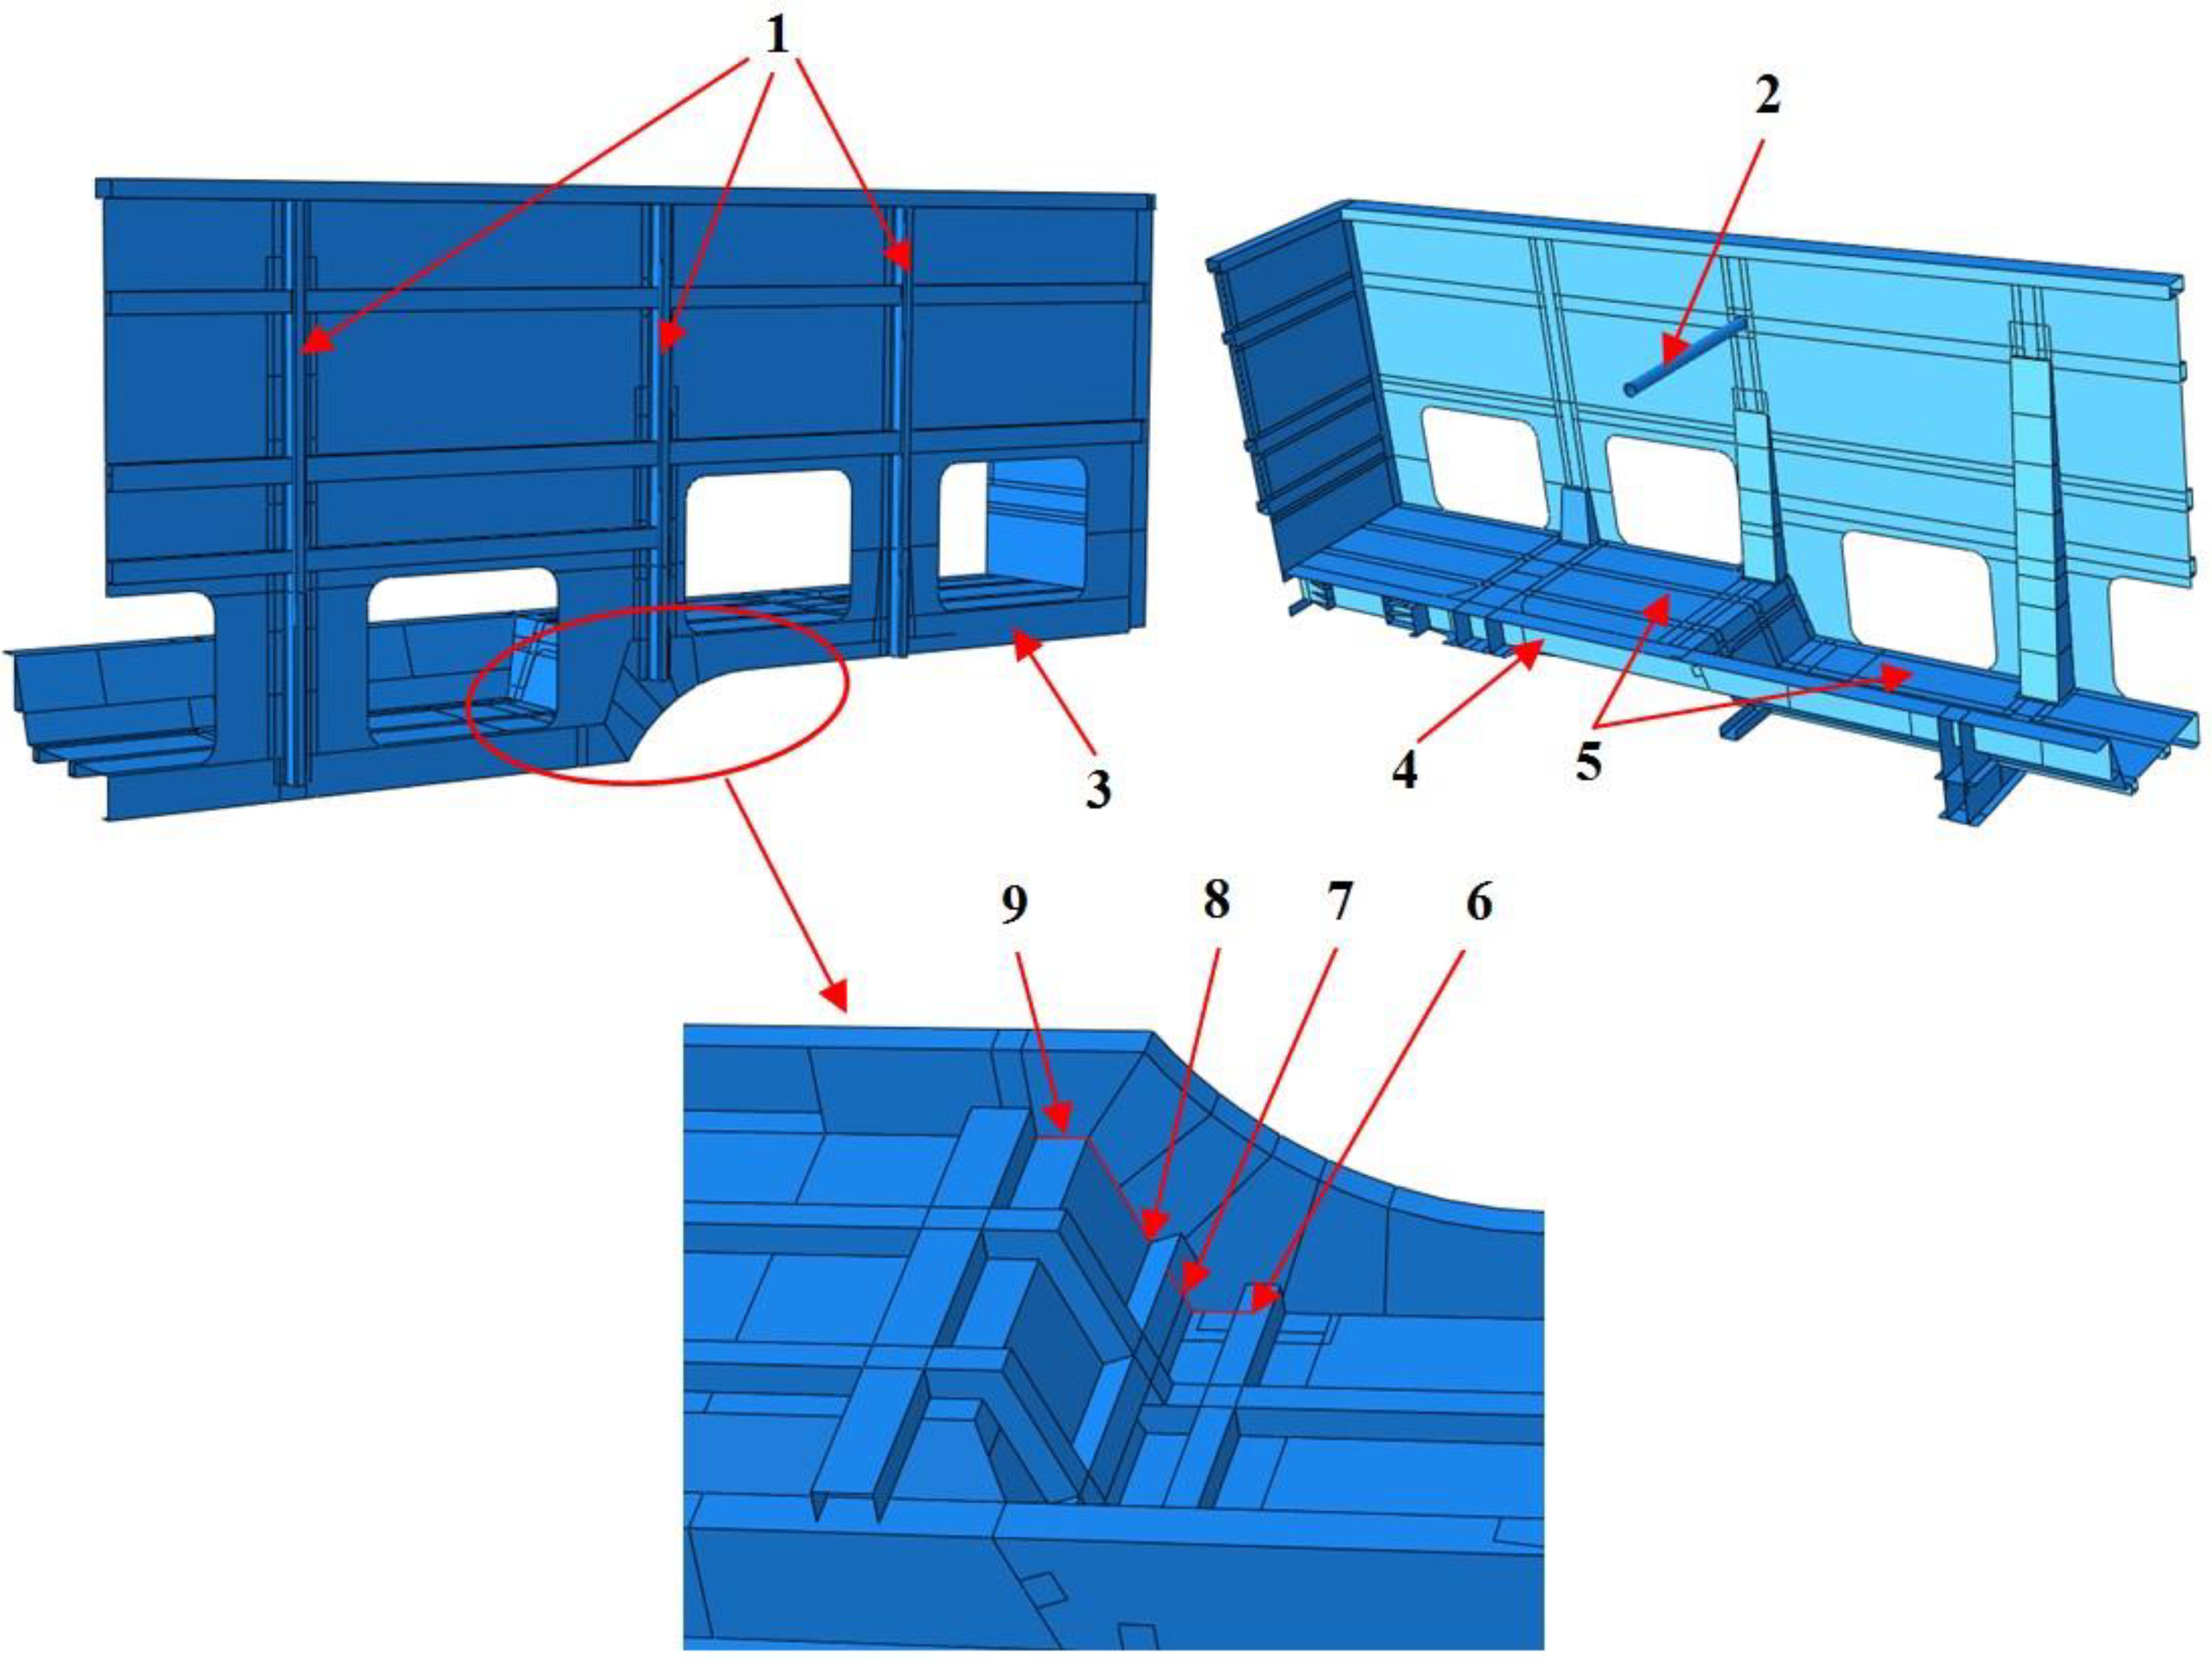
3.1. The Structure of 80 t Depressed-Center Gondola Car Body

The 80 t depressed-center gondola car is a special wagon for coke transportation. It is based on the mature experience of the existing 60t and 70t railway freight cars, combined with the rich concave-bottom flat car technology, breaking the traditional design idea of the flat-bottom gondola car, and it realizes a new leap in the product design of the coke transport series gondolas.
The gondola depressed-center car body is an all-steel welded structure with Q450NQR1, which consists of the underframe, side wall, end wall and lower side door. Due to the limitation of car body length and volume, the underframe needs to abandon the traditional central beam structure and can only use the depressed-center structure to achieve the purpose of heavy-duty transportation. It is completely symmetrical about the transverse center plane and the longitudinal center plane; the 1/4 car body is shown in Figure 5.
According to the design experience, the stress state of the underframe is the most complex and bad, especially in the two corner transition areas. Therefore, we focus on the two welds at the transition position of the underframe. For easy description, the fillet transition weld between the side sill and the floor that is far from the center of the car body is defined as weld 1; the fillet transition weld between the side sill and the floor that is close to the center of the car body is defined as weld 2, both of which are shown in Figure 5. In addition, due to the high height of the car body, it requires high stiffness of the side wall, which leads to the stress of the underframe to be worse. Therefore, we give two car body schemes: the car body without a supporting bar (scheme 1) and the car body with a supporting bar (scheme 2).

3.2. Finite Element Model and Loading Method

The thickness of each plate is much smaller than the length, width and height of the car body so the shell element can be used for finite element simulation. The finite element model of the car body is shown in Figure 6; the mesh is refined on the part connected by welds 1 and 2.
The load and loading method can refer to TB/T1335-1996 [21]. The stresses of the two welds are very small under torsion conditions. Therefore, it is only considered that the stress is studied under vertical and longitudinal conditions in this paper. The vertical force of the gondola car body is 1025 kN, and the car body is loaded with a stretch force of 1780 kN and a compression force of 1920 kN.

3.3. Research on Stress Distribution of the Two Key Welds
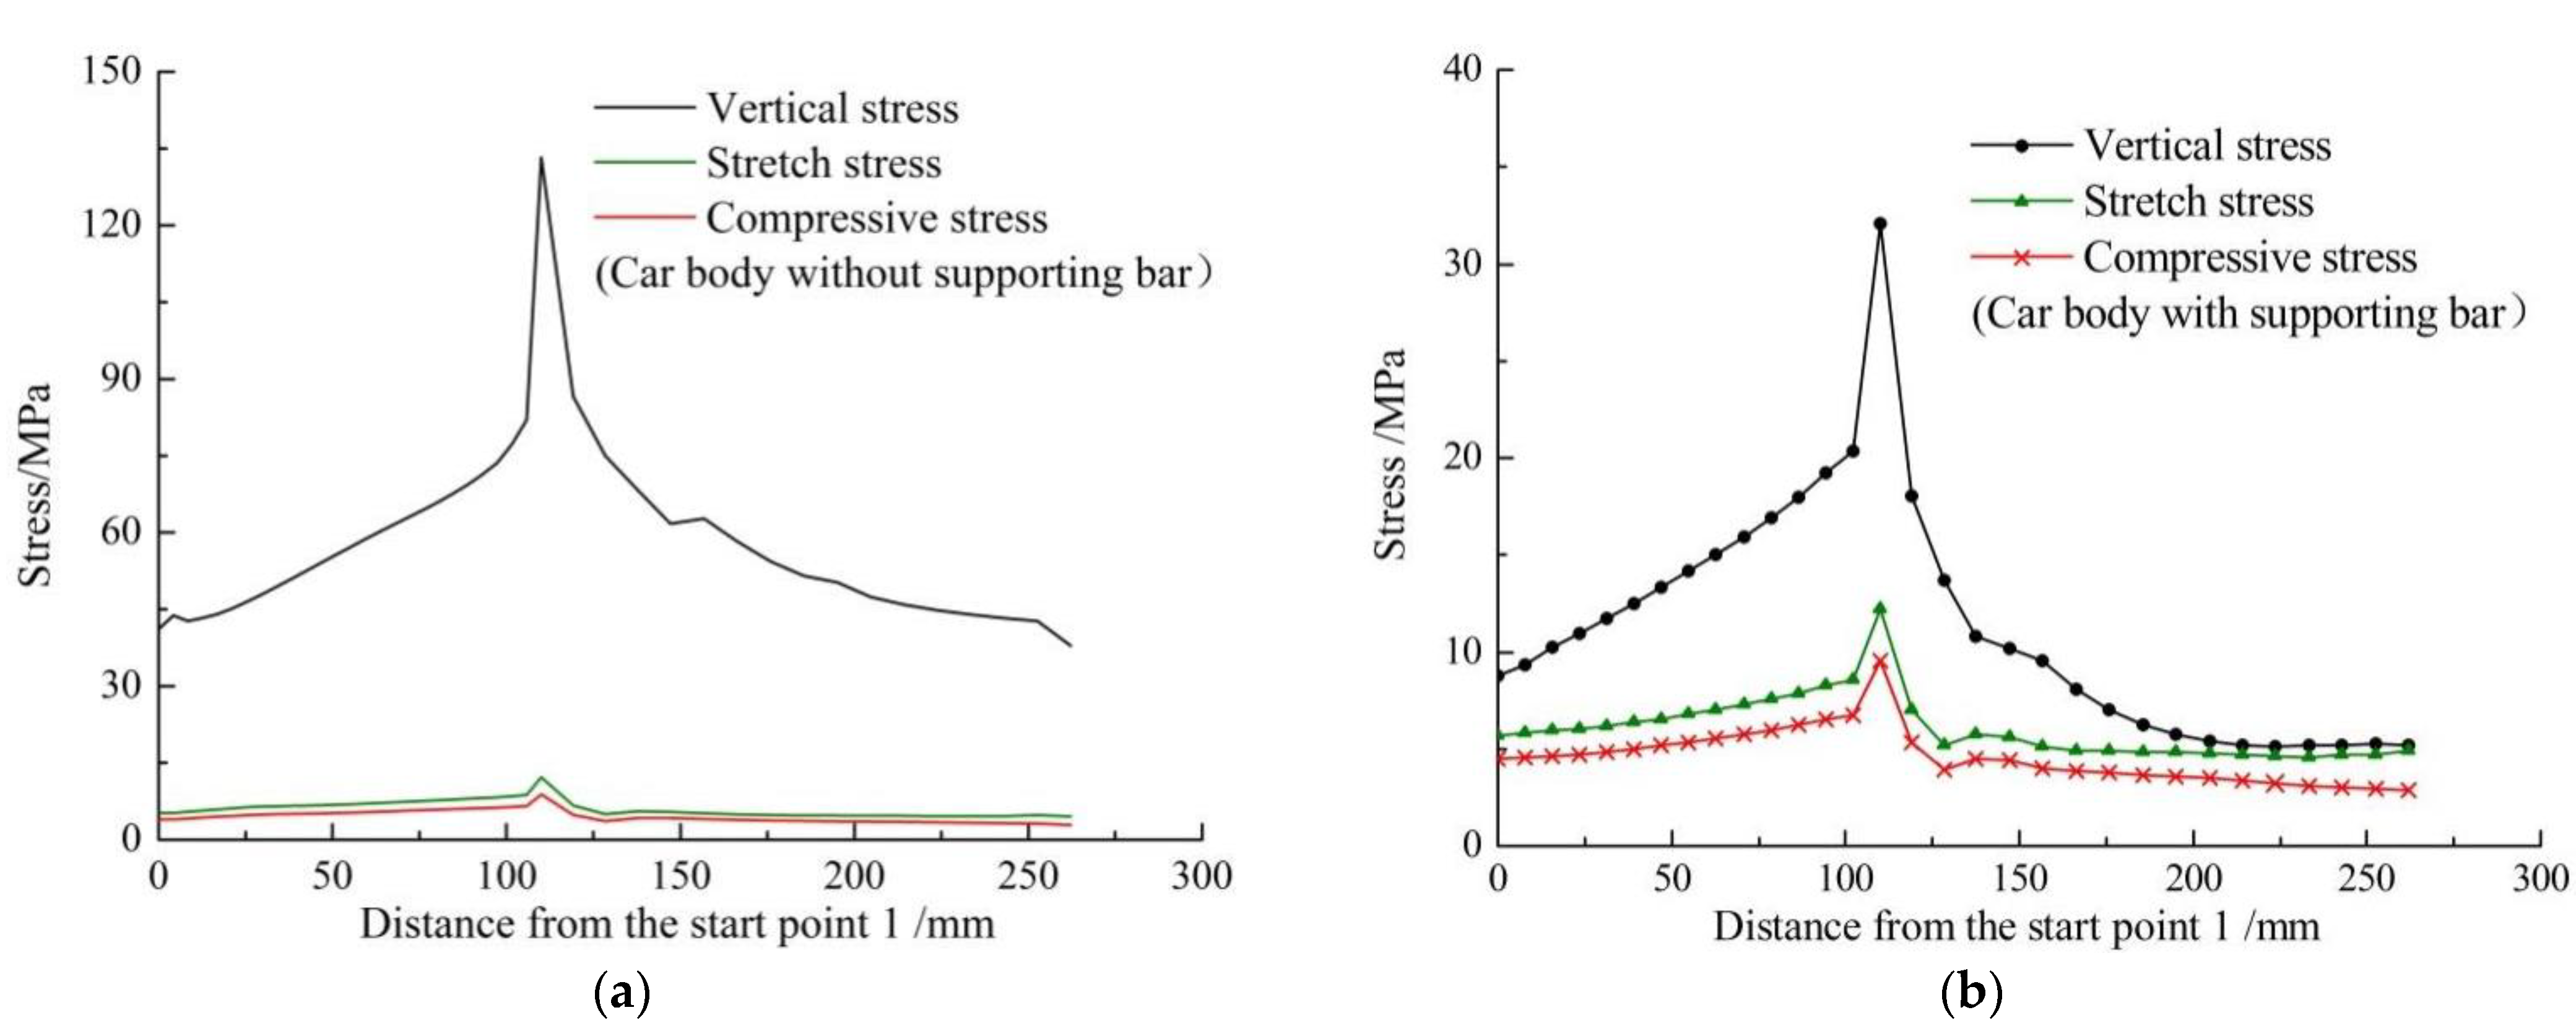
According to the simulation results of the two car body schemes, the stresses of the two welds are extracted, and the stress distribution under each condition is shown in Figure 7 and Figure 8. According to Figure 7, The following conclusions can be drawn:
(1)
On the whole, the changing trend of stress under each condition is basically the same in the two car body schemes. The stress under the vertical condition is higher than that under longitudinal condition, and the stress values are basically the same under corresponding stretch load and compressive load. The maximum stress of each condition appears at 110 mm.
(2)
Under the vertical condition, the stresses in Figure 7a are much higher than that in Figure 7b, especially when the stress value reaches 134 MPa at 110 mm in Figure 7a. The root cause of this phenomenon is that a supporting bar is added in scheme 2 compared with scheme 1, which greatly reduces the deformation and outward stress of the side wall and improves the stress state of weld 1. This phenomenon shows the importance of the supporting bar to improve the stiffness of the large side wall and the stress of the whole car body.
(3)
Under the longitudinal condition, the overall trend of the stress distribution is relatively smooth in the two schemes; the stress in scheme 2 is slightly greater than that in scheme 1. The stress (12 MPa) under the stretch load in scheme 2 is the highest, and the stresses under other conditions are lower than 10 MPa. Therefore, the longitudinal force has little contribution to the stress of weld 1.
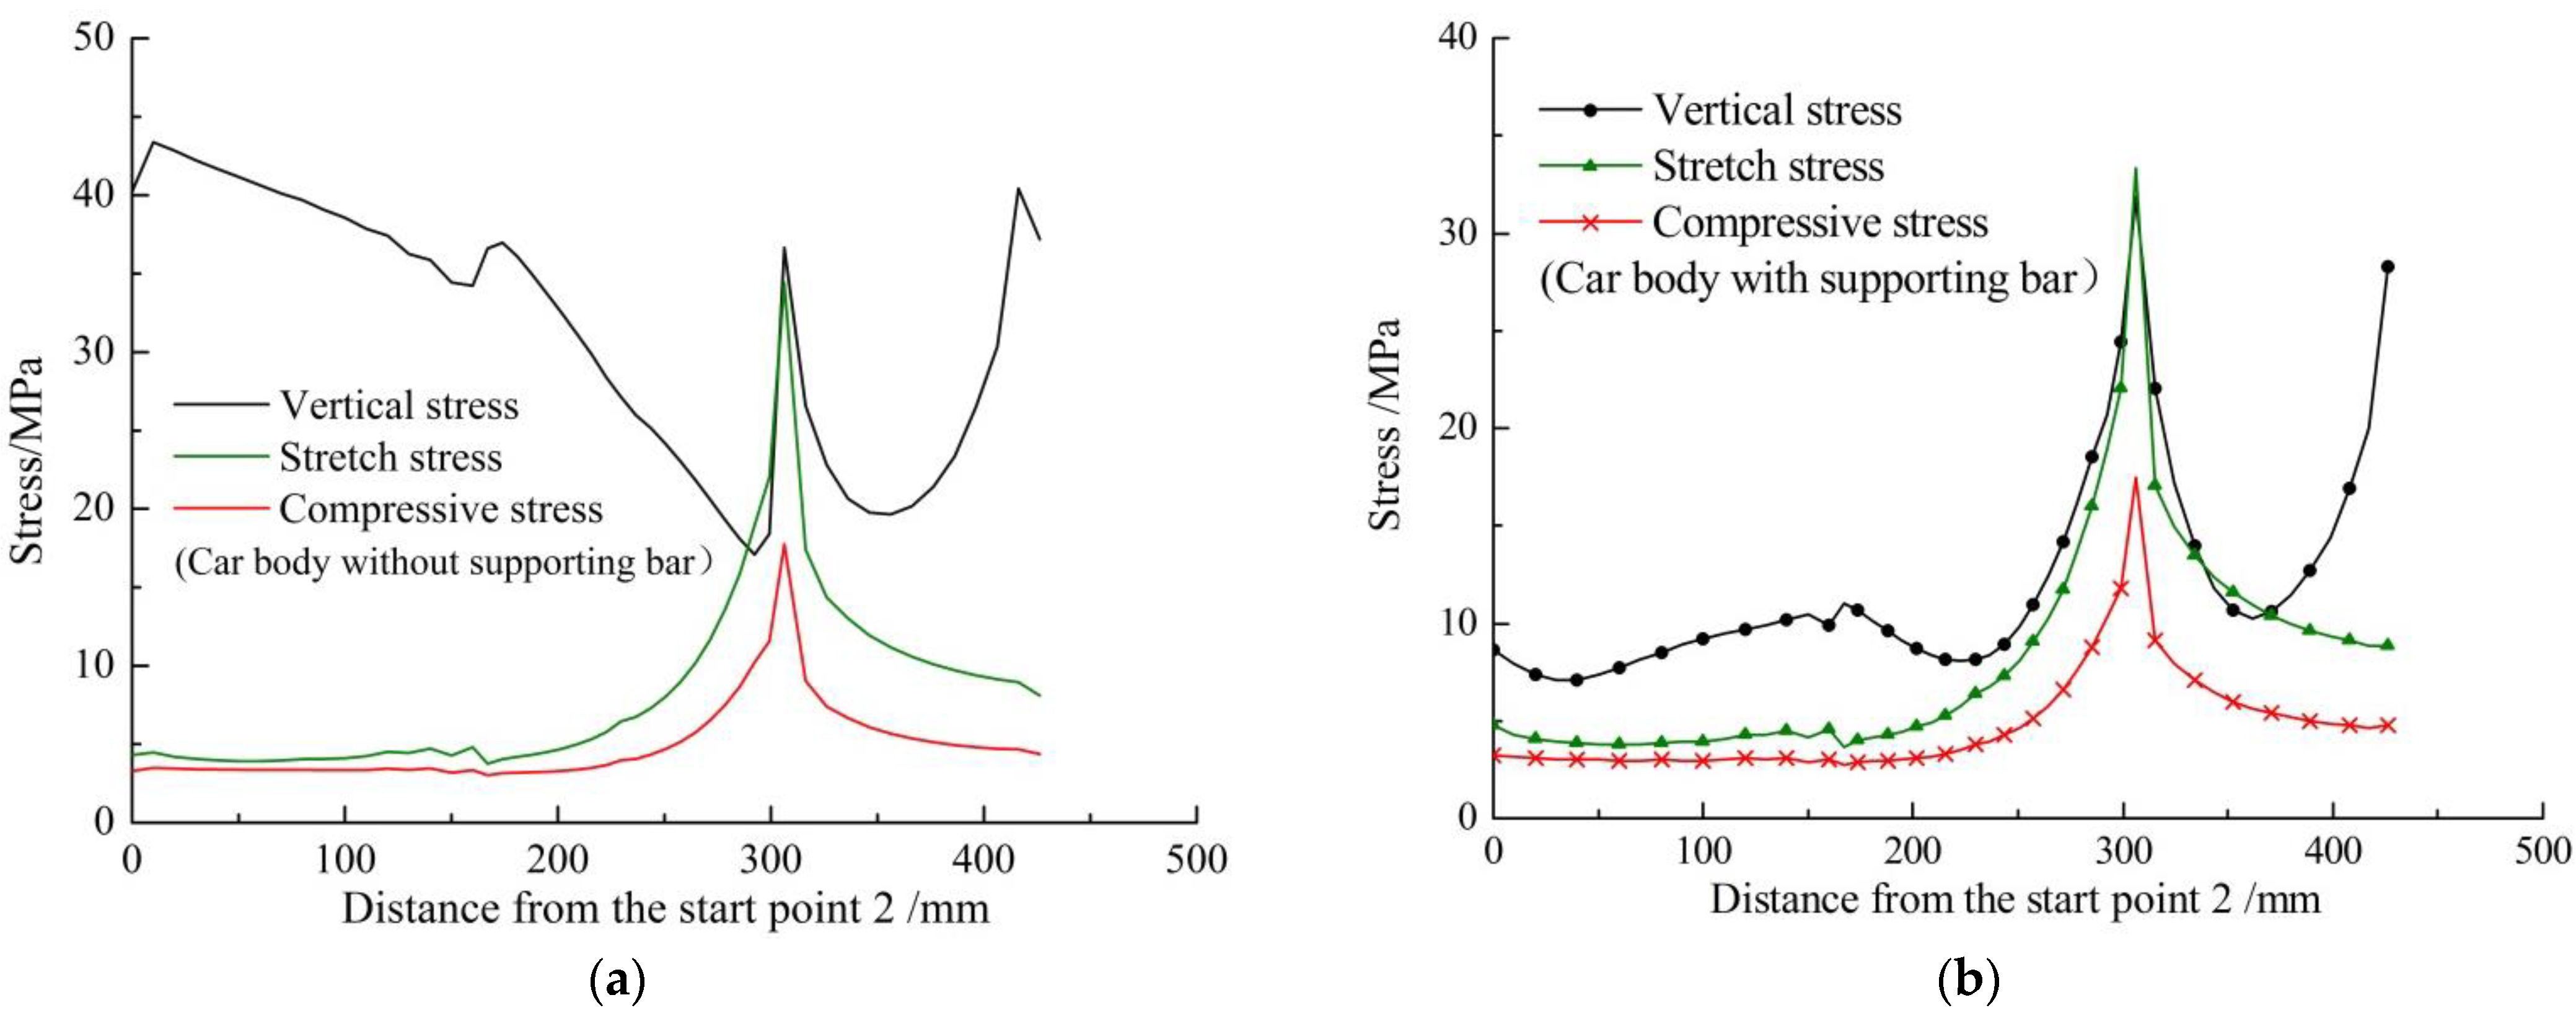
According to Figure 8, the following conclusions can be drawn:
(1)
On the whole, the changing trend of stress under each condition is basically the same in the two car body schemes, except for the vertical stress in scheme 1. The stress under the vertical condition is higher than that under the longitudinal condition, and the stress values are basically the same under the corresponding stretch load and compressive load. In addition, the three stress distributions have a peak at 305 mm in both schemes.
(2)
Under the vertical condition, on the whole, the stresses in Figure 8a are higher than that in Figure 8b, especially in the interval [0, 275 mm]. The root cause of this phenomenon is that the supporting bar improves the stress on weld 2. The stresses of the two welds have the stress mutation at 305 mm, but maximum stresses are basically near 35 MPa, relatively small.
(3)
Under the longitudinal condition, the stretch stresses on the two welds are basically the same as the compressive stress, and the stretch stresses are slightly larger than the compression stresses. It illustrates that the stress contribution of the supporting bar on the stresses of weld 2 is small.

4. Fatigue Life Assessment of Key Position

According to the finite element analysis results, the maximum stress of weld 1 under all conditions appears at 110 mm, and the maximum stress of weld 2 under all conditions appears at 305 mm. Therefore, the two points are identified as key positions for fatigue life assessment.

4.1. Fatigue Damage Analysis of Key Position
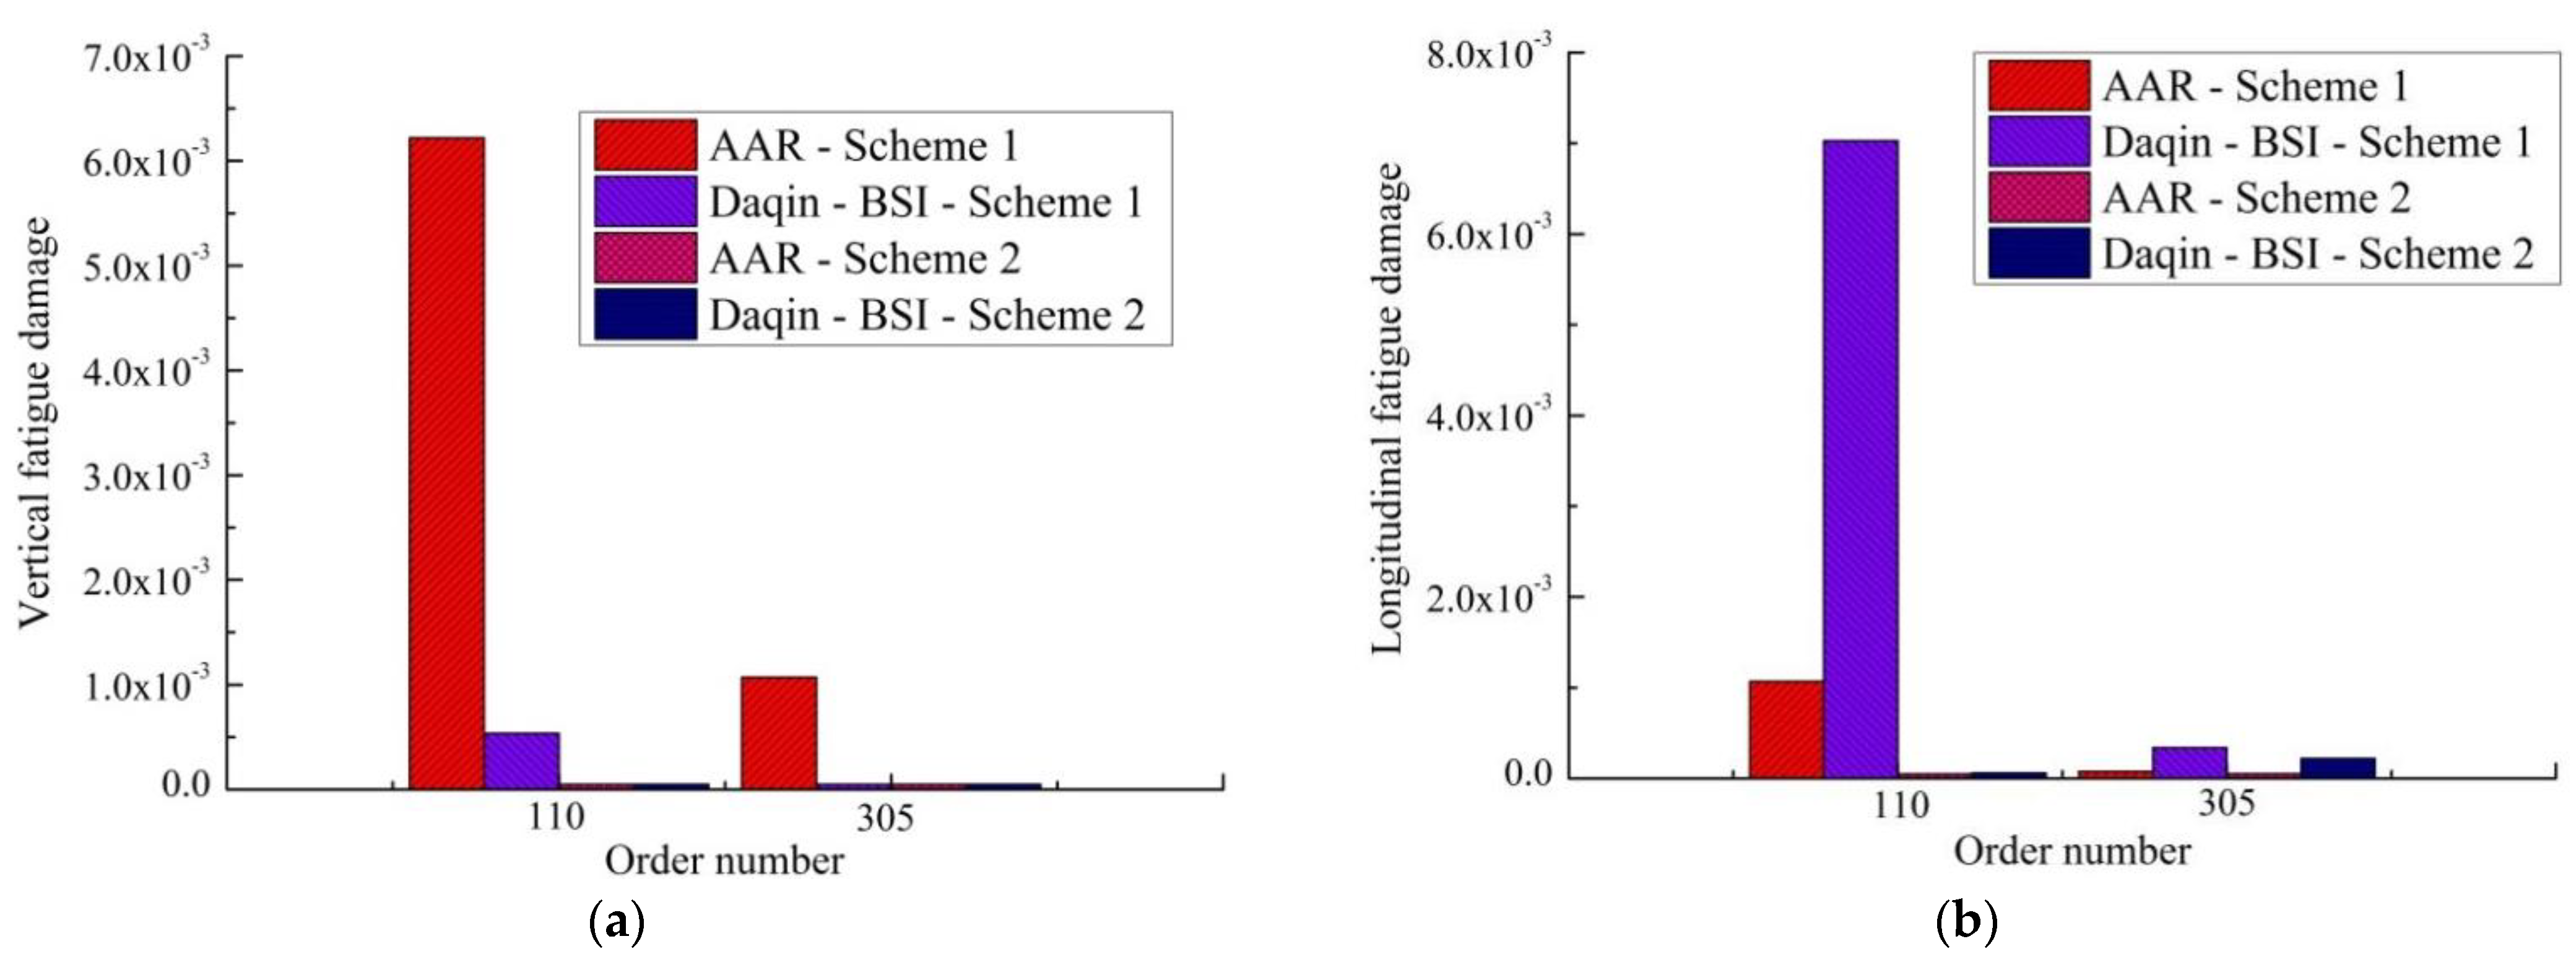
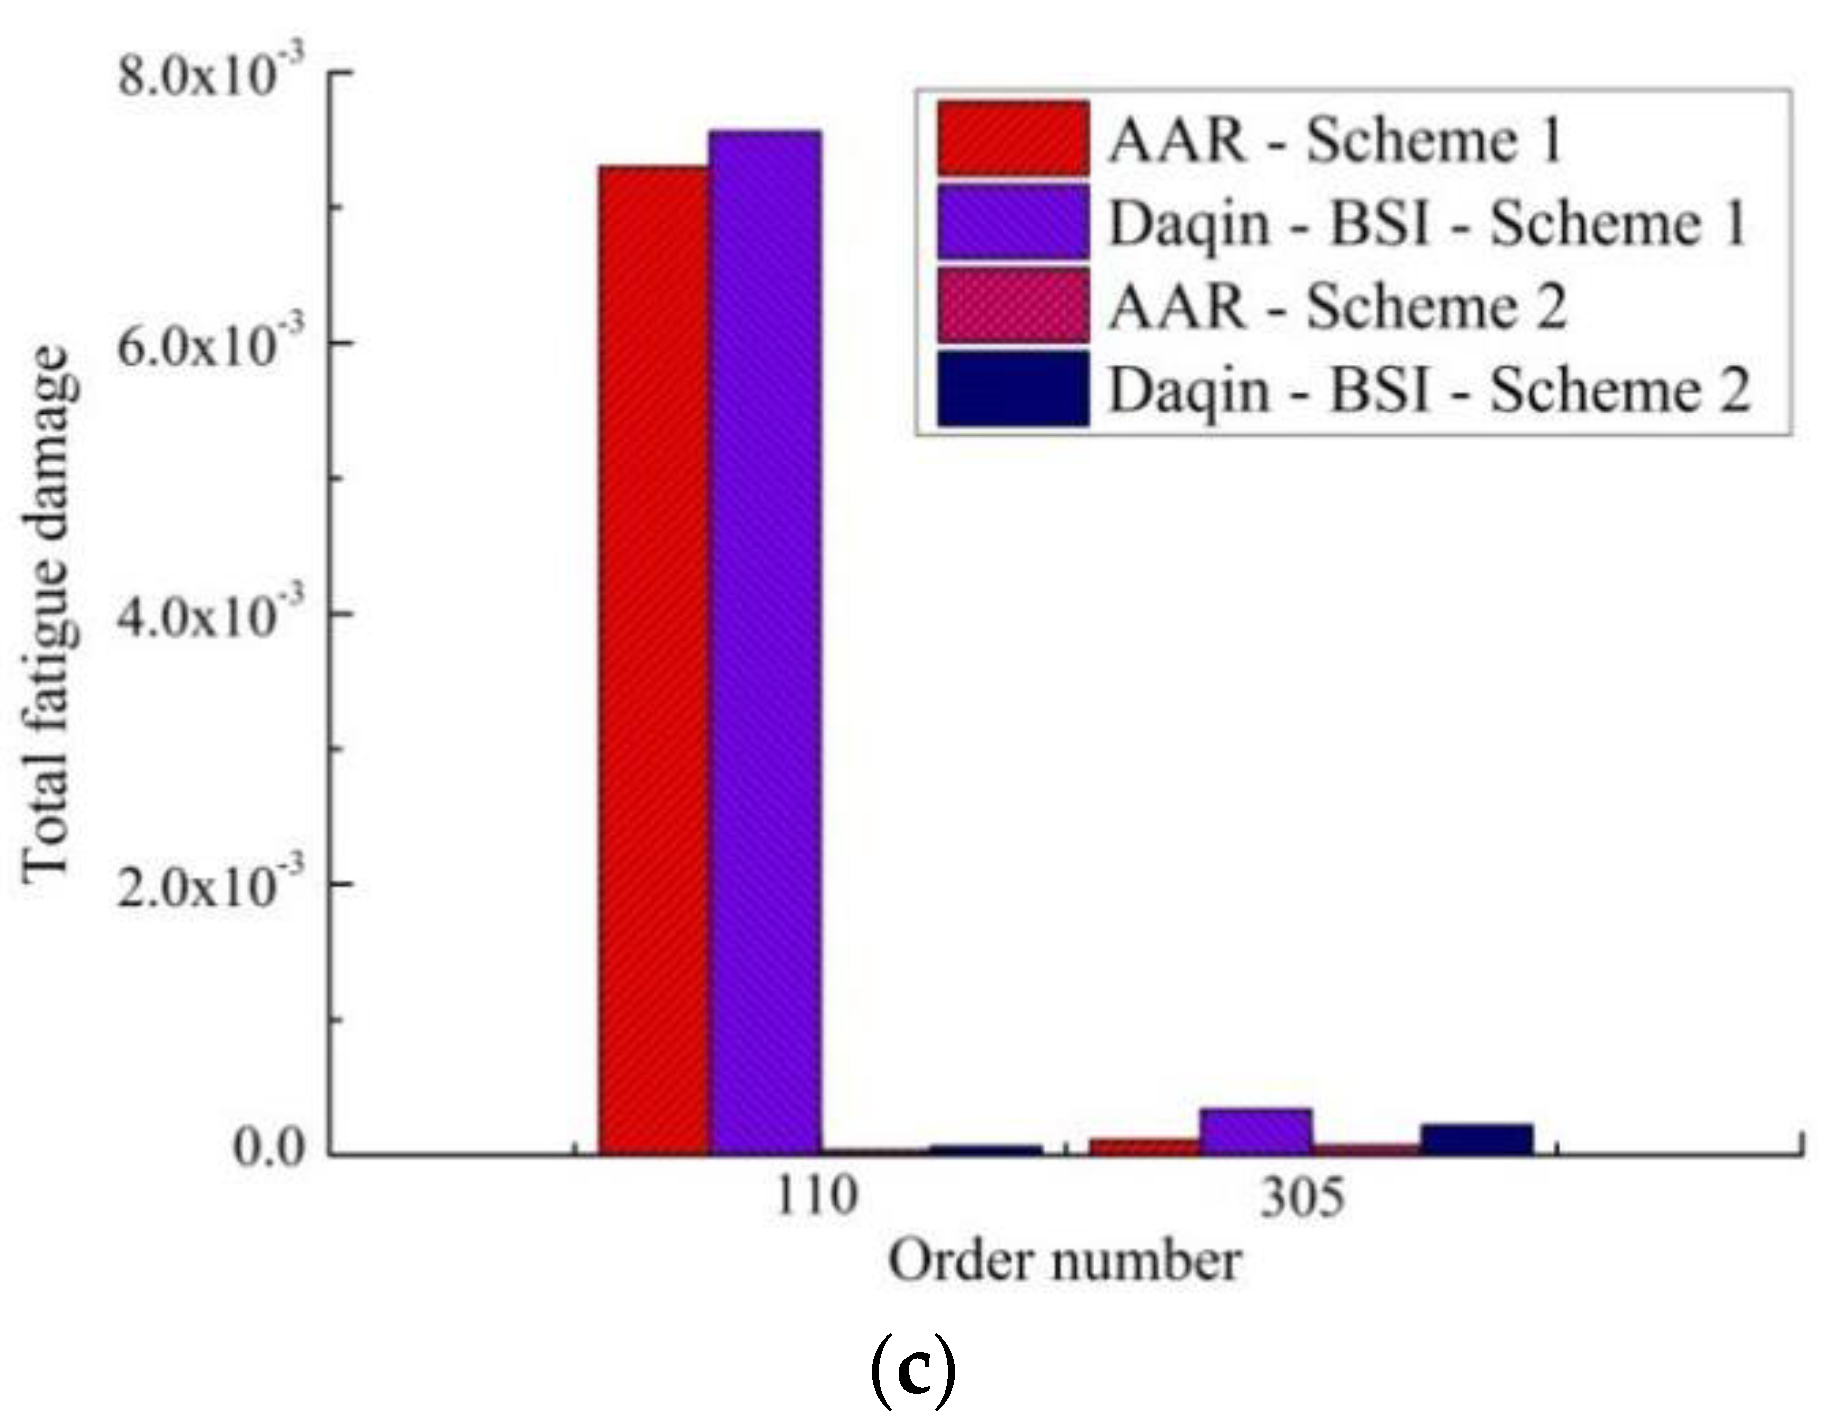
According to the simulation results of the two car body schemes, the stress of the two key positions under each condition is extracted, and the damages of the two key positions under each working condition are calculated by the load spectrum and fatigue damage assessment method in the AAR standard. Similarly, the damages are calculated by the load spectrum of the Daqin line and the S-N curve in the BSI standard. The fatigue damage obtained by the two different methods is shown in Figure 9, and the total damage calculated by the two methods is shown in Table 1. According to Figure 9, the following conclusions can be drawn:
(1)
On the whole, no matter which assessment method is adopted, the maximum value of damage under each condition or total damage appears at 110 mm of weld 1 in the car body without a supporting bar. Except for the total damage at 110 mm in scheme 1 exceeding 7 × 10⁻³, other total damages are less than 1 × 10⁻³.
(2)
The total damage of scheme 1 obtained by the two evaluation methods is basically the same at 110 mm, but the contribution of vertical damage to total damage obtained by the two methods is the opposite, and the contribution of longitudinal damage to total damage obtained by the two methods is also the opposite. This phenomenon shows that the vertical load spectrum of AAR is worse than that of the Daqin line, and the longitudinal load spectrum of the Daqin line is worse than that of AAR. The reason is that the altitude drop of the whole Daqin line is large, and there are a large number of wagons per train. These factors cause a large longitudinal force.

4.2. Fatigue Life Assessment of Key Position

According to the total fatigue damages of the two methods, the corresponding fatigue life is calculated as shown in Table 1. When the car body does not include a supporting bar, no matter which method is adopted, the value of the fatigue life is less than the design life (5,000,000 km). It shows that the supporting bar plays a great role in the car body. Therefore, the car body with a supporting bar is determined as the final scheme.

5. Conclusions

(1)
Two fatigue life assessment methods based on Miner’s linear cumulative damage of the gondola car body are given comprehensively and systematically. One method is to adopt the load spectrum and S-N curve in the AAR standard, and the other method is to adopt the load spectrum of the Daqin line and S-N curve in the BSI standard.
(2)
In the analysis of finite element results, we pay attention to the maximum stress on the two key welds; the stress of the car body structure without a supporting bar is the largest 110 mm from weld 1, which is much greater than that of the scheme with a supporting bar.
(3)
The total damage obtained by the two evaluation methods is basically the same, but the contribution of vertical damage to total damage obtained by the two methods is the opposite, and so is the longitudinal damage. It shows that the vertical load spectrum of AAR is worse than that of the Daqin line, and the longitudinal load spectrum of the Daqin line is worse than that of AAR. This conclusion provides the basis for evaluating the fatigue life of railway freight cars when they run on different lines.
(4)
The 80t depressed-center gondola car body structure with a supporting bar is determined as the optimal scheme. Meanwhile, the result has important reference significance for the structural design of the heavy haul gondola car body for coke transport.

Author Contributions

W.L. conceived and wrote the paper; L.Z. reviewed the paper; C.B. gave the fatigue life calculation method; Y.H. and R.Z. used abaqus software to simulate the car body; Z.W. gave the 3D model of the car body. All authors have read and agreed to the published version of the manuscript.

Funding

This research has been sponsored by the public technology application research of Zhejiang province, China (Grant No. LGG22E050014), and the general scientific research project of the Zhejiang province education department, China (Grant No. Y201941738).

Conflicts of Interest

The authors declare no conflict of interest.

References

  1. Wang, C.S.; Chen, L. Technology of Heavy Haul and Fast Vehicle; China Railway Publishing House: Beijing, China, 2010. [Google Scholar]
  2. Yu, M.G.; Zhang, J.Y.; Zhang, W.H. Multi-objective optimization design method of the high-speed train head. J. Zhejiang Univ. Sci. A 2013, 14, 631–641. [Google Scholar] [CrossRef]
  3. Miao, B.; Luo, Y.; Qiu, Y.; Peng, Q.; Jiang, C.; Yang, Z. Research on multidisciplinary fatigue optimization design method in structural design of high speed train. Procedia Struct. Integr. 2019, 22, 102–109. [Google Scholar] [CrossRef]
  4. Gao, Y.; Liu, Q.; Wang, Y.; Zhao, W. Lightweight design with weld fatigue constraints for a three-axle bogie frame using sequential approximation optimisation method. Int. J. Vehicle Des. 2017, 73, 3–19. [Google Scholar] [CrossRef]
  5. Yang, G.; Li, S.; Fu, D. Fatigue properties of AL/AL-MG alloy laminated materials for the applications to railway tank cars. Int. J. Fatigue 2019, 122, 173–183. [Google Scholar] [CrossRef]
  6. Liu, W.; Zhang, Y.; Li, N.; Wang, L. Research on stress intensity factor and fatigue crack propagation rate of the general-purpose gondola car body. Trans. Can. Soc. Mech. Eng. 2021, 45, 297–307. [Google Scholar] [CrossRef]
  7. Li, Z.; Dou, H.S.; Lin, P.; Wei, Y.; Chen, Y.; Lin, L.; Ye, X. Design for a Squirrel Cage Fan with Double Arc Blade. J. Appl. Fluid Mech. 2020, 13, 881–891. [Google Scholar] [CrossRef]
  8. Wang, H.-Y.; Bi, C. Study of a magnetorheological brake under compression-shear mode. Smart Mater. Struct. 2019, 29, 017001. [Google Scholar] [CrossRef]
  9. Liu, W.; Zhang, Y.; Liu, Q.; Zhang, B.; Fu, Q. Structural optimization of the heavy haul wagon body based on MPSO-BP algorithm. Trans. Can. Soc. Mech. Eng. 2021, 45, 461–472. [Google Scholar] [CrossRef]
  10. Zhong, Y.G.; Zhan, Y.; Zhao, G. Fatigue analysis of structure of gondola car body based on rigid-flexible coupling multi-body systems. In Proceedings of the 11th World Congress on Computational Mechanics, Barcelona, Spain, 20–25 July 2014. [Google Scholar]
  11. Xiu, R.; Spiryagin, M.; Wu, Q.; Yang, S.; Liu, Y. Fatigue life assessment methods for railway vehicle bogie frames. Eng. Fail. Anal. 2020, 116, 104725. [Google Scholar] [CrossRef]
  12. Liu, W.F. Research on Fatigue Strength Evaluation and Structure Optimization of Heavy Haul General Purpose Gondola Car Body; Beijing Jiaotong University: Beijing, China, 2019. [Google Scholar]
  13. Miner, M.A. Cumulative damage in fatigue. Int. J. Appl. Mech. 1945, 67, A159–A164. [Google Scholar] [CrossRef]
  14. Manson, S.S.; Halford, G.R. Practical implementation of the double linear damage rule and damage curve approach for treating cumulative fatigue damage. Int. J. Fracture 1981, 17, 169–192. [Google Scholar] [CrossRef]
  15. Golos, K. Cumulative fatigue damage. Mater. Sci. Eng. A 1988, 104, 61–65. [Google Scholar] [CrossRef]
  16. Song, Z.; Fang, S.; Zhang, Y.; Xie, J. Cracking analysis of bolster cover plate in C70 freight wagons. Eng. Fail. Anal. 2013, 30, 43–60. [Google Scholar] [CrossRef]
  17. Zhao, X.; Xie, S.; Zhang, Y.; Li, Q.; Wang, W.; Wang, B. Fatigue reliability analysis of metro bogie frame based on effective notch stress method. Eng. Fail. Anal. 2021, 131, 105811. [Google Scholar] [CrossRef]
  18. Milovanović, V.; Dunić, V.; Rakić, D.; Živković, M. Identification causes of cracking on the underframe of wagon for containers transportation—Fatigue strength assessment of wagon welded joints. Eng. Fail. Anal. 2013, 31, 118–131. [Google Scholar] [CrossRef]
  19. BS7608: 2014+A1; Guide to Fatigue Design and Assessment of Steel Products. British Standard Institute: London, UK, 2015.
  20. Manual of Standards and Recommended Practices Section C-Part II; Design, Fabrication, and Construction of Freight Cars; Association of American Railroads: Washington, DC, USA, 2007.
  21. TB/T1335; Code for Strength Design and Test Evaluation of Railway Rolling Stock. China Railway Publishing House: Beijing, China, 1996.
Figure 1. S-N curve of BSI standard.
Processes 10 01618 g001
Figure 2. Ideal S-N curve.
Processes 10 01618 g002
Figure 3. Goodman curve.
Processes 10 01618 g003
Figure 4. The analysis flow chart of fatigue damage.
Processes 10 01618 g004
Figure 5. The structure of an 80t depressed-center gondola car body (scheme 2): 1. side post, 2. supporting bar, 3. side sill, 4. center sill, 5. Floor, 6. the starting point of weld 1, 7. weld 1, 8. the starting point of weld 2, 9. weld 2.
Processes 10 01618 g005
Figure 6. Finite element model of the gondola car body.
Processes 10 01618 g006
Figure 7. The stress distribution of weld 1. (a) Scheme 1, (b) scheme 2.
Processes 10 01618 g007
Figure 8. The stress distribution of weld 2. (a) Scheme 1, (b) scheme 2.
Processes 10 01618 g008
Figure 9. The fatigue damages of the two key positions. (a) Vertical fatigue damage, (b) longitudinal fatigue damage, (c) total fatigue damage.
Processes 10 01618 g009aProcesses 10 01618 g009b
Table 1. Factors and levels of the orthogonal experiment.
SchemeOrder NumberFatigue Damage (/10,000 km)Fatigue Life (10,000 km)
AARDaqin + BSIAARDaqin + BSI
1110 7.30 × 10−37.56 × 10−3137132
3051.11 × 10−43.38 × 10−48.98 × 1032.96 × 103
21103.61 × 10−56.25 × 10−52.77 × 1041.6 × 104
3057.07 × 10−52.21 × 10−41.42 × 1044.53 × 103
Publisher’s Note: MDPI stays neutral with regard to jurisdictional claims in published maps and institutional affiliations.

