Article

Study on the Microscopic Mechanism of Grouting in Saturated Water-Bearing Sand Stratum Based on VOF-DEM Method

School of Civil and Transportation Engineering, Guangdong University of Technology, Guangzhou 510006, China
*
Author to whom correspondence should be addressed.
Processes 2022, 10(8), 1447; https://doi.org/10.3390/pr10081447
Submission received: 9 July 2022 / Revised: 21 July 2022 / Accepted: 22 July 2022 / Published: 24 July 2022
(This article belongs to the Special Issue Multiphase Flows and Particle Technology)

Abstract

:
During the construction of tunnels in saturated water-bearing sand stratum, water and mud inrush disasters often occur. Grouting is the most convenient and effective method to improve the mechanical properties of the soil and prevent groundwater seepage. The reasonableness of the Discrete Element Method (DEM) contact parameters is verified by comparing the repose angle test with that obtained by simulations. The grouting model of saturated water-bearing sand stratum was established based on the Volume of Fluid-Discrete Element Method (VOF-DEM). Then, the effects of sand stratum porosity and grouting pressure on grouting were discussed. The results show that (1) in dense sands, the permeation diffusion of the slurry dominates, whereas in loose sands, the compaction zone is well developed. (2) Loose sand has a wider propagation of stress and dense sand has a larger increase in the stress state. (3) In loose sand the slurry diffusion is significantly affected by gravity, whereas in dense sand the slurry diffusion along the dominant path of the grouting pipe wall boundary is obvious. (4) The range of slurry diffusion and compaction zone is positively related to the porosity and grouting pressure. (5) In loose sand with grouting pressure below 200 kPa, no compaction diffusion occurs during the grouting process, whereas in dense sand, when the grouting pressure is below 500 kPa no compaction diffusion occurs during the grouting process.

1. Introduction

China’s urban rail transit is growing rapidly, with a total of 8708 km of subways nationwide by 2022. During the construction of urban subways, water-rich sand stratum is often encountered [1,2]. Due to its high porosity and permeability, the sand stratum can serve as an essential groundwater reservoir. Water and mud inrush often occur when tunneling in water-bearing sand stratum. Among the technical techniques for water plugging and reinforcement, grouting is the most convenient and effective [3,4]. Grouting is a technique that uses a grouting pipe to inject slurry into the ground. During this operation, the slurry displaces the air and groundwater between the soil particles. After slurry solidification and hardening, the soil is modified by the slurry into reinforced soil with exceptional waterproof ability, integrity, and strength [5,6].
Due to the hidden and complex features of grouting projects, grouting theory lags far behind engineering practice. In recent decades, researchers have studied the theory of grouting by various methods. Liu J et al. proposed guidelines for the selection of composite materials in different flowing water environments through site surveys [7]. Li Z et al. investigated the effects of the water–cement ratio and curing time on the reinforcement effect of sandy soils through laboratory tests [8]. Wang D et al. established a grouting test model for deep saturated sand layers and studied the diffusion of urea–formaldehyde resin in saturated sand layers [9]. Wang Q et al. established a grouting model for loose sandy soil to study the diffusion law of slurry in sandy soil from factors such as grouting pressure, water–cement ratio, and sandy soil saturation, respectively [10].
However, site surveys and laboratory tests were unable to reveal the diffusion mechanism of the slurry. Therefore, many researchers have used numerical simulation methods to study the grouting mechanism. Ren B et al. studied the diffusion pattern of fracture grouting under dynamic and hydrostatic water conditions by using the VOF model [11]. Cui W et al. introduced the viscosity time-varying equation into the VOF model and investigated the effect of viscosity time-varying velocity on the washout resistance of slurry [12]. Li S et al. introduced the Sequential Diffusion and Solidification (SDS) method into VOF to represent the spatial variation of viscosity by sequential injection. [13]. Liu X et al. used the DEM method to simulate the grouting process by using the “tube domain” to reveal the effect of grouting pressure on the form of slurry diffusion [14]. Boschi K et al. used the DEM method to discrete the slurry into particles. They investigated the micromechanics of grouting under different grouting pressures and different soil properties [15]. Yang C et al. used the Computational Fluid Dynamics–Discrete Element Method (CFD–DEM) algorithm to study the effects of different grouting pressures on slurry diffusion and soil mechanical mechanisms [16]. Guo W et al. used the two-phase Darcy law for grouting simulation to study the effect of different grouting methods and well spacing on the effect of slurry penetration on the leading-edge lap [17].
However, the above numerical studies mainly focus on the field of fracture grouting and unsaturated soil grouting. The microscopic mechanism of grouting in saturated water-bearing sand stratum is still unclear. The grouting process of saturated water-bearing sand stratum involves the three-phase coupling of slurry–water–sand, and the process is highly complex. The VOF method can accurately simulate the intersection of slurry and water, and the DEM method can simulate the real soil state. Therefore, the grouting process is simulated by coupling the VOF method and the DEM method. First, the reasonableness of the sandy soil DEM contact parameters is verified by comparing the repose angle test with the repose angle simulation test. Then a grouting model based on the VOF–DEM method is established to study the microscopic mechanism of grouting in saturated water-bearing sand stratum. The study results are of great significance for improving the theory of grouting in water-bearing sand stratum.

2. Methods

The slurry and water are divided by a distinct interface, known as the slurry–water intersection, during the grouting process in saturated water-bearing sand stratum. The sandy soil particles can be located in water or slurry, and their motion is governed by their interactions with the sandy soil particles and fluid around them. By coupling the DEM and VOF methods, the grouting process in saturated water-bearing sand stratum can be simulated.

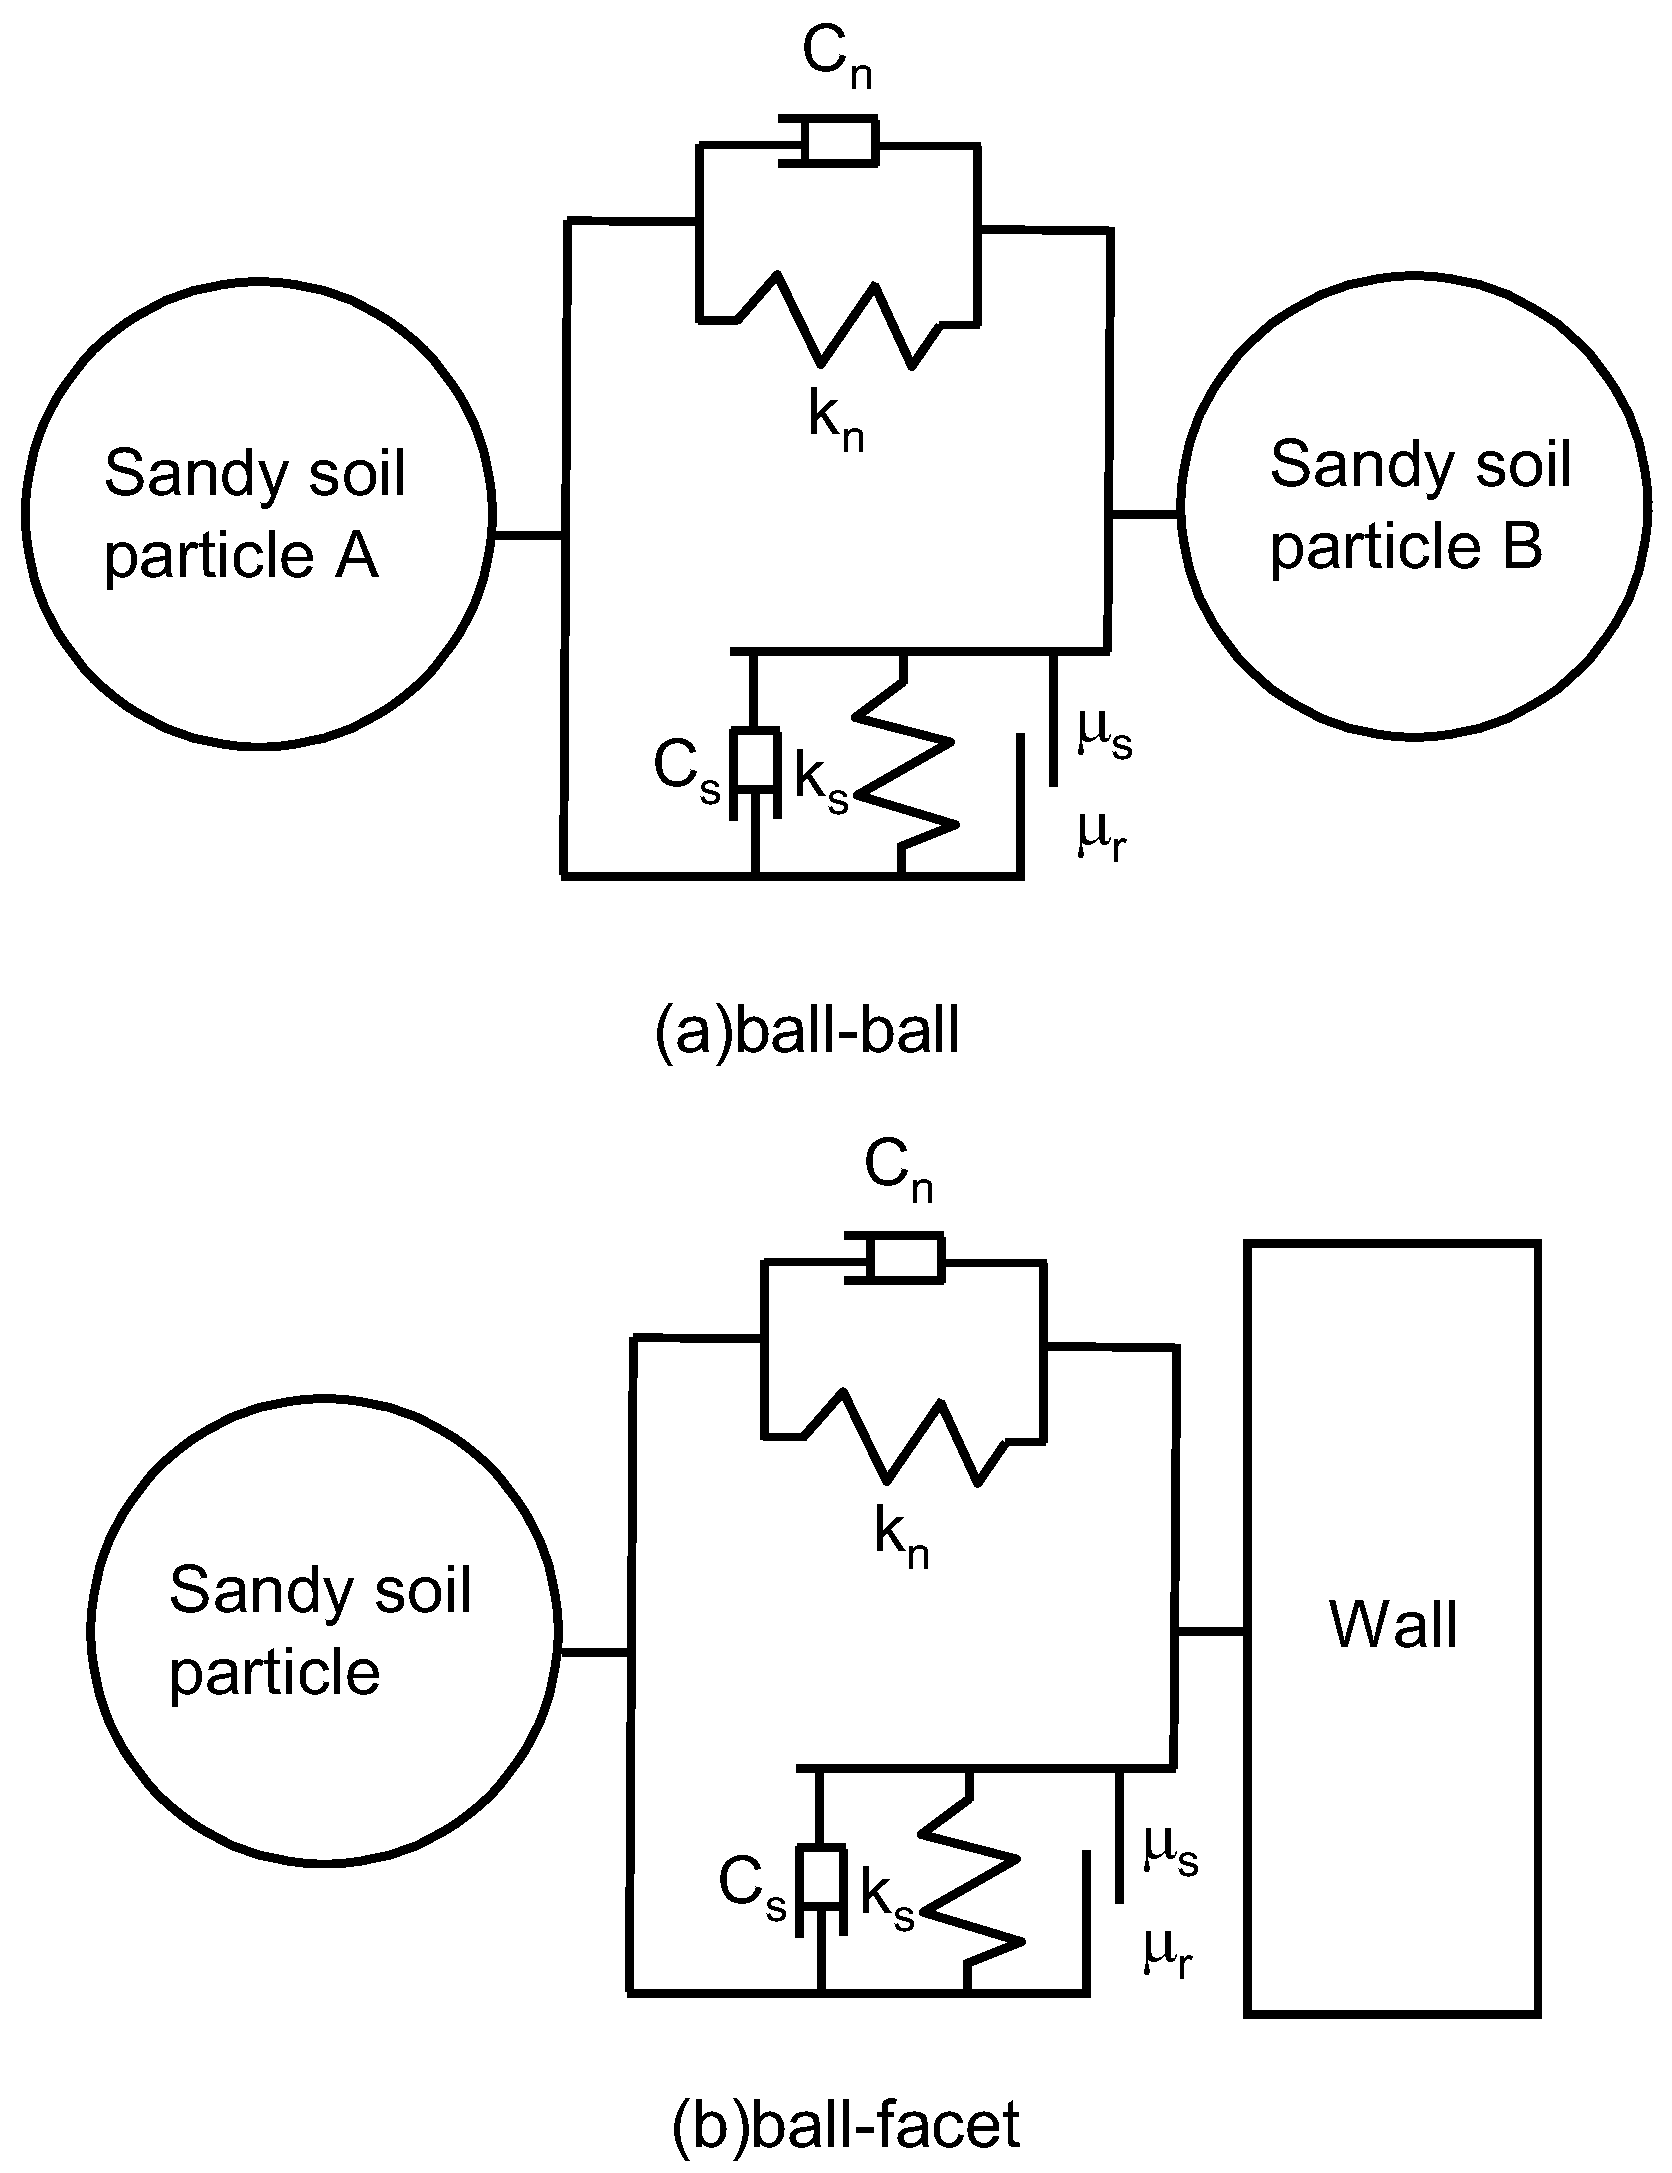
2.1. Governing Equations for the Particle Phase

Cundall et al. first proposed the DEM for simulating the motion of granular solids [18]. In the DEM model, the particles are governed by Newton’s laws of motion. The conservation of momentum and angular momentum of each particle is given by
m A d v A d t = j F A B c + F A f + F A g
I A d ω A d t = B M A B
where m A is the mass of particle A, v A is the translational velocity of particle A,   F A B c is the contact force between particle A and particle B, F A f is the fluid–particle interaction force acting on particle A, F A g is the gravity acting on particle A,   I A is the moment of inertia of particle A,   ω A is angular velocities of particle A, and M A B is contact moment acting on particle A by particle B.
The interaction model of the particles has a significant impact on the final computation results in DEM. As a result, choosing an acceptable contact model can improve the accuracy of the final simulation. Because sandy soil has low cohesion and large dispersion, the Hertz–Mindlin (no-slip) model was chosen as the particle contact model in this paper. Figure 1 illustrates its contact schematic diagram.
In the DEM, the contact force includes normal contact force Fn and tangential contact force Ft. The normal force is based on the contact theory of Hertzian [19], and the tangential force [20,21] depends on the tangential overlap and tangential stiffness, and their expressions are as follows.
F n = 4 3 E * R * δ n 3 2
F t = k t δ t
where E * is the equivalent Young’s modulus, R * is the equivalent radius, δ n is the normal overlap of particle A and particle B, k t is the tangential stiffness, and δ t is the tangential overlap of particle A and particle B. According to the theory of Cundall [18], the tangential force cannot be greater than μ s F n , where μ s is the static friction coefficient.
  E * , R * ,   and k t   are defined as
1 E * = ( 1 ν A 2 ) E A + ( 1 ν B 2 ) E B  
1 R * = 1 R A + 1 R B  
k t = 8 G * R * δ n
where   E A   and   E B are the Young’s modulus of particle A and particle B, respectively; ν A   and   ν B   are the Poisson’s ratio of particle A and particle B, respectively ;   R A   and   R B   are the radius of particle A and particle B, respectively; and   G *   is the equivalent shear modulus.
In addition, there are normal damping forces   C n and tangential damping forces C s   which are given by [22,23]
C n = 2 5 6 β k n m * v n r e l
C s = 2 5 6 β k t m * v t r e l
where   m *   is the equivalent mass, v n r e l is the normal relative velocity,   S n is the normal stiffness,   β   is the equation for the restitution coefficient, and   v t r e l   is the tangential relative velocity. m * ,   β ,   and   k n   are defined as
m * = ( 1 m A + 1 m B ) 1
β = ln e ln 2 e + π 2
k n = 2 E * R * δ n
where   m A   and   m B   are mass of particle A and particle B, respectively, and   e   is the restitution coefficient.
Rolling friction can be used to simulate sand particle shape, which can be illustrated in commercial software EDEM by applying torque to the contact surface [24].
τ i = μ r F n R i ω i
where   μ r   is the rolling friction coefficient,   R i   is the distance between the contact point and the center of mass, and   ω i   is the unit angular velocity vector of the particle at the contact point.

2.2. Governing Equations for the Fluid Phase

The VOF model can simulate two or more unmixed-phase fluids by solving a set of momentum equations and tracking the volume fraction of each fluid over the whole region. When dealing with the slurry–water two-phase flow, assume that the volume fraction of the slurry phase in each cell is   α s   , and the volume fraction of the water phase is   α w . If   α s = 0 , then the cell contains no slurry. If   α s = 1 , then the unit contains only slurry. If   0 < α s < 1 , then there is a slurry–water interface in this cell. The dynamic behavior of the phase interface is solved by the following equation
α s t + ( v 𝛻 ) α s = 0  
where   v   is the density and velocity of the fluid. The water phase volume fraction is found by the following equation.
α w + α s = 1
The momentum equations are related to the material physical parameters of density, viscosity, and volume fraction. The phase density equation and the phase viscosity equation are as follows.
ρ = ρ w α w + ρ s α s
μ = μ w α w + μ s α s  
The well-known volume-averaged control equation was used to describe the phase motion of the fluid [25]. The continuity equation is as follows.
( ε f ρ ) t + 𝛻 ( ε f ρ v ) = 0
The slurry flows slowly in porous media, so the laminar flow model is used. The momentum equation is given by
( ε f ρ v ) t + 𝛻 ( ε f ρ v v ) = ε f ( 𝛻 p + 𝛻 μ ( 𝛻 v + 𝛻 v T ) + ρ g ) + F p f
where   ε f   is the fluid phase volume fraction, ρ   is the density of the fluid, and   F p f   is the fluid–particle interaction force acting on the fluid.

2.3. Fluid–Particle Interaction Force

Particle–fluid interaction forces include pressure gradient force, drag force, Magnus force, Saffman lift force, Bassett force, and virtual mass force [26]. In the grouting process, the interaction force between the fluid and the particles is mainly the drag force. The drag force occurs because of the different velocities of the particle and the fluid, resulting in the shear of the fluid on the solid particles, which acts along the relative velocity direction between the fluid and the particle. For dense particle populations, the Di–Felice drag force model [27] is generally chosen to calculate the particle–fluid interaction forces. Di–Felice’s drag force model is shown below
F d = π ( d p ) 2 2 C D ρ f | v f v s | ( v f v s ) ε s χ + 1 χ = 3.7 0.65 e x p [ ( 1.5 log 10 R e s ) 2 2 ] C D = ( 0.63 + 4.8 R e s ) 2
where   d p   is the particle diameter, C D   is the drag coefficient, ρ f   is the phase density of the fluid phase, ε s   is the volume fraction of the particle phase, v f   is the velocity of the fluid phase at the center of the particle, v s     is the velocity of the particle phase, and   R e s   is the Reynolds number of particles. In this paper, a recently developed virtual dual grid method [28] was used to calculate the volume fraction of the particle phase, which eliminates the limitation that the fluid grid volume must be larger than the particle volume in the conventional method.

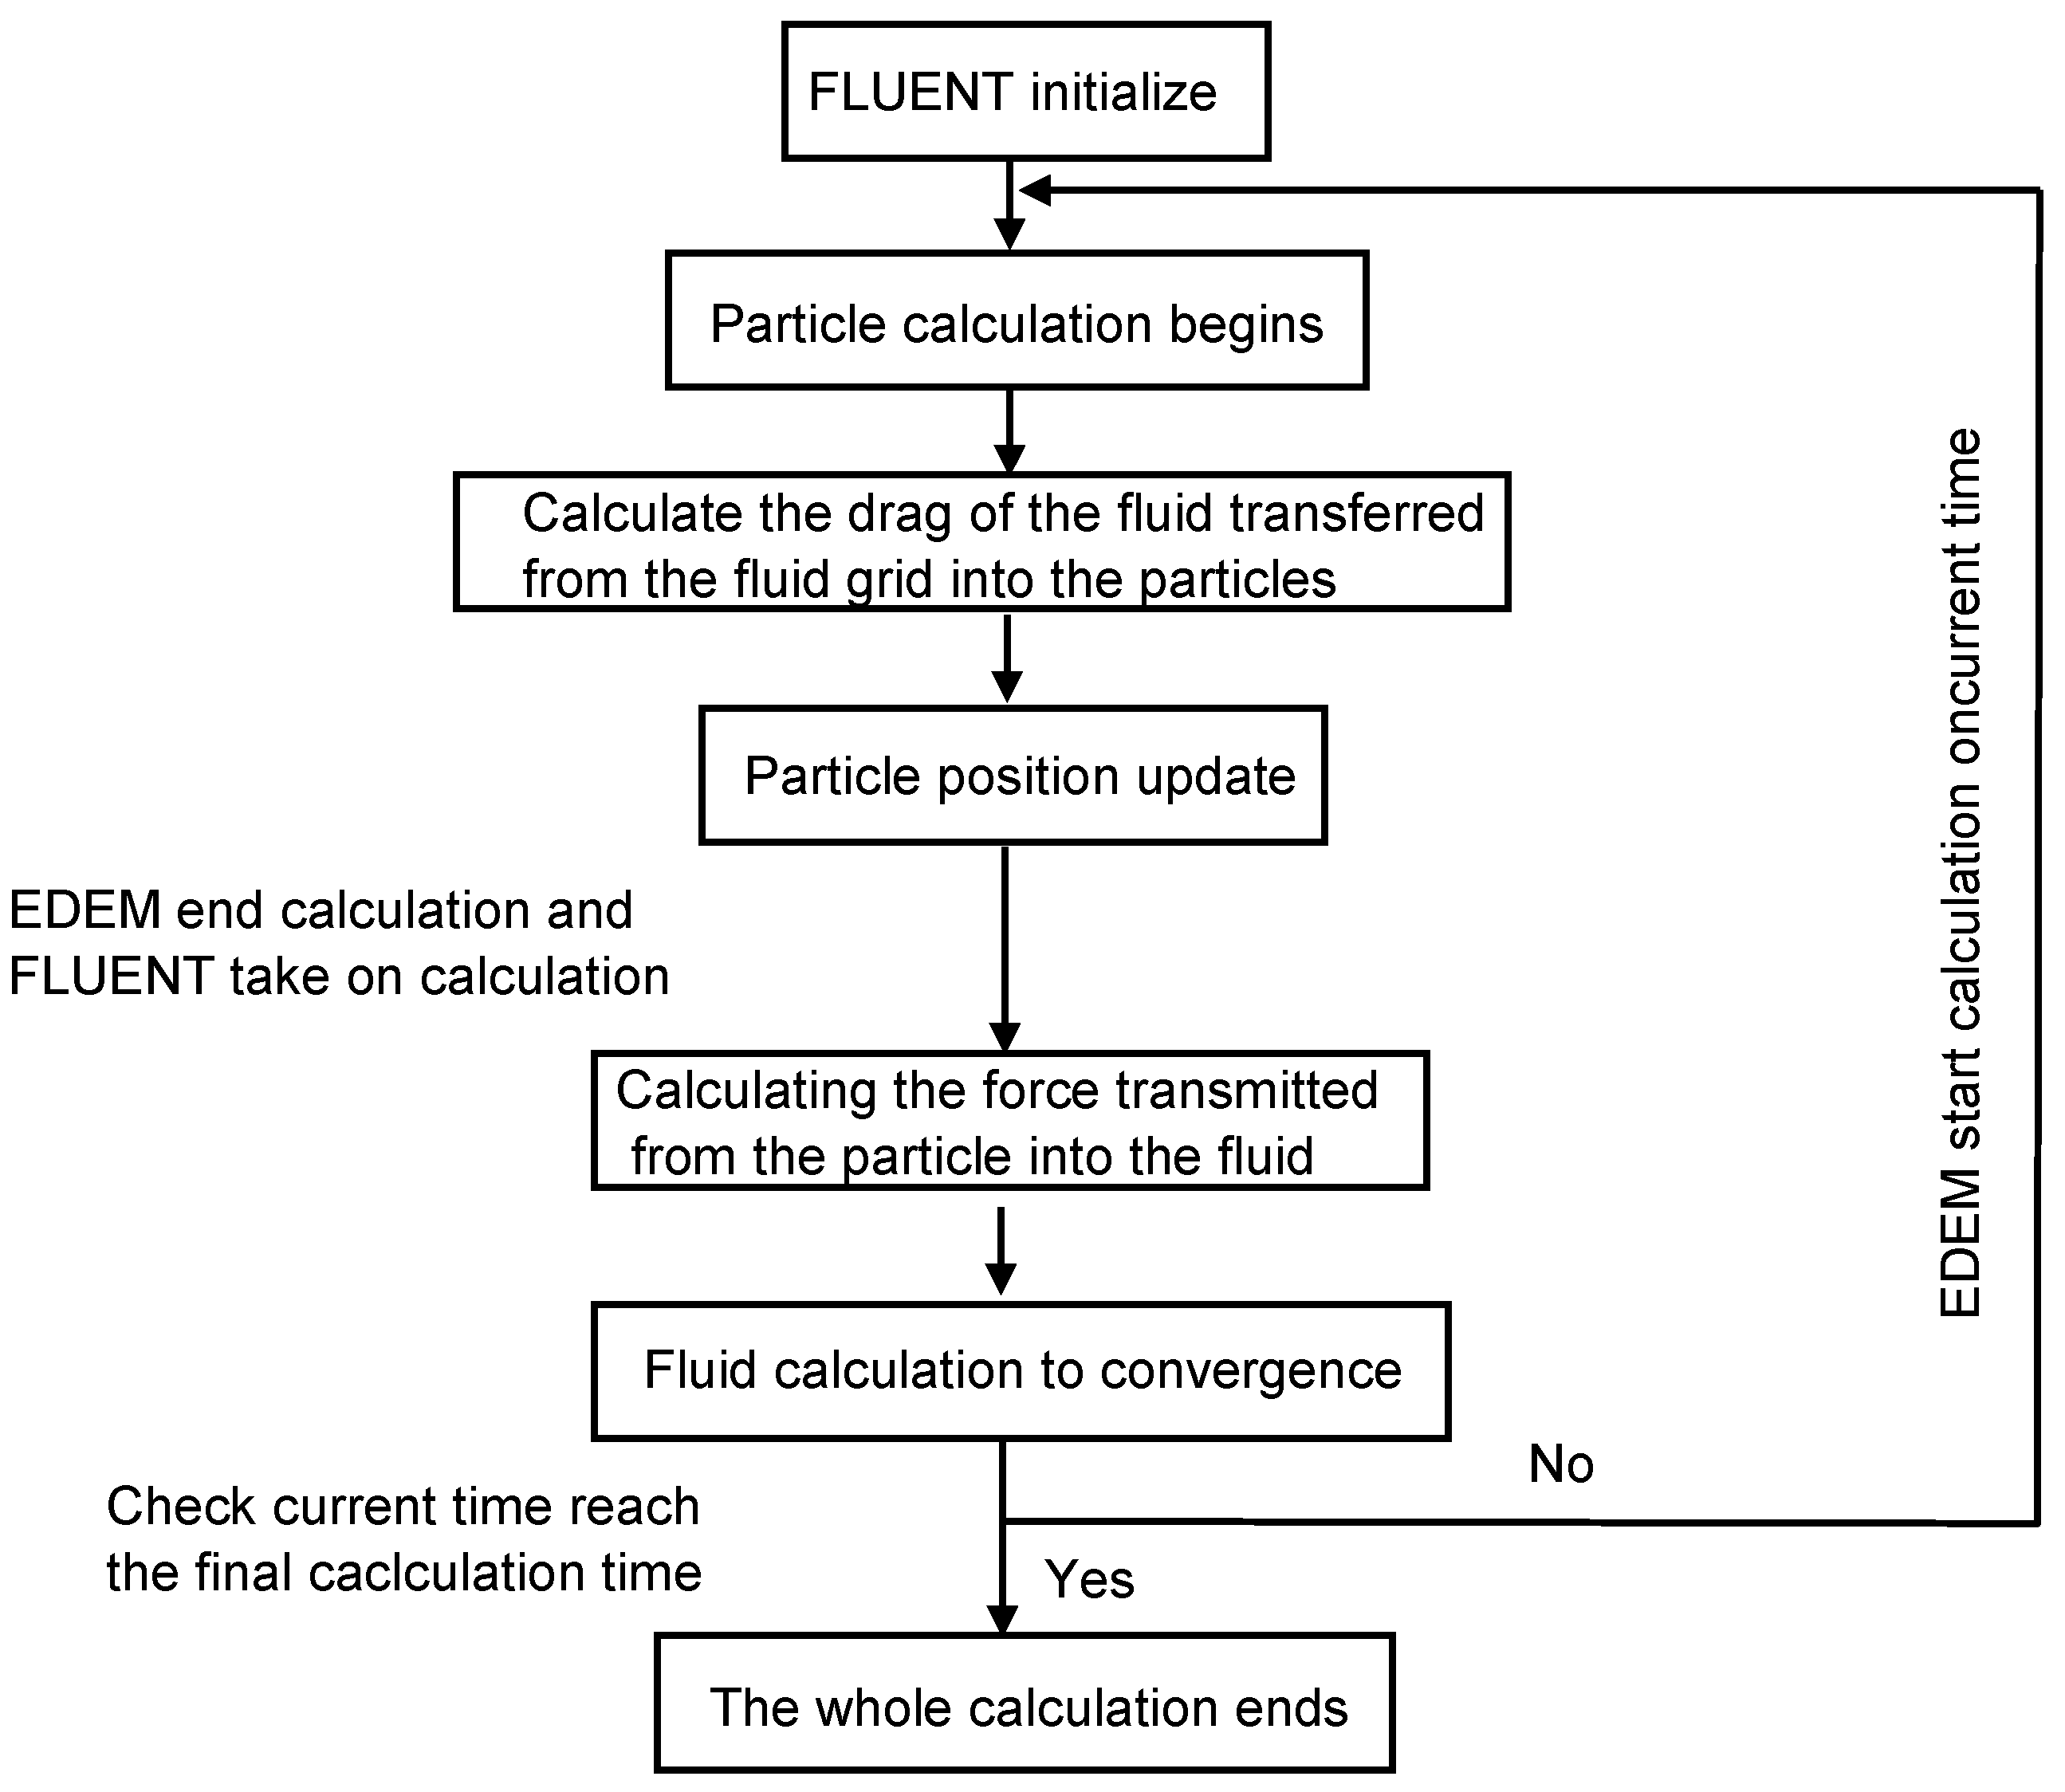
2.4. Implementation of Coupled VOF–DEM Model

The VOF–DEM coupling process was completed on commercial software FLUENT and EDEM. Figure 2 illustrates the coupled simulation flow chart.
At the beginning of the calculation, FLUENT uses the user-defined initialization function, which uses the EDEM Application Programming Interface (API) to pass the particle position information and calculate the grid porosity and fluid–particle interaction force. EDEM starts the calculation and calculates the velocity and position of particles with Equations (1) and (2). After the particle state is updated, FLUENT starts to calculate the particle–fluid interaction forces with Equations (18) and (19). Once the iterations converge, the fluid states and interaction forces are updated. If the final computation time is reached, the computation is finished. If the final computation time is not reached, the computation cycle returns to the EDEM side and a new computation cycle begins.
If the time step is unreasonable, the calculation will be unstable. Therefore, the time step for the coupled VOF–DEM calculation should be determined. The information exchange between DEM and VOF is performed at each step of the VOF simulation. For single-phase fluid–particle coupling, the time step of the fluid calculation is usually set to N times the time step of particle calculation. However, to accurately understand the effect of particles on the motion of the slurry–water interface, VOF and DEM take the same time step. After much research and many simulations, the time step was finally set to 1 × 10⁵ s.

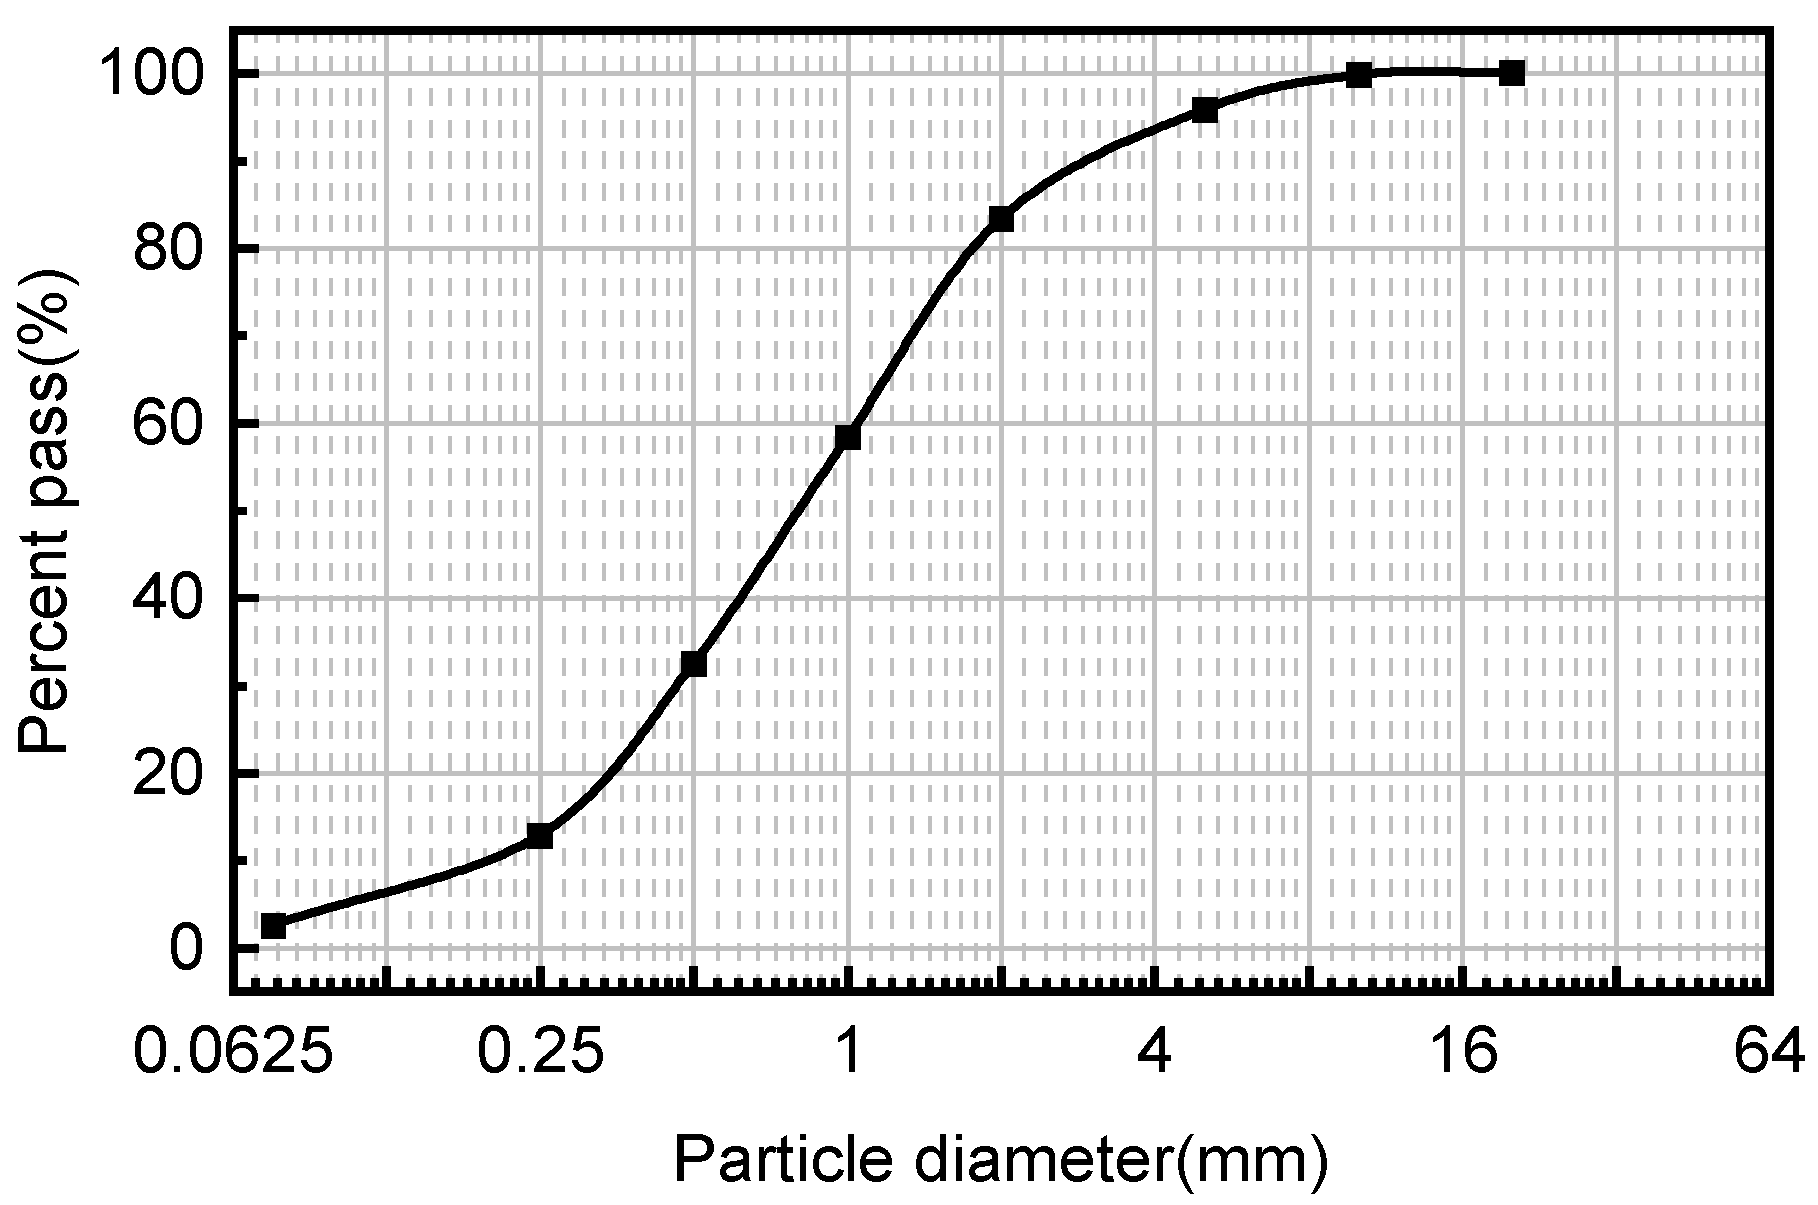
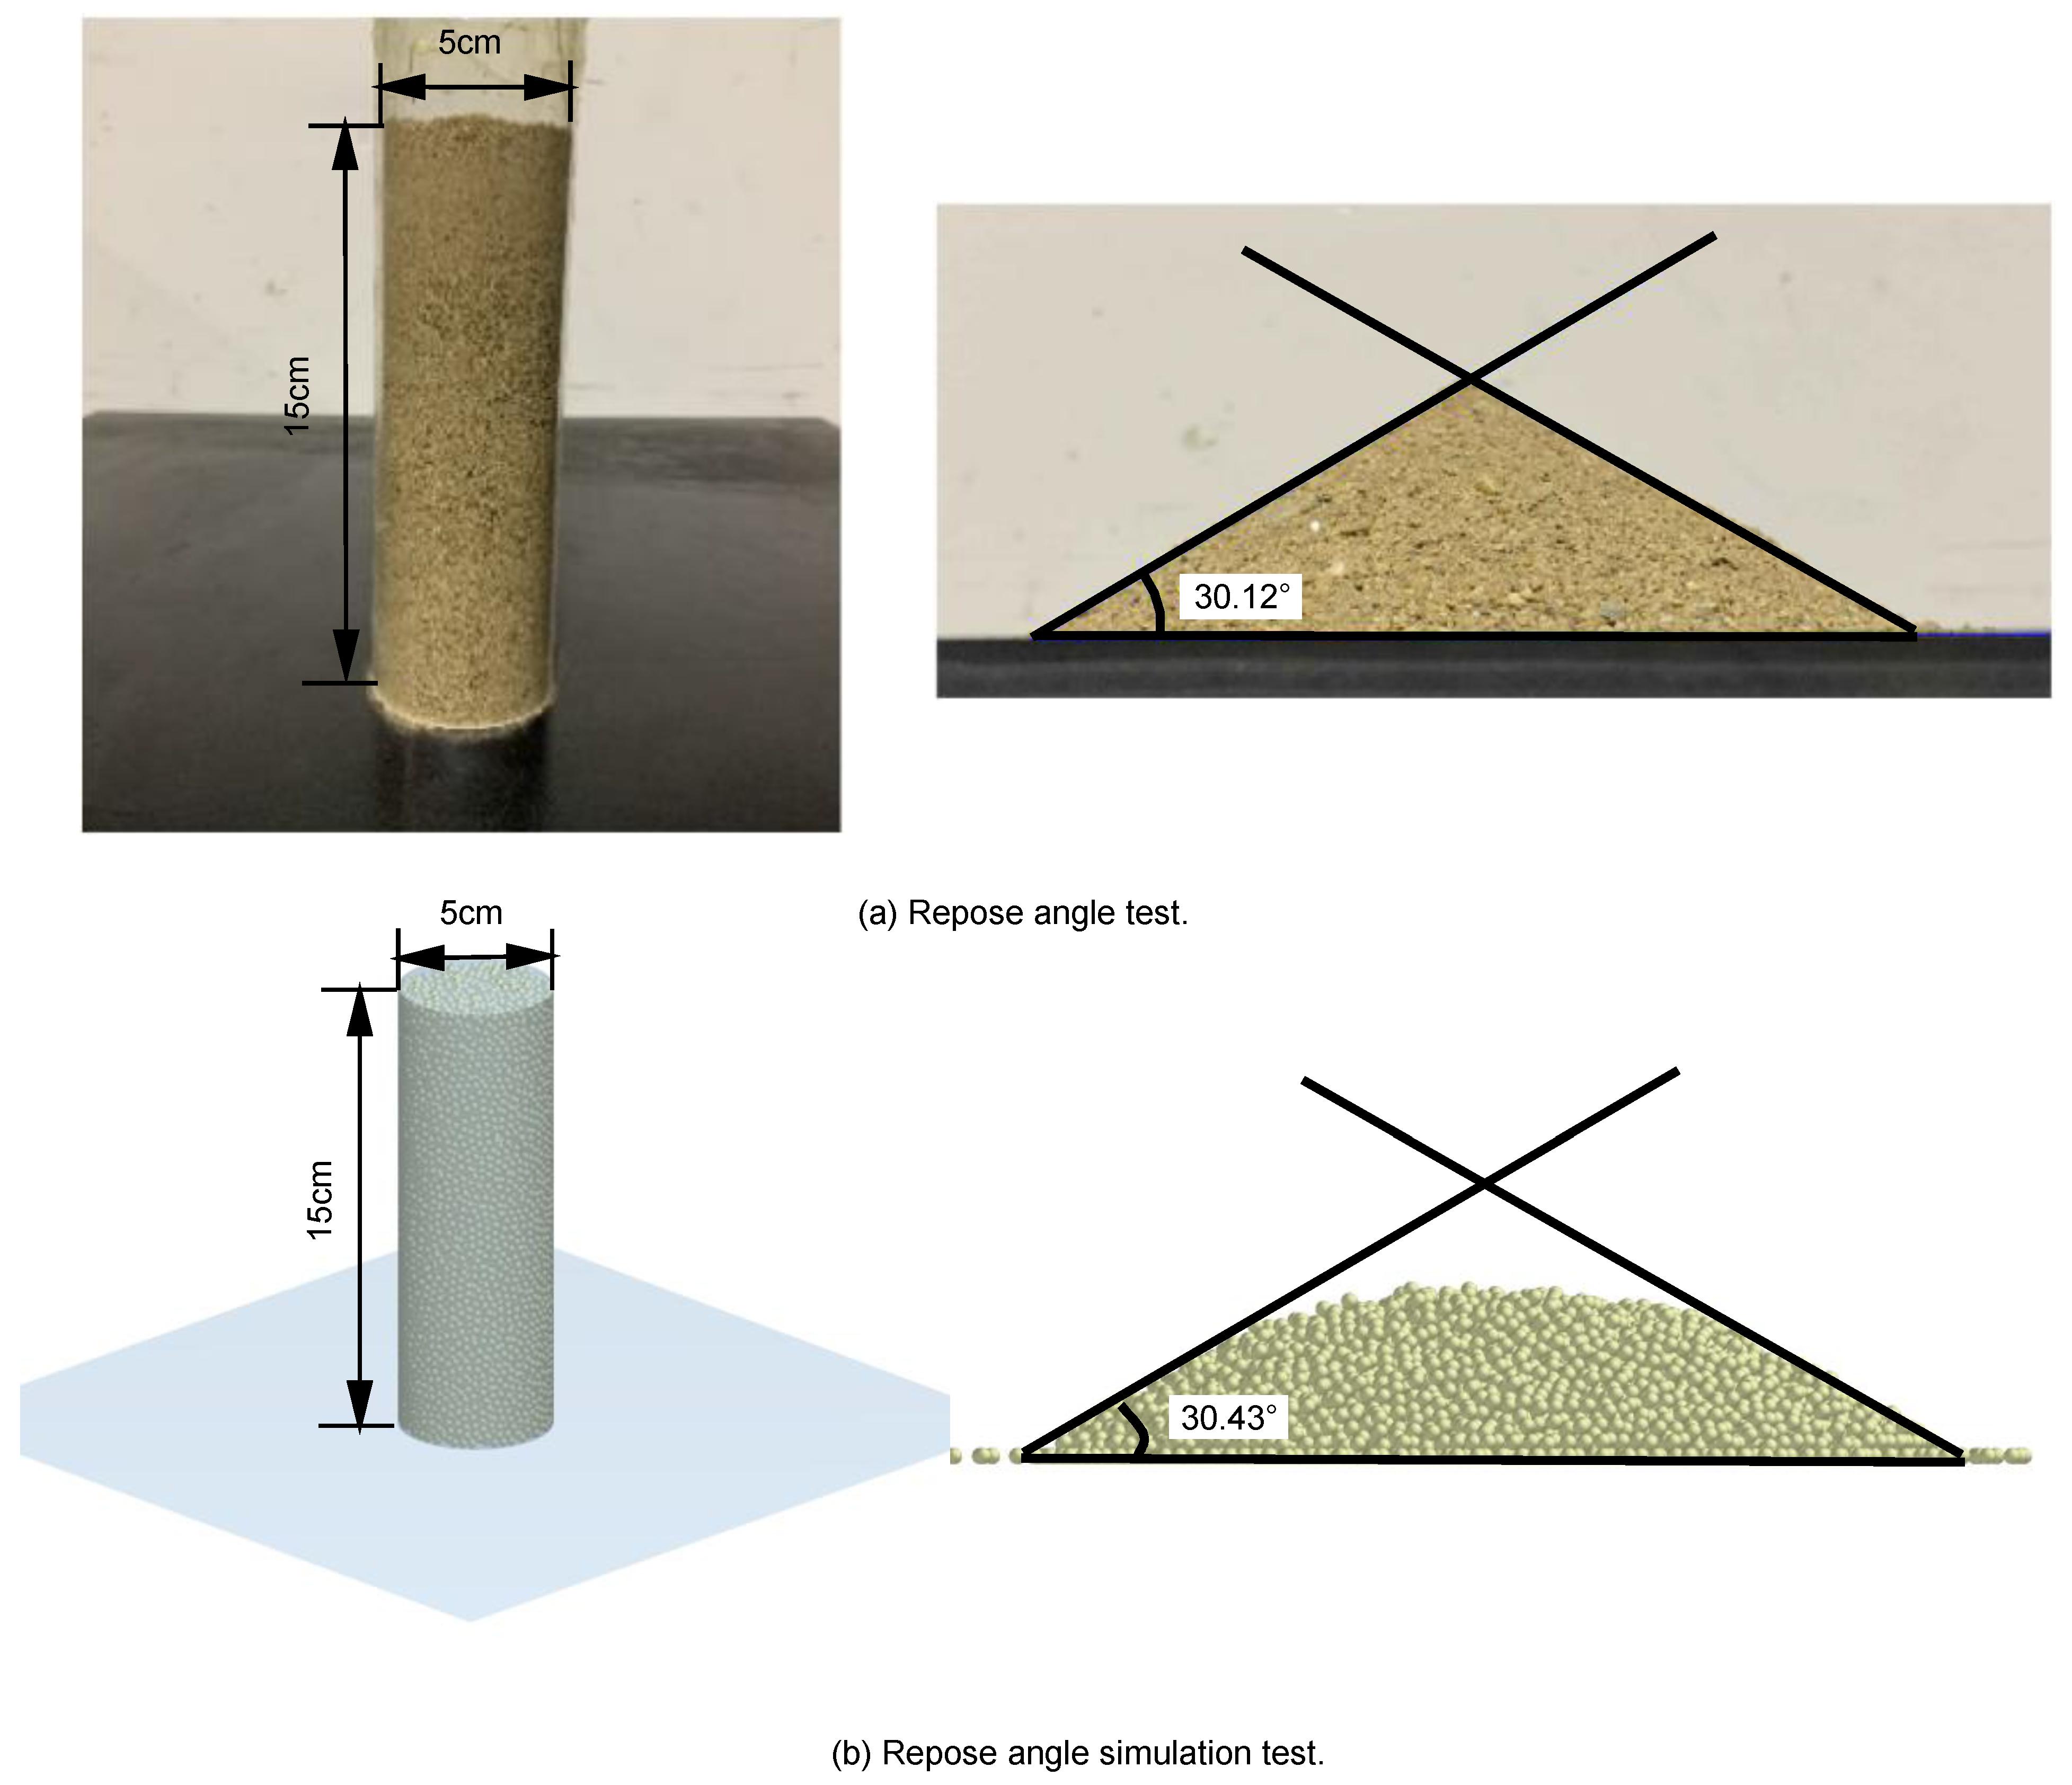
3. Simulation Parameters of Sandy Soil

Figure 3 depicts the particle size distribution curve of the sandy soil. The sandy soil particles with particle sizes ranging from 0.075 to 5 mm accounted for 93.30 percent of the total mass, and the average particle diameter of the sandy soil was 1.43 mm.
The repose angle is a macroscopic parameter that determines granular material movement and friction. The deposition shape of sandy soil is generally conical, and the sand particles are deposited in a certain direction, forming a certain repose angle of deposition. It is a standard method for calibrating contact parameters of particles in DEM. In addition, Ghazavi M et al. determined the correlation between the repose angle and the internal friction angle of sandy soils through a series of laboratory tests, which further demonstrated that the repose angle can be used to calibrate sandy soil contact parameters [30]. The comparison of the repose angle test and the repose angle simulation test is commonly used in EDEM to ensure that the DEM contact parameters are suitable.
The lifting cylinder test was used to determine the repose angle of the sandy soil. A hollow cylinder is placed vertically on a base of known roughness. Then, as in the concrete slump test, the cylinder is lifted upward from the base at a specific speed to cause the sand to form a cone at the base directly below. The test setup and test results are shown in Figure 4a, with a cylinder diameter of 5 cm, a height of 15 cm, and a cylinder lifting speed of 5 mm/s. After filling the cylinder with sandy soil, the cylinder was lifted. After the sand cone was stabilized, vertical photographs were taken. The photographs were imported into CAD to measure repose angles. The test was repeated 10 times, and the final result of the average repose angle was 30.12°.
The sand stratum model requires a large number of sand particles. The computational speed is restricted by the computer’s performance and the number of particles. To improve the computing speed of DEM simulations, researchers typically increase particle size, decrease particle type, and then calibrate the contact coefficient. Finally, the sandy soil model replicates the contact and friction effects of real sandy soil. In DEM simulations, there is currently no strict standard for the magnification ratio of particle diameter. According to previous studies [31,32,33], the sandy soil particle diameters are usually magnified less than 10 times. In this paper, the particle diameter of all sandy soil particles was finally confirmed to be 2.86 mm. To ensure that the simulation was not distorted, the numerical model was built according to a ratio of 1:1 based on the measured rest angle test setup, as shown in Figure 4b. The repose angle simulation test is the same as the repose angle test. First, the cylinder is filled with particles. The cylinder is then propelled vertically upward at a velocity of 5 mm/s, allowing the sand particles to accumulate naturally due to gravity. Finally, the simulation concludes when all particles cease to move. The repose angle of sandy soil was calculated using EDEM’s protractor function. Figure 4b illustrates the repose angle simulation process. Following the completion of a significant number of repose angle simulation tests and a comparison of simulation and actual testing, a contact coefficient with an error of 1.03% was finally obtained, as shown in Table 1.

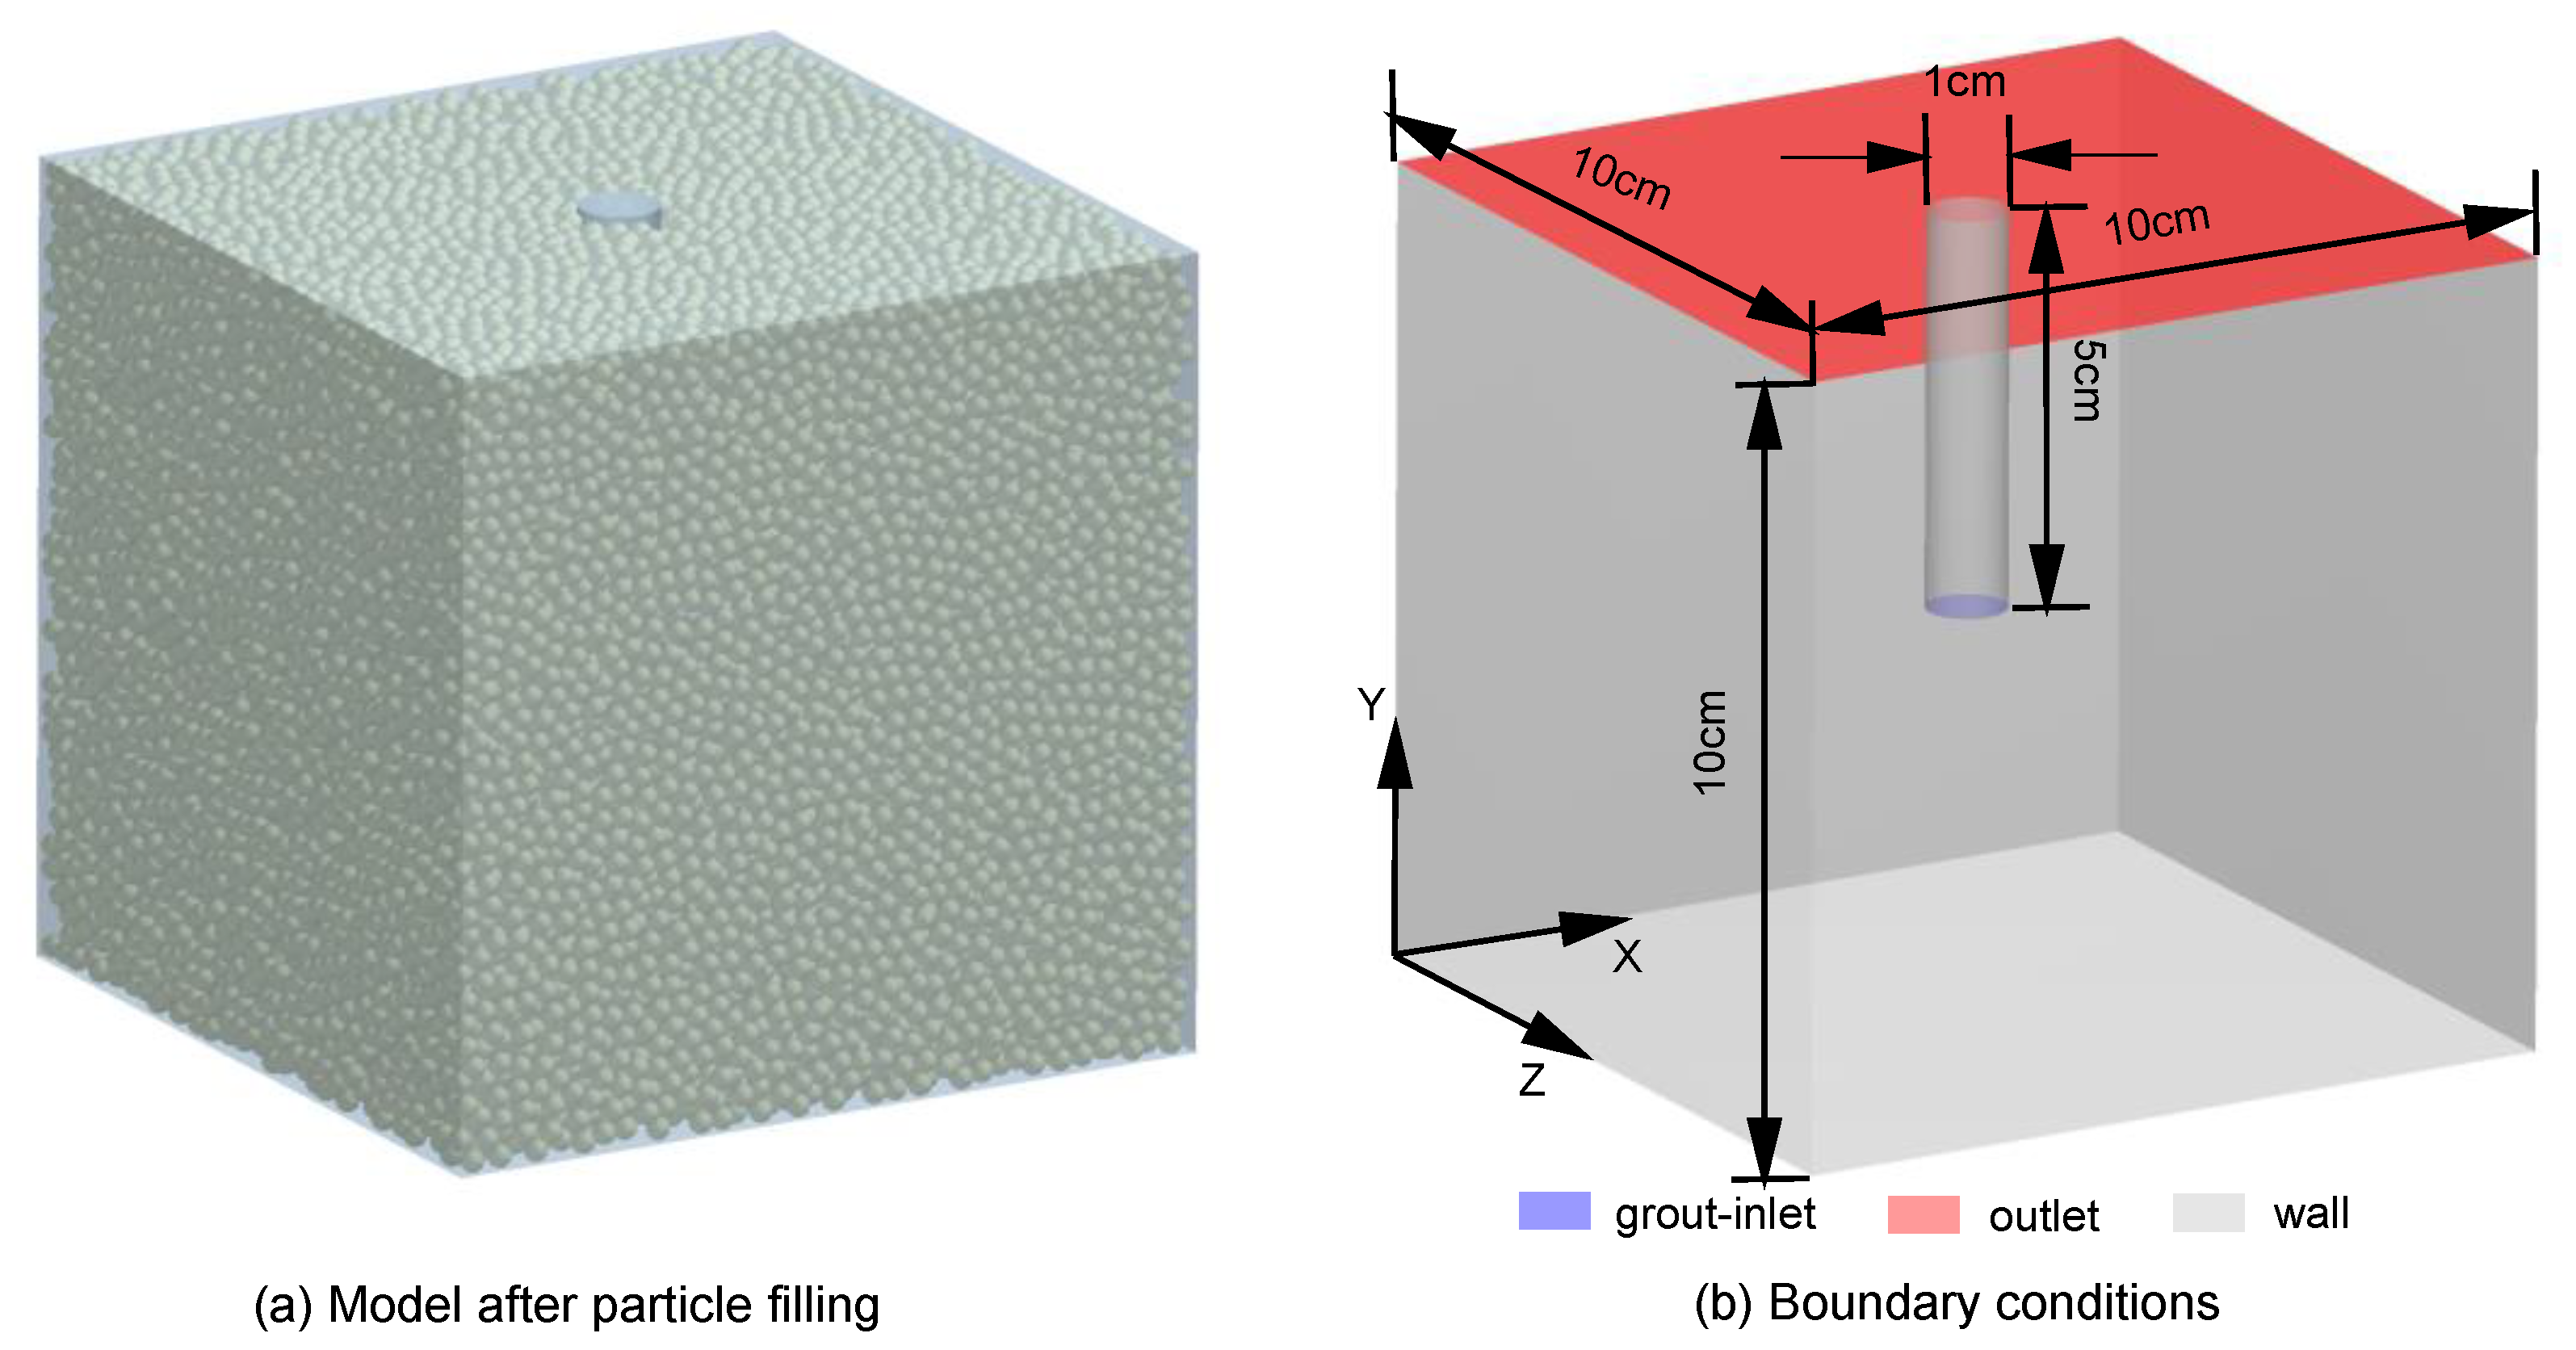
4. Calculation Model and Parameters

As shown in Figure 5, a 3D geometry model for the grouting test was divided into three functional sections: the grout-inlet section, the test section, and the outlet section. The sandbox was set to 10 × 10 × 10 cm. The diameter and length of the grouting pipe were set to 1 cm and 5 cm, respectively. The 3D geometry model was created in the Geometry module of ANSYS. Boundaries and meshes were set via the Meshing module of ANSYS.
The simulation used EDEM to model the sandy soil and FLUENT to model the groundwater and slurry. Before VOF–DEM coupling, sandy soil particles were generated in the sandbox in EDEM. A dense sand model with a porosity of 0.3 was filled with 56,929 particles and a loose sand model with a porosity of 0.4 was filled with 48,795 particles. Figure 6 depicts their porosity contours, where the porosity is fairly uniform and the influence of rigid walls on the porosity is obvious. During the coupling calculation, the slurry flowed vertically from the slurry inlet with a certain pressure to displace the groundwater in the sand layer. When a two-phase flow is transported in the computational domain using FLUENT, the flow field information is continually updated throughout the coupling with EDEM; hence, the transient calculation was used. The water and slurry were incompressible, so a pressure-based solver was chosen. The slurry and water flowed relatively slowly in the sand stratum, so the laminar flow model was chosen. The slurry flowed in the y direction, with the inlet (y = 0) set to be the pressure inlet and the outlet (y = 5 cm) set to be the pressure outlet. Cement slurry with a water–cement ratio of 1 was used as the grouting material. The pore space of the sand stratum was filled with groundwater. The parameter settings in FLUENT are shown in Table 2.
To study the effects of grouting pressure and sand porosity on the diffusion mechanism of grouting in saturated water-bearing sand stratum, numerical simulation schemes were designed, as shown in Table 3.

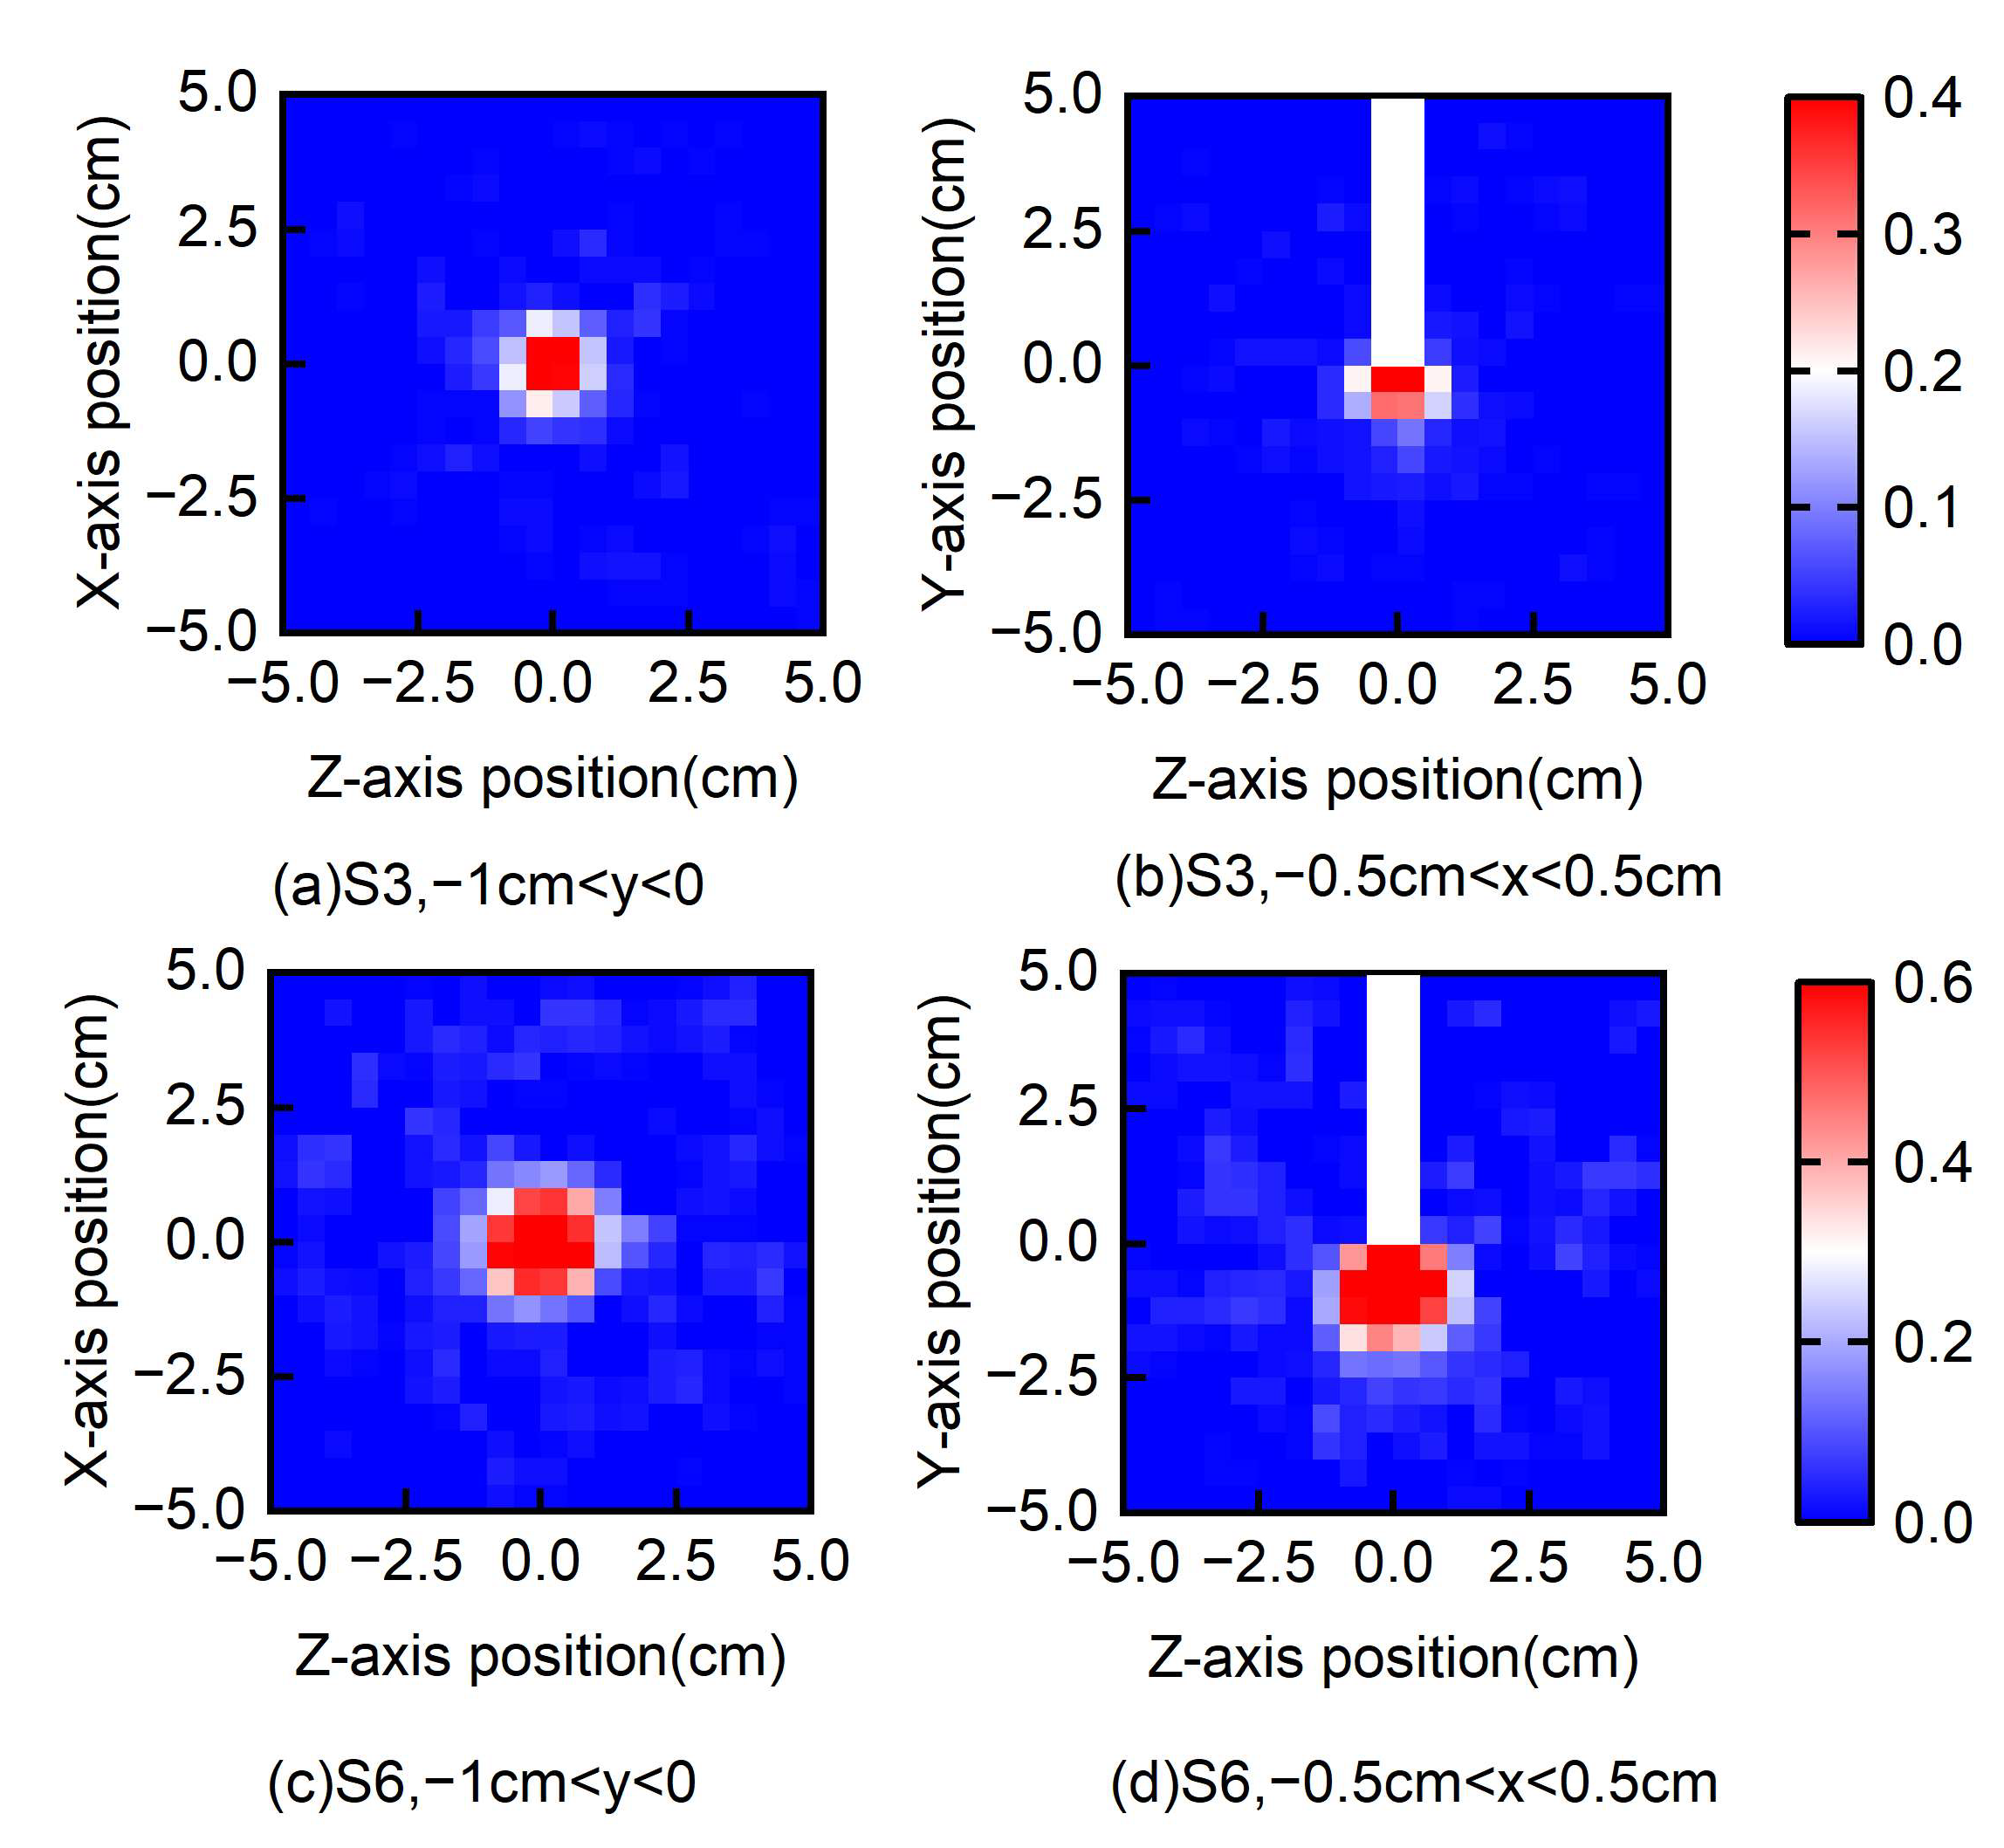
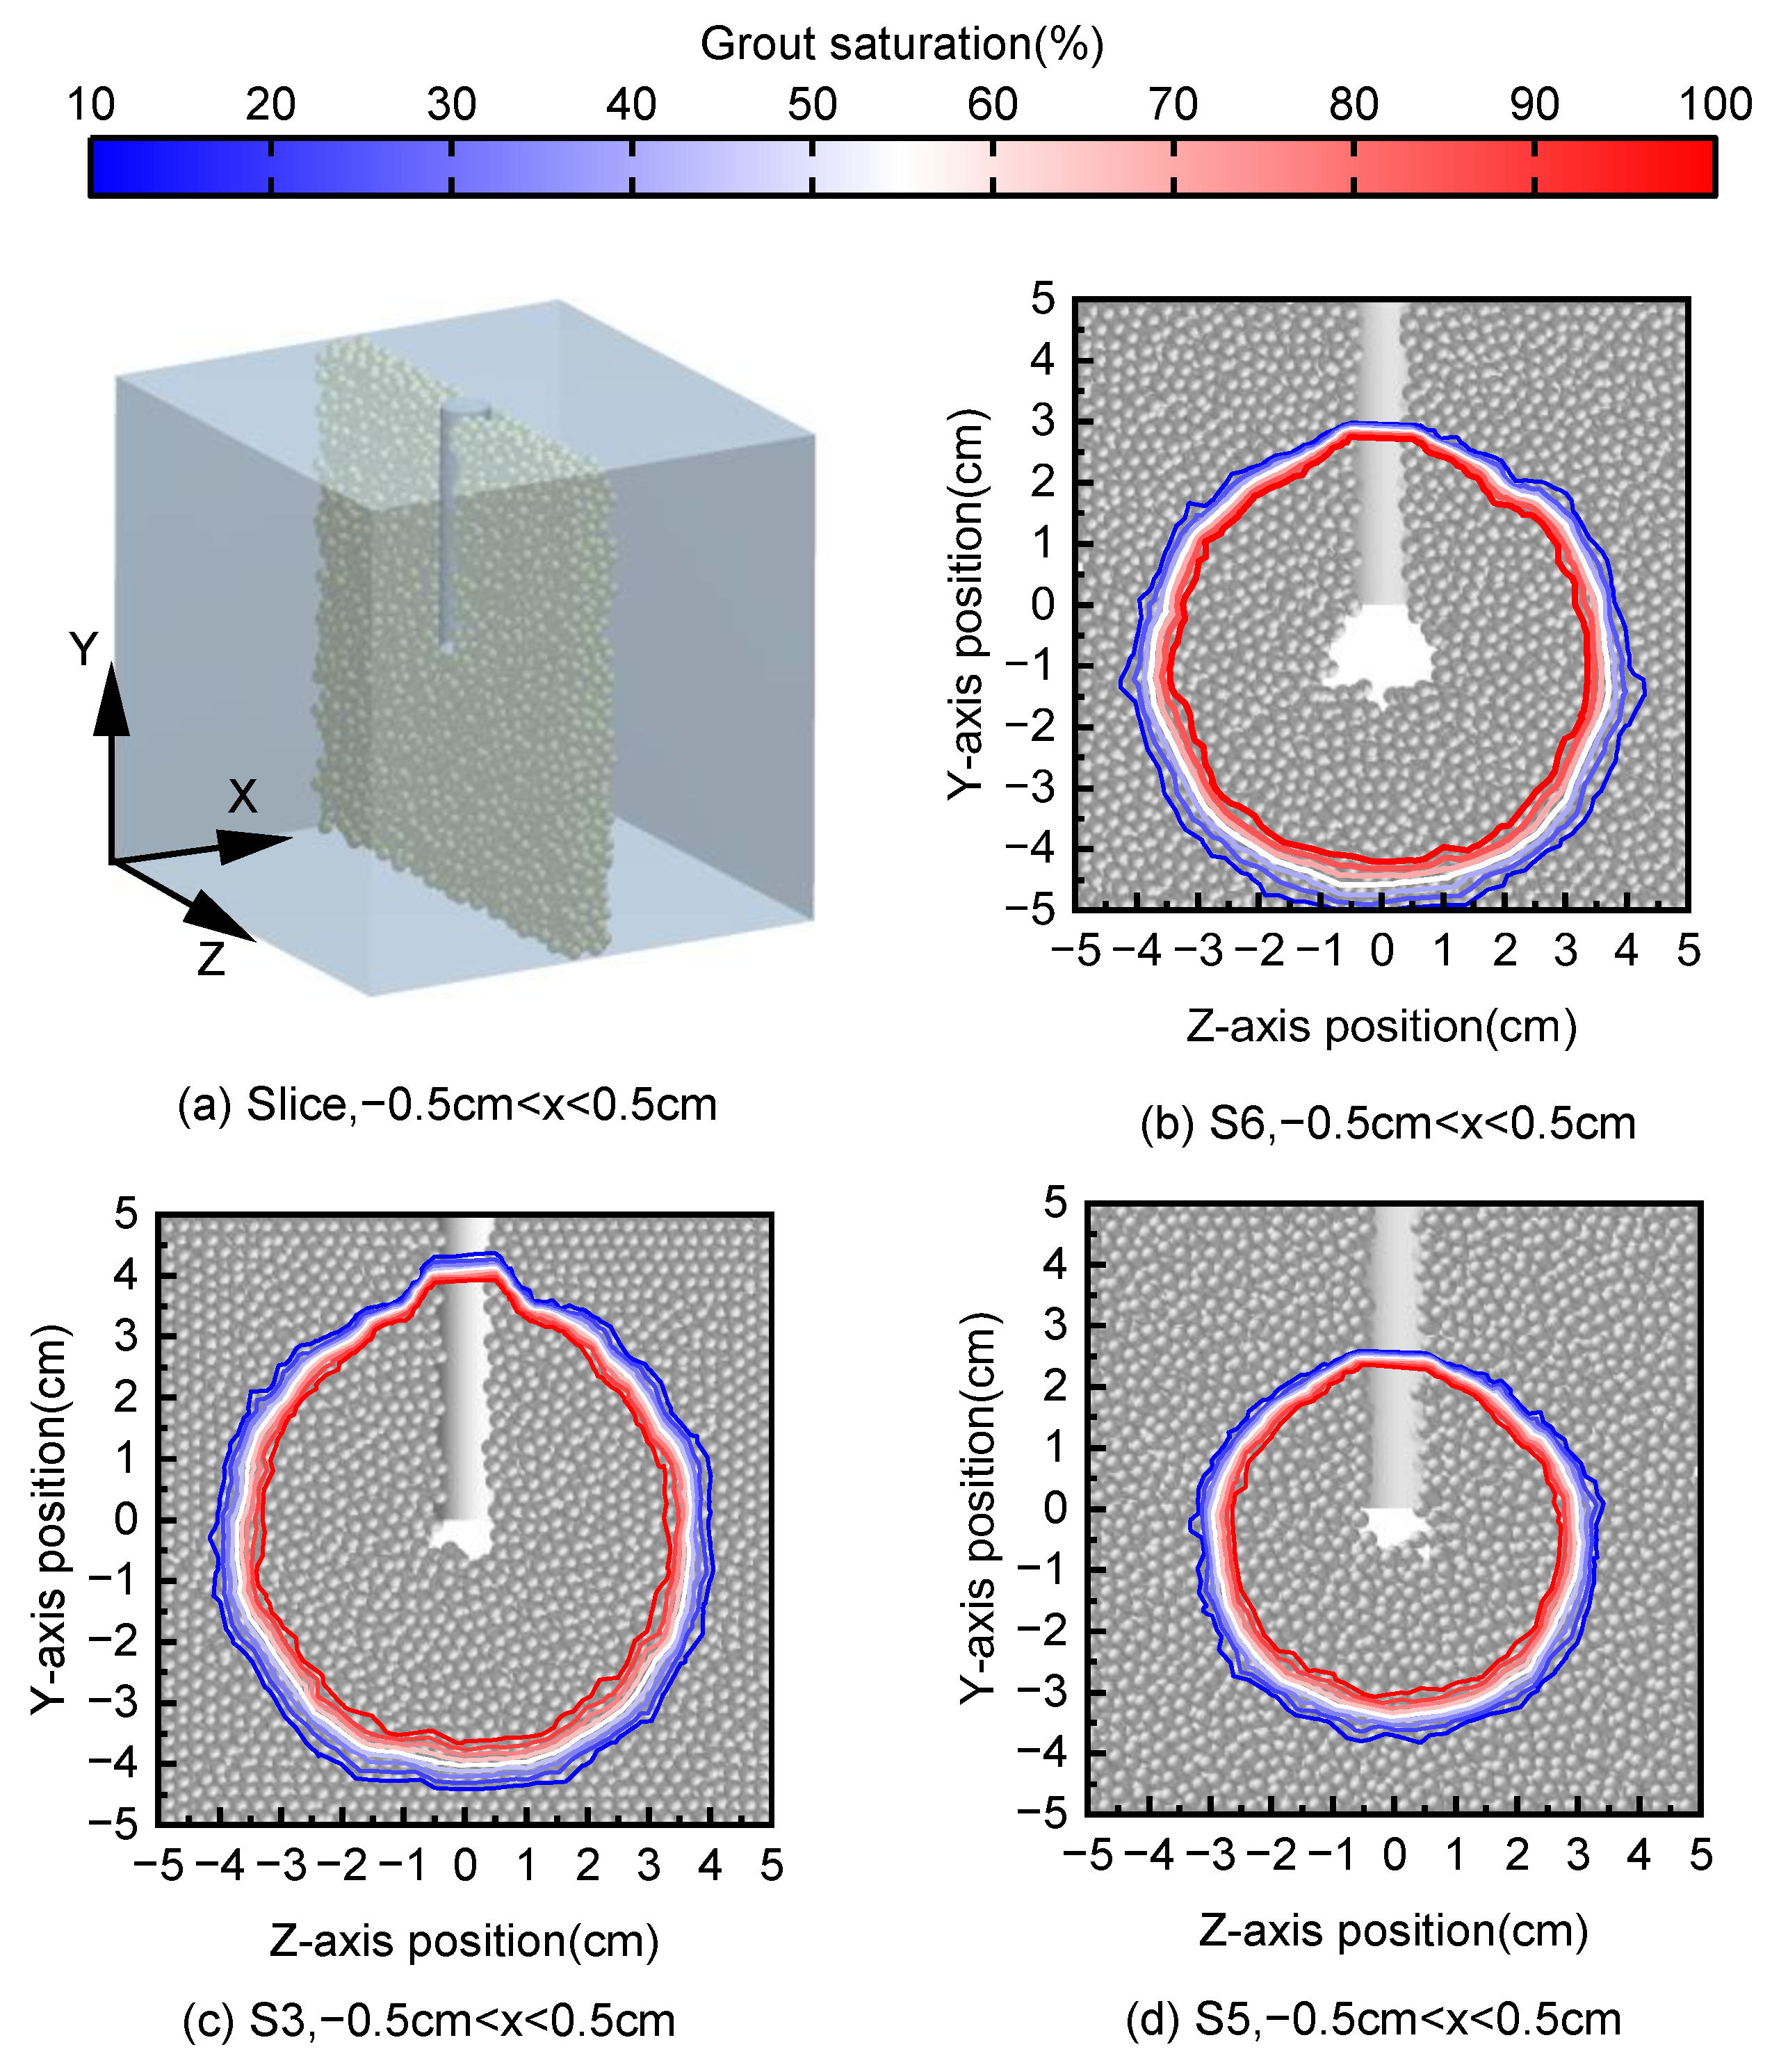
5. Analysis of Calculation Results

The grouting time was 0.05 s in all of the tests discussed in this section. Figure 7 shows a comparison of the final arrangement of the slurry and sand particles under different grouting conditions. The spatial distribution of the slurry along the X- and Z-axes is depicted in Figure 7 in the central portion, where the thickness equals the pipe diameter. The qualitative analysis of all injection simulations demonstrates that two distinct diffusion mechanisms occurred within the sandy soil.
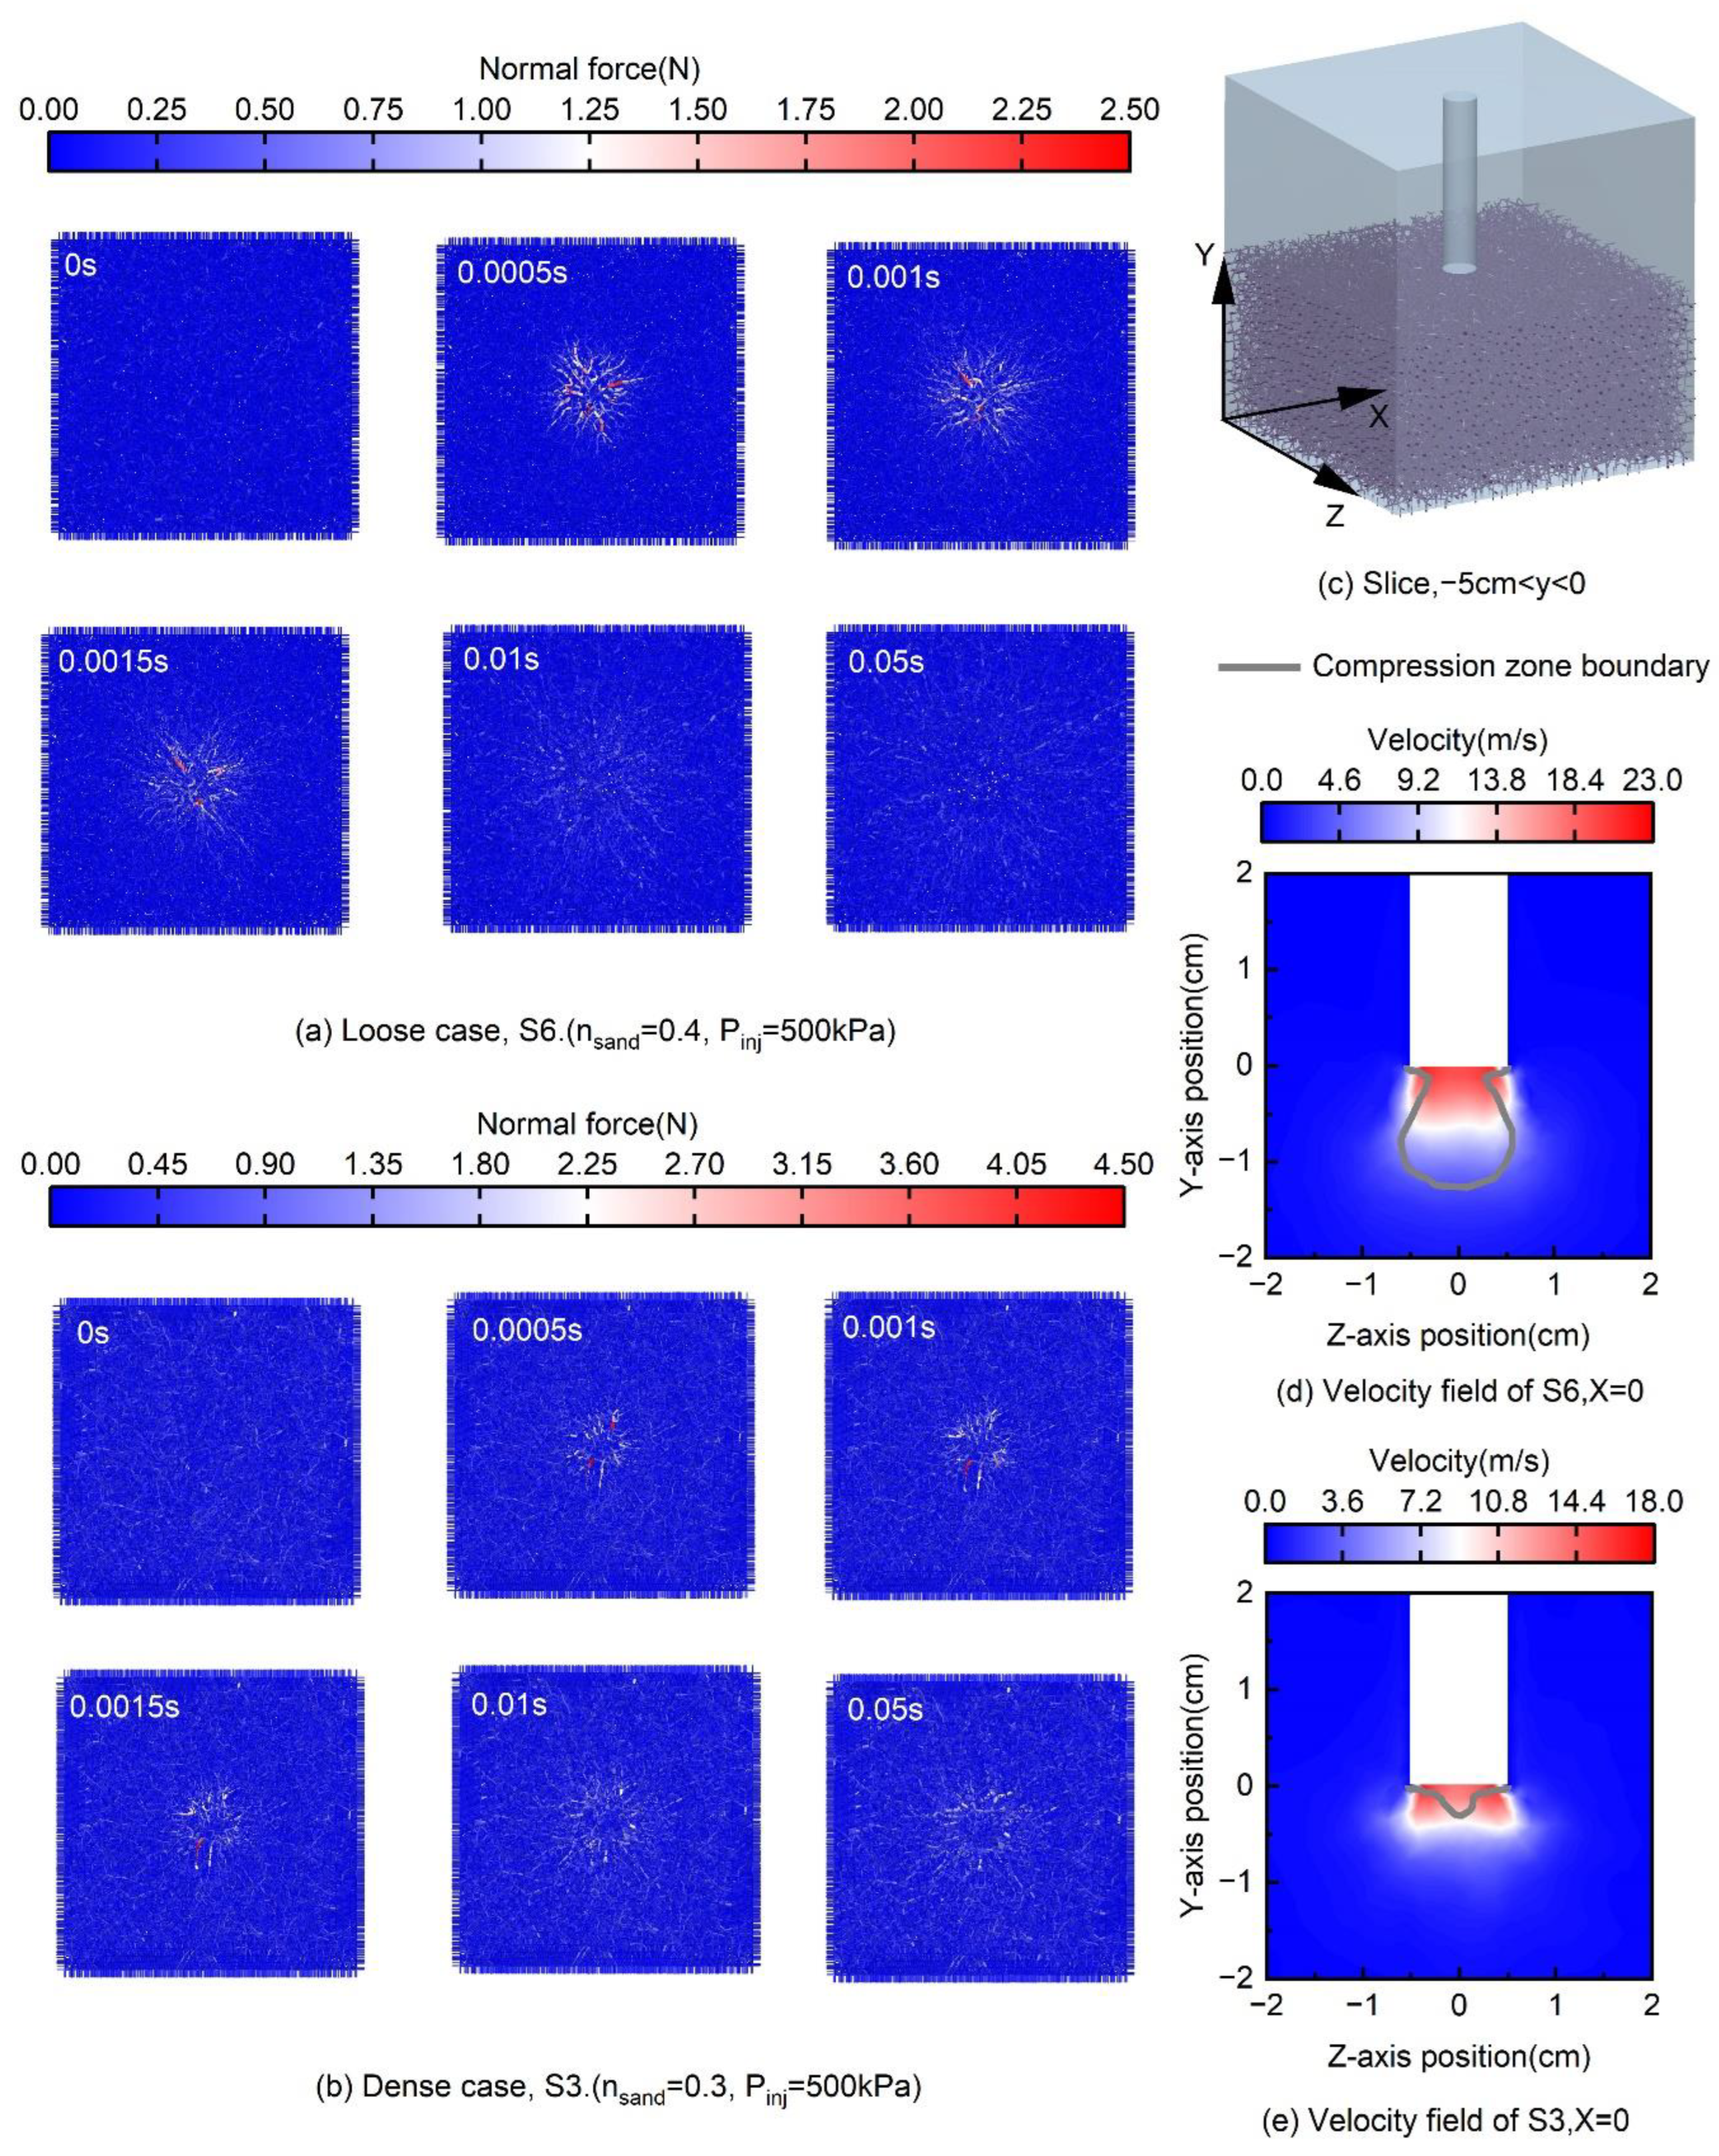
  • Compaction diffusion mechanism: Due to the dislocation of sandy soil particles and the formation of only slurry, it did not contain a sandy soil compaction zone.
  • Permeation diffusion mechanism: The slurry flows in the pores of the sandy soil did not seriously change the microstructure of the sandy soil.
It is obvious from Figure 7 that when the initial density was large enough (Figure 7c), permeation diffusion dominated over compaction diffusion. The size of the compaction zone was small and most of the slurry permeated into the pores of the sand stratum. In contrast, in the loose sand (Figure 7b), compaction diffusion was prevalent and the compaction zone was well developed. Relative to Figure 7c (dense state), the displacement vector amplitude of each sand particle in Figure 7b (loose state) was larger. In fact, in loose sands, the wider void space allowed the rearrangement of sand particles to be less constrained, whereas in dense sands, the dense tissue structure limited the displacement of sand particles. This constraint resulted in a higher increase in contact force due to slurry injection relative to the loose sandy soil (Figure 8). The displacement vector amplitude of each sandy soil particle in Figure 7b (high grouting pressure) was larger compared to Figure 7d (low grouting pressure).
Figure 8 illustrates the variation in the force chain during grouting. At the early stage of grouting, both dense sandy soil and loose sandy soil formed strong chains, at which time compaction diffusion prevailed over permeation diffusion. The propagation of force chains in loose sand was more extensive than in dense sand. In loose sands (Figure 8a), the wider pore space made the sand more mobile and more conducive to the propagation of force chains. In contrast, in dense sands (Figure 8b), the dense skeleton, although leading to larger contact forces, also limited the propagation of force chains. With time, the strong force chain gradually disappeared, at which time permeation diffusion was dominant over compaction diffusion. After the grouting was completed, a small number of medium force chains also appeared in the dense sand, whereas only weak force chains were present in the loose sand. From Figure 8d,e, it can be seen that the boundary of the compaction zone of loose sand was far away from the high-flow-rate zone of the slurry and the particles were subjected to less drag force compared to the dense sand. From the degree of velocity decay of the slurry in Figure 8d,e, it can be seen that the dense sandy soil had a high viscous resistance to the slurry, which was not conducive to the diffusion of the slurry. Finally, it is worth noting that the grouting process only caused a large increase in contact force near the grouting hole and did not cause a large increase in contact force throughout the specimen, as the stresses generated by the slurry during permeation were mainly borne by the pore water.
The pore space distribution changed after the slurry was injected, and some of the pores were filled with slurry. Because the sandbox’s boundary was fixed during the injection process, the development of the sand particle distribution was a disruption of the material’s homogeneity rather than a change in its volume average. Since the slurry was connected to the sand particles by drag, the slurry did not exist as a physical entity in the DEM. Here the variation in pore space structure was considered only for sandy soil particles. In Figure 9, the local variations in porosity of loose and dense sands were compared. In particular, the text showed clouds of porosity changes associated with slices of the specimens perpendicular to the injection direction (Figure 9a,c) and central slices parallel to the injection direction (Figure 9b,d). The thickness of the two slices was the diameter of the grouting pipe.
From the observed rearrangement of sand particles, the skeletal damage of dense sand at the corresponding area of injection was small, whereas the skeletal damage of loose sand was relatively large. Regardless of dense sand or loose sand, the arrangement of the sand particles’ position in the slurry permeation region was unchanged. The vast majority of the stresses generated by the slurry on the saturated sandy soil during permeation diffusion were borne by the pore water. For saturated soils, after external loading, the corresponding stress was generated in the soil, which was borne by both soil particles and pore water. However, only the stress borne by the soil particles deformed the soil, whereas the stress transmitted through the groundwater in the pore space did not affect the strength or deformation of the soil.
Figure 10 illustrates the slurry diffusion boundaries of the six grouting tests after 0.05 s of grouting (slurry saturation equal to 10%). It can be seen that the diffusion range of the slurry was positively related to the grouting pressure and porosity. The slurry in both loose and dense sand was symmetrically diffused in the horizontal plane. The dominant path along the boundary of the grouting pipe wall, where the porosity was higher, was evident (Figure 10a). The slurry in dense sand was symmetrically diffused in the vertical plane, whereas it was asymmetrically diffused in loose sand, and the downside was larger than the upside, for two reasons:
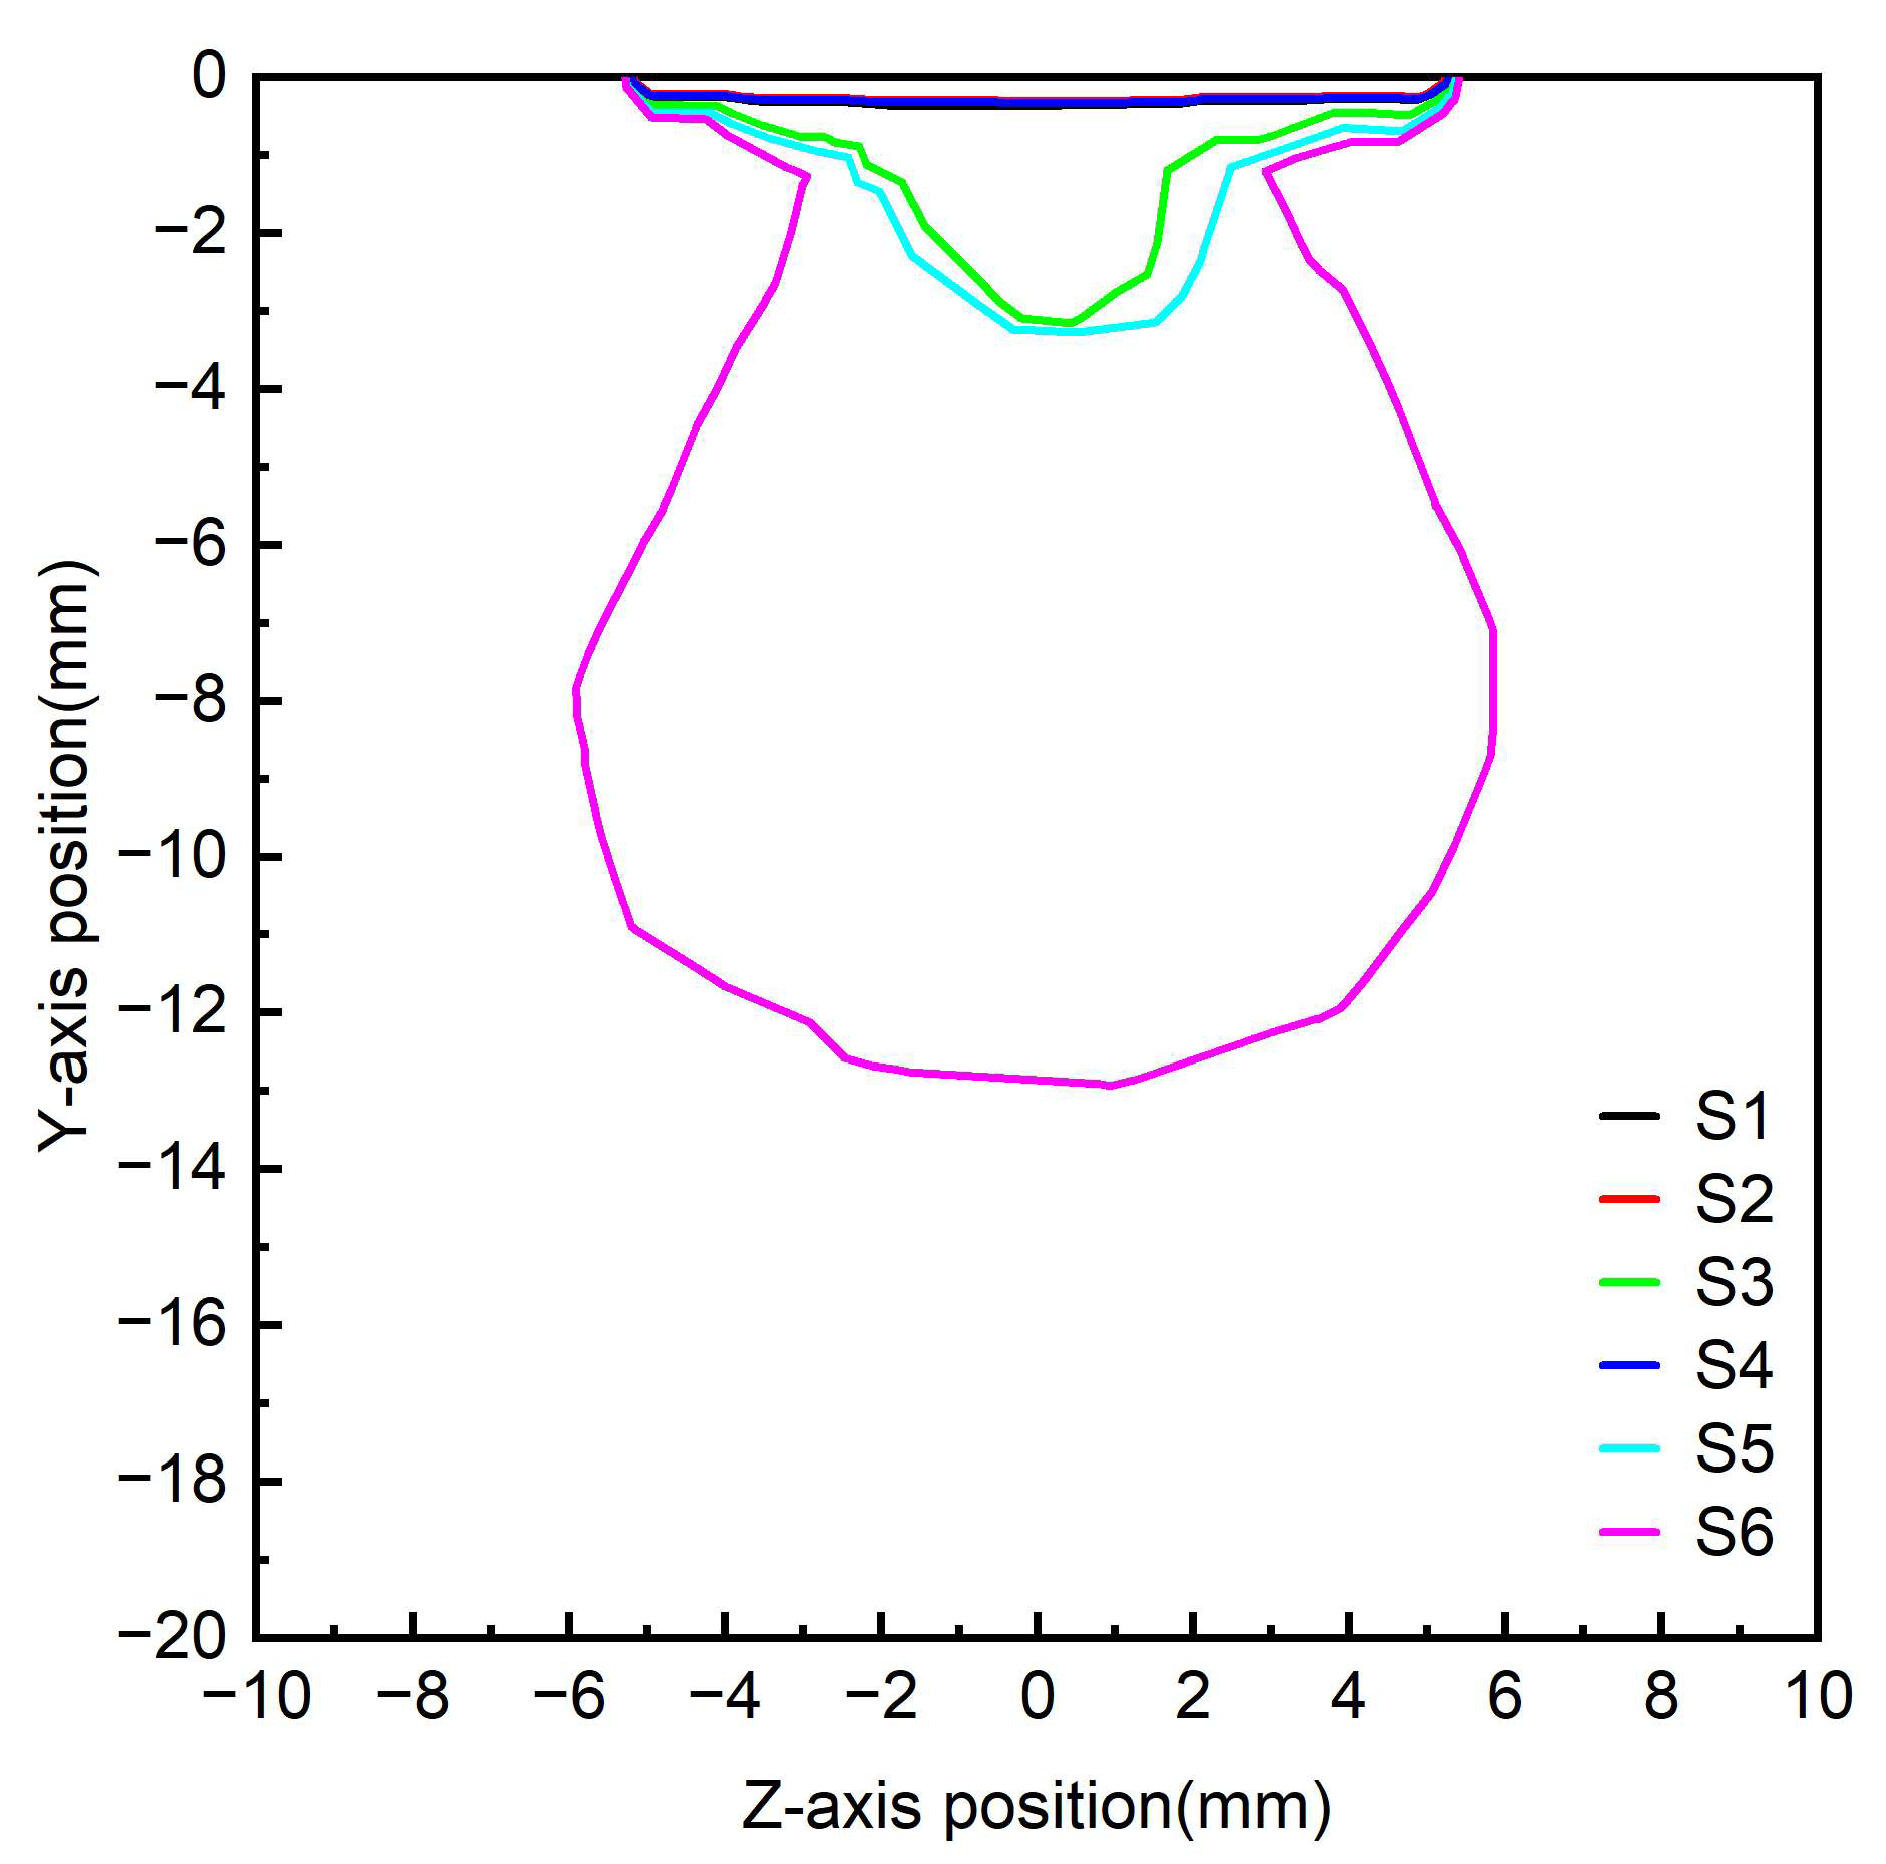
  • The larger compaction zone made the diffusion center of the slurry move downward.
  • The slurry diffusion was influenced by gravity due to the low viscous resistance of loose sand to the slurry.
The boundaries of the compaction zone for the six grouting tests are given in Figure 11. It can be seen that the extent of the compaction zone was positively correlated with the grouting pressure and porosity. Figure 12 illustrates the forces on the sand particles during the flow of the slurry. In dense sand, the contact forces on the sand particles were more and greater, the drag force on the sand particles during the flow of the slurry was not enough to resist the contact forces, and the effect on the particle skeleton structure was smaller. In loose sand, the contact force on sand and soil particles was less and smaller, and the drag force on sand and soil particles during the flow of slurry was enough to resist the contact force, which had more influence on the particle skeleton structure. At this time, the diffusion of slurry not only repelled the pore water but also repelled part of the sandy soil particles. In particular, the slurry flow rate in the loose specimen was greater than that in the loose specimen under the same grouting pressure condition (Figure 8d,e), which made the above phenomenon more obvious.
The compaction direction was in the negative direction of the Y-axis, so the compaction rate CR was proposed to quantify the degree of compaction of the slurry under each condition, which is defined as
C R = l c l
where   l c   is the maximum compaction distance in the negative direction of the Y-axis, and l   is the maximum diffusion distance in the negative direction of the Y-axis.
Table 4 shows the calculated results of CR after completion of the grouting. In the case of loose sand, the CR was 25.8% when the grouting pressure was 500 kPa. When its grouting pressure was reduced to 200 kPa, its CR dropped to 8.89%. When its grouting pressure was reduced to 50 kPa, no compaction occurred. In the case of dense sand, when the grouting pressure was 500 kPa, the CR was 7.25%. When the grouting pressure was lower than 500 kPa, no compaction occurred. It can be seen that in loose sand when the grouting pressure was less than 200 kPa, no compaction occurred during the grouting process. In dense sand, when the grouting pressure was less than 500 kPa, no compaction occurred during the grouting process.
Figure 13 depicts the amount of grout injected with the same cement slurry (with a w/c ratio of 1) at increasing grouting pressure with degrees of porosities of 0.3 and 0.4. At a grouting pressure of 50 kPa, 7.4 mL of slurry was injected into sandy soil with a porosity of 0.3, whereas 11.5 mL of slurry was injected into sandy soil with a porosity of 0.4. As the grouting pressure increased, the injected volume increased almost linearly for both porosity of 0.3 and 0.4, reaching 63.7 and 81.3 mL, respectively. Figure 13 also clearly shows that for a porosity of 0.3, the injection volume was much lower than for a porosity of 0.4.
In the two cases, the increase rate of grouting volume with the increase in grouting pressure was different, and the increase rate of grouting volume in sandy soil with a porosity of 0.4 was larger.

6. Conclusions

To study the microscopic mechanism of grouting in saturated water-bearing sand layers, this paper adopted the coupled VOF–DEM method to simulate the grouting process in saturated water-bearing sand layers. Through simulations, some conclusions were drawn, as explained below.
(1)
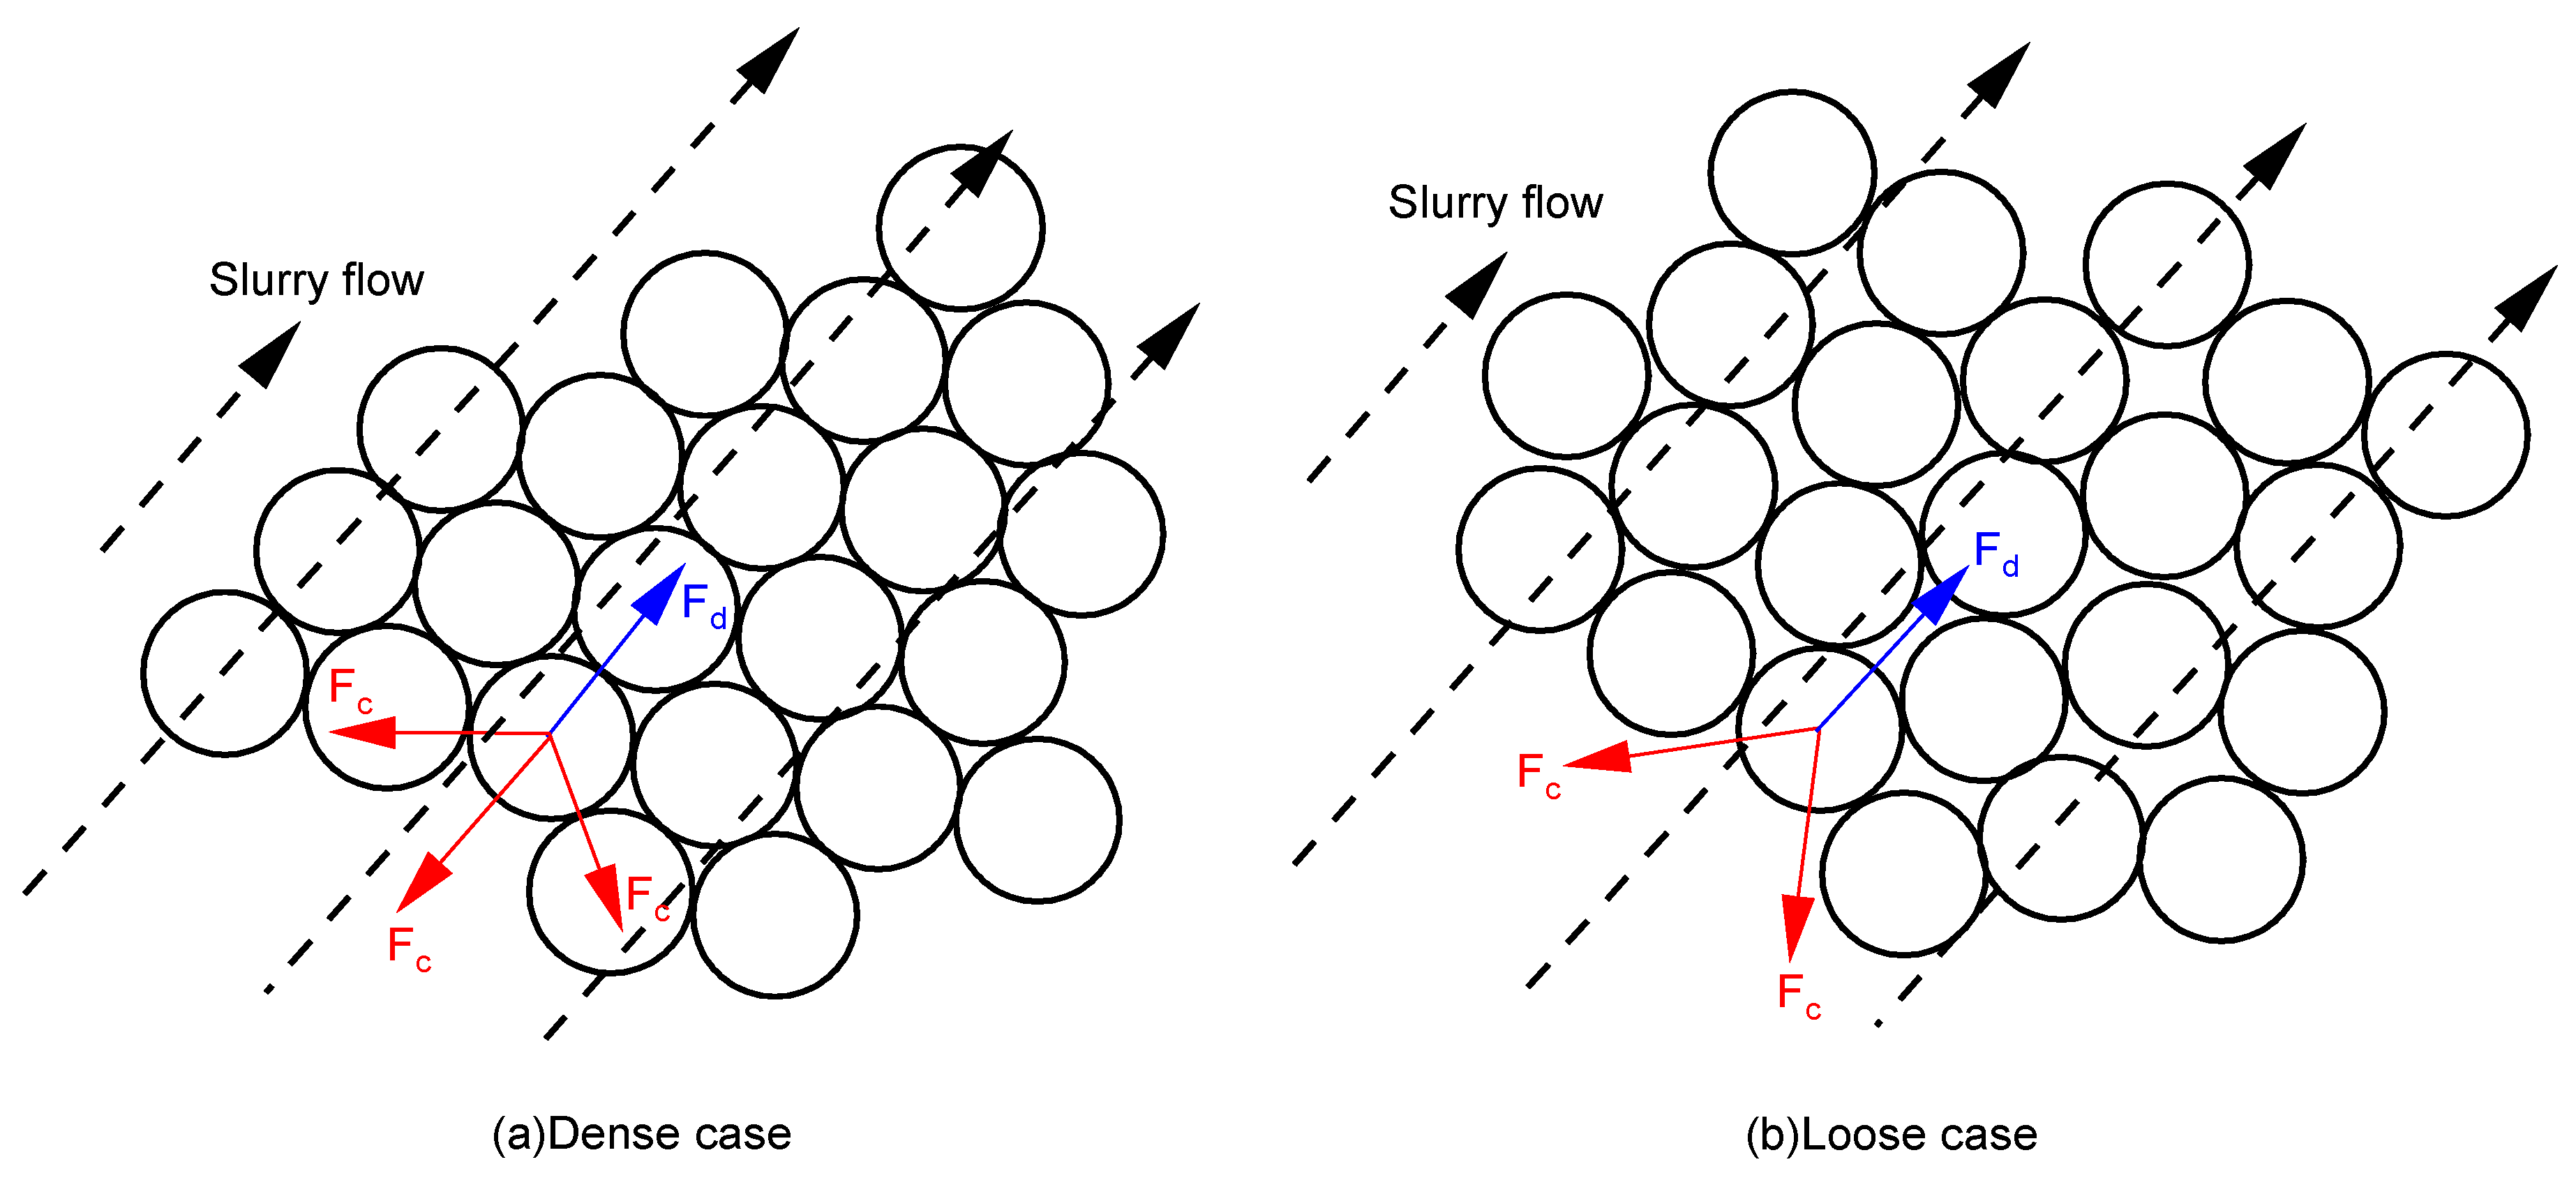
In dense sands, the permeation diffusion of the slurry dominated, whereas in loose sands, the compaction zone was well developed.
(2)
The evolution of the force chain state during grouting indicates the loose sand had a wider propagation of stress and the dense sand had a larger increase in the stress state. The diffusion model of the slurry changed from compaction diffusion dominated by permeation diffusion to permeation diffusion dominated by compaction diffusion.
(3)
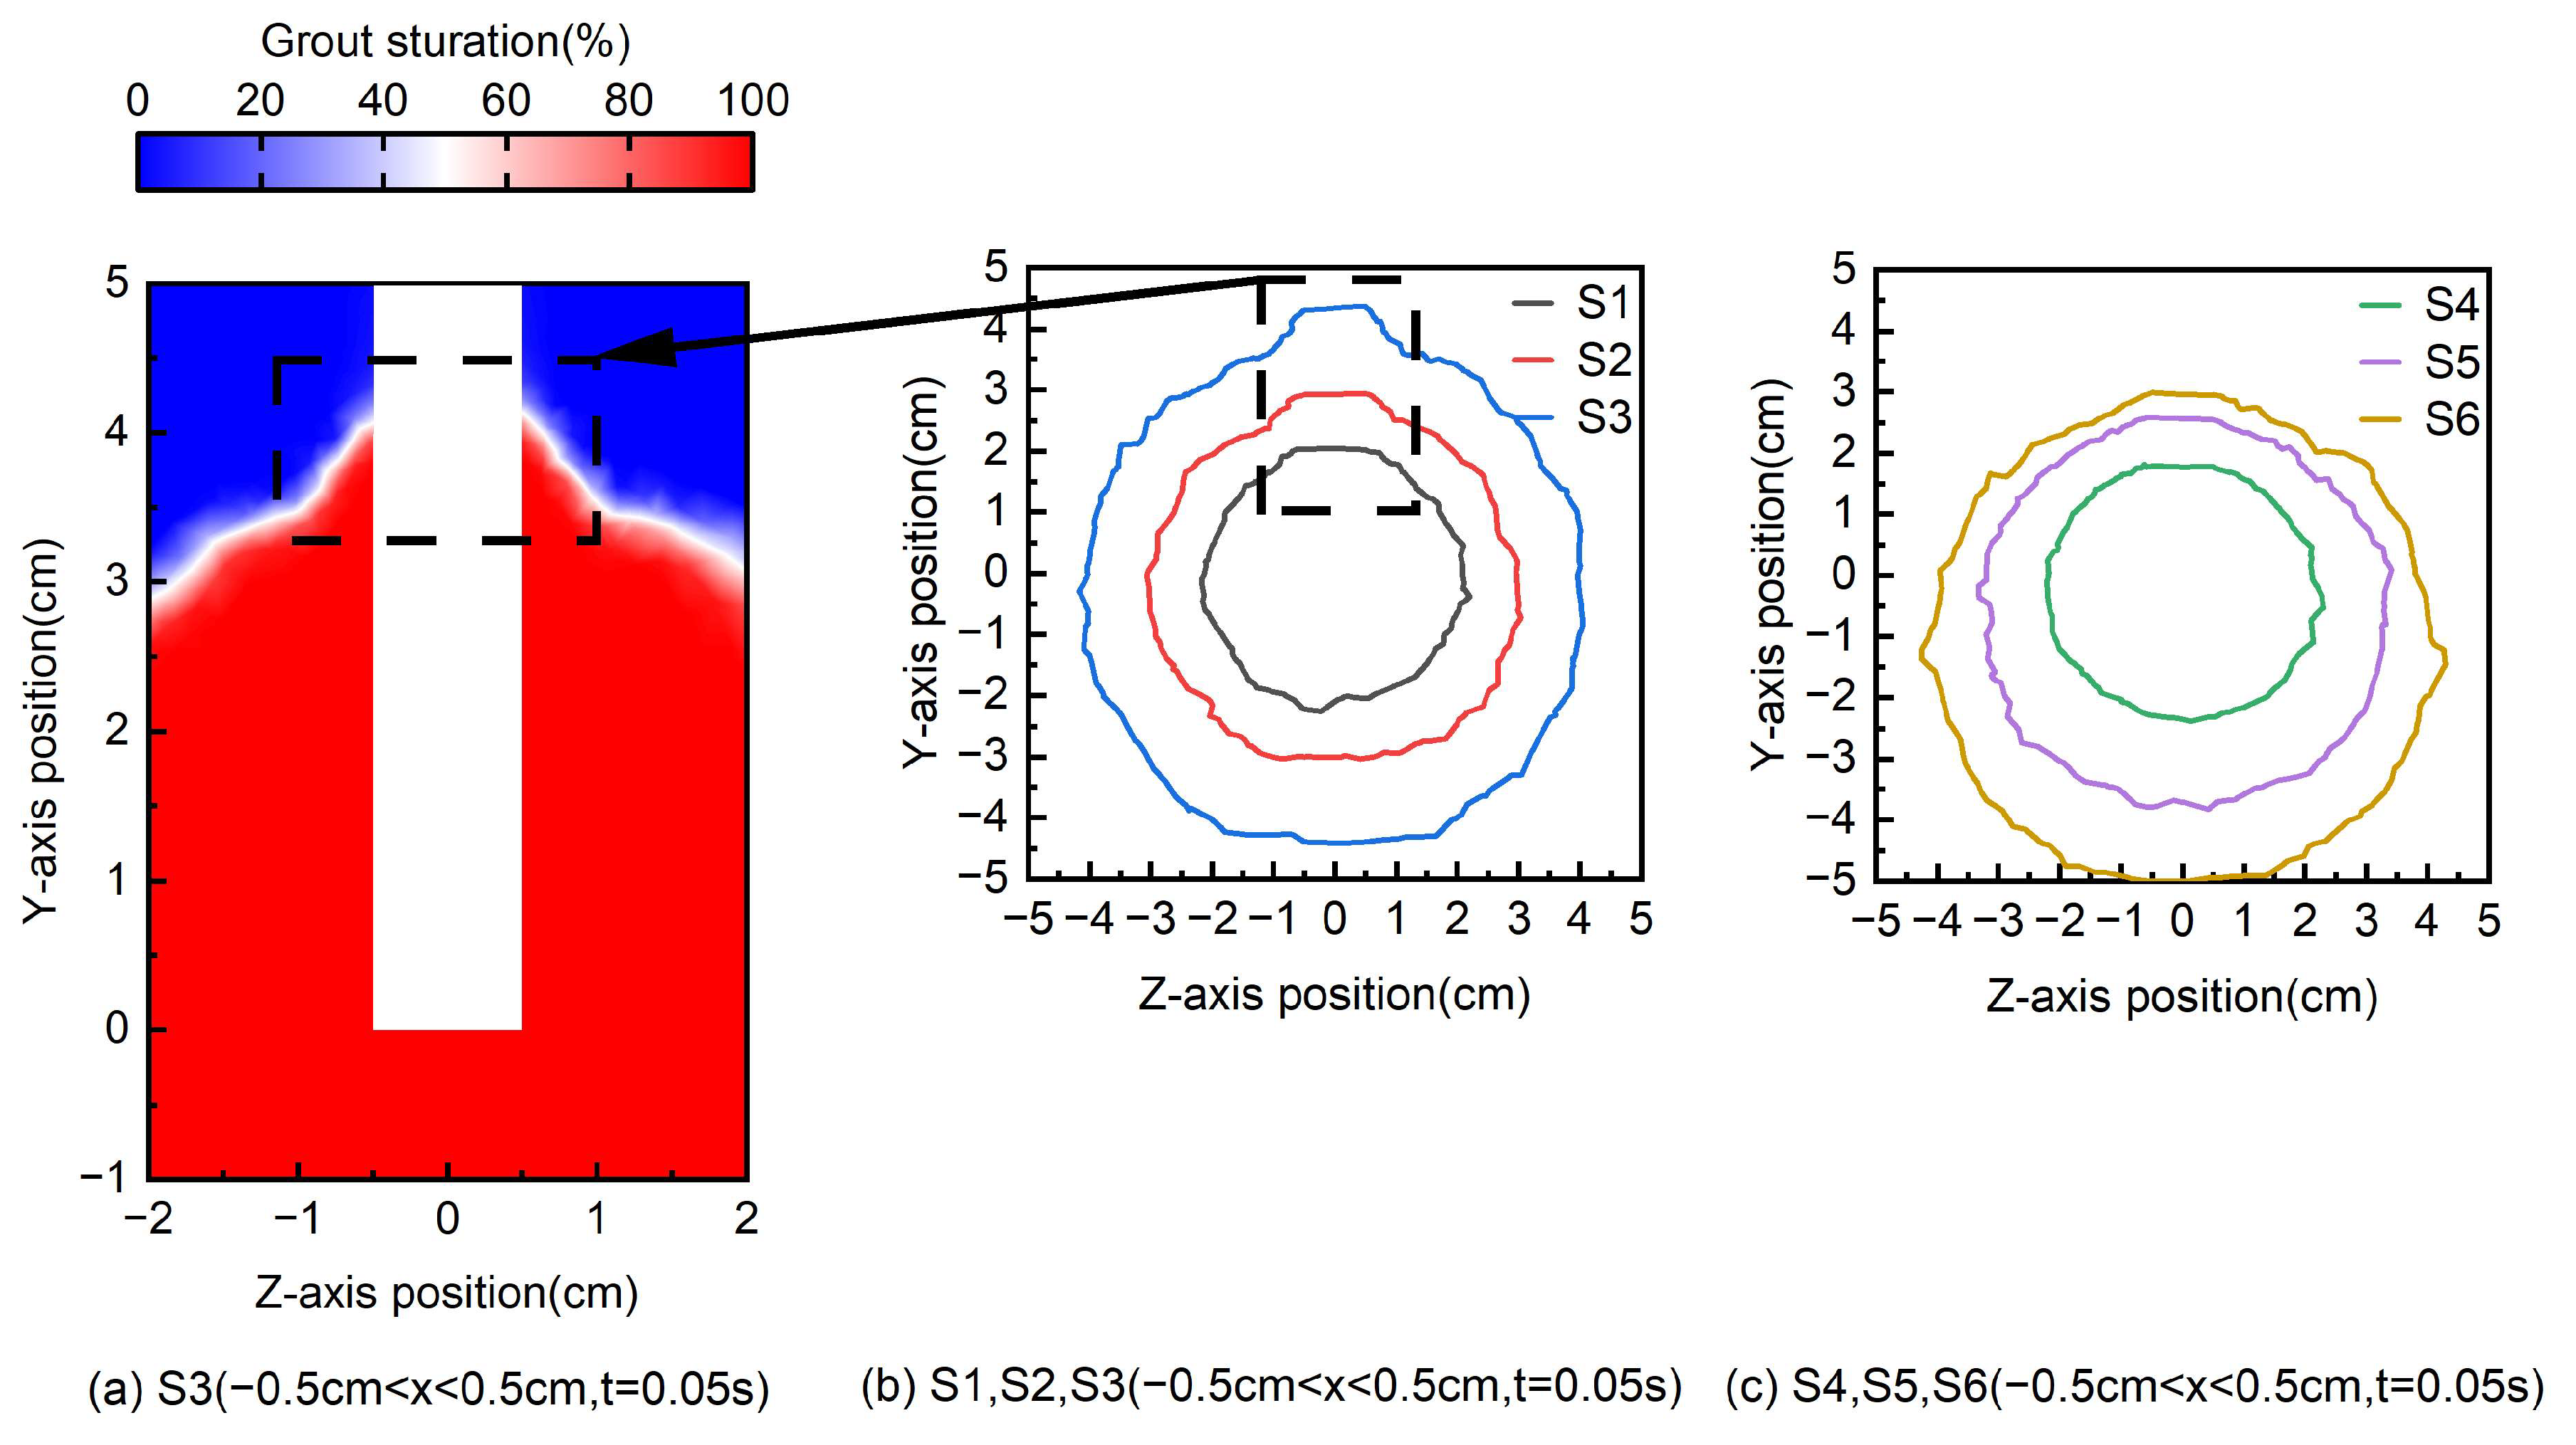
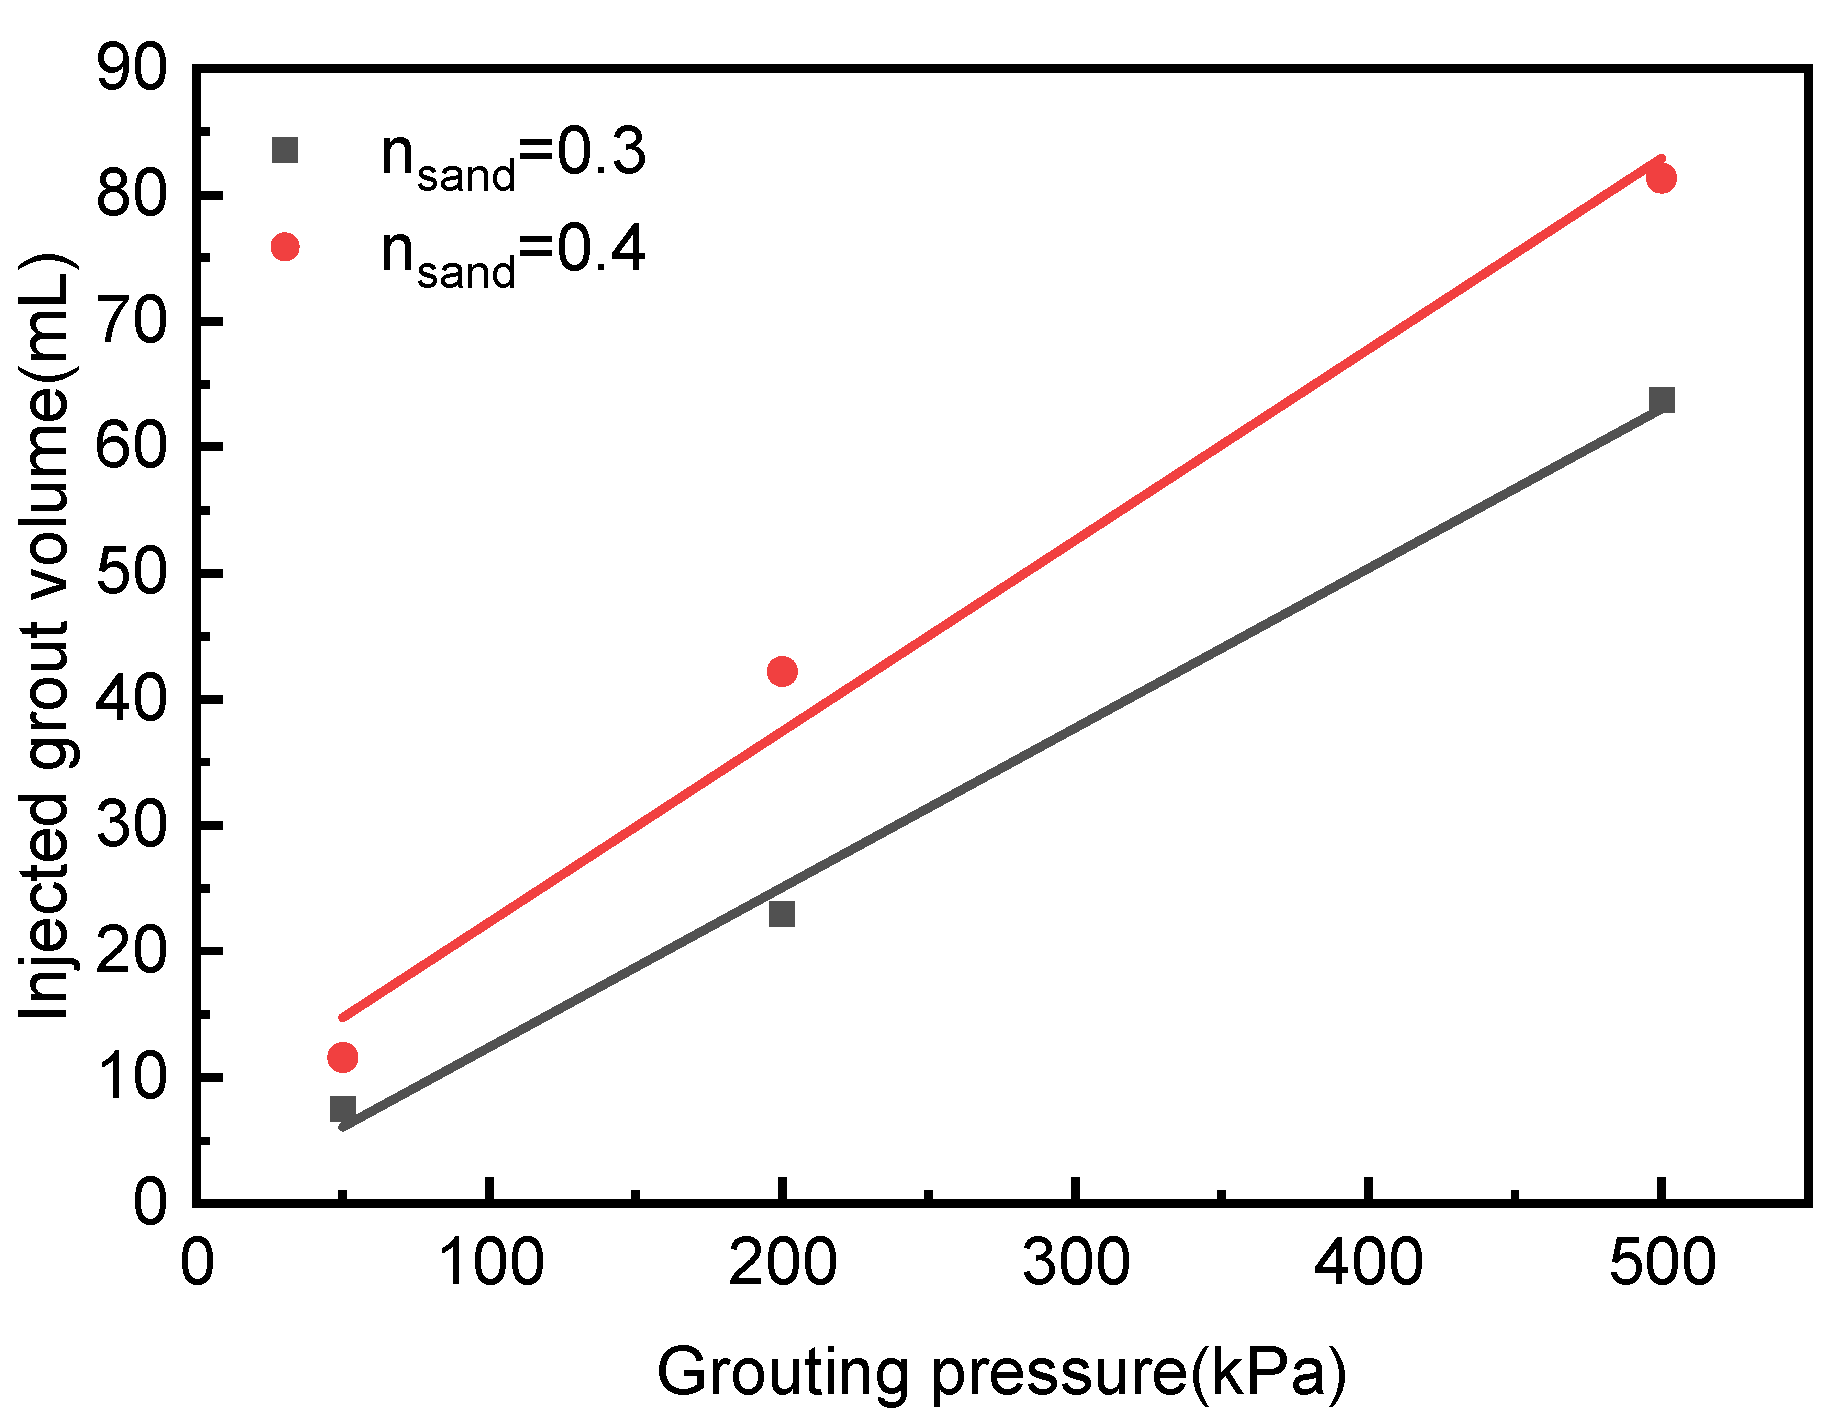
The slurry diffusion range and injected grout volume show that the larger the grouting pressure and the larger the sand layer porosity the more favorable the slurry diffusion. When the sand layer porosity was small, the slurry diffusion phenomenon along the dominant path of the grouting pipe wall boundary was obvious. When the sand layer porosity was larger, the permeation diffusion of the slurry was significantly affected by gravity.
(4)
In loose sand, when the grouting pressure was less than 200 kPa, no compaction occurred during the grouting process. In dense sand, when the grouting pressure was less than 500 kPa, no compaction occurred during the grouting process.

Author Contributions

Conceptualization, H.L. and X.J.; methodology, H.L.; software, H.L. and P.Z.; validation, H.L. and P.Z.; formal analysis, H.L. and X.J.; writing—original draft preparation, H.L.; writing—review and editing, X.J.; supervision, X.J.; project administration, X.J.; funding acquisition, X.J. All authors have read and agreed to the published version of the manuscript.

Funding

This research received no external funding.

Institutional Review Board Statement

Not applicable.

Informed Consent Statement

Not applicable.

Data Availability Statement

All data are shown in the manuscript.

Conflicts of Interest

The authors declare no conflict of interest.

References

  1. Long, Y.; Tan, Y. Soil arching due to leaking of tunnel buried in water-rich sand. Tunn. Undergr. Space Technol. 2020, 95, 103158. [Google Scholar] [CrossRef]
  2. Liang, Y.; Chen, X.; Yang, J.; Zhang, J.; Huang, L. Analysis of ground collapse caused by shield tunnelling and the evaluation of the reinforcement effect on a sand stratum. Eng. Fail. Anal. 2020, 115, 104616. [Google Scholar] [CrossRef]
  3. Saleh, S.; Yunus, N.Z.M.; Ahmad, K.; Ali, N. Improving the strength of weak soil using polyurethane grouts: A review. Constr. Build. Mater. 2019, 202, 738–752. [Google Scholar] [CrossRef]
  4. Li, S.; Liu, R.; Zhang, Q.; Zhang, X. Protection against water or mud inrush in tunnels by grouting: A review. J. Rock Mech. Geotech. Eng. 2016, 8, 753–766. [Google Scholar] [CrossRef]
  5. Li, F.; Wang, C.; Xia, Y.; Hao, Y.; Zhao, P.; Shi, M. Strength and Solidification Mechanism of Silt Solidified by Polyurethane. Adv. Civ. Eng. 2020, 2020, 8824524. [Google Scholar] [CrossRef]
  6. Zhou, Z.; Du, X.; Wang, S. Strength for Modified Polyurethane with Modified Sand. Geotech. Geol. Eng. 2017, 36, 1897–1906. [Google Scholar] [CrossRef]
  7. Liu, J.; Yuen, K.; Chen, W.; Zhou, X.; Wang, W. Grouting for water and mud inrush control in weathered granite tunnel: A case study. Eng. Geol. 2020, 279, 105896. [Google Scholar] [CrossRef]
  8. Li, Z.; Zhang, L.; Chu, Y.; Zhang, Q. Research on Influence of Water-Cement Ratio on Reinforcement Effect for Permeation Grouting in Sand Layer. Adv. Mater. Sci. Eng. 2020, 2020, 5329627. [Google Scholar] [CrossRef]
  9. Wang, D.; Sui, W. Grout diffusion characteristics during chemical grouting in a deep water-bearing sand layer. Int. J. Min. Sci. Technol. 2012, 22, 589–593. [Google Scholar] [CrossRef]
  10. Wang, Q.; Wang, S.; Sloan, S.W.; Sheng, D.; Pakzad, R. Experimental investigation of pressure grouting in sand. Soils Found. 2016, 56, 161–173. [Google Scholar] [CrossRef]
  11. Ren, B.; Mu, W.; Jiang, B.; Yu, G.; Li, L.; Wei, T.; Han, Y.; Xiao, D. Grouting Mechanism in Water-Bearing Fractured Rock Based on Two-Phase Flow. Geofluids 2021, 2021, 5585288. [Google Scholar] [CrossRef]
  12. Cui, W.; Tang, Q.; Song, H. Washout resistance evaluation of fast-setting cement-based grouts considering time-varying viscosity using CFD simulation. Constr. Build. Mater. 2020, 242, 117959. [Google Scholar] [CrossRef]
  13. Li, S.; Pan, D.; Xu, Z.; Lin, P.; Zhang, Y. Numerical simulation of dynamic water grouting using quick-setting slurry in rock fracture: The Sequential Diffusion and Solidification (SDS) method. Comput. Geotech. 2020, 122, 103497. [Google Scholar] [CrossRef]
  14. Liu, X.; Wang, F.; Huang, J.; Wang, S.; Zhang, Z.; Nawnit, K. Grout diffusion in silty fine sand stratum with high groundwater level for tunnel construction. Tunn. Undergr. Space Technol. 2019, 93, 103051. [Google Scholar] [CrossRef]
  15. Boschi, K.; di Prisco, C.G.; Ciantia, M.O. Micromechanical investigation of grouting in soils. Int. J. Solids Struct. 2020, 187, 121–132. [Google Scholar] [CrossRef]
  16. Yang, C.; Guo, J.; Lian, J.; Wang, Z. Study on Microscopic Roadbed Grouting Mechanism Based on CFD-DEM Coupling Algorithm. Math. Probl. Eng. 2020, 2020, 4948738. [Google Scholar] [CrossRef]
  17. Guo, W.; Zhang, M.; Sun, Y.; Li, Q.; Zhao, S.; Deng, S. Numerical simulation and field test of grouting in Nong’an pilot project of in-situ conversion of oil shale. J. Pet. Sci. Eng. 2020, 184, 106477. [Google Scholar] [CrossRef]
  18. Cundall, P.; Strack, O. Discussion: A discrete numerical model for granular assemblies. Geotechnique 1979, 30, 331–336. [Google Scholar] [CrossRef]
  19. Hertz, H. On the contact of elastic solids. J. Reine. Angew. Math 1881, 92, 156–171. [Google Scholar]
  20. Mindlin, R.; Deresiewicz, H. Elastic Spheres in Contact under Varying Oblique Forces. J. Appl. Mech. 1953, 20, 327–344. [Google Scholar] [CrossRef]
  21. Mindlin, R. Compliance of Elastic Bodies in Contact. J. Appl. Mech. 1949, 16, 259–268. [Google Scholar] [CrossRef]
  22. Tsuji, Y.; Tanaka, T.; Ishida, T. Lagrangian numerical simulation of plug flow of cohesionless particles in a horizontal pipe. Powder Technol. 1992, 71, 239–250. [Google Scholar] [CrossRef]
  23. Cundall, P.A. A computer model for simulating progressive, large-scale movement in blocky rock system. In Proceedings of the International Symposium on Rock Mechanics, Nancy, France, 4–6 October 1971. [Google Scholar]
  24. Sakaguchi, H.; Ozaki, E.; Igarashi, T. Plugging of the flow of granular materials during the discharge from a silo. Int. J. Mod. Phys. B 1993, 7, 1949–1963. [Google Scholar] [CrossRef]
  25. Anderson, T.; Jackson, R. A Fluid Mechanical Description of Fluidized Beds. Ind. Eng. Chem. Fundam. 1967, 6, 527–539. [Google Scholar] [CrossRef]
  26. Ibrahim, A.; Meguid, M.A. Coupled Flow Modelling in Geotechnical and Ground Engineering: An Overview. Int. J. Geosynth. Ground Eng. 2020, 6, 39. [Google Scholar] [CrossRef]
  27. Di Felice, R. The voidage function for fluid-particle interaction systems. Int. J. Multiph. Flow 1994, 20, 153–159. [Google Scholar] [CrossRef]
  28. Wu, L.; Gong, M.; Wang, J. Development of a DEM–VOF Model for the Turbulent Free-Surface Flows with Particles and Its Application to Stirred Mixing System. Ind. Eng. Chem. Res. 2018, 57, 1714–1725. [Google Scholar] [CrossRef]
  29. Zhou, L.; Gao, J.; Hu, C.; Li, Q. Numerical simulation and testing verification of the interaction between track and sandy ground based on discrete element method. J. Terramechanics 2021, 95, 73–88. [Google Scholar] [CrossRef]
  30. Ghazavi, M.; Hosseini, M. A Comparison between Angle of Repose and Friction Angle of Sand. In Proceedings of the 12th International Conference of International Association for Computer Methods and Advances in Geomechanics (IACMAG), Goa, India, 1–6 October 2008; Volume 2. [Google Scholar]
  31. Grabowski, A.; Nitka, M.; Tejchman, J. Micro-modelling of shear localization during quasi-static confined granular flow in silos using DEM. Comput. Geotech. 2021, 134, 104108. [Google Scholar] [CrossRef]
  32. Zhang, D.; Gao, C.; Yin, Z. CFD-DEM modeling of seepage erosion around shield tunnels. Tunn. Undergr. Space Technol. 2019, 83, 60–72. [Google Scholar] [CrossRef]
  33. Zeng, H.; Xu, W.; Zang, M.; Yang, P.; Guo, X. Calibration and validation of DEM-FEM model parameters using upscaled particles based on physical experiments and simulations. Adv. Powder Technol. 2020, 31, 3947–3959. [Google Scholar] [CrossRef]
Figure 1. Discrete element contact model.
Processes 10 01447 g001
Figure 2. Coupled simulation flow chart.
Processes 10 01447 g002
Figure 3. Particle size distribution (adapted from Zhou L et al. [29]).
Processes 10 01447 g003
Figure 4. Repose angle model test [29] and simulation test.
Processes 10 01447 g004
Figure 5. Model after particle filling and its boundary conditions.
Processes 10 01447 g005
Figure 6. Sand porosity contour.
Processes 10 01447 g006
Figure 7. Grout diffusion patterns.
Processes 10 01447 g007
Figure 8. Contact forces and velocity field.
Processes 10 01447 g008
Figure 9. Local porosity variation.
Processes 10 01447 g009
Figure 10. Slurry diffusion boundary (t = 0.05 s).
Processes 10 01447 g010
Figure 11. Compaction zone boundary (t = 0.05 s).
Processes 10 01447 g011
Figure 12. Schematic diagram of slurry flow.
Processes 10 01447 g012
Figure 13. The volume of the grout bulb.
Processes 10 01447 g013
Table 1. Contact parameters for sandy soil with a repose angle of 30.43°.
Contact ModelHertz–Mindlin (No Slip)
Particle diameter (mm) 2.86
Density (kg/m3) 2600
Poisson’s ratio 0.3
Shear modulus (MPa) 10
Coefficient of restitution 0.5
Coefficient of static friction0.5
Coefficient of rolling friction 0.3
Table 2. Slurry and water parameters in FLUENT.
Fluidρ (kg/m³)μ (Pa·s)
Cement slurry15100.0123
Water10000.001
Table 3. Numerical simulation scheme.
Schemensand (-)Pinj (kPa)
10.350
20.3200
30.3500
40.450
50.4200
60.4500
Table 4. Results of the compaction ratio.
Schemel [mm]lc [mm]CR [%]
122.600
23000
344.13.27.25
423.800
537.13.38.89
650.012.925.8
Publisher’s Note: MDPI stays neutral with regard to jurisdictional claims in published maps and institutional affiliations.

