1. Introduction
Proton-exchange membrane fuel cells (PEMFCs) directly convert hydrogen and oxygen (or air) flow streams into electric energy without going through a thermodynamic direct cycle. The anode is fed with hydrogen and the cathode with oxygen, and as a part of the exothermic reaction water and heat are generated. Although oxidation is present in the process, there are no combustion mechanisms generating pollutants [
1] or greenhouse gases. For this reason, fuel cells have become attractive for numerous researchers, companies and governments in the last few years, being considered a promising alternative for power generation both in stationary and portable applications in order to achieve 2030’s climate objectives [
2,
3,
4]. Nevertheless, the main technological barriers appearing in the development of these technologies are costs and durability, both delaying the full implementation of PEMFC nowadays.
PEMFCs are characterized by a polymeric membrane and successive thin porous layers. The membrane is a very thin solid electrolyte permitting the transfer of protons but not the electric current. It is the active layer where the electrochemical reaction takes place on the catalyst layer (CL). The actual working temperature of the membrane lies in the range around 40–90 °C. These temperatures require a very effective CL (typically platinum or platinum alloys) on both sides of membrane for the ease of the reaction. Next to the CLs, gas diffusion layers (GDLs) are assembled to ensure a uniform distribution of the reactants flowing through the channels towards the membrane. All these components are sandwiched in between solid conductive plates with a controlled compression not compromising their adequate performance [
1]. GDLs normally are carbon-based and consequently have a high electronic conductivity. Their pore size has been designed to maximize the
and
diffusion. Because at the cathode side, the reaction
occurs, some water is mostly produced in this electrode. In addition, the temperature is frequently below 100 °C, and the pressure in the range 1–3 atm, which propitiates the progressive formation of water droplets, limiting the diffusion process and partially blocking the flow of
. Consequently, GDLs are designed with a high hydrophobicity in order to avoid flooding caused by liquid water [
1]. A general description of the GDL properties and compositions can be found in [
1,
5,
6,
7]. The thermal and electrical conductivity of GDLs is studied in [
8,
9,
10,
11,
12], whereas their porosity and permeability properties are discussed in [
11,
12,
13]. Regarding the microporous layer (MPL), a widespread opinion establishes that the addition of this thin layer may result in a detrimental effect on the PEMFC’s performance. However, various discrepancies are found in [
14], and the existence of an optimal thickness range exploiting the capabilities of the MPL is analyzed in [
15,
16,
17]. Some disagreements have been found in these works that do not contribute to clarify the issue. Furthermore, the benefits of using a MPL on the fuel cell performance not only depend on the thickness of the layer, but also on the side in which it is assembled. For instance, the work in [
8] assessed different possibilities regarding the optimum MPL location. Alternatively, all the aforementioned studies accounted for different MPL configurations, but none of them considered the absence of this layer. Therefore, a sensitivity analysis on the characteristics of some commercial GDLs will be performed in this study to analyze the influence of such layer on the PEMFC’s performance.
To that end, the use of computational fluid dynamics (CFD) modeling has become a crucial tool for the understanding of the fuel cell operation and the phenomena involved in it. The different mechanisms that might deteriorate the device can be identified and prevented before the assembly of a real PEMFC, avoiding unnecessary damages and their derived costs [
18,
19]. For instance, it is worth mentioning the recent work of Corda et al. [
20], which realistically analyzes the effect of the clamping pressure on the GDL’s properties, concluding that compression plays a negative role on the PEMFC’s performance, especially at high current densities.
In this work, the effect of different commercial GDLs is analyzed by means of CFD simulations. A discussion on several properties, such as electrical and thermal conductivity, is provided, together with their influence on water saturation and membrane hydration. Liquid cooling is also considered in the model, where the clear relationship with the local water saturation levels within the GDL is analyzed in detail, in particular the along-the-channel evolution of the under-rib with respect to under-channel locations within the GDL. The study of the influence of the MPL is also carried out, showing clear effects on the temperature profiles, oxygen concentration, and cell performance.
The paper is structured as follows. First, the description of the model, the numerical details, and the different properties of the studied GDLs will be introduced. Next, the results obtained from the simulations are shown and discussed. Some conclusions and future works will be drawn at the end of this work, remarking that higher electrical and thermal conductivity, porosity and permeability lead to a better PEMFC operation. Simultaneously, the presence of an MPL is found to lead to a worse performance, but its absence leads to serious hydration and degradation issues.
2. Materials and Methods
The built-in PEMFC model of the software ANSYS-FLUENT [
21,
22] was used for the performance of the numerical simulations of this work with the finite volume method (FVM). Therefore, the conservation equation for a given magnitude
can be enunciated as
where
A is the integration area,
V is the integration volume, and
is the source term involving
. In addition to the transport equations, two potential equations are solved for the solid phase (
solid) and the membrane phase (
membrane), respectively,
with
representing the electric conductivity,
representing the electric potential and
representing the volumetric transfer current. The Stefan–Maxwell equation governs the multi-species diffusion in the GDLs [
19], although the model presented in this work calculates species diffusivity from the multicomponent diffusion model in [
22], i.e.,
where
is the effective diffusivity of the gas species
,
s is the liquid saturation,
is the exponent of the pore blockage,
is the porosity of the porous medium, and
is the gas species mass diffusivity computed by the full multicomponent diffusion (see [
21]). The electrochemistry is modeled by means of the Butler–Volmer equations:
A saturation model approach was used for the liquid water formation and transport. The conservation equation for the liquid
s is given by
where the subscript
l stands for the liquid phase,
is the condensation rate,
K is the permeability,
is the viscosity and
is the capillary pressure computed as a function of
s according to the Leverett function [
23]. Alternatively, the water content
is computed following the empirical correlation of Springer et al. [
24]:
where
a is the water activity defined in [
22] as
.
Assuming steady-state conditions, the numerical solution of Equations (
2)–(
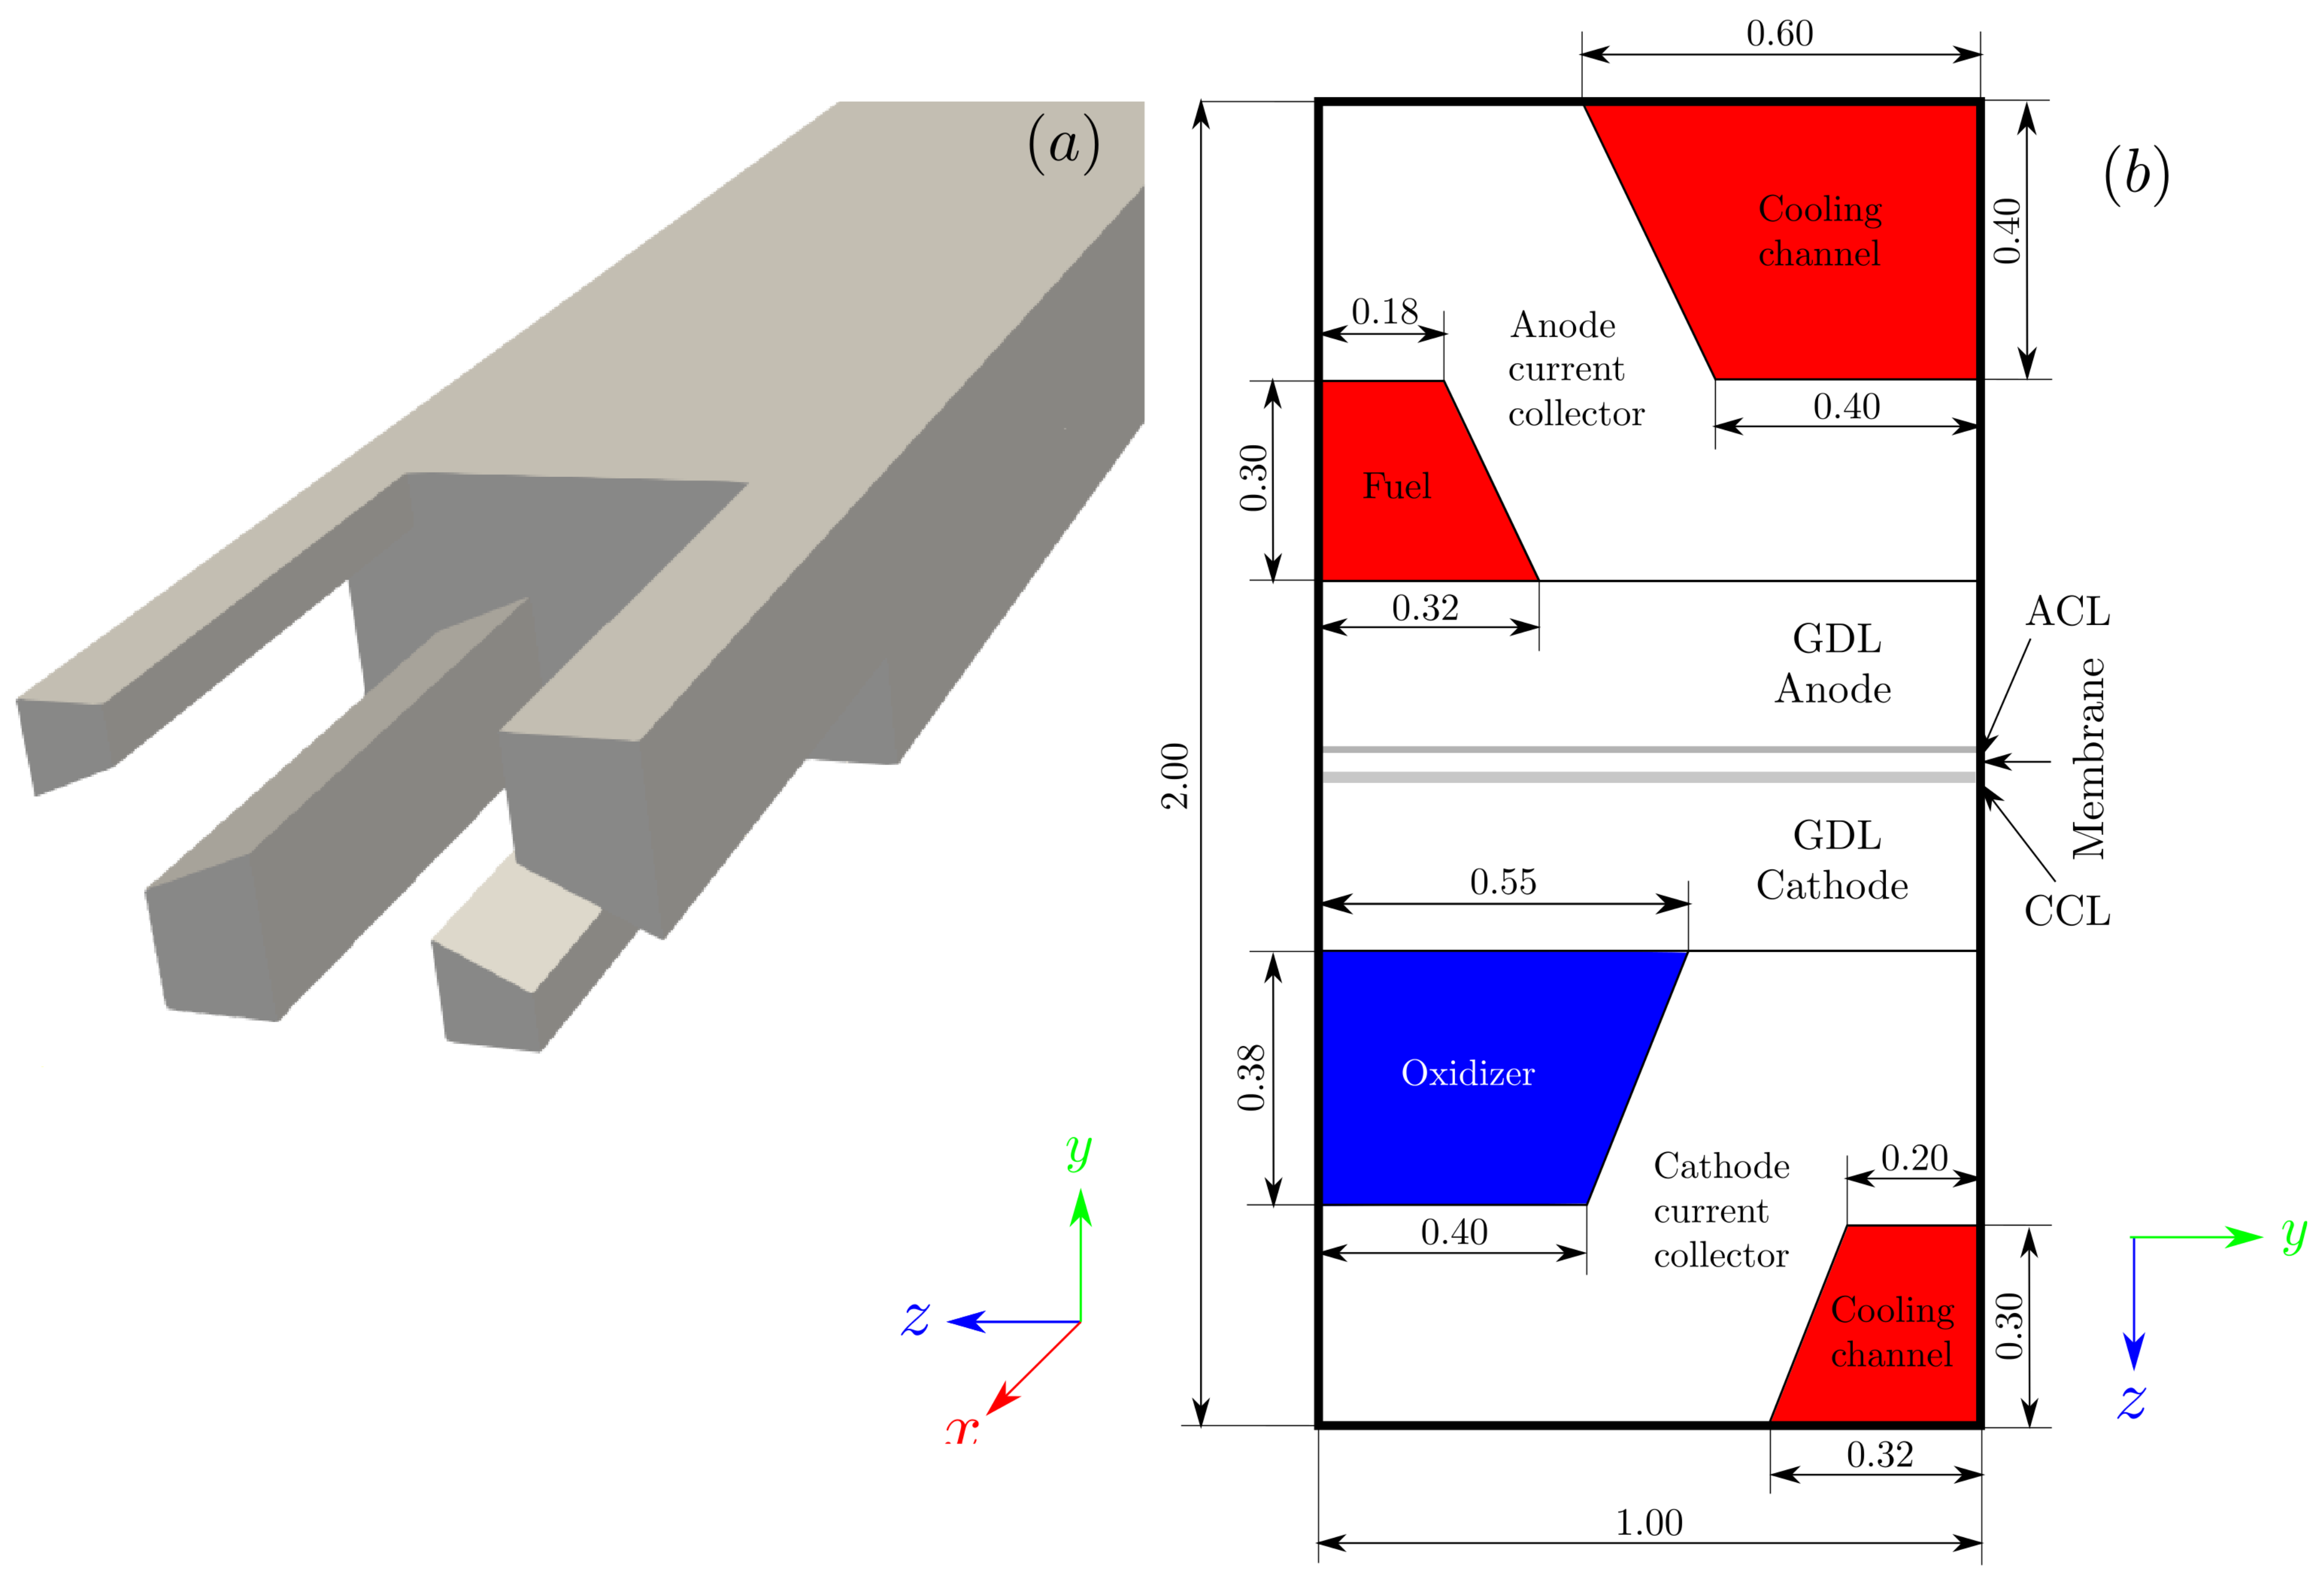
8) was obtained in the computational domain represented by the single straight-channel in
Figure 1, with the main metrics of the grid summarized in
Table 1. The geometry represents a single channel of a representative cell for automotive applications with corrugated bipolar plates and integrated water-cooled channels. Based on the work of Wilkinson and Vanderleeden [
25], corrugated plates are claimed to be advantageous because they reduce the overall plate thickness and lead to higher stack power densities. This particular design configuration is well suited to straight-channel continuous flow field patterns. For simplicity, one half of a repeating unit was modeled. On the other hand, the physical properties of the PEMFC components are shown in
Table 2 and
Table 3. Other than these, the values adopted are the same as those in [
19].
Several GDLs of 285 ± 30 μm thickness were assessed in the simulations. In particular, the commercial diffusion layers chosen for the study were the AvCarb P-75, SIGRACET 34BC, SIGRACET 34BA and the TORAY GP-H-090, with only the first two including an MPL. In order to conduct a systematic analysis on the effects of the MPL, all the computational domains were built with an MPL reserved room. If the microporous layer was actually considered for the simulation, the properties of the reserved space were introduced accordingly; otherwise, the properties of the adjacent GDL were extended to this region. Six different GDLs were studied in all, with their main properties described in
Table 3.
Table 2.
Physical and transport properties of the rest of the PEMFC components not appearing in
Table 3. Other than these, the value of the properties given in [
19] were adopted.
Table 2.
Physical and transport properties of the rest of the PEMFC components not appearing in
Table 3. Other than these, the value of the properties given in [
19] were adopted.
| Geometrical and Material Parameters | |
|---|
| Channel depth (mm) | 100.0 |
| Anode CL thickness (mm) | 0.005 |
| Cathode CL thickness (mm) | 0.005 |
| Thermal conductivity of CL (W/(m K)) | 10.0 |
| Porosity of CL | 0.2 |
| Gas permeability of CL (m2 × 10−13) | 2.0 |
| Contact angle of CL, (°) | 95 |
| Surface-to-volume ratio of CL (1/m × 105) | 2.0 |
| Membrane thickness (mm) | 0.030 |
| Equivalent weight of membrane (kg/kmol) | 1100 |
| Membrane density (kg/m3) | 1980 |
| Thermal conductivity of membrane (W/(m K)) | 2.00 |
| Thermal conductivity of bipolar plate (W/(m K)) | 100 |
Table 3.
Physical and transport properties of GDLs and MPLs.
Table 3.
Physical and transport properties of GDLs and MPLs.
| | AvCarb | | Sigracet | Toray |
|---|
| | P-75 | P-75 w/o MPL | SG34BC | SG34BC w/o MPL | SG34BA | TGP-H-090 |
|---|
| GDL porosity (%) | 85 | 85 | 75 | 75 | 83 | 78 |
| MPL porosity (%) | 40 | 85 | 40 | 75 | 83 | 78 |
| Contact angle of GDL, (°) | 107 [7] | 107 [7] | 104 [7] | 104 [7] | 104 [7] | 138 [7] |
| Contact angle of MPL, (°) | 126 [7] | 107 | 126 | 104 | 104 | 138 |
| Gas permeability of GDL (m2 × 10−12) | 5.70 | 5.70 | 8.71 | 8.71 | 8.71 | 4.53 [7] |
| Gas permeability of MPL (m2 × 10−12) | 0.097 | 5.70 | 0.076 | 8.71 | 8.71 | 4.53 |
| Density of GDL (kg/m3) | 2719 | 2719 | 444.44 | 444.44 | 307.14 | 440 |
| Electrical conductivity of GDL (S/m) | 1250 | 1250 | 286.36 | 286.36 | 254.55 | 1250 |
| Thermal conductivity of GDL (W/(m K)) | 1.7 | 1.7 | 0.467 [13] | 0.467 [13] | 0.533 [13] | 1.7 |
| Thickness (μm) | 275 | 275 | 315 | 315 | 280 | 280 |
| MPL | YES | NO | YES | NO | NO | NO |
| PTFE (%) | YES | YES | 15 | 15 | 5 | 5 |
The steady-state operating conditions are described in the following (see
Table 4); the species mass flow rate, temperature and relative humidity were fixed at the anode and cathode inlets. At the coolant inlet, mass flow rate and temperature were fixed. The cell voltage was prescribed for each operation point (potentiostatic conditions) so that the corresponding current density could be calculated numerically.
The polarization curve of each case was computed ranging from 1.05 to 0.35 V with a step width of 0.1 V. Subsequently, a detailed postprocessing was carried out to better understand the internal phenomena occurring in the GDLs and the overall impact on the fuel cell. The postprocessing tasks comprised the following stages:
Calculation of the volume-weighted average of the key variables (temperature, water content, liquid saturation and oxygen mass fraction) for each operation point for the GDLs, MPLs, CLs and membrane. This step was extended to all the cases in study;
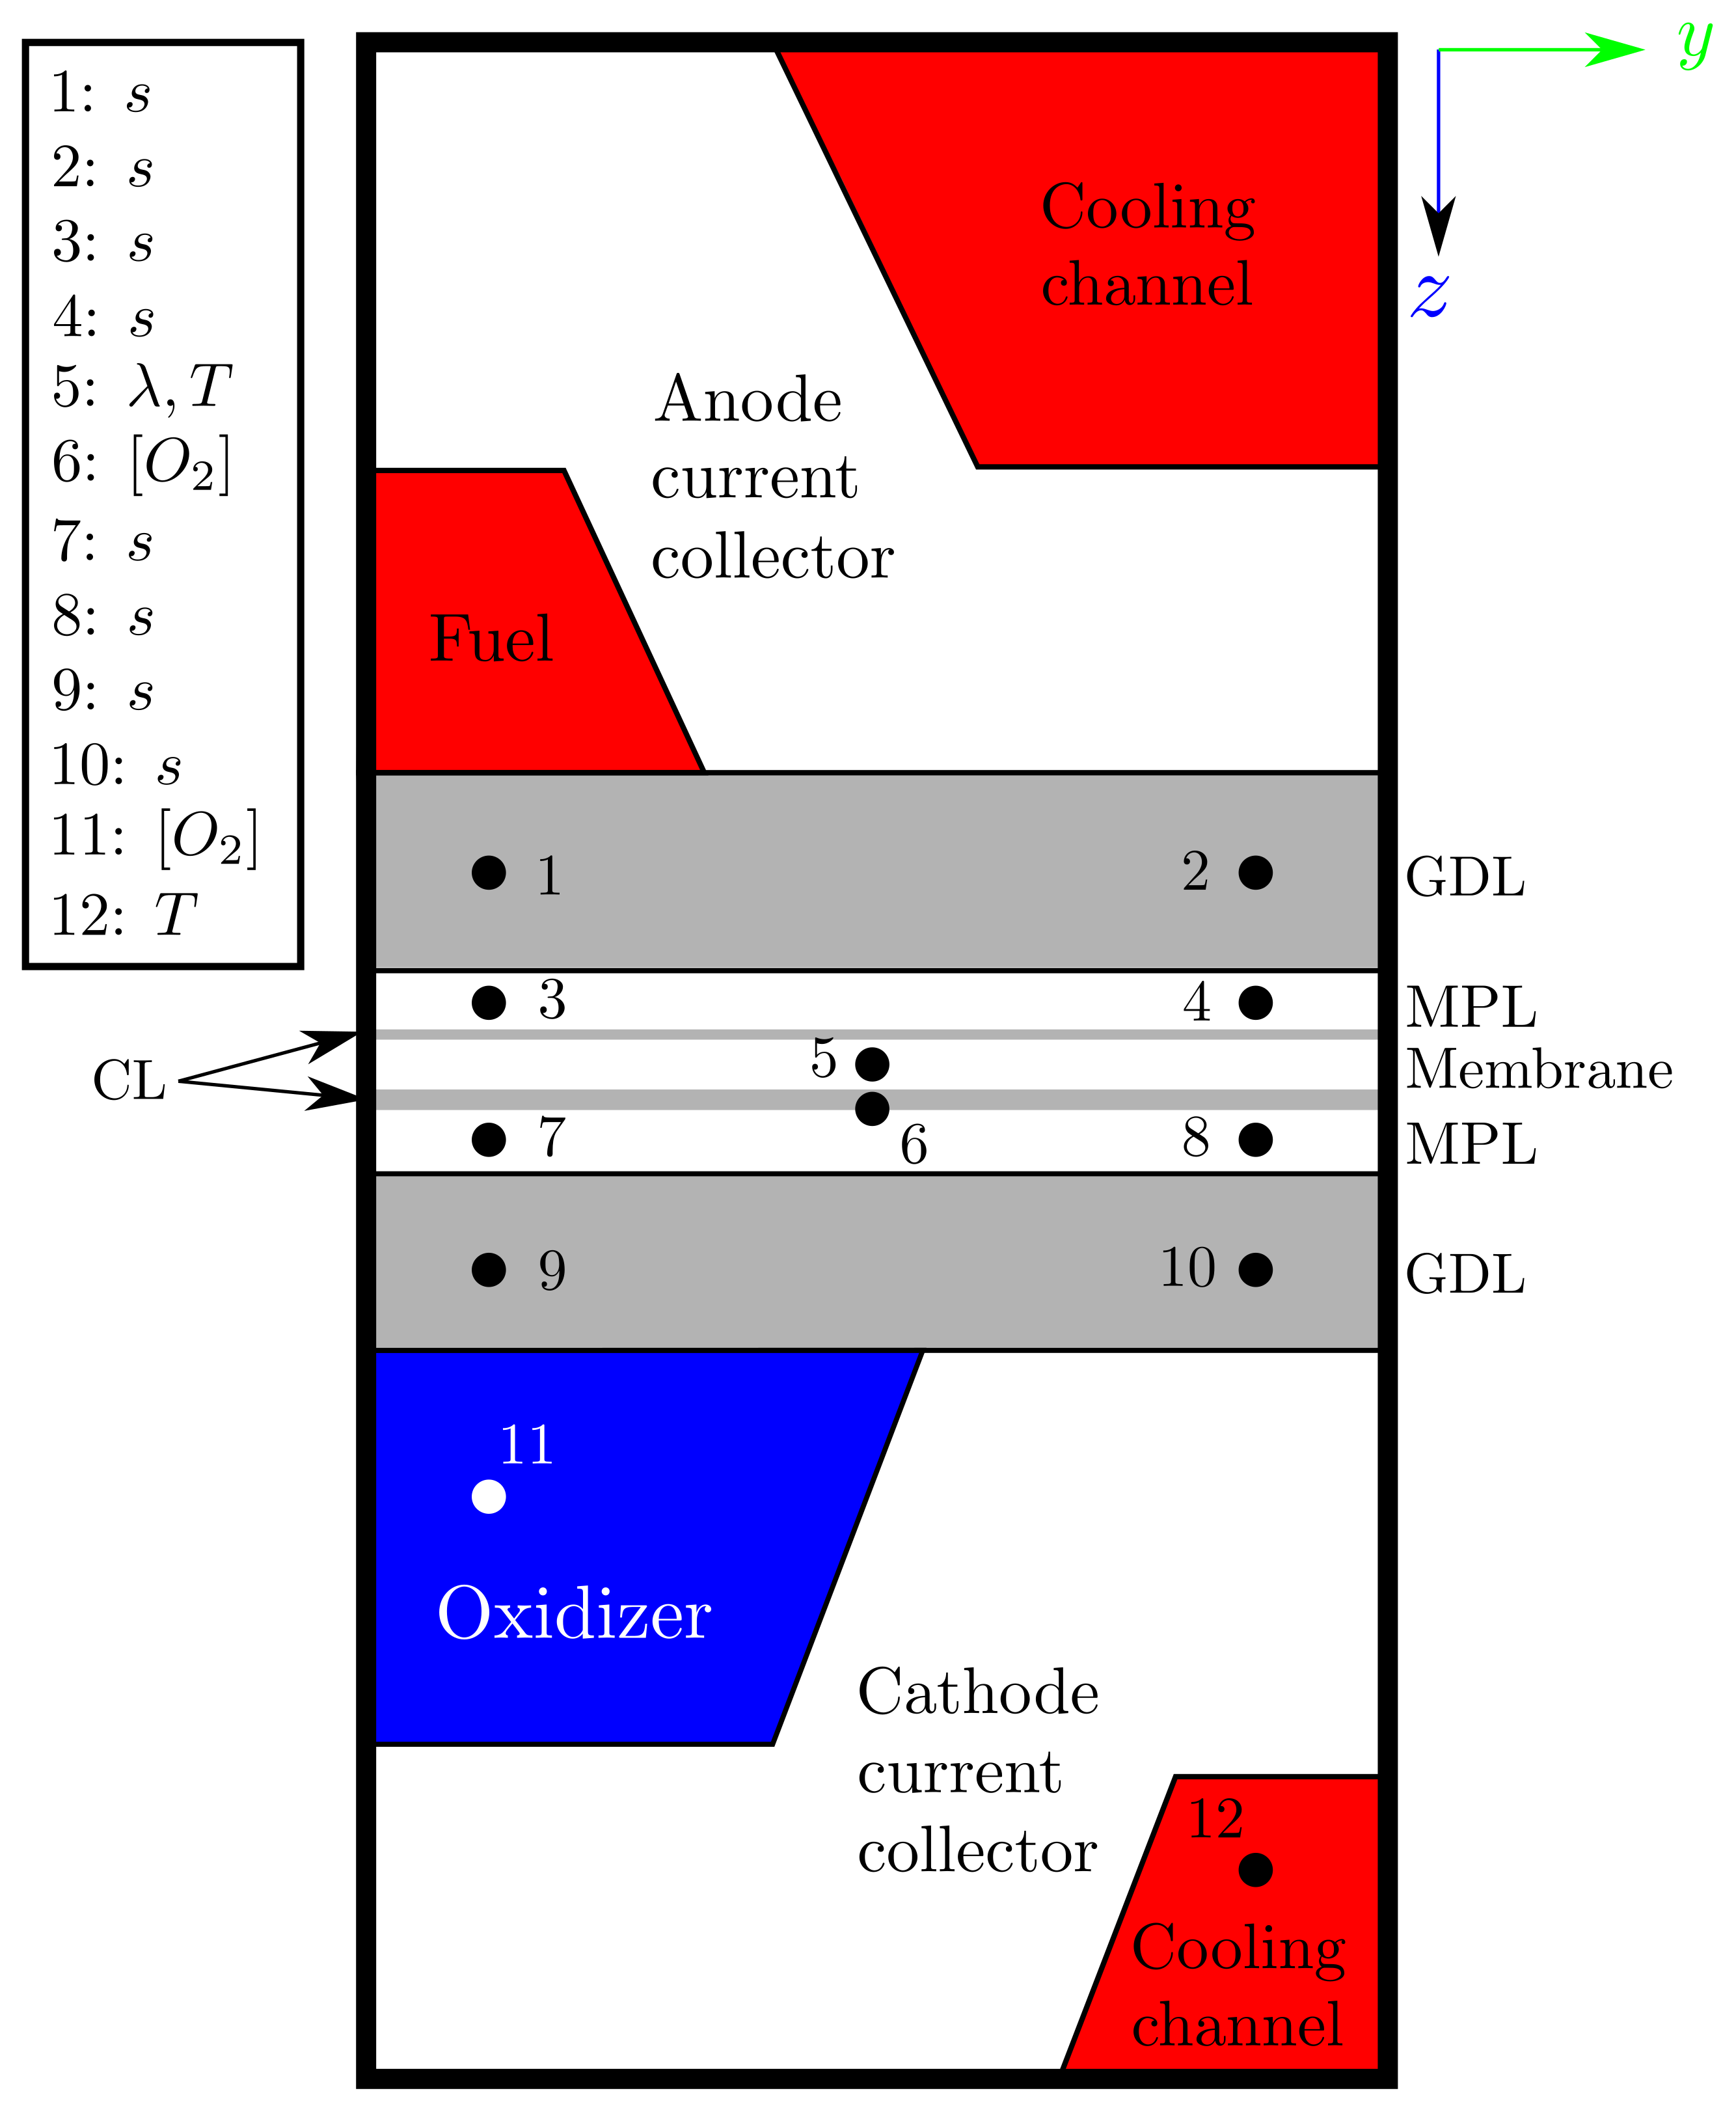
Study on the evolution of the aforementioned variables along the longitudinal axis of the fuel cell, specifically at the points highlighted in the cross-sectional plane of
Figure 2. The duplicity of the points in GDLs and MPLs is done to enable the study on under-rib and under-channel effects. This is only done for the cases with MPL at the low and medium voltages 0.45 and 0.65 V, respectively;
Representation of contour plots in the membrane mid-plane (in-plane), studying the distributions of temperature, water content and current flux density for the cases with MPL and their variations at 0.45 and 0.65 V.
It must be mentioned that no experimental data of a single straight-channel with cooling channels in a similar arrangement to that of
Figure 1 were identified, and therefore, a detailed model validation could not conducted. In order to overcome this drawback, best practice guidelines derived from the experience in previous CFD research works on PEMFC modeling and experimental validation [
18,
19,
26,
27] were used for the development of the CFD model.
3. Results
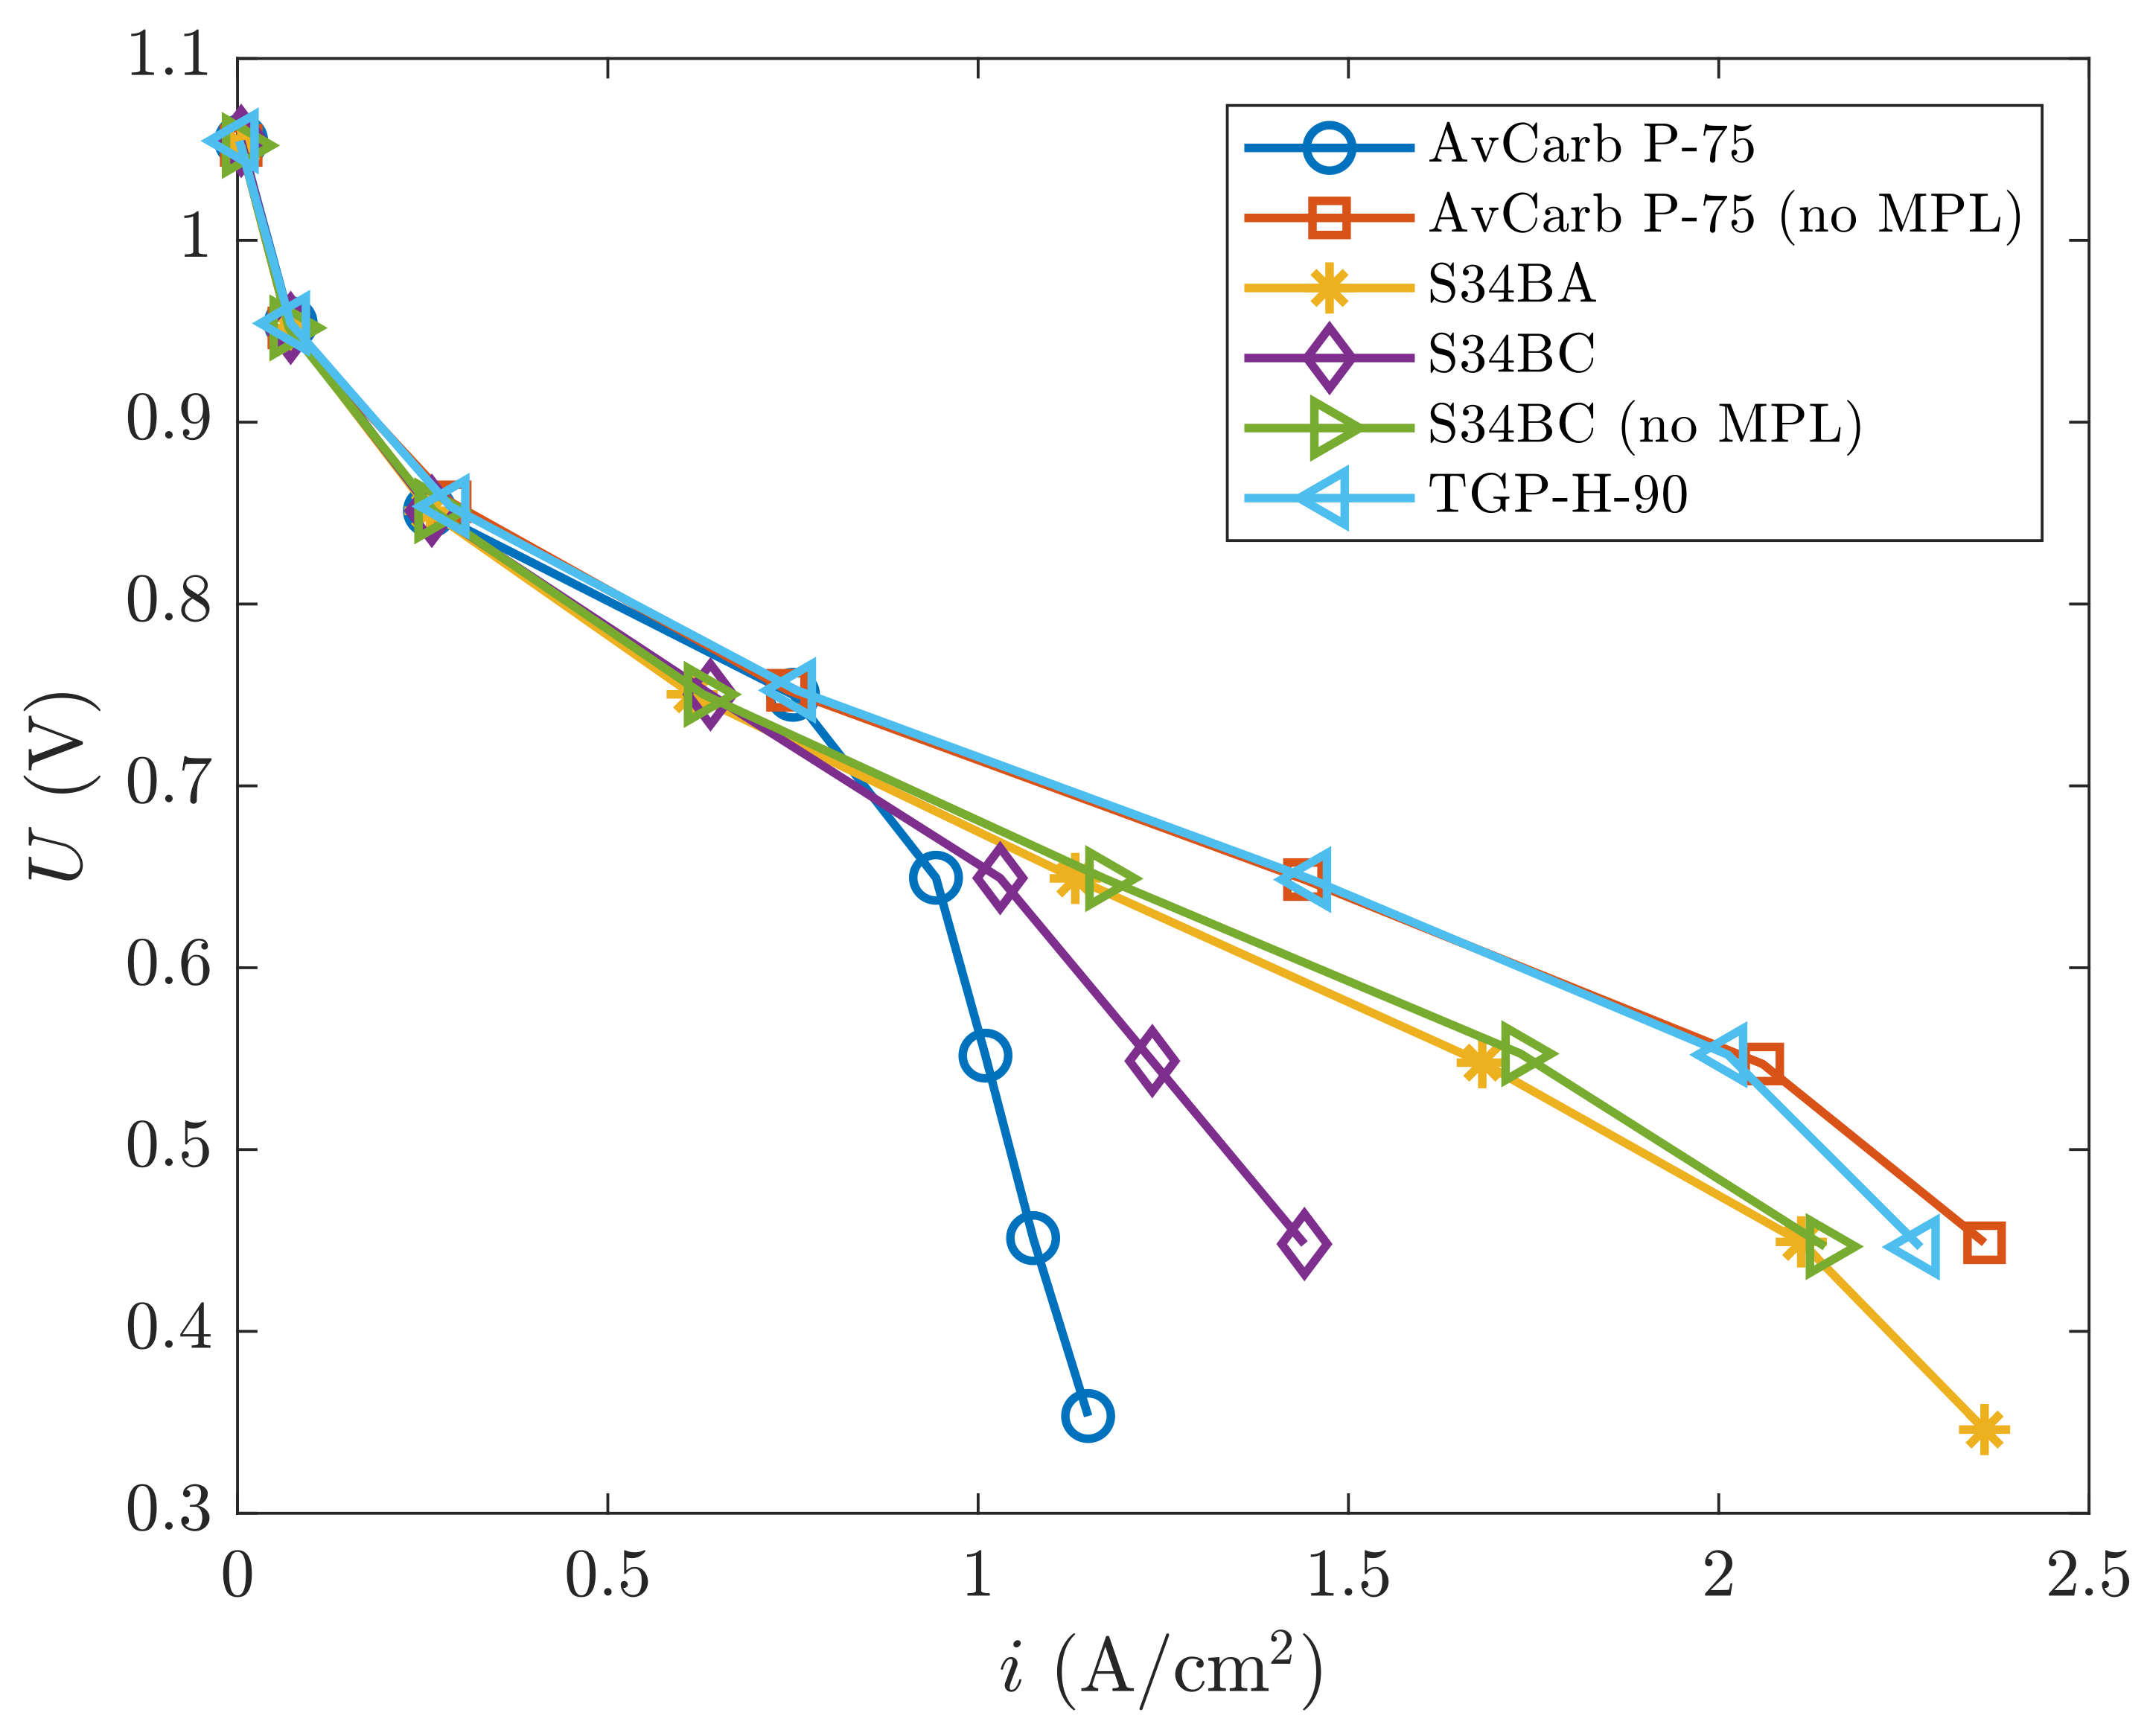
The results obtained from the CFD simulations are described and commented on in this section. In
Figure 3, the polarization curve
is constructed from the data resulting from the simulations. Most of the cases draw the typical shape of a polarization curve, starting with a steep decrease (activation region), followed by a smooth and linear decrease in the ohmic region, to finish with a suddenly decrease due to the mass losses. Notice that the more accused discrepancies between the different curves are found in the latter.
In terms of the PEMFC performance, three wel-differentiated behaviors can be inferred from
Figure 3. First, the case of the poorest performance (i.e., the case providing the smallest current density) corresponding to the AvCarb GDL+MPL assembly is observed. As mentioned in [
8,
15,
16,
17], the low
i magnitude can be explained by the fact that the MPL in the cell does not fit its ideal thickness. If of arbitrary size, it has been discussed in [
13] that the MPL deteriorates the electrical conductivity, consequently decreasing the PEMFC performance. Indeed, the largest difference on the current density at the very same voltage (0.45 V) is more than twice this with MPL when compared with its counterpart without MPL.
Secondly, regarding the SIGRACET diffusion layer, a similar trend to the previous one can be observed, meaning that the GDL+MPL assembly generates a smaller current density than that obtained solely with the GDL. Even though the differences in their electrical conductivity are just about 11.1%, a better performance can be seen in the SIGRACET 34BC case (which demonstrates the highest electrical conductivity, of course). On the other hand, the SIGRACET 34BA has a 12.4% higher thermal conductivity with respect to the SIGRACET 34BC, but it has been found to exhibit a worse overall performance due to the lower electrical conductivity of the latter, which seems to be dominant at this point. Basically, high electrical conductivity is of relevance because it is directly related to a superior proton conduction, which leads to a better performance [
9]. In addition, the comparison between both SIGRACET components reported in [
8,
10,
11] corroborates the results in [
12]: the higher the porosity is, the lower the electrical conductivity. Notwithstanding, high thermal conductivity is also necessary to achieve temperatures in the range appropriate for membrane hydration [
28]. Higher PTFE quantities lead to a higher contact angle [
11] and better porosity and permeability properties [
12]; however, the thermal conductivity will be reduced.
To conclude the analysis of
Figure 3, the GDLs without the MPL will be addressed, presenting higher electrical and thermal conductivity than those formerly discussed. Furthermore, these GDLs results are similar in both cases, with the main differences lying in their porosity and permeability properties, which are, respectively, 8 and 20% higher in AvCarb’s than in TORAY’s. Carcadea et al. stated in [
11] that the increase in the porosity leads to a significant improvement in the performance, as herein shown.
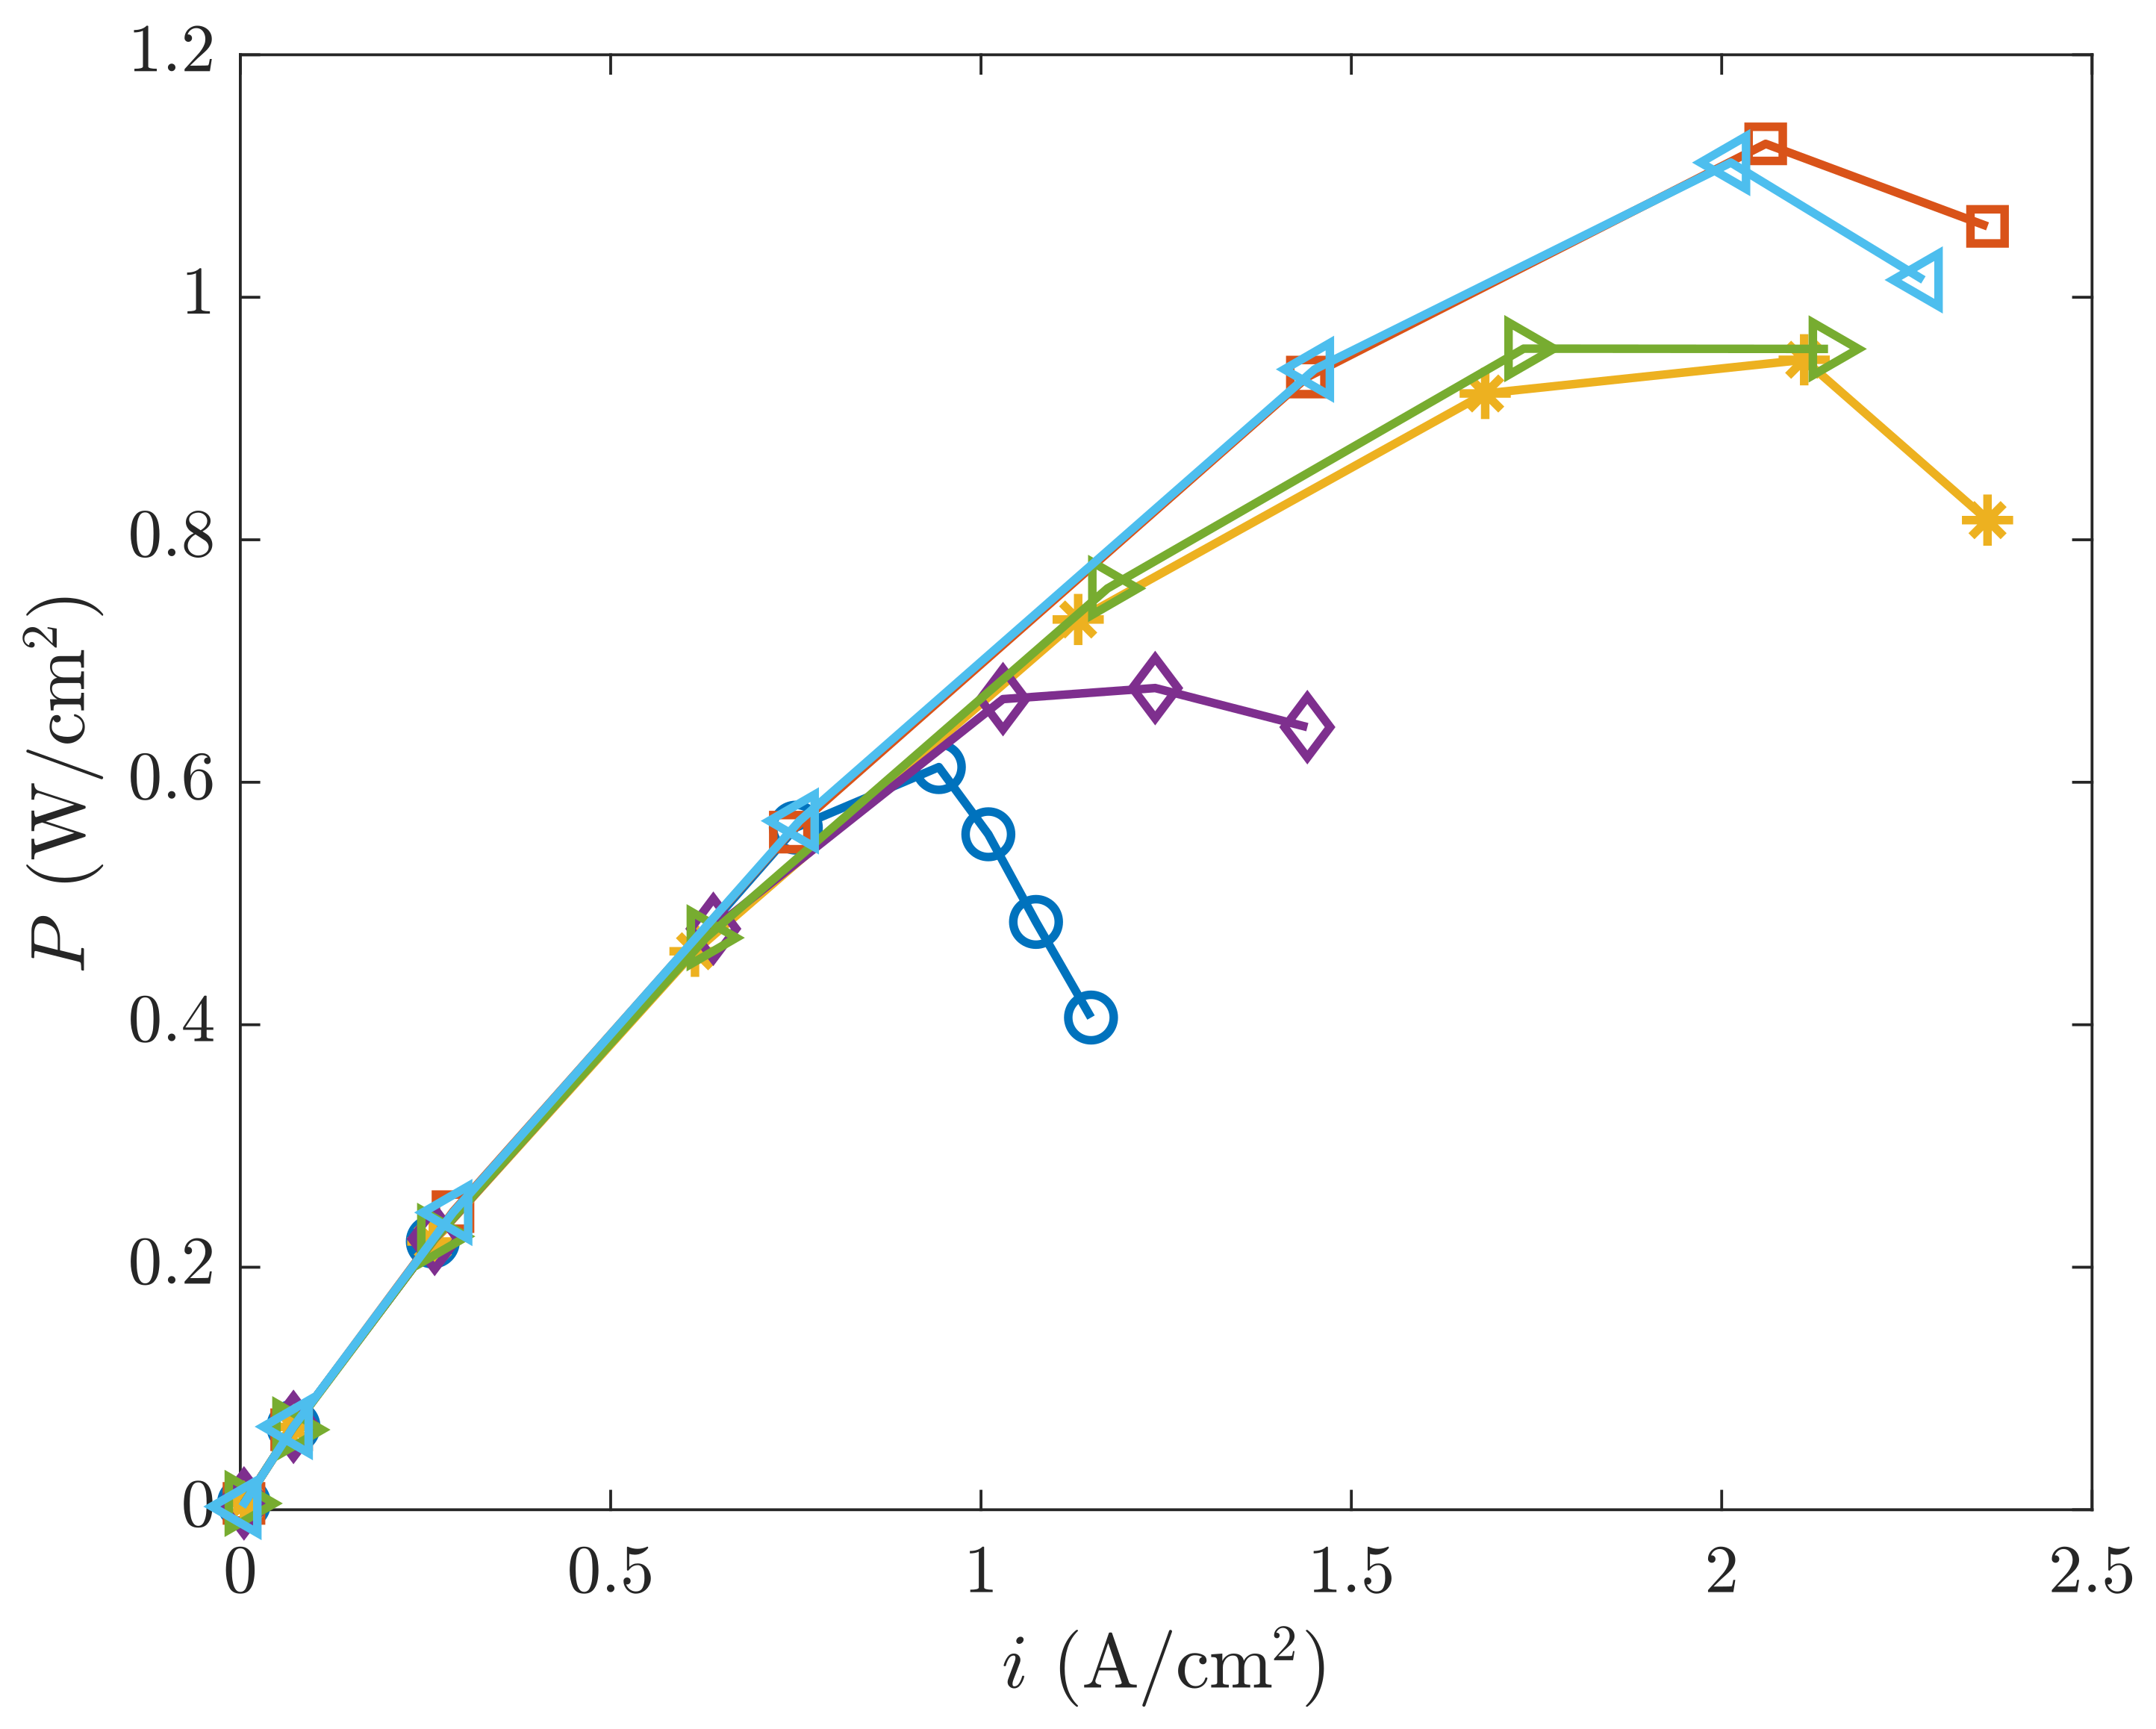
From the results in
Figure 3, the power vs. current density curve can be drawn in
Figure 4. Like in
Figure 3, the aforementioned three distinct regions are displayed now in
Figure 4 in terms of power. From the top to the bottom, one can first identify the cases without MPL, which are of highest thermal and electrical conductivity, then the cases without MPL, which are of lower thermal and electrical conductivity, and finally the cases without MPL, which are of high electrical and thermal conductivity. It can be seen that the GDL AvCarb P-75 without MPL generates the largest power quantity (about 1.1 W/cm
2) among all the layers in study. In contrast, the GDL with MPL engineered by the same manufacturer is the one providing the poorest performance (around 0.6 W/cm
2 at 0.73 A/cm
2). Their differences are roughly given by a factor of 2 (in the best of circumstances). On the other hand, one can note that the power curve in the cases without MPL increases with the current density up to a maximum of about 2 A/cm
2. From there on, the PEMFC performance starts to decrease. Regarding the differences in porosity and permeability of the GDLs, the impact on the power output is only a 2.5% decrease. However, the lower conductivity implies a more noticeable drop (20–15%) on the PEMFC power response.
3.1. Volume-Weighted Averages
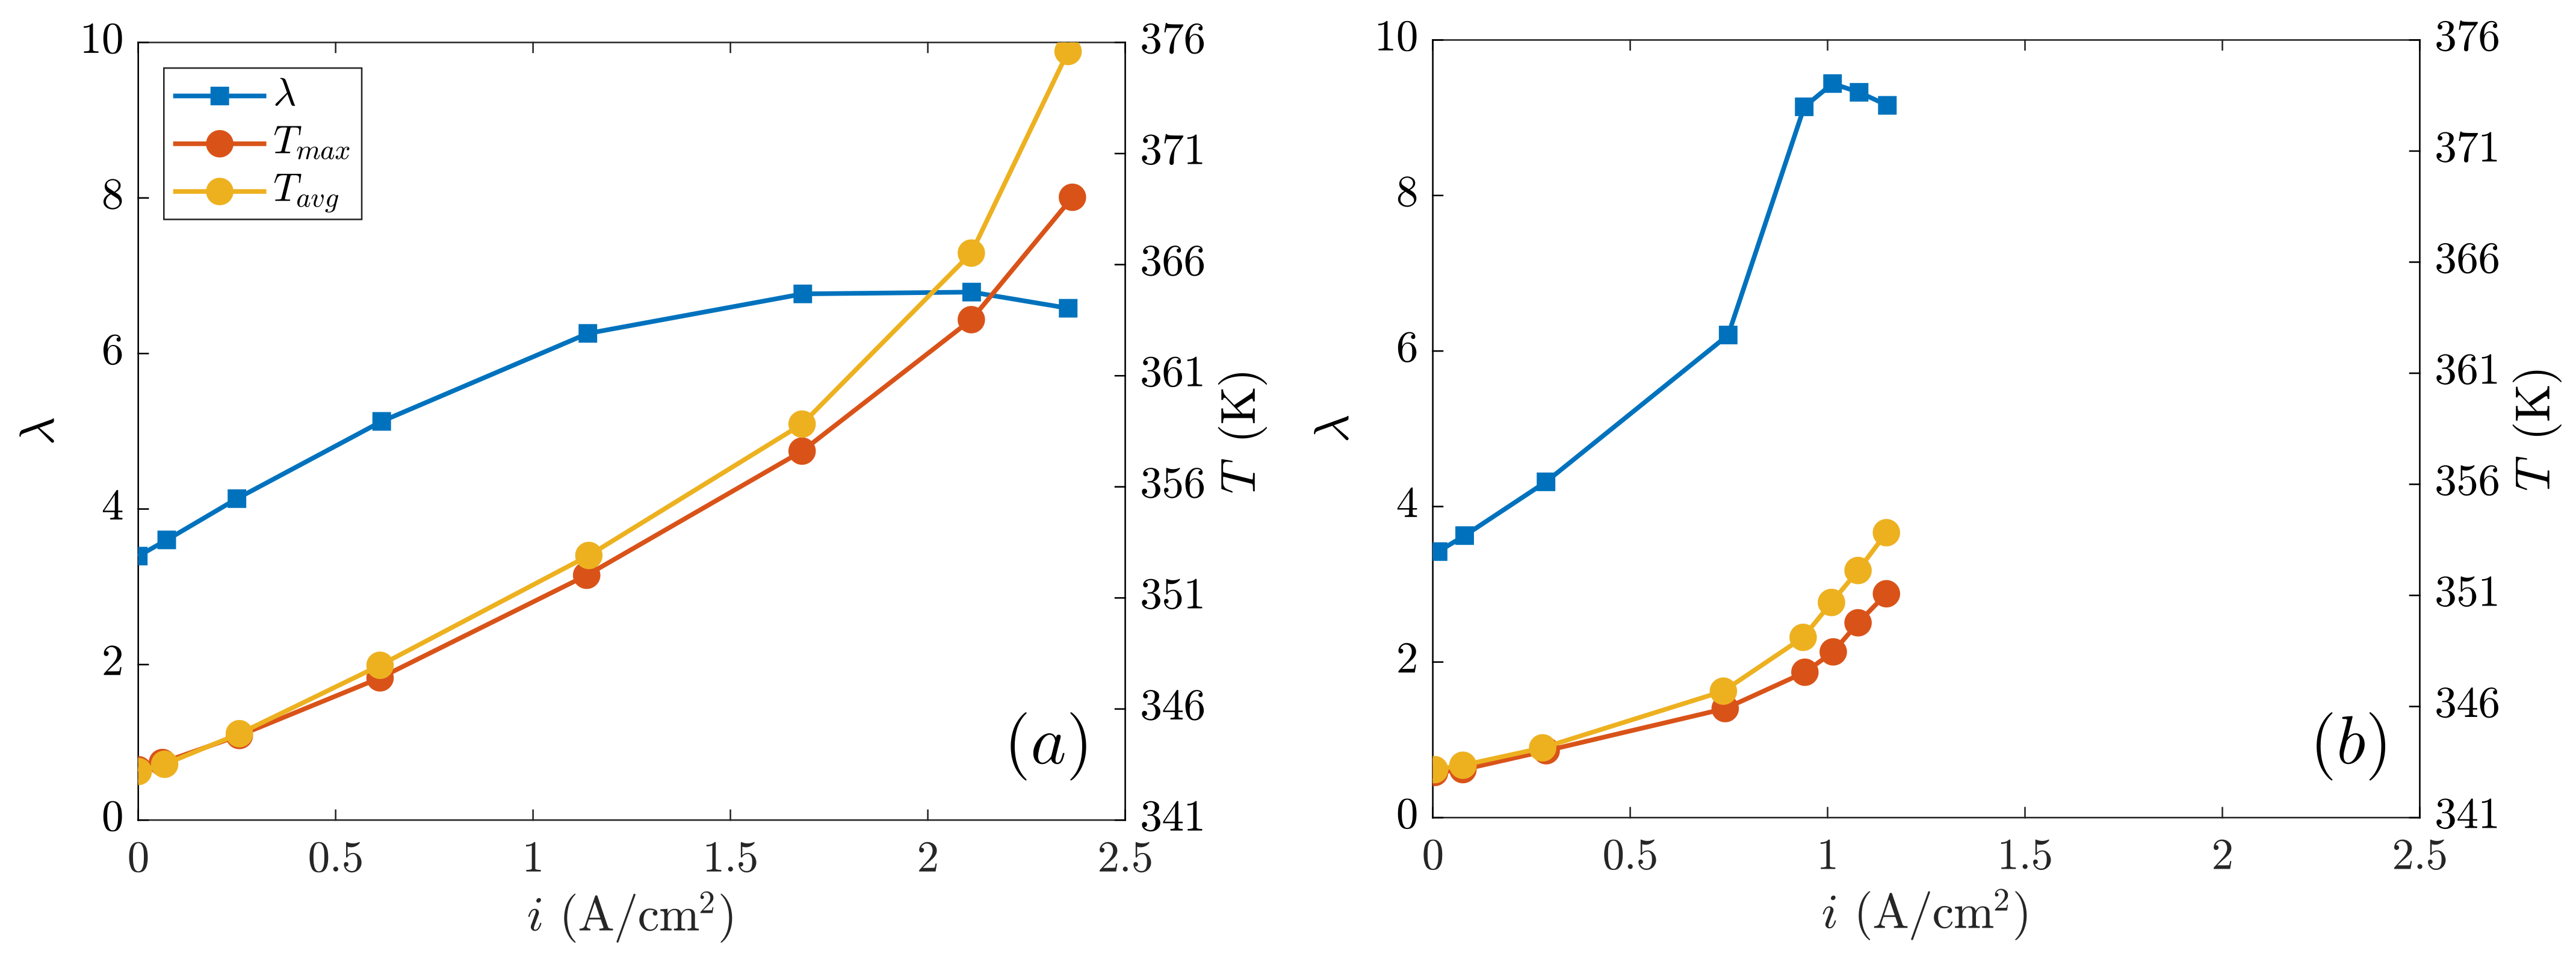
The averaged water content and the maximum and mean temperatures in the membrane are displayed against the current density in
Figure 5. The water content is plotted in the main axis and temperature in the secondary. For comparison’s sake, the main differences between the SIGRACET 34BA and AvCarb P-75 are assessed, with the first GDL presenting low thermal and electrical conductivity without MPL, and the second (with MPL) with 5 and 3.5 times higher electrical and thermal conductivity.
Because the cathode reaction is exothermic, temperatures will typically increase with the current density. If more oxygen is consumed, more heat will be released. In
Figure 5, the temperature growth looks linear from small to intermediate current densities, but from a given point (say
A/cm
2 in
Figure 5a and
A/cm
2 in
Figure 5b), such an increase becomes apparently exponential. Alternatively, the water content increases with the current density because a larger water quantity is generated in the cathode due to a higher oxygen consumption. Similar to temperature, the initial response of the water content presents a linear relation with the current density, but from a critical point (practically coinciding with that of the temperature sudden increase), evaporation effects must be dominant so that the water level starts to decay rapidly. The differences in the electrical and thermal conductivity are related to this process, as can be clearly observed in
Figure 5a,b. Due to a better proton conduction, the AvCarb GDL reaches lower temperatures than those in SIGRACET 34BA, which approximately results in a 30% higher water content of the first with respect to the latter. When the MPL is present, the PEMFC performance is enhanced because the water transport mechanisms and hydration are reinforced [
11]. It must be kept in mind that membrane hydration is a decisive mechanism to maximize the PEMFC operation, avoiding the degradation of their components [
9]. Rather, the high temperatures reached by the SIGRACET 34BA are driven by the lower conductivity and by a worse level of hydration, as the water content in membrane describes. These high temperatures are damaging for the lifespan of the cell components. Even though the average temperature is below 100 °C (say, a degradation threshold [
1]), this value is locally exceeded in about 2 K. In addition, the thermal gradient should not exceed a 5 K degradation threshold, which is surpassed by 1.5 K, leading to higher thermal stresses.
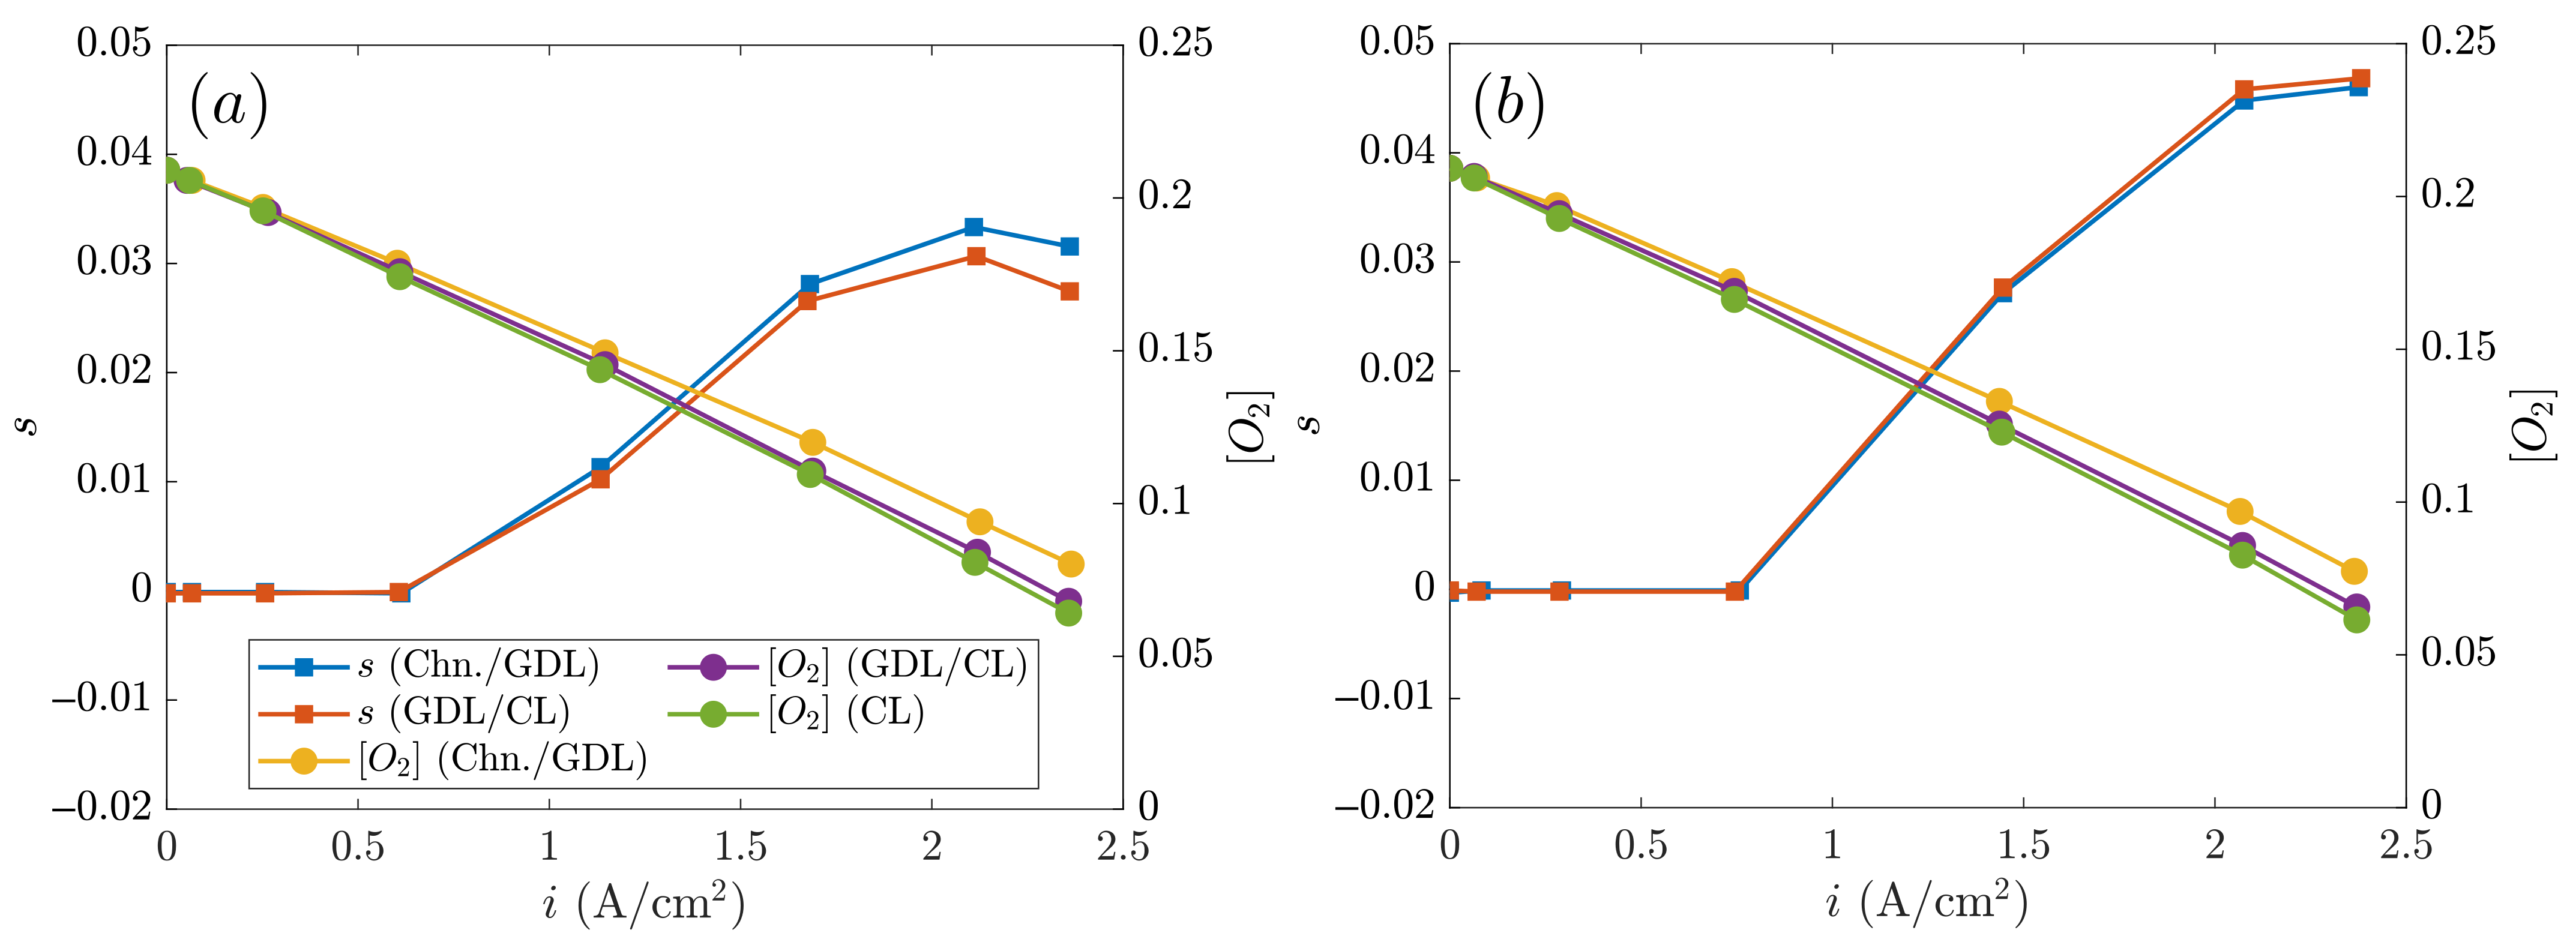
Figure 6 shows the liquid saturation in the cathode GDL (main axis) and the oxygen mass fraction in the cathode CL (secondary axis) against the current density. The diffusion layers SIGRACET 34BA and AvCarb P-75 without MPL were compared, with their main differences in the thermal and electric conductivity. Thus, according to both cases in
Figure 6, it can be observed that the oxygen mass fraction decreases with the current density because a larger quantity of
needs to be consumed to work at the given operation point. The layers next to the CL present the lowest oxygen concentration level because they are closer to the reaction themselves. It can be noticed that the
decay is practically linear in both cases, and their concentrations are similar (see
Figure 6a,b). On the other hand, even though the thermal and electric conductivity of the AvCarb P-75 GDL is several times higher than that of SIGRACET 34BA, their differences in the porosity and permeability are smaller. To specify, the permeability of SIGRACET 34BA is 35% higher, whereas the porosity is 20% lower. In general, the differences in the oxygen mass fraction are below 0.5%, which indicates that the differences in the permeability and porosity magnitudes are somehow “balanced”.
Regarding the liquid saturation in GDLs, an increase of it with the current density can be observed in
Figure 6 up to
A/cm
2, with saturation values of
and 0.045 for
Figure 6a and
Figure 6b, respectively. This can be explained because a larger quantity of oxygen reacts, producing a larger quantity of water, especially at the cathode side. However, at larger current densities (
A/cm
2), the water saturation level starts to decrease due to higher temperatures, and consequently, more important evaporation rates. What typically occurs is that the zone next to the cathode CL contains a larger water amount because it is where the reaction actually takes place. Such water content is spread to the adjacent layers, as occurred with the AvCarb P-75 GDL when contrasting
Figure 5b and
Figure 6b. However, the opposite effect is observed with the SIGRACET 34BA layer, appearing on the CL/GLD interface with a larger water saturation at very high temperatures. Because this case reaches inadequate large temperatures, some water evaporates and suddenly condensates in the GDL/channel interface (typically under-rib) as a consequence of the lower temperatures (see inverted curves in
Figure 6a). This effect is mainly caused by the low conductivity. The differences on the electrical and thermal conductivity can result in up to a 35% decrease in the liquid saturation.
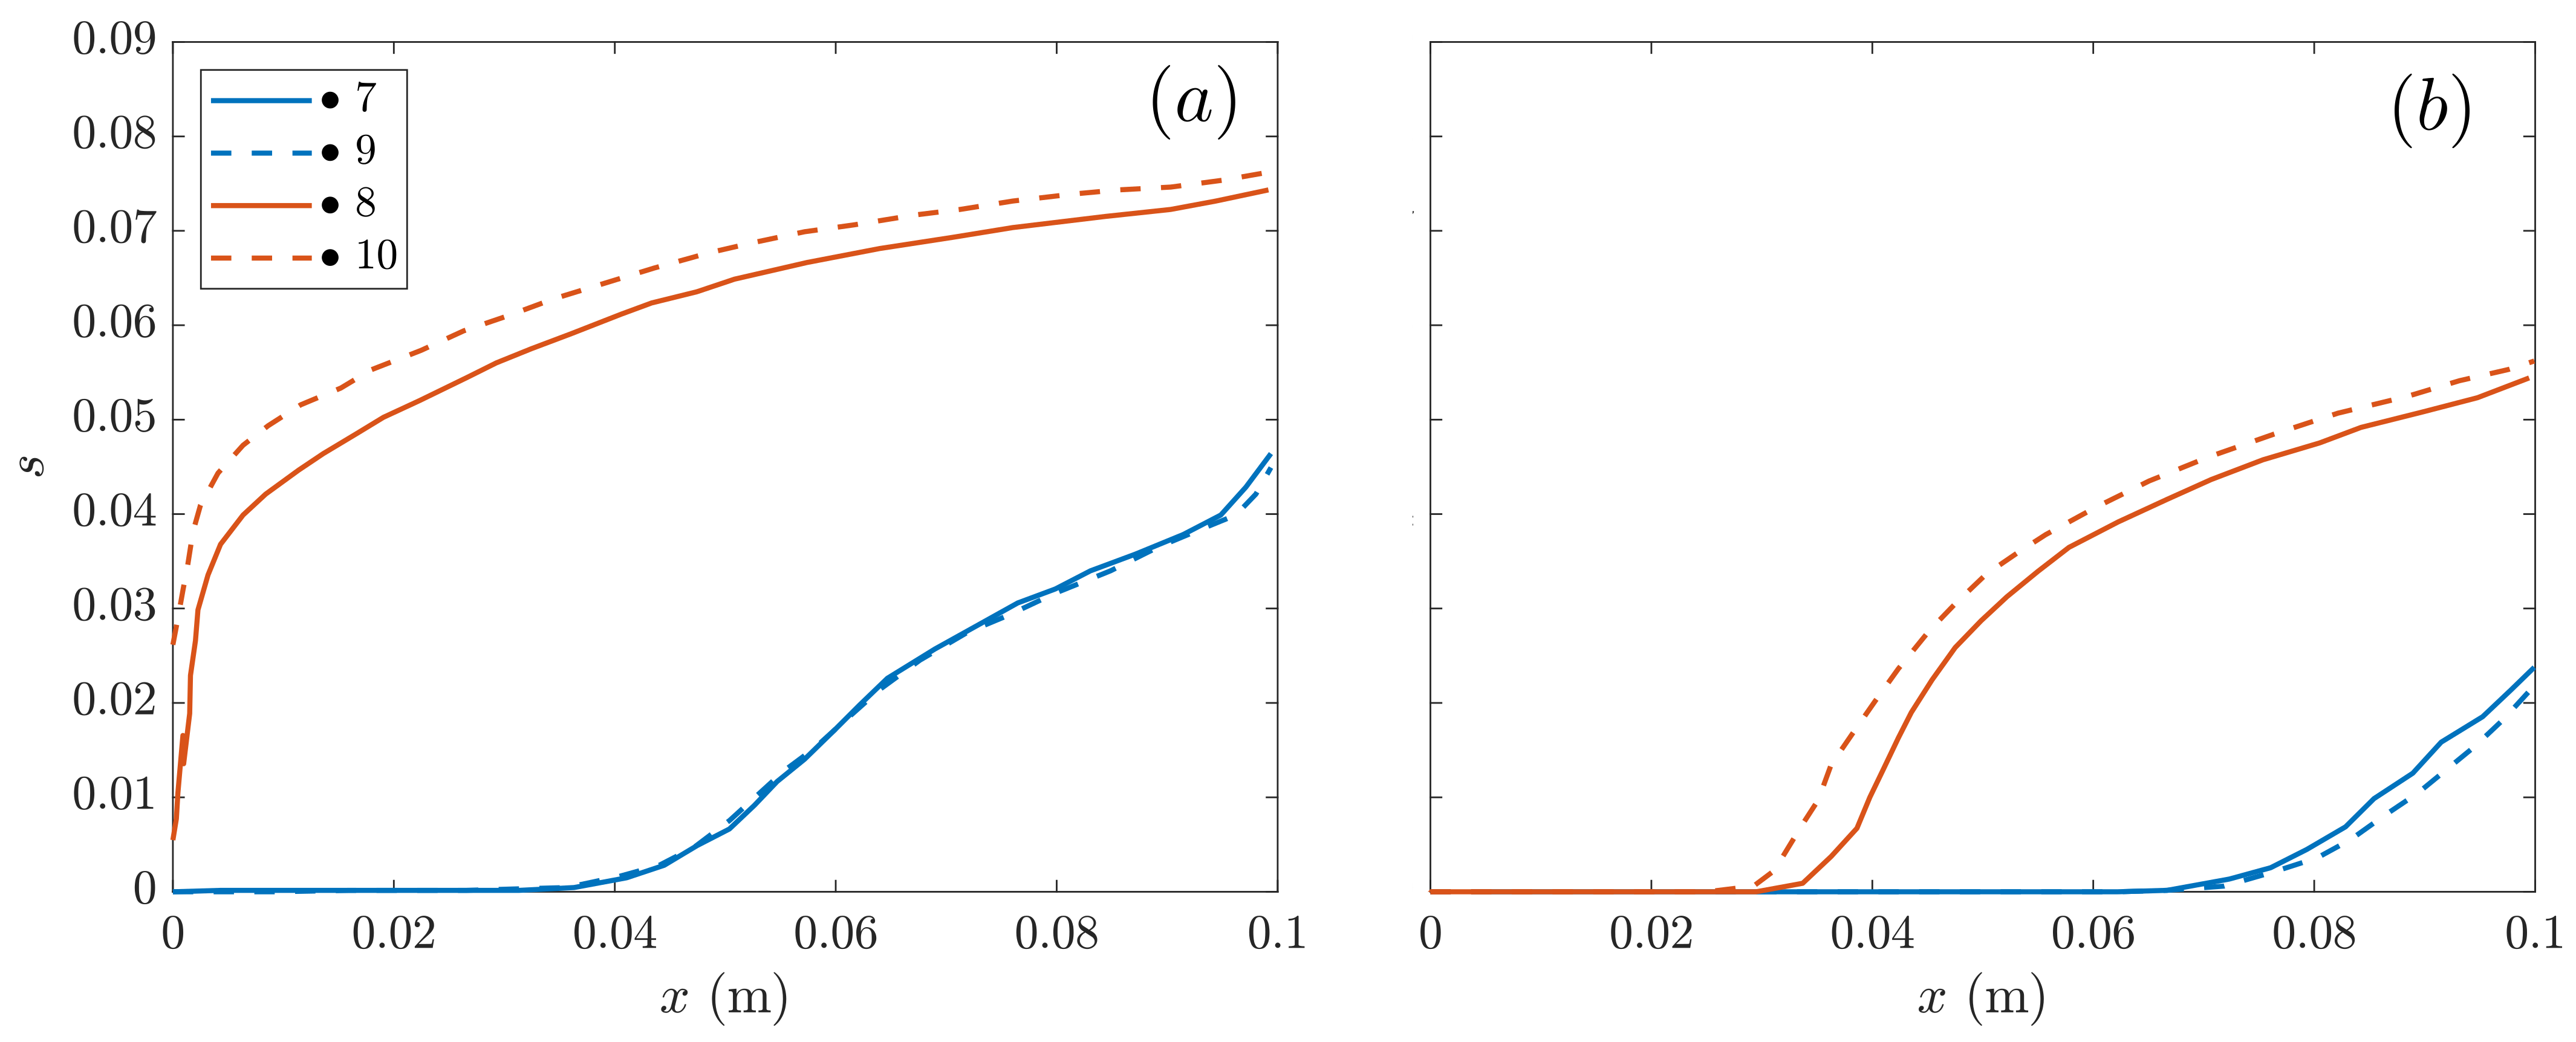
3.2. Evolution along the x− Coordinate
The cathode liquid saturation along the
-coordinate for the SIGRACET 34BC diffusion layer without MPL is compared at low and intermediate voltages
Figure 7 at the point locations shown in
Figure 2.
It can be observed in
Figure 7 that the liquid saturation in cathode starts to increase along the
-coordinate, with the differences between the under-rib and under-channel clearly seen in both
Figure 7a,b. Because the under-rib is in the colder zone (in contact with the refrigeration ducts), the saturation values (labels 8 and 10) are higher in there than the under-channel, so that a larger quantity of water is consequently condensed underneath. This process seems to progressively increase in the longitudinal coordinate along the fuel cell. In contrast, the points under the channel (say 7 and 9) are exposed to higher temperatures due to the species flow streams at the inlet, which contributes to the water evaporation (or to a smaller condensation rate) in this region. Note also that the evolution of the liquid saturation at the higher current density in
Figure 7a is more rapid than that in
Figure 7b at medium, in both the under-channel and under-rib. In general, that increase in the liquid saturation reveals a larger fraction of
consumed to generate a larger current density, with the subsequent water generation.
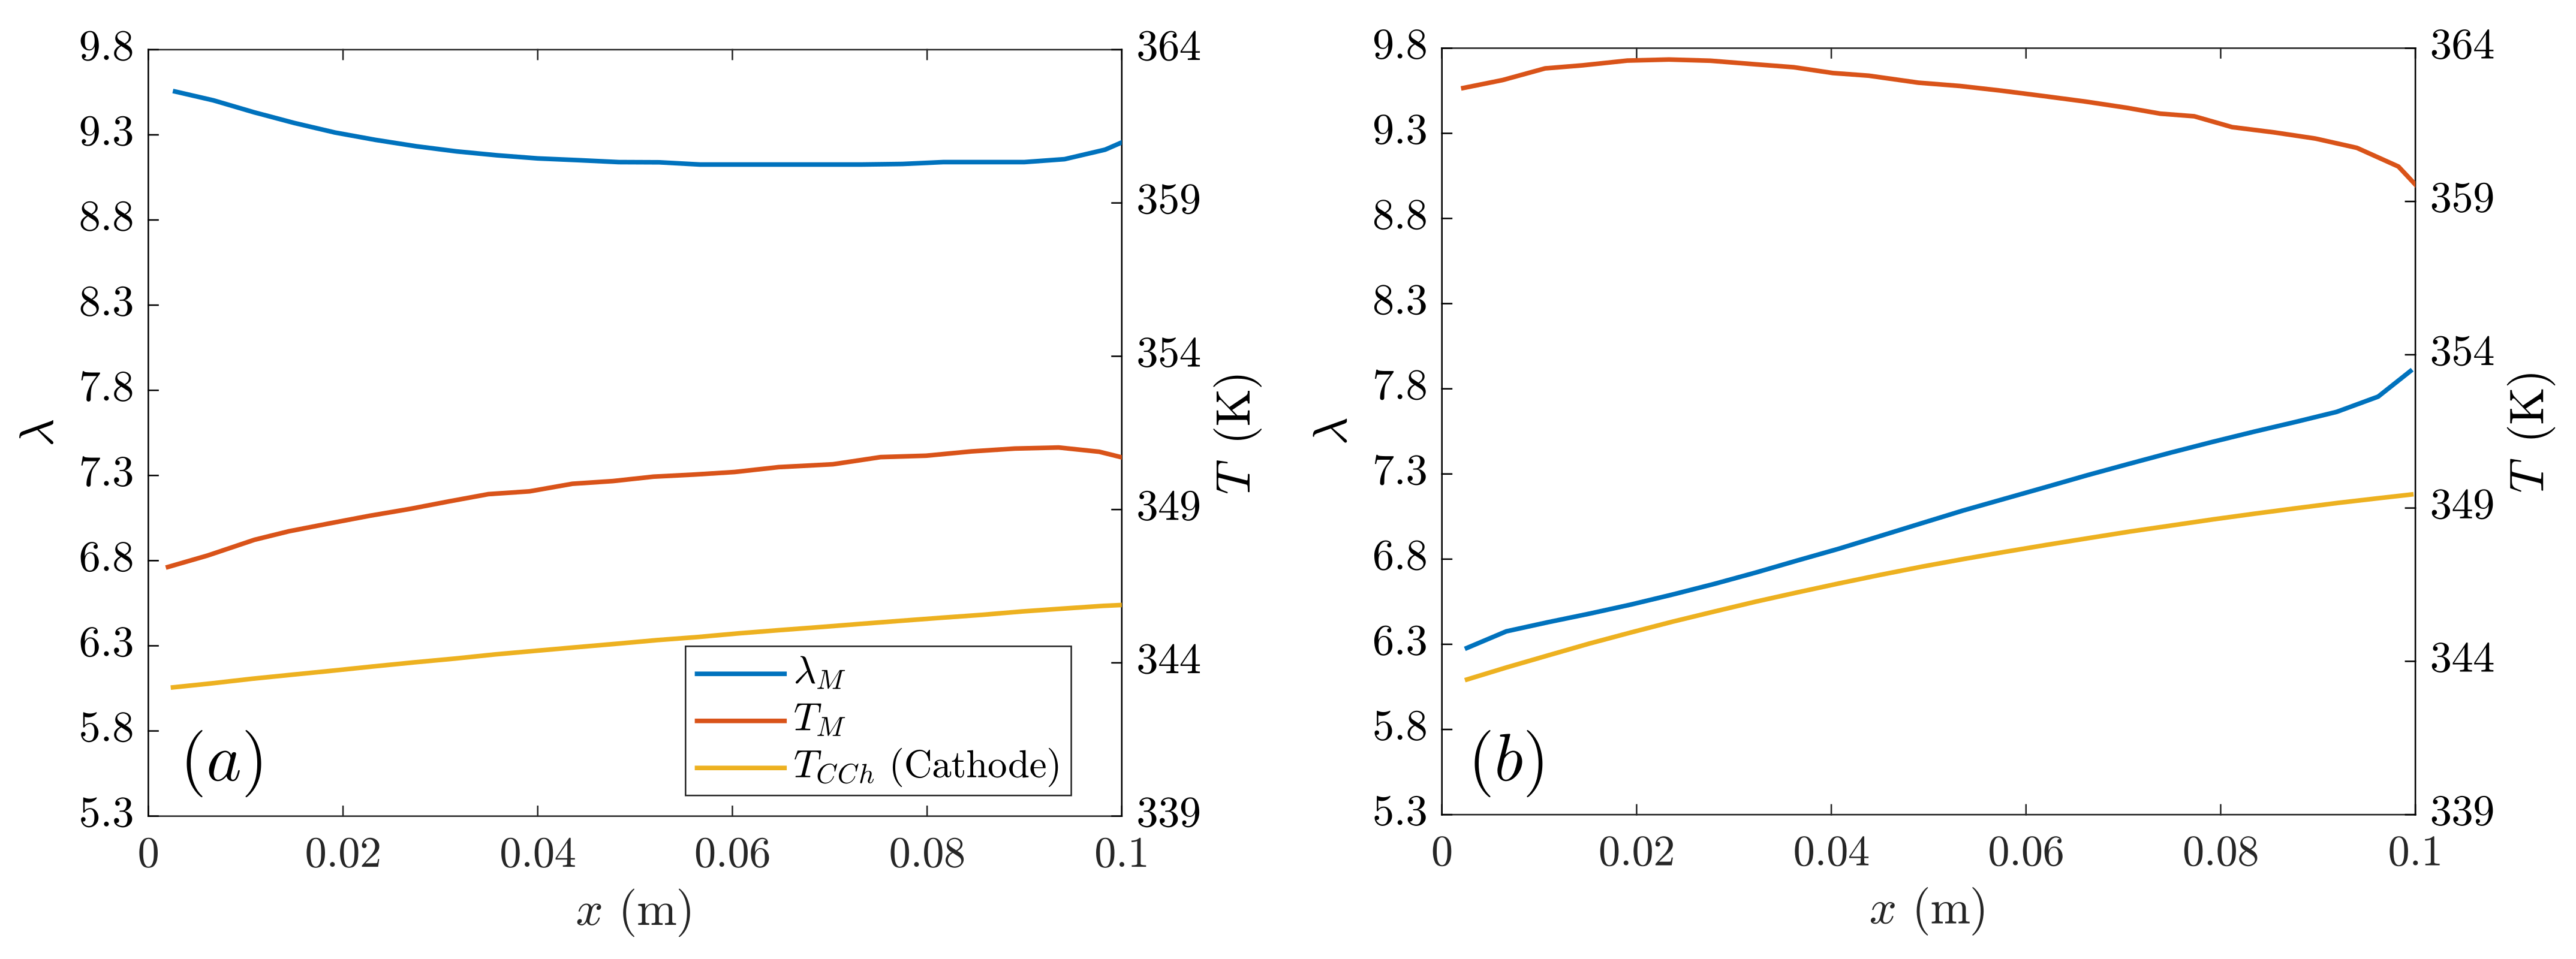
In
Figure 8, the water content and temperature in membrane and the temperature of the cathode cooling channel are plotted along the
-coordinate at a low voltage (or high current density). These charts basically compare the GDLs with the largest differences: AvCarb P-75 vs. SIGRACET 34BC without MPL. The higher electrical and thermal conductivity in the AvCarb P-75 diffusion layer results in lower temperatures, leading to a higher water content. However, the absence of MPL and the lower conductivity produce high temperatures in SIGRACET 34BC without MPL, resulting in a smaller water content due to evaporation. No substantial variations have been observed in the cathode cooling channel temperature.
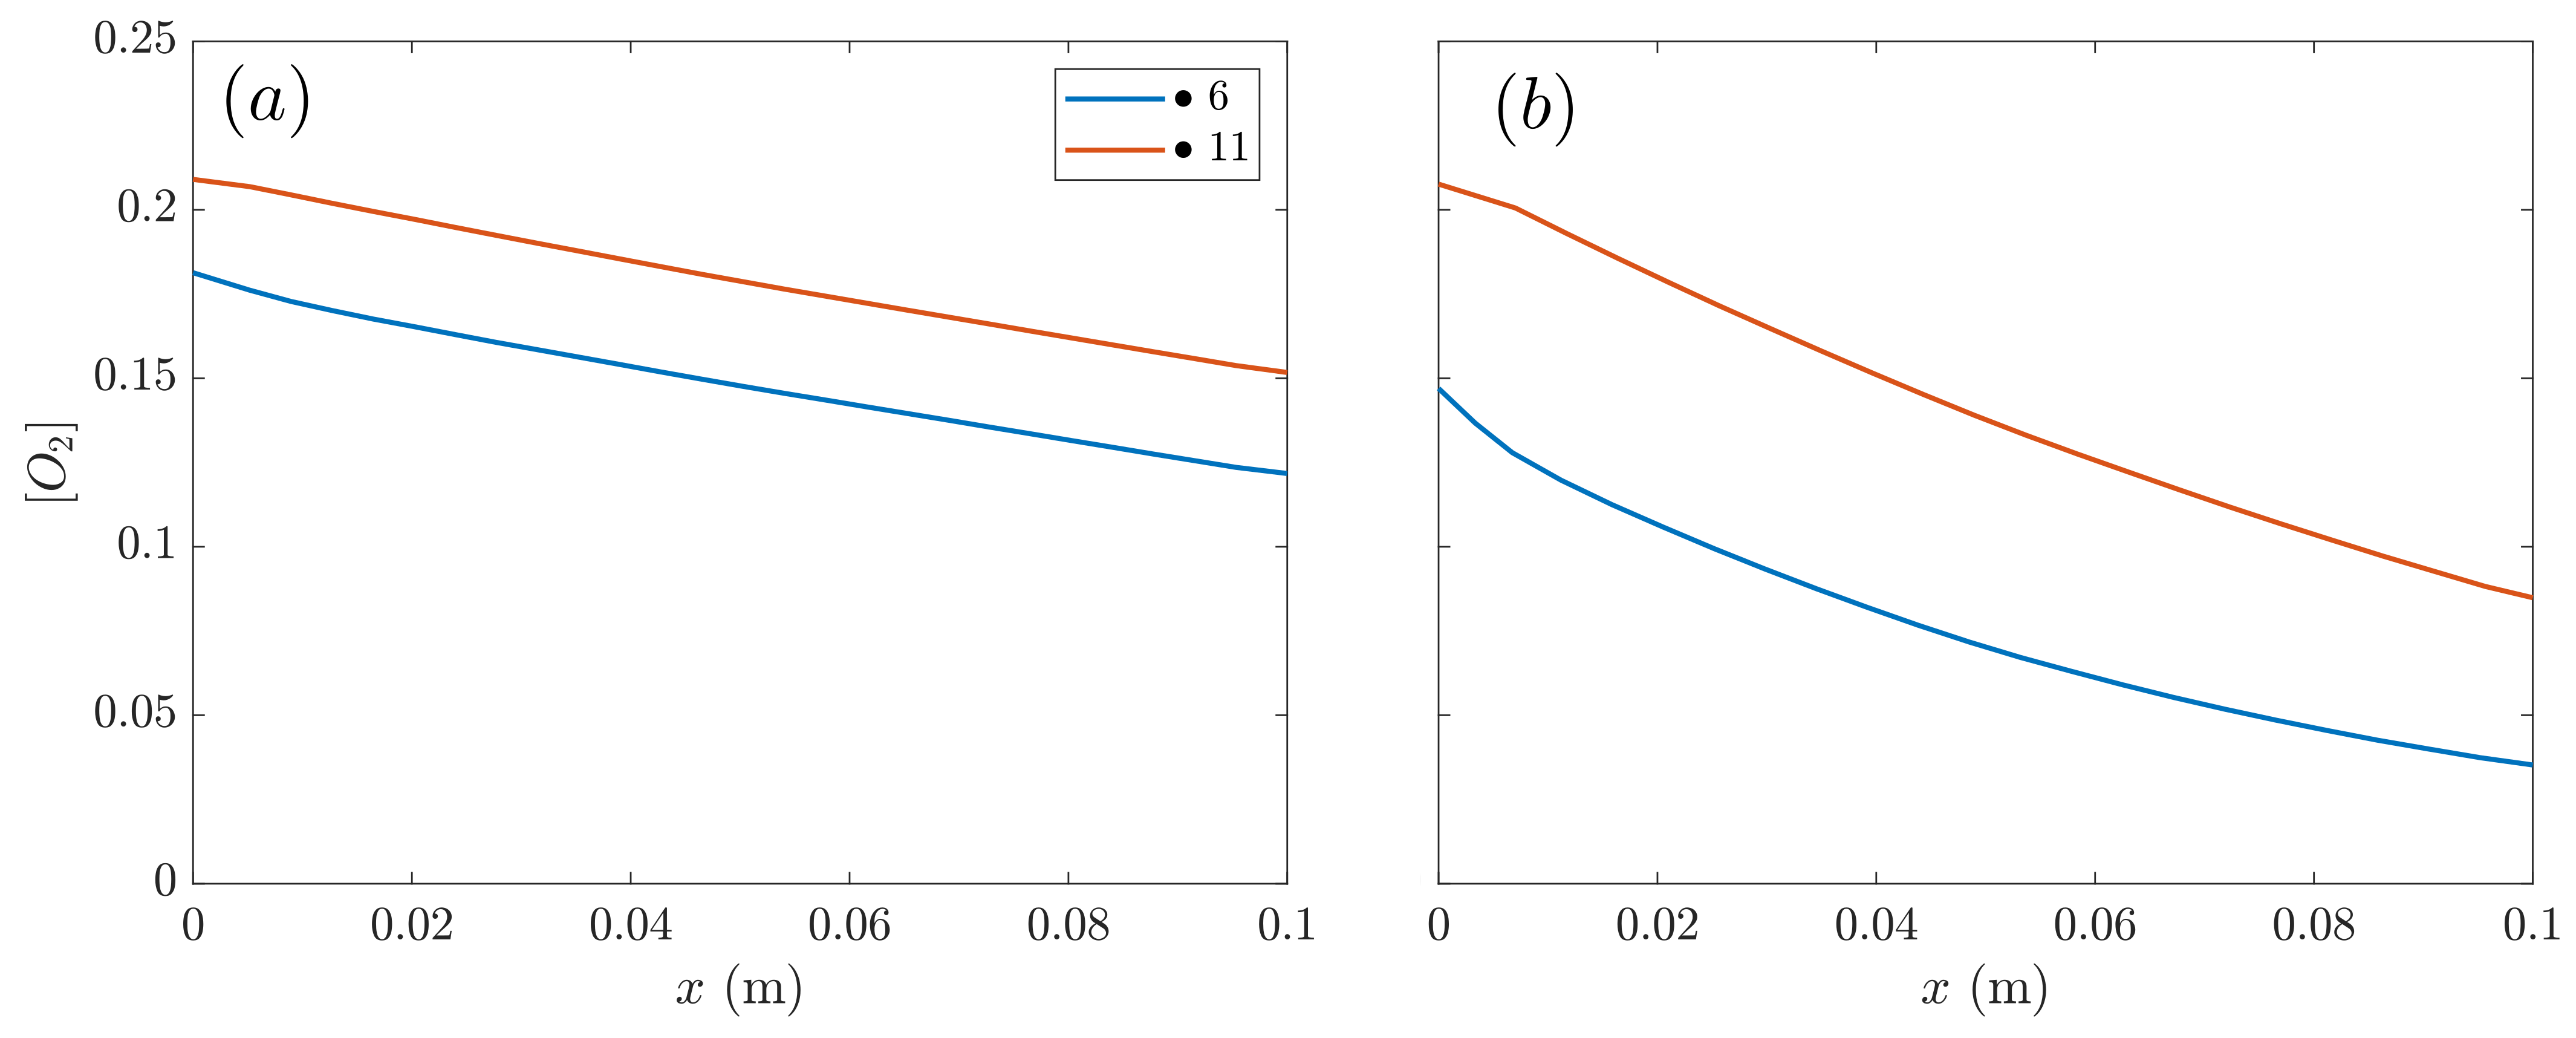
In
Figure 9, the oxygen mass fraction in SIGRACET 34BC with and without MPL is compared against the
-coordinate at low voltages. It can be observed that the absence of MPL originates more rapid oxygen consumption, coinciding with the higher power values observed in
Figure 4 for the GDLs without MPL. Moreover, the decay in the
concentration is observed to be roughly linear with
x, as occurred with the cases in
Figure 6 when analyzing the averaged magnitudes.
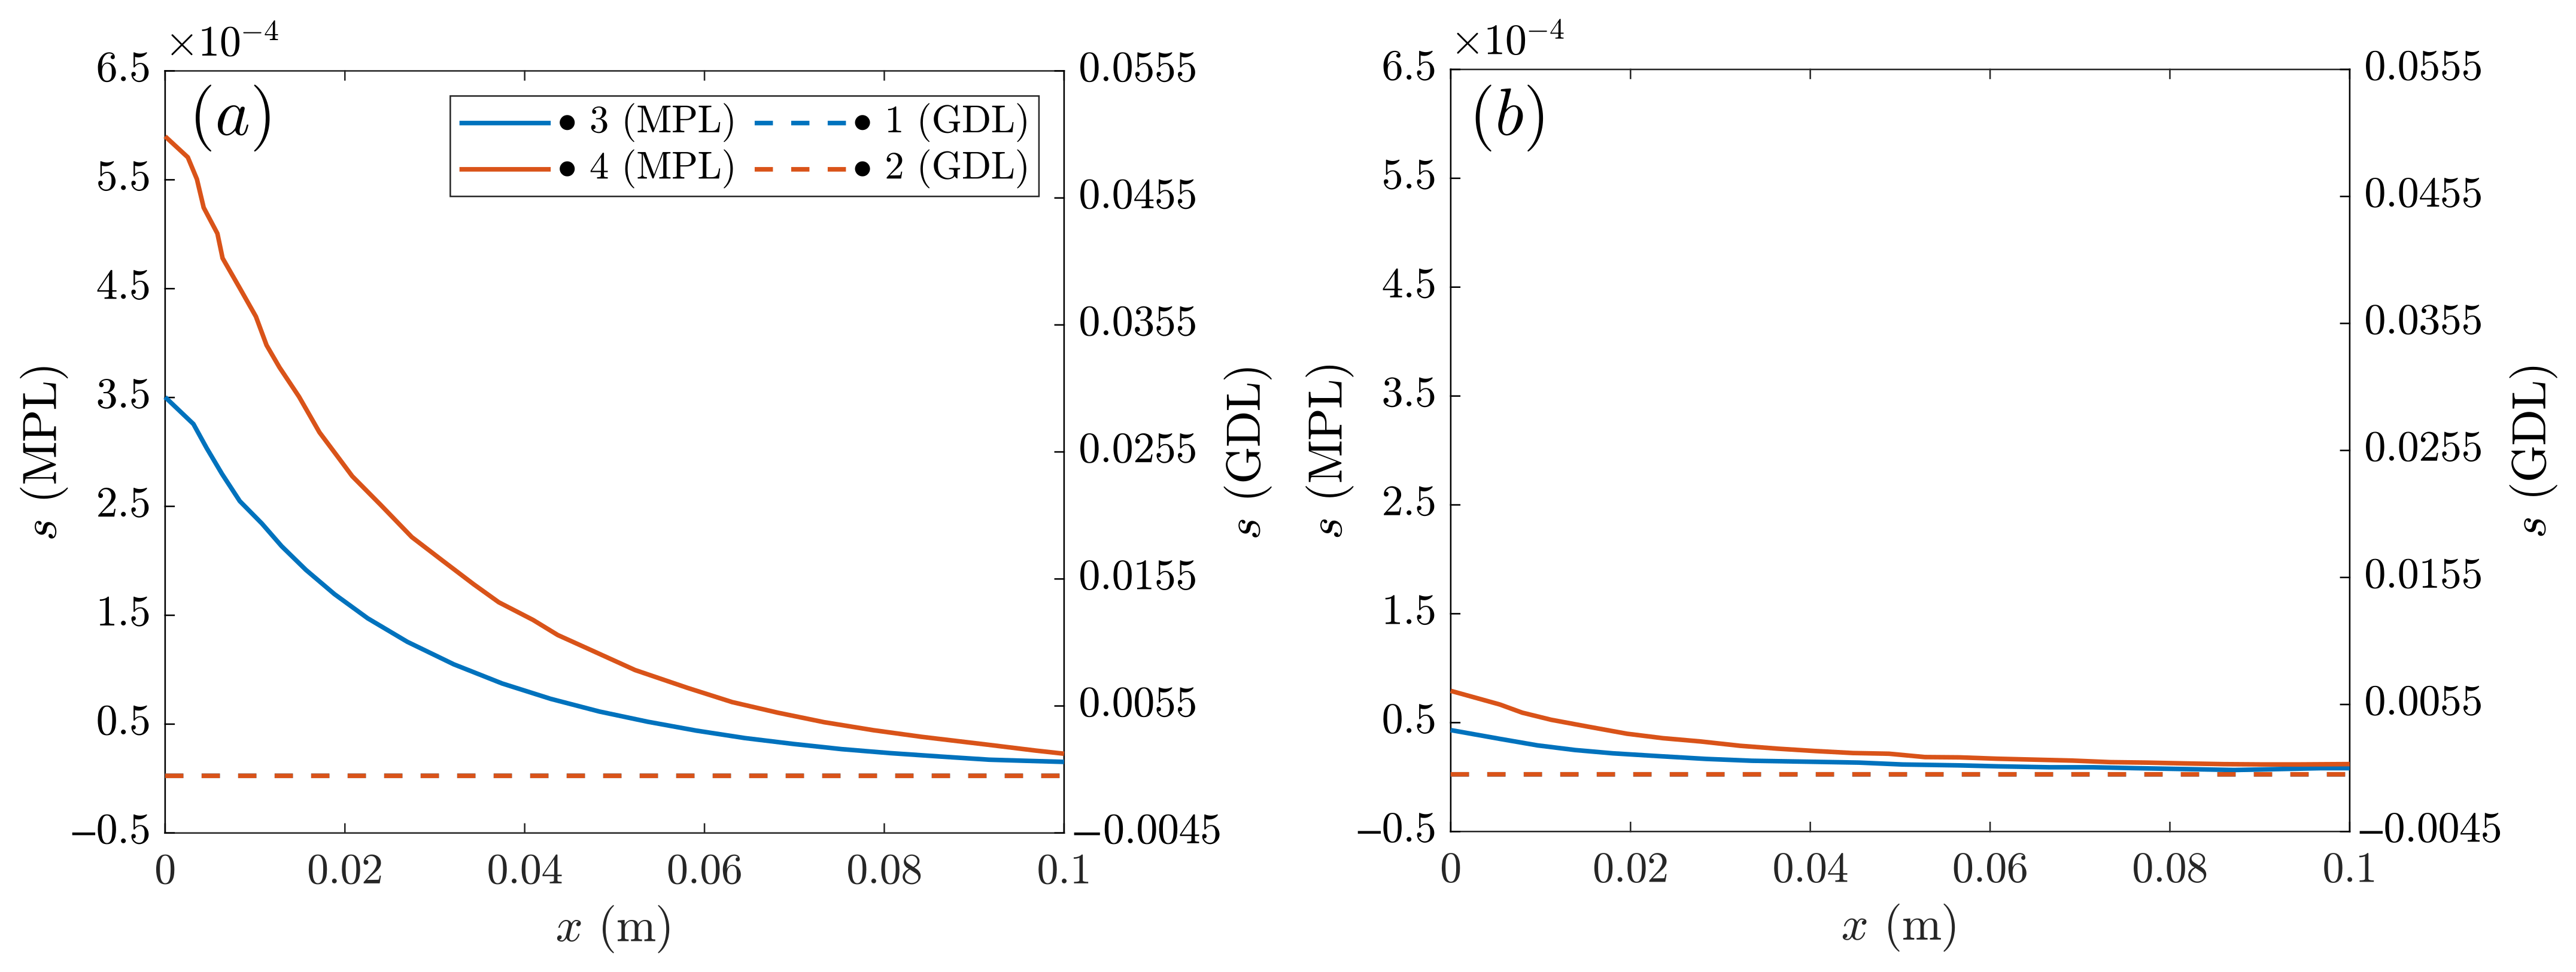
Similar to
Figure 7, it is also worth studying the anode water saturation at medium voltages in
Figure 10. Two cases with MPL are compared: AvCarb P-75 vs. SIGRACET 34BC. In the main axis, the anode saturation is represented in the MPL, and the GDL saturation is represented in the secondary, with the curves corresponding to the points labeled in
Figure 2. Like in
Figure 7, the differences between the under-rib and under-channel regions are clearly visible, showing the latter with a lower saturation level. The main differences between these cases lie on the electrical and thermal conductivity. With the SIGRACET 34BC diffusion layer, the low conductivity leads to higher temperatures due to the poorer proton conduction, which propitiates water evaporation and a smaller saturation in
Figure 10b. Note that there is a difference of one order of magnitude on
s between the AvCarb P-75 and SIGRACET 34BC GDLs.
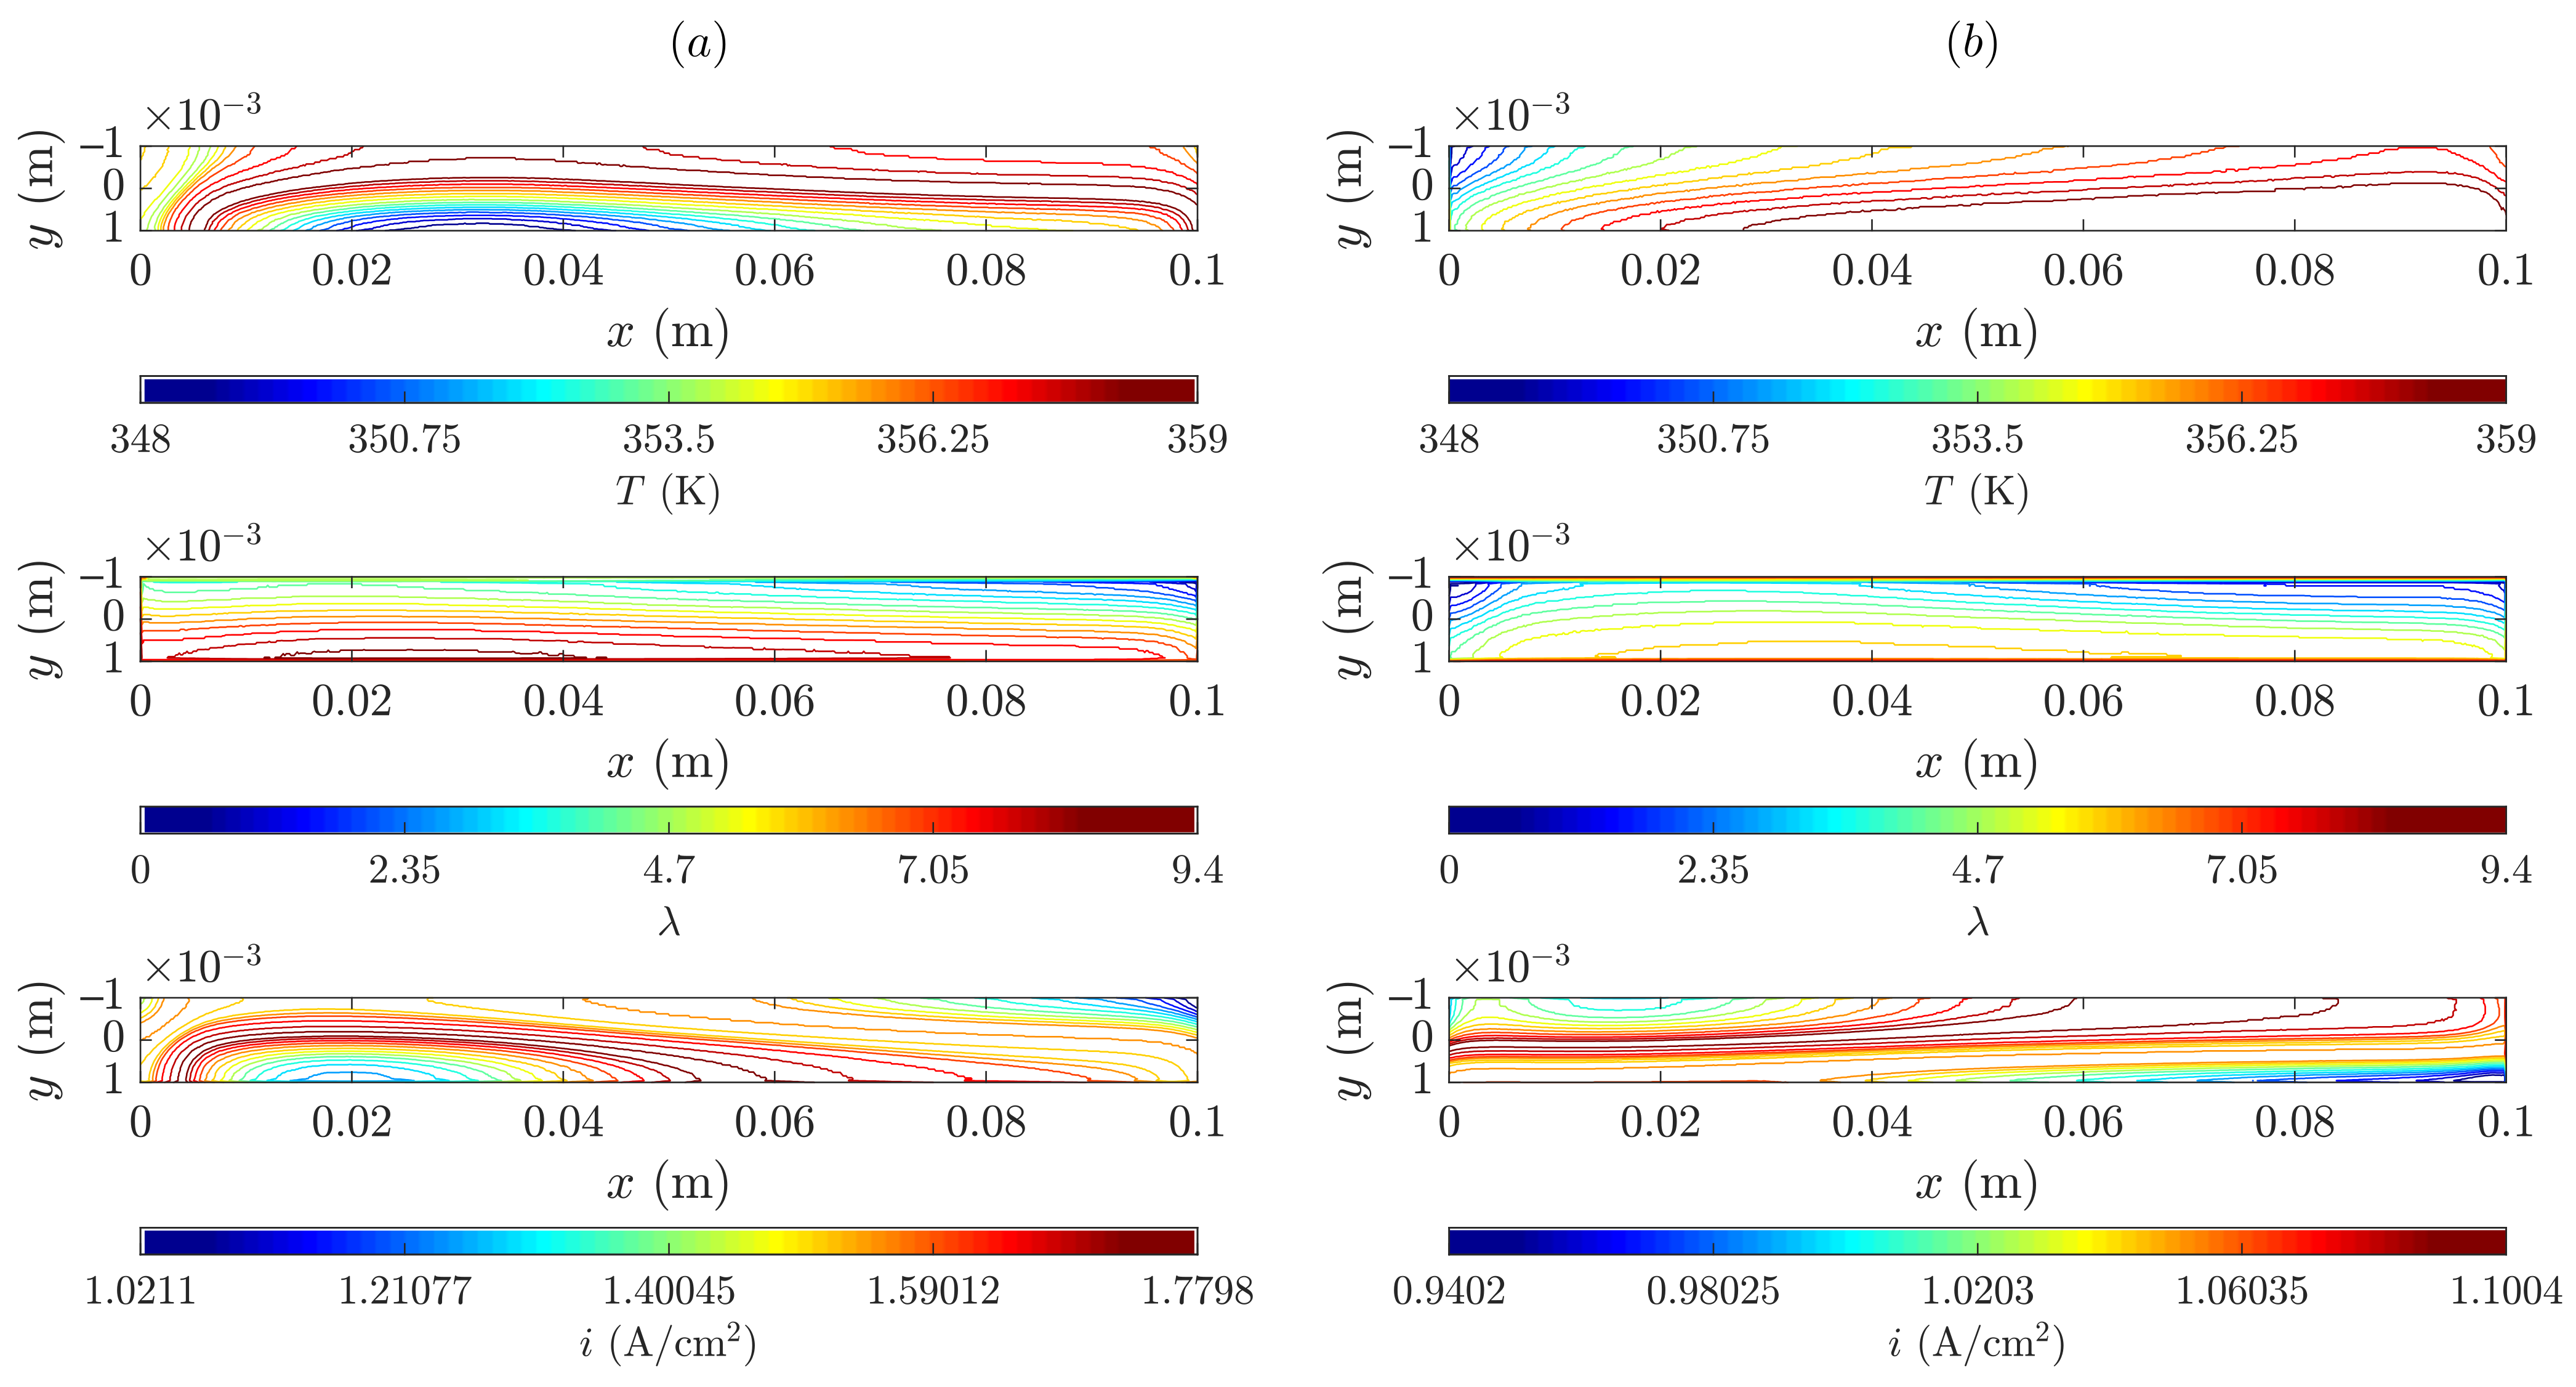
3.3. Membrane Mid-Plane Contour Plots
Figure 11 depicts the membrane mid-plane contour plots for temperature, water content and through-plane current density for the SIGRACET 34BC diffusion layer at low and medium voltages.
As can be seen, there is an increase in the temperature field from the medium to the low voltage cases because typically more oxygen is consumed in the second, and therefore, more heat is expelled. The temperature gradient at the lower voltage is about 9 K as a maximum, which almost duplicates the degradation threshold, resulting in potential cell damage. At the higher voltage, the gradient is about 3 K. Nonetheless, both cases are under the 100 °C limit. Regarding the water content, it seems that the
distribution along the membrane is rather uniform. Yet, the differences cannot be clearly observed in the contour plots. In general, there is an increase in the water level at high current densities because more water is generated, and, regardless of the high temperatures, the evaporation rate is not dominant at this stage. As for the through-plane current flux density, it is not possible to represent
Figure 11a,b at the same scale due to their striking differences (roughly 1.0–1.8 vs. 1.0–1.1 A/cm
2).
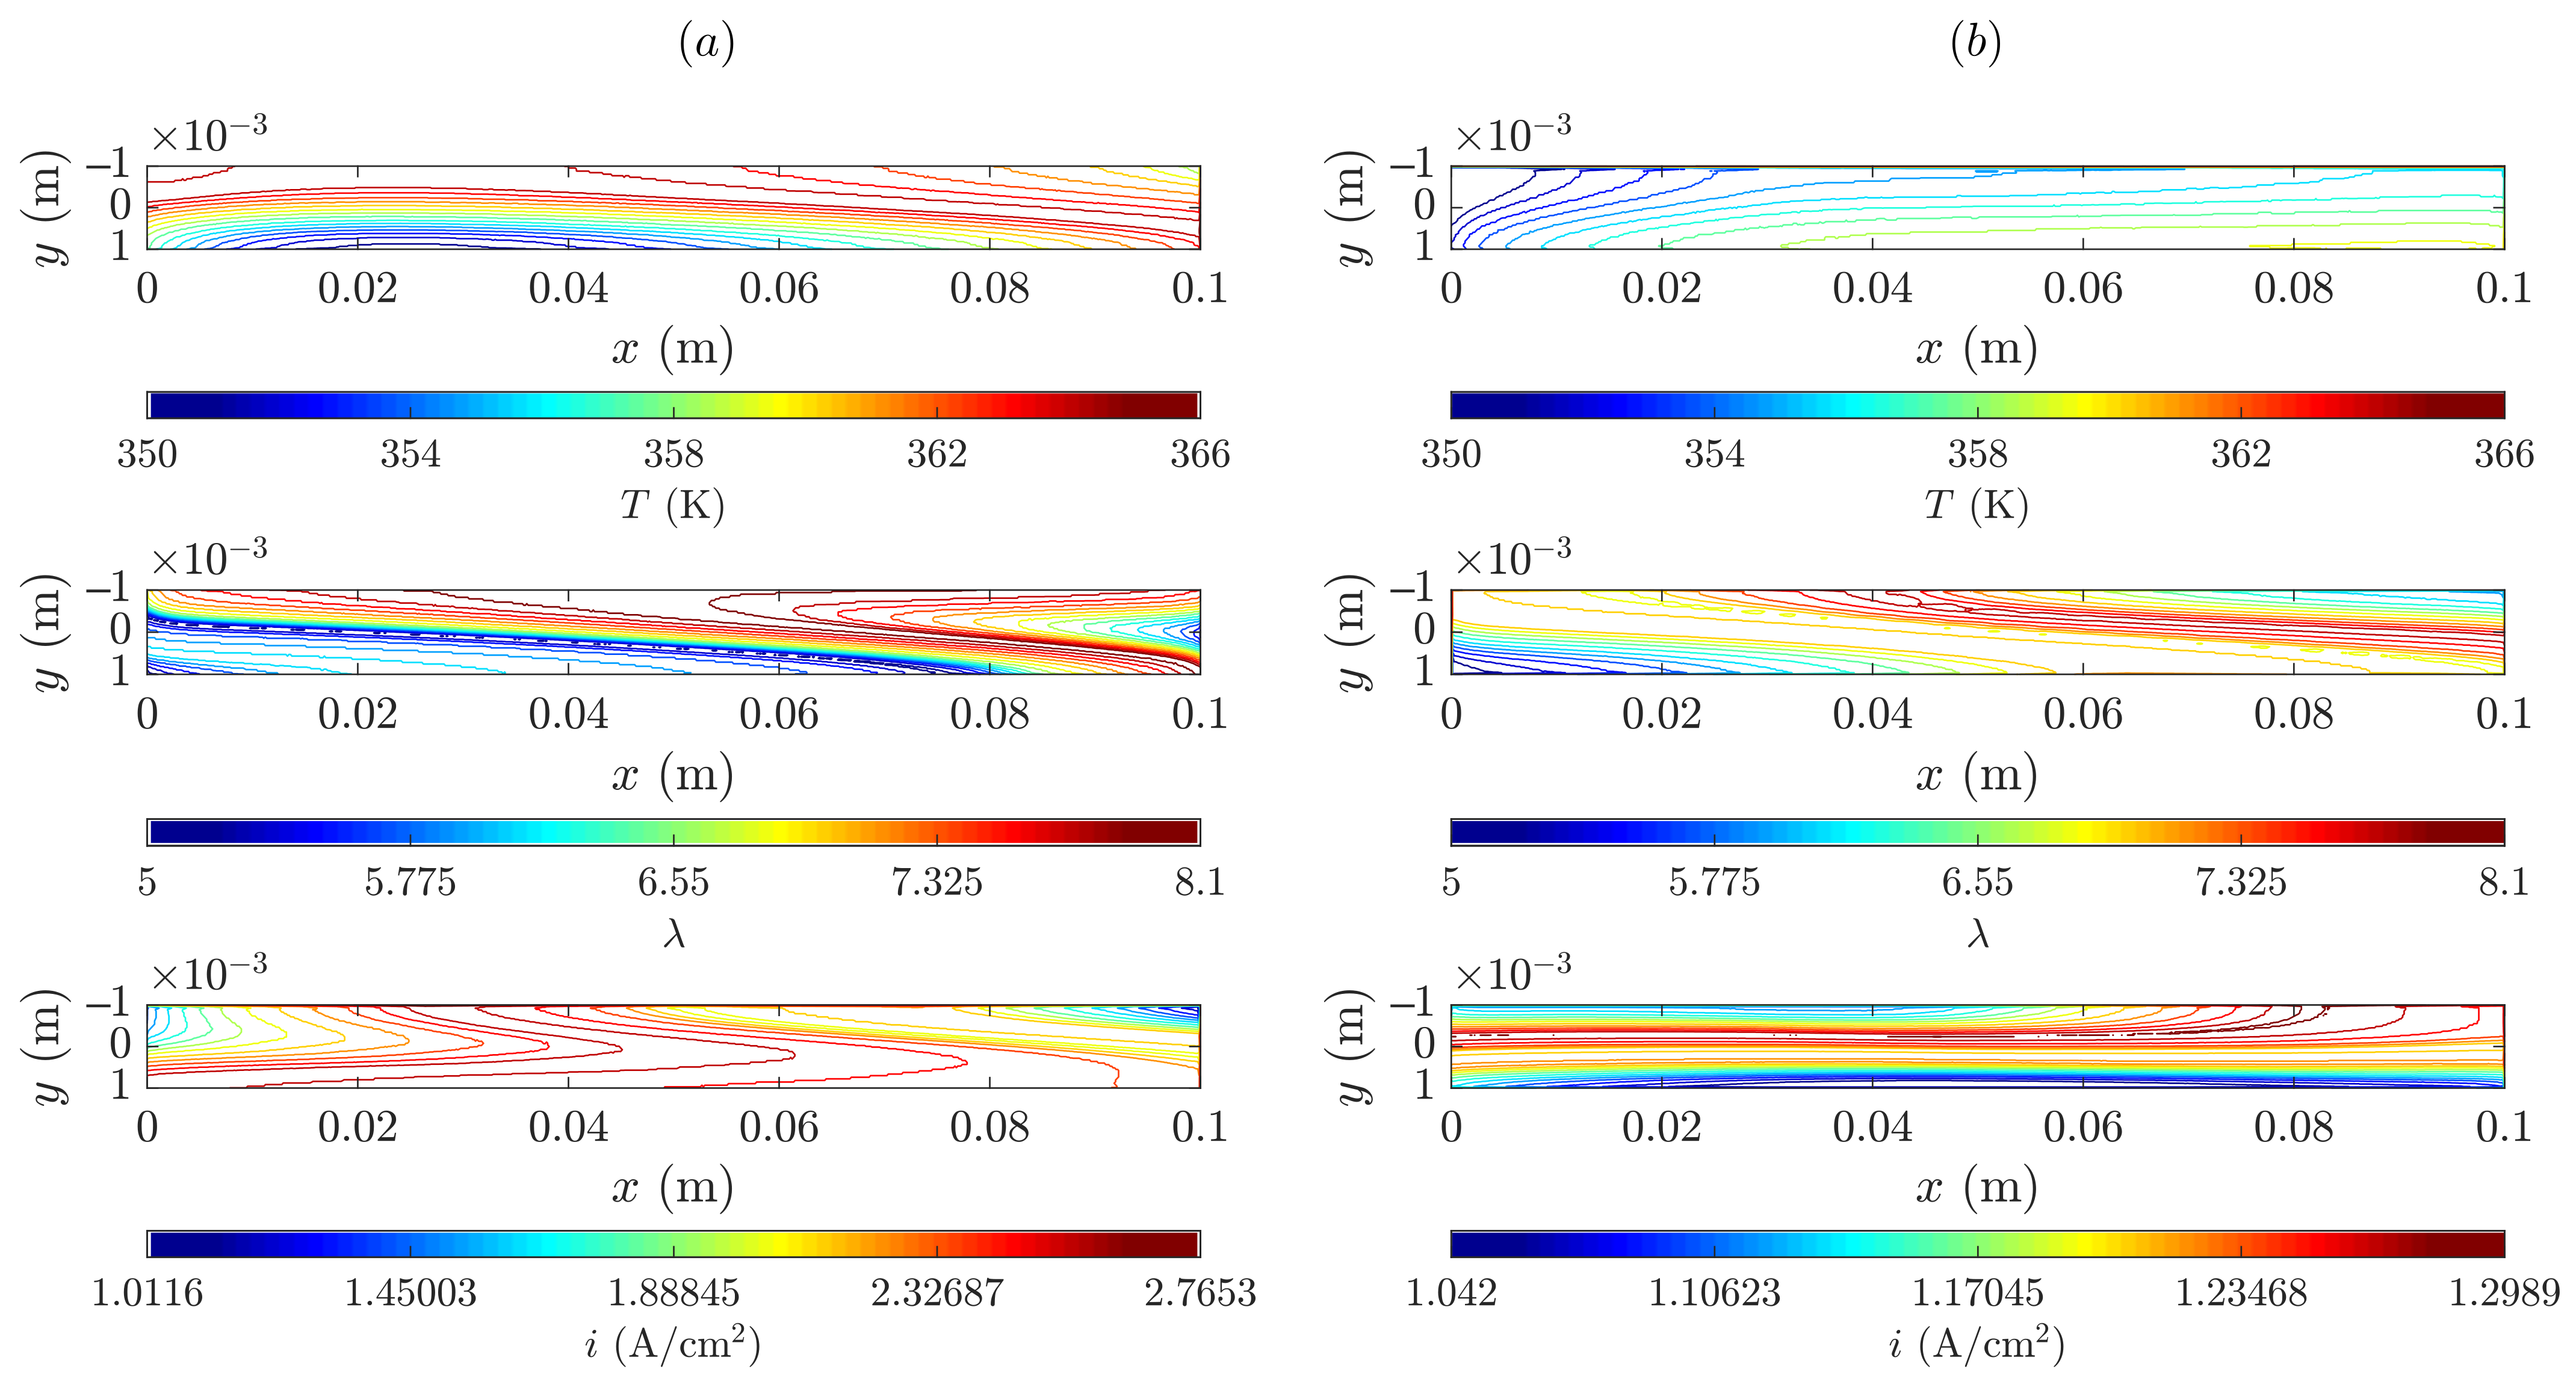
To conclude the analysis, membrane mid-plane (not averaged) contour plots for temperature, water content and through-plane current density are shown in
Figure 12 at low and medium voltages for the SIGRACET 34BC diffusion layer without MPL. The differences between the medium and low-voltage temperatures are more important than in
Figure 11. Whereas in
Figure 12b, the temperature is mostly around 350 K, in
Figure 12a there exists a 15 K gradient above the former distribution (note that in
Figure 11 this difference was 9 K). In this case, the temperature range is larger, going from 348–359 K to 350–366 K, so that the MPL absence can result in a worse proton conduction that magnifies the negative effects of the PEMFC operation, incurring a greater degradation risk.
In analyzing the water content, it can be observed that, due to evaporation, a lower water quantity appears where temperatures are higher and vice versa. At the intermediate voltage (see
Figure 12b), less water content is generated in some regions, but because temperatures are lower, condensation is present. Notice that the peak of water content has decreased 16% in the cases without MPL with respect to those with. It can be inferred from this that the MPL retains a larger water quantity, which positively contributes to the hydration in membrane. Because water enhances the proton conductivity, temperature is also affected by the presence of the MPL, either enlarging or reducing the lifespan of the components.
Finally, it is displayed in
Figure 12a that the through-plane current flux density reaches a maximum value of 2.76 A/cm
2, which represents more than twice that in
Figure 12b. Furthermore, this peak is about 1.6 times higher than the corresponding peak with MPL in
Figure 11a.
4. Discussion
It has been shown in this work that a higher electrical conductivity in a GDL reduces the ohmic losses taking place in a PEMFC, which leads to a consequent increase in the power output up to a 25%. Alternatively, the positive effect of a higher thermal conductivity in the diffusion layer is overpowered by the negative of a low electrical conductivity. Moreover, high temperatures and large temperature gradients in membrane are reached by GDLs with low thermal conductivity. Additionally, lower thermal conductivity results in less water saturation and less membrane hydration, being reduced by 20%. Furthermore, the cooling effect is shown to produce higher water saturation under rib, locally conducing to a minor oxygen diffusion.
On the other hand, the presence of a MPL has been shown to present positive aspects for the fuel cell temperatures and for the hydration level in membrane. The absence of MPL leads to temperature ranges that might accelerate the degradation of the PEMFC components. On the contrary, the presence of the MPL has been shown to be detrimental in terms of the performance and power generation, resulting in an 85% and a 30% less power obtained with the AvCarb P-75 and SIGRACET 34BC with MPL with respect to those layers without MPL, respectively. The comparative study also reveals that a higher permeability of the GDLs increases the overall power and the cell performance. Finally, for more practical applications, a subsequent study on the role of the MPL on the deformation of the porous materials (GDL/CL) under the compression of the plates (similar to that in [
20]) might be of interest to characterize commercial components under real operating conditions.
In general, it can be concluded that numerical simulations are a powerful tool to better understand the different phenomena occurring during the operation of PEM fuel cells and to estimate their performance. This would be of interest for the development of forthcoming fuel cells with components that maximize the overall performance while ensuring the lifespan of the device.


 ,
, 
