Article

Parametric Sensitivity Analysis and Performance Evaluation of High-Temperature Anion-Exchange Membrane Fuel Cell

Energy Systems Engineering, Atilim University, Ankara 06830, Turkey
Processes 2022, 10(7), 1315; https://doi.org/10.3390/pr10071315
Submission received: 30 May 2022 / Revised: 25 June 2022 / Accepted: 29 June 2022 / Published: 4 July 2022
(This article belongs to the Special Issue Experimental Analysis and Numerical Simulation of Fuel Cells)

Abstract

:
In this paper, a three-dimensional model of a high-temperature anion-exchange membrane fuel cell (HT-AEMFC) operating at 110 °C is presented. All major transport phenomena along with the electrochemical reactions that occur in the cell are modeled. Since the water is exclusively in the form of steam and there is no phase transition to deal with in the cell, the water management is greatly simplified. The cell performance under various current loads is evaluated, and the results are validated against the experimental data. The cell performance is examined across a range of operating conditions, including cell temperature, inlet flow rate, and inlet relative humidity (RH). The critical link between the local distributions of species and local current densities along the channels is identified. The distribution of reactants continuously drops in the gas flow direction along the flow channels, causing a non-uniform local current distribution that becomes more pronounced at high current loads, where the rate of water generation increases. The findings show that while a higher inlet flow rate enhances the cell performance, a lower flow rate causes it to drop because of reactant depletion in the anode. The sensitivity analysis reveals that the performance of an AEMFC is highly dependent on the humidity of the gas entering the cell. While high inlet RH on the cathode side enhances the cell performance, high inlet RH on the anode side deteriorates it.

1. Introduction

The worldwide demand for renewable energy resources has increased significantly. As a consequence, electrochemical energy conversion technologies continue to receive attention from experts. Among various alternatives, fuel cells offer great promise to become one of the key energy supply systems in the near future [1]. Based on the type of membrane used, fuel cells can be classified into two major groups: the proton exchange membrane (PEM), which conducts protons ( H + ), and the anion exchange membrane (AEM), which conducts hydroxide ions ( O H ). Proton exchange membrane fuel cells (PEMFCs) have been the primary focus of various researchers in the past two decades due to their outstanding power density even in low operating temperatures. Among a large class of polymers used for PEMFCs, Nafion is a widely and commercially available membrane with a proton conductivity of up to 100 mScm−1 [2]. Nafion is an example of fluorinated membranes that must be hydrated to conduct protons. However, under low operating temperatures, the water is usually present in liquid form, blocking the catalyst layer surfaces and decreasing the reaction capacity [3]. Therefore, it is desirable to have a membrane that is less reliant on hydration and can operate at high temperatures, in which the water exists predominantly in the vapor phase, and which precludes the transport limitation imposed by the presence of liquid water. Significant research has been conducted to overcome this barrier, with the polybenzimidazole (PBI) membrane presented as a viable solution. PBI is an example of non-fluorinated membranes with high proton conductivity and low electro-osmotic drag, that are capable of operating at high temperature and low gas humidification with notable mechanical, chemical, and thermal stabilities [4].
Another major drawback of PEMFCs is their cost, which is mainly because of the platinum-based electrodes usually used in these devices. Recently, interest has increased in anion exchange membrane fuel cells (AEMFCs), since they function in an alkaline media rather than an acidic one, where electrochemical reactions take place more easily [5,6]. AEMFCs are technically identical to PEMFCs, with the exception that the membrane is alkaline rather than acidic. AEM allows for the use of non-noble metals as catalysts for fuel-cell operations at a lower cost than PEM [7,8]. Hence, many researchers are shifting their research focus from PEMFCs to AEMFCs. In the past, AEMFCs were thought to be too weak in terms of ionic conductivity compared to PEMFCs; however, through the years, significant advances have been made, equipping AEMs with reasonable ionic conductivities compared to PEMs [9].
Similar to PEMFCs, raising the operating temperature in AEMFCs is expected to improve electrode kinetics and water management in the cell [10]. The current AEMFC goals published by the U.S. Department of Energy (DOE) suggest using AEMFCs at temperatures over 80 °C to improve cell performance [10]. However, most of the commercially available membranes fabricated for AEMFCs are not suitable for high operating temperatures. As a result, continuous efforts in polymer chemistry are being made to produce long-lasting AEMs at high temperatures. The development of new thermally and chemically stable fluorinated, non-fluorinated, or aromatic polymers with high ionic conductivities is of primary interest for researchers. Thus far, only a handful of membranes have been reported to be stable in an operating temperature range of 80–95 °C [11,12,13,14,15,16,17,18,19,20,21], and the only study that has been conducted at a temperature above 100 °C is the one conducted by Douglin et al. [22]. They performed in situ testing using a non-fluorinated, radiation-grafted AEM containing covalently-bonded benzyltrimethylammonium (BTMA) with low-density polyethylene (LDPE). With a remarkable ionic conductivity of 290 mSm−1 at an operating temperature of 110 °C, the tested cell demonstrated exceptional performance by reaching a limiting current of above 6 Acm−2. The authors successfully illustrated the feasibility of running AEMFCs at high temperatures for the first time and paved the way for a new field of study called “high-temperature AEMFC (HT-AEMFC)”.
The current study, using a computational model, is intended to obtain a fundamental understanding of different mechanisms that happen in this new type of fuel cell. An accurate numerical model complements the experimental studies by providing insights into the interaction of different physical phenomena occurring in the cell. Up until now, there have been very few attempts to model primary electrochemical and transport processes in the AEMFCs. A steady-state single-channel model was presented for only the anode side of a typical AEMFC by Huo et al. [23]. It was shown that the concentration of liquid water in the anode reduces as the cell temperature rises. Including transient effects within the same model, Deng et al. [24] investigated the dynamic behavior of the cell under various operating conditions. Raising the current density and inlet relative humidity (RH) were seen to increase the liquid water volume fraction in the cell. The same model was improved by Jiao et al. [25] by incorporating the cathode side of the AEMFC. Cathode humidification is seen to be more critical than anode humidification. A half-cell model with a straight channel was considered by Machado et al. [26] to investigate the impacts of flow direction, temperature, and RH on cell performance. While the increase in operating temperature and RH were shown to increase the output current density, the flow direction influence on cell performance was not significant. Water management along the channel was studied by Gerhardt et al. [27] using a 2D model combined with a 1D down-channel stepping method. In that work, the authors specifically looked into the effect of decreasing oxygen content on local current density along the channel. A one-dimensional AEMFC model capable of predicting time-dependent performance at high current densities was proposed by Dekel et al. [1]. High air RH values were found to increase cell performance, particularly at high current densities.
The effect of operating conditions on the transport characteristics of reactants and products, which ultimately determine the performance, is one area in AEMFC research where there is still a considerable knowledge gap because of a lack of basic inquiry and modeling efforts. In particular, water management in the AEMFC where the water produces at the anode and consumes at the cathode is still a challenge. To fully determine the parametric influence and optimize the cell operation, it is essential to have a solid understanding of the effects of different variables at various stages of the cell operation. A practical model which could calculate any parameter in terms of the others is a useful tool in this regard. All of the numerical studies carried out so far have been for those cells with low operating temperatures. No mathematical models have been proposed for the potential class of HT-AEMFC in which there is no liquid water present in the cell and therefore water management is simpler. Therefore, the present study is designed to fill this gap in the current literature by constructing a numerical model that can accurately simulate all the physical phenomena occurring in this new type of fuel cell. A steady-state, three-dimensional, and isothermal model is presented, coupling the flow, species, and charge conservation equations, to assess the cell performance under various operating conditions. This model allows us to gain a better understanding of species distribution and its impact on local current densities throughout the cell. The outputs of the current analyses provide valuable information on the development of high-performance HT-AEMFCs that demand more efficient water management strategies.

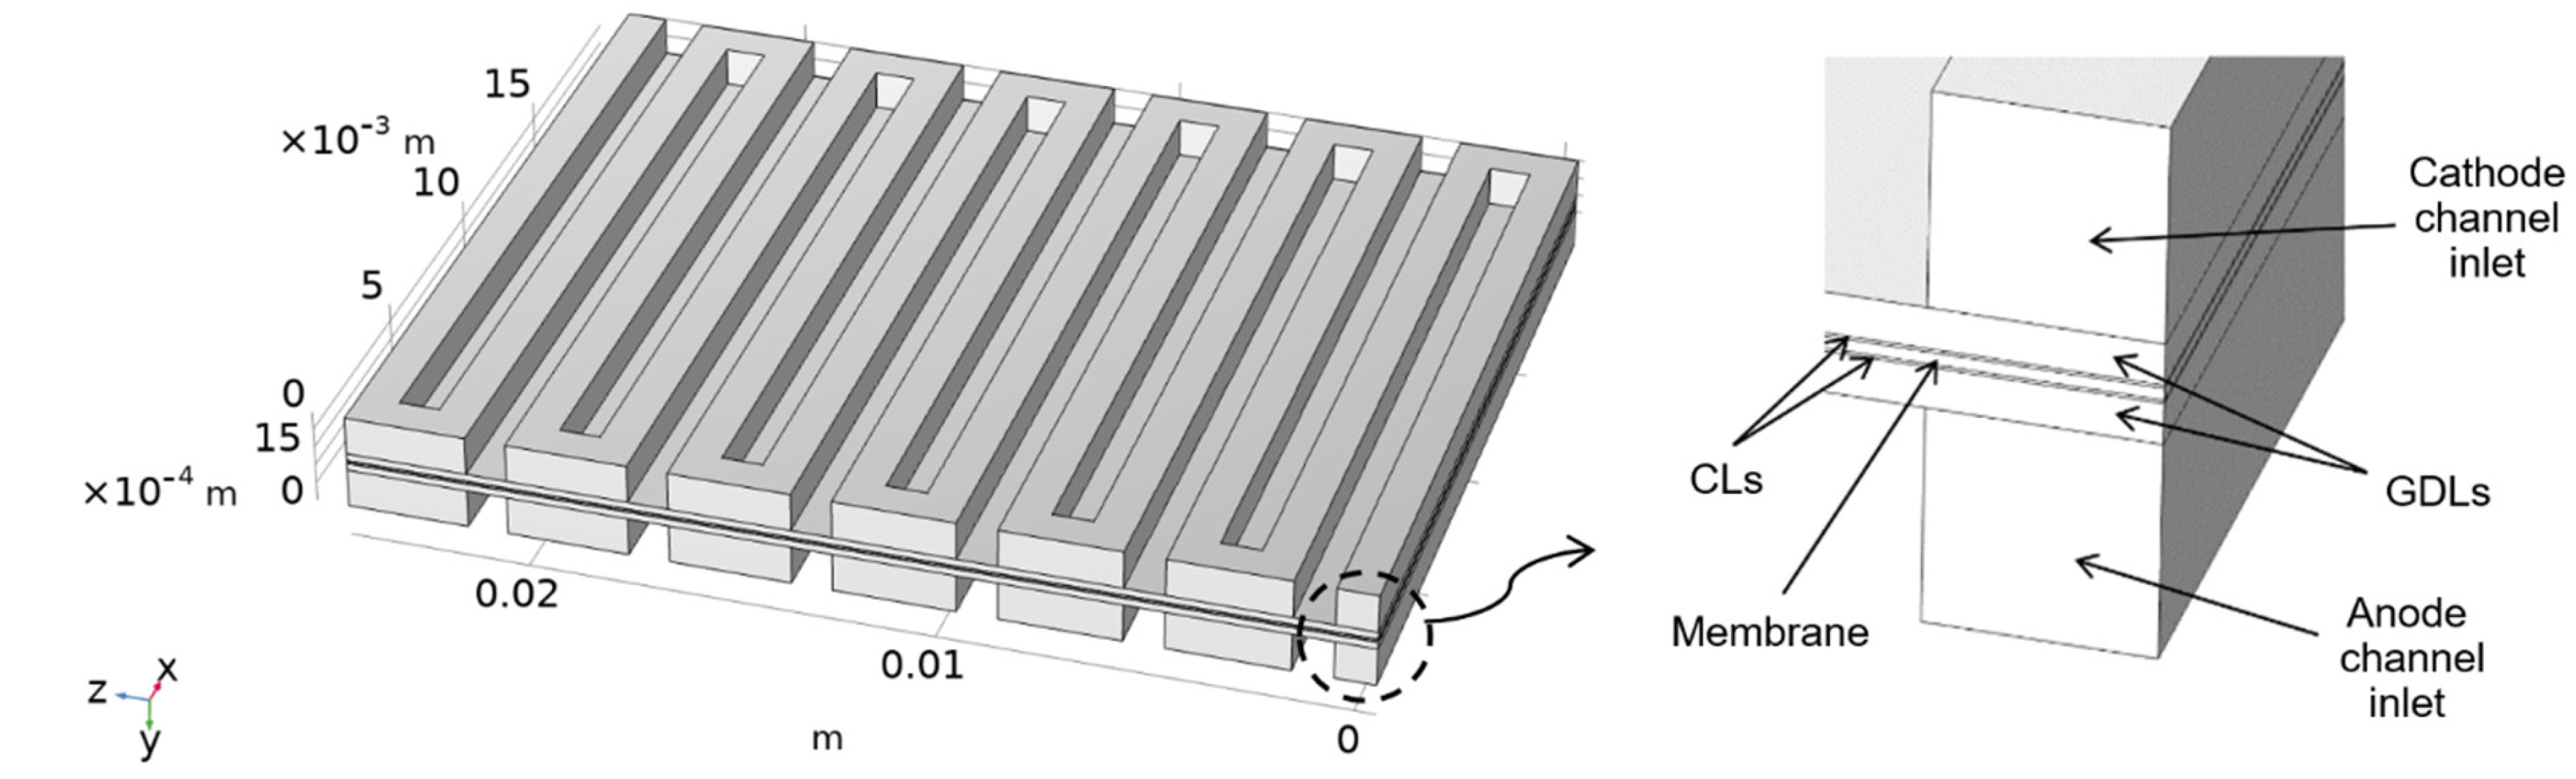
2. Model Description

The three-dimensional numerical model given in this study aims to replicate the experimental study performed by Douglin et al. [22]. In their experiment, a radiation-grafted AEM, fabricated from low-density polyethylene (LDPE) with benzyltrimethylammonium (BTMA) head groups [21,22], was utilized. The anode and cathode were respectively coated with 0.7 ± 0.05 mg PtRu   cm 2 and 0.7 ± 0.05 mg Pt   cm 2 . Toray Paper 060 (TGP-H-060) was selected for use as a gas diffusion layer (GDL). Two 5 cm2 single pass serpentine graphite bipolar plates were employed as the flow field channels. The cell was tested using an 850e Scribner Fuel Cell Test Station. The cell temperature and the dew point temperature for the inlet gases were fixed at 110 °C. The anode and cathode were supplied with fully humidified hydrogen and oxygen, respectively. For both electrodes, the gas flow rate was provided at 1 slpm with a backpressure of 1.5 barg. For the tested cell, the polarization curve was recorded. Additional information on the experimental study can be found in Ref. [22]. Figure 1 depicts the computational domain of the fuel cell created based on the experimental study, and it includes the flow channels, GDLs, and catalyst layers (CLs) in both the anode side and the cathode side, along with a membrane sandwiched in the middle. The domain spans the whole length and width of the active area with a cross-section of 2 cm × 2.5 cm.

2.1. Assumptions

The operating principle of a typical AEMFC is illustrated in Figure 2. The electrochemical half-reactions that occur in the anode and the cathode of an AEMFC are generally expressed as follows [26]:
Anode :   H 2 + 2 O H 2 H 2 O + 2 e
Cathode :   1 2 O 2 + H 2 O + 2 e 2 O H
On the cathode, the oxygen reduction reaction (ORR) occurs, where water reacts with oxygen and electrons, generating hydroxyl ions as a byproduct. On the anode, the hydrogen oxidation reaction (HOR) occurs, where hydrogen combines with hydroxyl ions ( O H ) to generate water and electrons, with the latter passing through an external circuit. These reactions are applied to the model by incorporating the conservation equations of mass, momentum, species, electronic charge, and ionic charge.
Some assumptions are made for numerical simulations without compromising the general physical features of the model, including the following:
  • The cell operates in a steady-state mode;
  • The ideal gas assumption is considered for both individual gases and gas mixtures;
  • The flow is described as laminar due to the usually low fluid speed;
  • The isothermal model is chosen because temperature variations are typically negligible in fuel cells with small active areas;
  • In HT-AEMFC, water is only expected to exist in the vapor phase; hence, a single-phase flow is assumed;
  • GDLs, CLs, and membranes are considered isotropic materials with uniformly distributed porosities;
  • There is no cross-over of reactants across the membrane; and
  • The current model ignores water that dissolves in the membrane as well as its impact on ionic conductivity because the processes underlying these phenomena are yet unclear for the LDPE-BTMA AEM. Nevertheless, in the current model, the relative humidity in both the anode and the cathode is at the highest level, deterring extensive water concentration gradient across the membrane. In addition, according to the observed data [28,29], the water penetration via the membrane–gas interface is the limiting transport mechanism because water is carried more easily across the membrane when it is exposed to liquid water, and not vapor, on its sides.

2.2. Governing Equations

This study presents a three-dimensional, steady-state, single-phase AEMFC model. It takes into consideration a series of nonlinear partial differential equations that reflect the underlying mass, momentum, species, electronic charge, and protonic charge transport equations, all of which are linked to electrochemical processes. The governing equations are described in detail below.

2.2.1. Conservation of Mass

For GDL and CL in both the anode and the cathode sides, mass conservation is stated as follows [23]:
· ρ u = S m a s s
where u is the velocity and ρ is the density of the gas mixture that is calculated using [23]:
ρ = P M m i x R T
in which P , T , and R represent operating pressure, operating temperature, and the universal gas constant, respectively. M is the molecular weight of the mixture which is calculated by:
M m i x = i ω i M i 1
where ω i denotes the mass fraction for each component in the gas mixture.
The source terms for all conservation equations are represented by S and are listed in Table 1.

2.2.2. Conservation of Momentum

To find the pressure and velocity field in the open channels, compressible Navier–Stokes equations are utilized:
ρ u · u = p + μ 2 u .
The Brinkman Equations interface is used to calculate the velocity field and pressure in the porous media [30]:
ρ u ý u = p + μ 2 u μ K u
in which p is the pressure, and μ is the dynamic viscosity of the gas mixtures that is determined using the following equation:
μ m i x = i x i μ i j x j γ i j .
where x i   and   x j . are the mole fractions of species i and j, and function γ i j is given as:
γ i j = 1 + μ i μ j 1 / 2 M i M j 1 / 4 2 8 1 + M i M j 0.5
The last term in Equation (7) accounts for the viscous friction between the fluid and the solid phase of the domain, where K is the permeability of the porous media. A no-slip boundary condition is utilized over the walls of the anode and the cathode flow fields.

2.2.3. Conservation of Species

The Maxwell–Stefan equation governs the advection and diffusion transport of H 2 and H 2 O in the anode side and O 2 and H 2 O in the cathode side [31]:
ρ ω i j = 1 N D i j x j + x j ω j p p + ρ ω i u = S i
where S is the reaction rate and i indicates the species.   D i j is the binary diffusion coefficient of species i and j which is defined by:
D i j = 3.16 × 10 8 T 1.75 P ϑ i 3 + ϑ j 3 2 1 M i + 1 M j 1 / 2
where the temperature is expressed by T, and the diffusion volume of species i is represented by ϑ i . Mass fraction, ω i , is defined as:
ω i = x i M m i x M i
in which x denotes the molar fraction of each species. The Bruggeman correction is also used to determine the species diffusion coefficients in the GDLs and CLs [26]:
D i j G D L ,   C L = D i j ε G D L ,   C L 1.5
where ε is the porosity.

2.2.4. Conservation of Charge

Electrons are the charge carriers in GDLs and CLs. Charge conservation is expressed using Ohm’s law as [26]:
· σ s ϕ s = S ϕ s
where σ s denotes the effective conductivity of the medium, and ϕ s . represents the electric potential. Charge carriers in the membrane are hydroxyl ions. To keep the ionic current flowing in the same direction as the electrons, a charge conservation equation is also used in the membrane [26]:
· σ m ϕ m = S ϕ m
where σ m . is the effective conductivity of the membrane and ϕ m is the ionic potential.

2.3. Reaction Kinetics

To describe the charge current density, Butler–Volmer kinetics are used. For HOR and ORR reactions in anode and cathode electrodes, the local current density expressions that resulted from the Butler–Volmer equation based on the mass action law are adopted [25]:
i a = i 0 , a r e f P H 2 P H 2 r e f 0.5 e x p α a , a 2 F R T η a e x p α c , a 2 F R T η a
i c = i 0 , c r e f P O 2 P O 2 r e f P H 2 O P H 2 O r e f e x p α a , c 4 F R T η c + e x p α c , c 4 F R T η c .
where P H 2 ,   P O 2 , and P H 2 O are the local partial pressures, and P H 2 r e f , P O 2 r e f , and P H 2 O r e f are the partial pressures at the inlet, for hydrogen, oxygen, and water, respectively. α a   and α c are the charge transfer coefficients whose values are listed in Table 2. F is the Faraday’s constant. i 0 , a r e f ,   i 0 , c r e f are the reference exchange current densities at the anode and cathode, respectively, and determined via Arrhenius type relation, which is a function of temperature [25]:
i 0 , a r e f = i 0 , a e x p 1400 1 353.15 1 T
i 0 , c r e f = i 0 , c e x p 7900 1 353.15 1 T
In reaction equations, η a ,   η c . are the activation overpotentials in anode and cathode, respectively, defined as:
η a = ϕ s ϕ m
η c = ϕ s ϕ m V r e v
where reversible cell voltage, V r e v , is described by the Nernst equation as:
V r e v = V 0 + R T 2 F ln P H 2 r e f P O 2 r e f 1 / 2
where V 0 is the open-circuit voltage and determined as:
V 0 = 1.229 0.846 × 10 3 T 298.15
The anode is the ground electrode and the cathode is the potential electrode. Table 2 lists the numerical values used in the model for various parameters as well as the operating conditions.

2.4. Boundary Conditions

This model describes the hydrogen and oxygen-powered unit. The anode is supplied with a humidified hydrogen gas, which contains two components: hydrogen and water vapor. The cathode receives humidified oxygen, which consists of two components: oxygen and water vapor. The fuel cell is tested at 110 °C with both hydrogen and oxygen fully humidified. Partial pressure for water vapor at the inlets is assumed to be equal to saturation vapor pressure at the same temperature [22]. A constant volumetric flow rate of 1 slpm is used at the inlet for both the anode and the cathode channels, while a 1.5 barg backpressure is set at the outlets similar to the experimental study.
The mole fractions are provided in the channel inputs and are defined based on the relative humidity of the reactants at the inlets [24]:
x H 2 O , a i n = R H a P s a t P r e f   ,         x H 2 , a i n = 1 R H a P s a t P r e f
x H 2 O , c i n = R H c P s a t P r e f   ,         x O 2 , c i n = 1 R H c P s a t P r e f
where P s a t is the saturation pressure of water and R H a , and R H c are the relative humidities for the inlet streams in the anode and the cathode, respectively. The boundary conditions at the walls of the gas channels and electrodes are assumed to be zero mass flux:
n · ρ D i j ω i = 0
The cathode GDL boundaries that face the flow pattern ribs are set to the cell potential, whereas the anode GDL boundaries are set to zero electrical potential. All other exterior boundaries are electrically isolating.

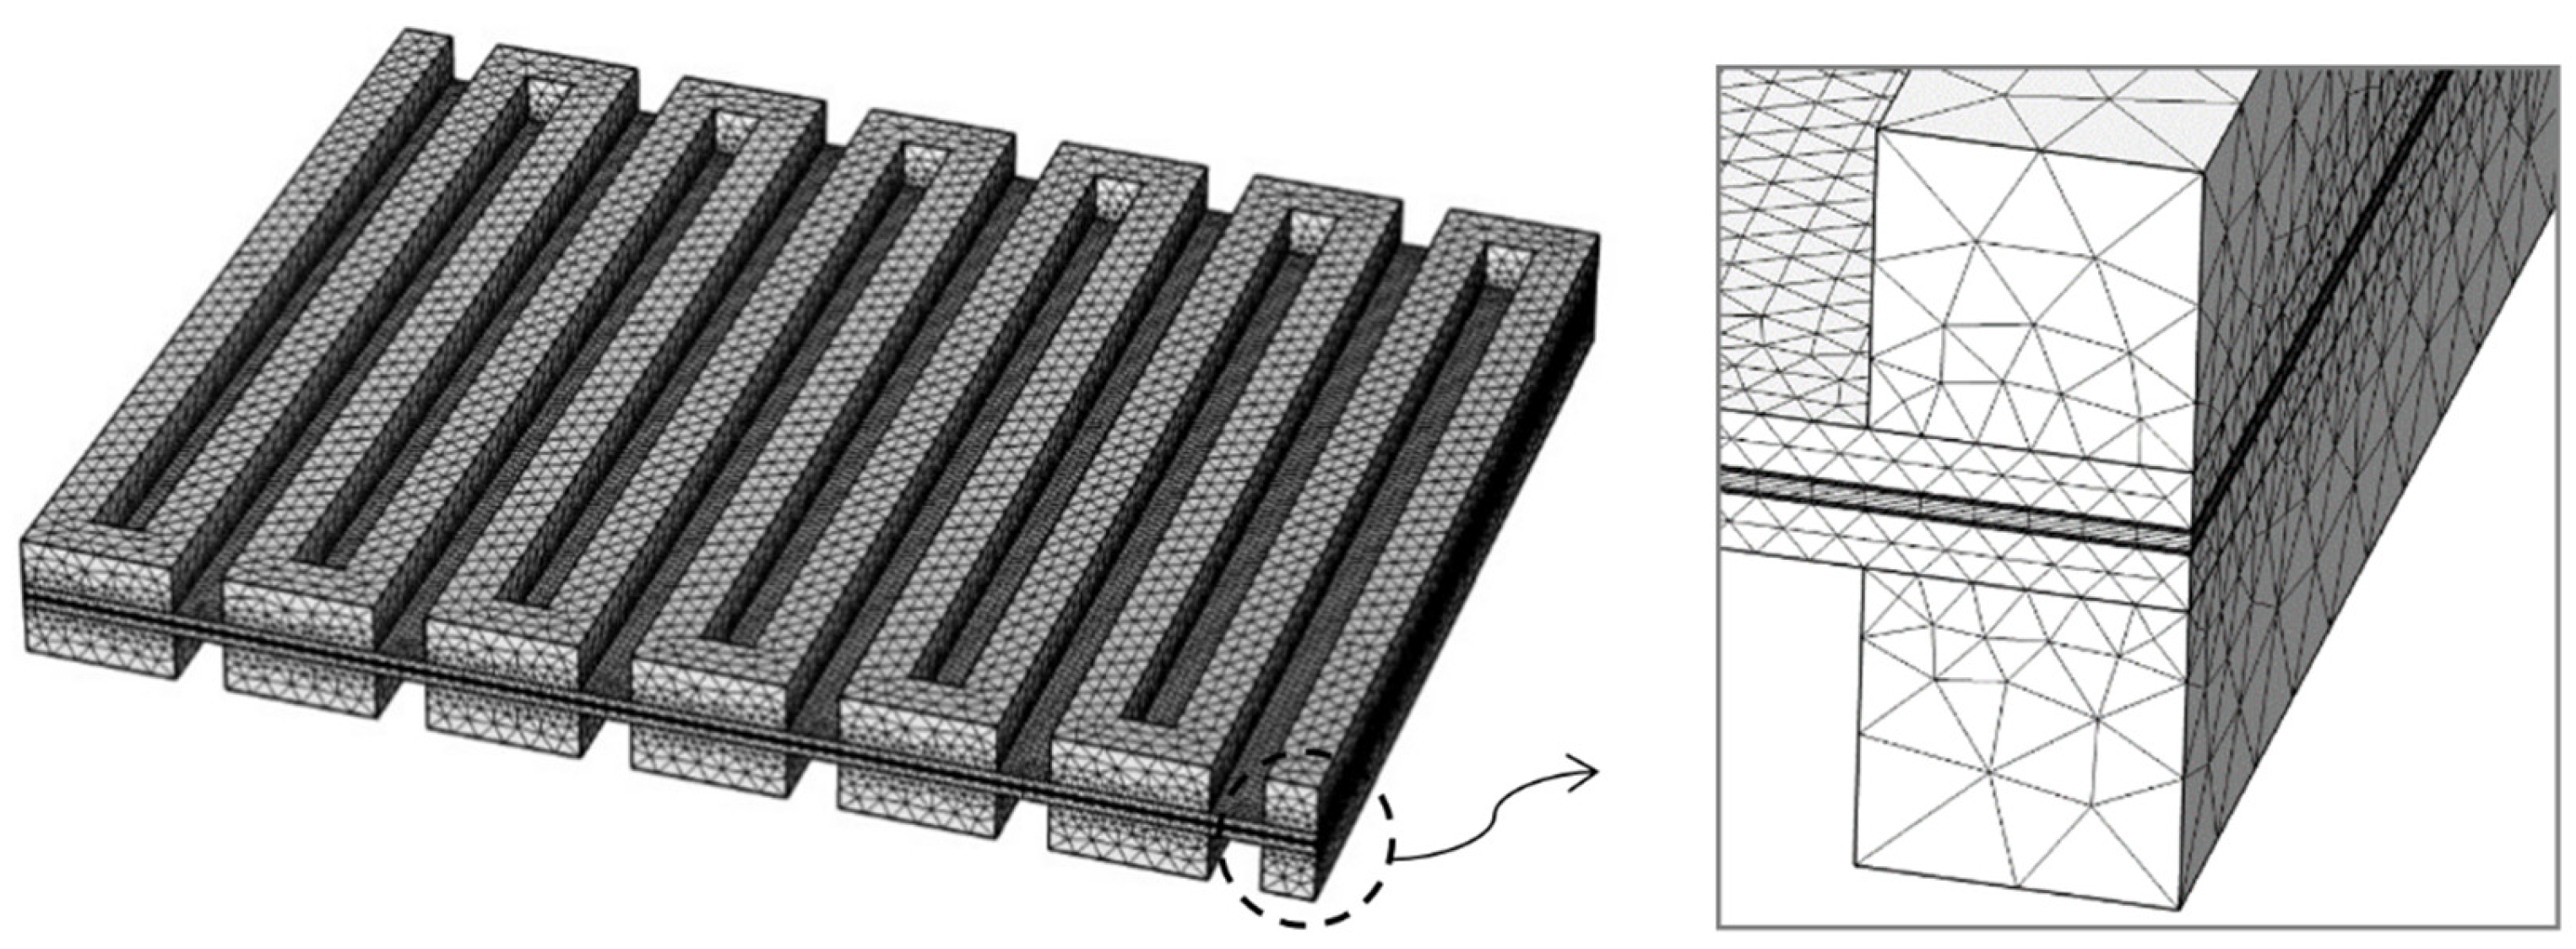
2.5. Numerical Approach

COMSOL Multiphysics and its Hydrogen Fuel Cell module were utilized to solve the coupled governing partial differential equations (PDEs) associated with Brinkman, Maxwell-Stefan, and Butler–Volmer equations with the corresponding initial and boundary conditions. This program provides a robust interactive environment for solving PDEs using the Finite Element Method (FEM). A total of 10 unknown variables for the model are the velocity and pressure at the anode and cathode sides, hydrogen and water vapor mole fraction at the anode side, oxygen and water vapor mole fractions at the cathode side, and electric and electrolyte potentials.
The grid network utilized in this model is depicted in Figure 3. It comprises a structured and unstructured mesh with both hexahedral and tetrahedral element types. The model achieves mesh independency requirements with 211,736 elements in total. The solution is provided using a fully-coupled PARDISO solver based on an automatic damped Newton method with a relative tolerance of 10−6.

3. Results and Discussion

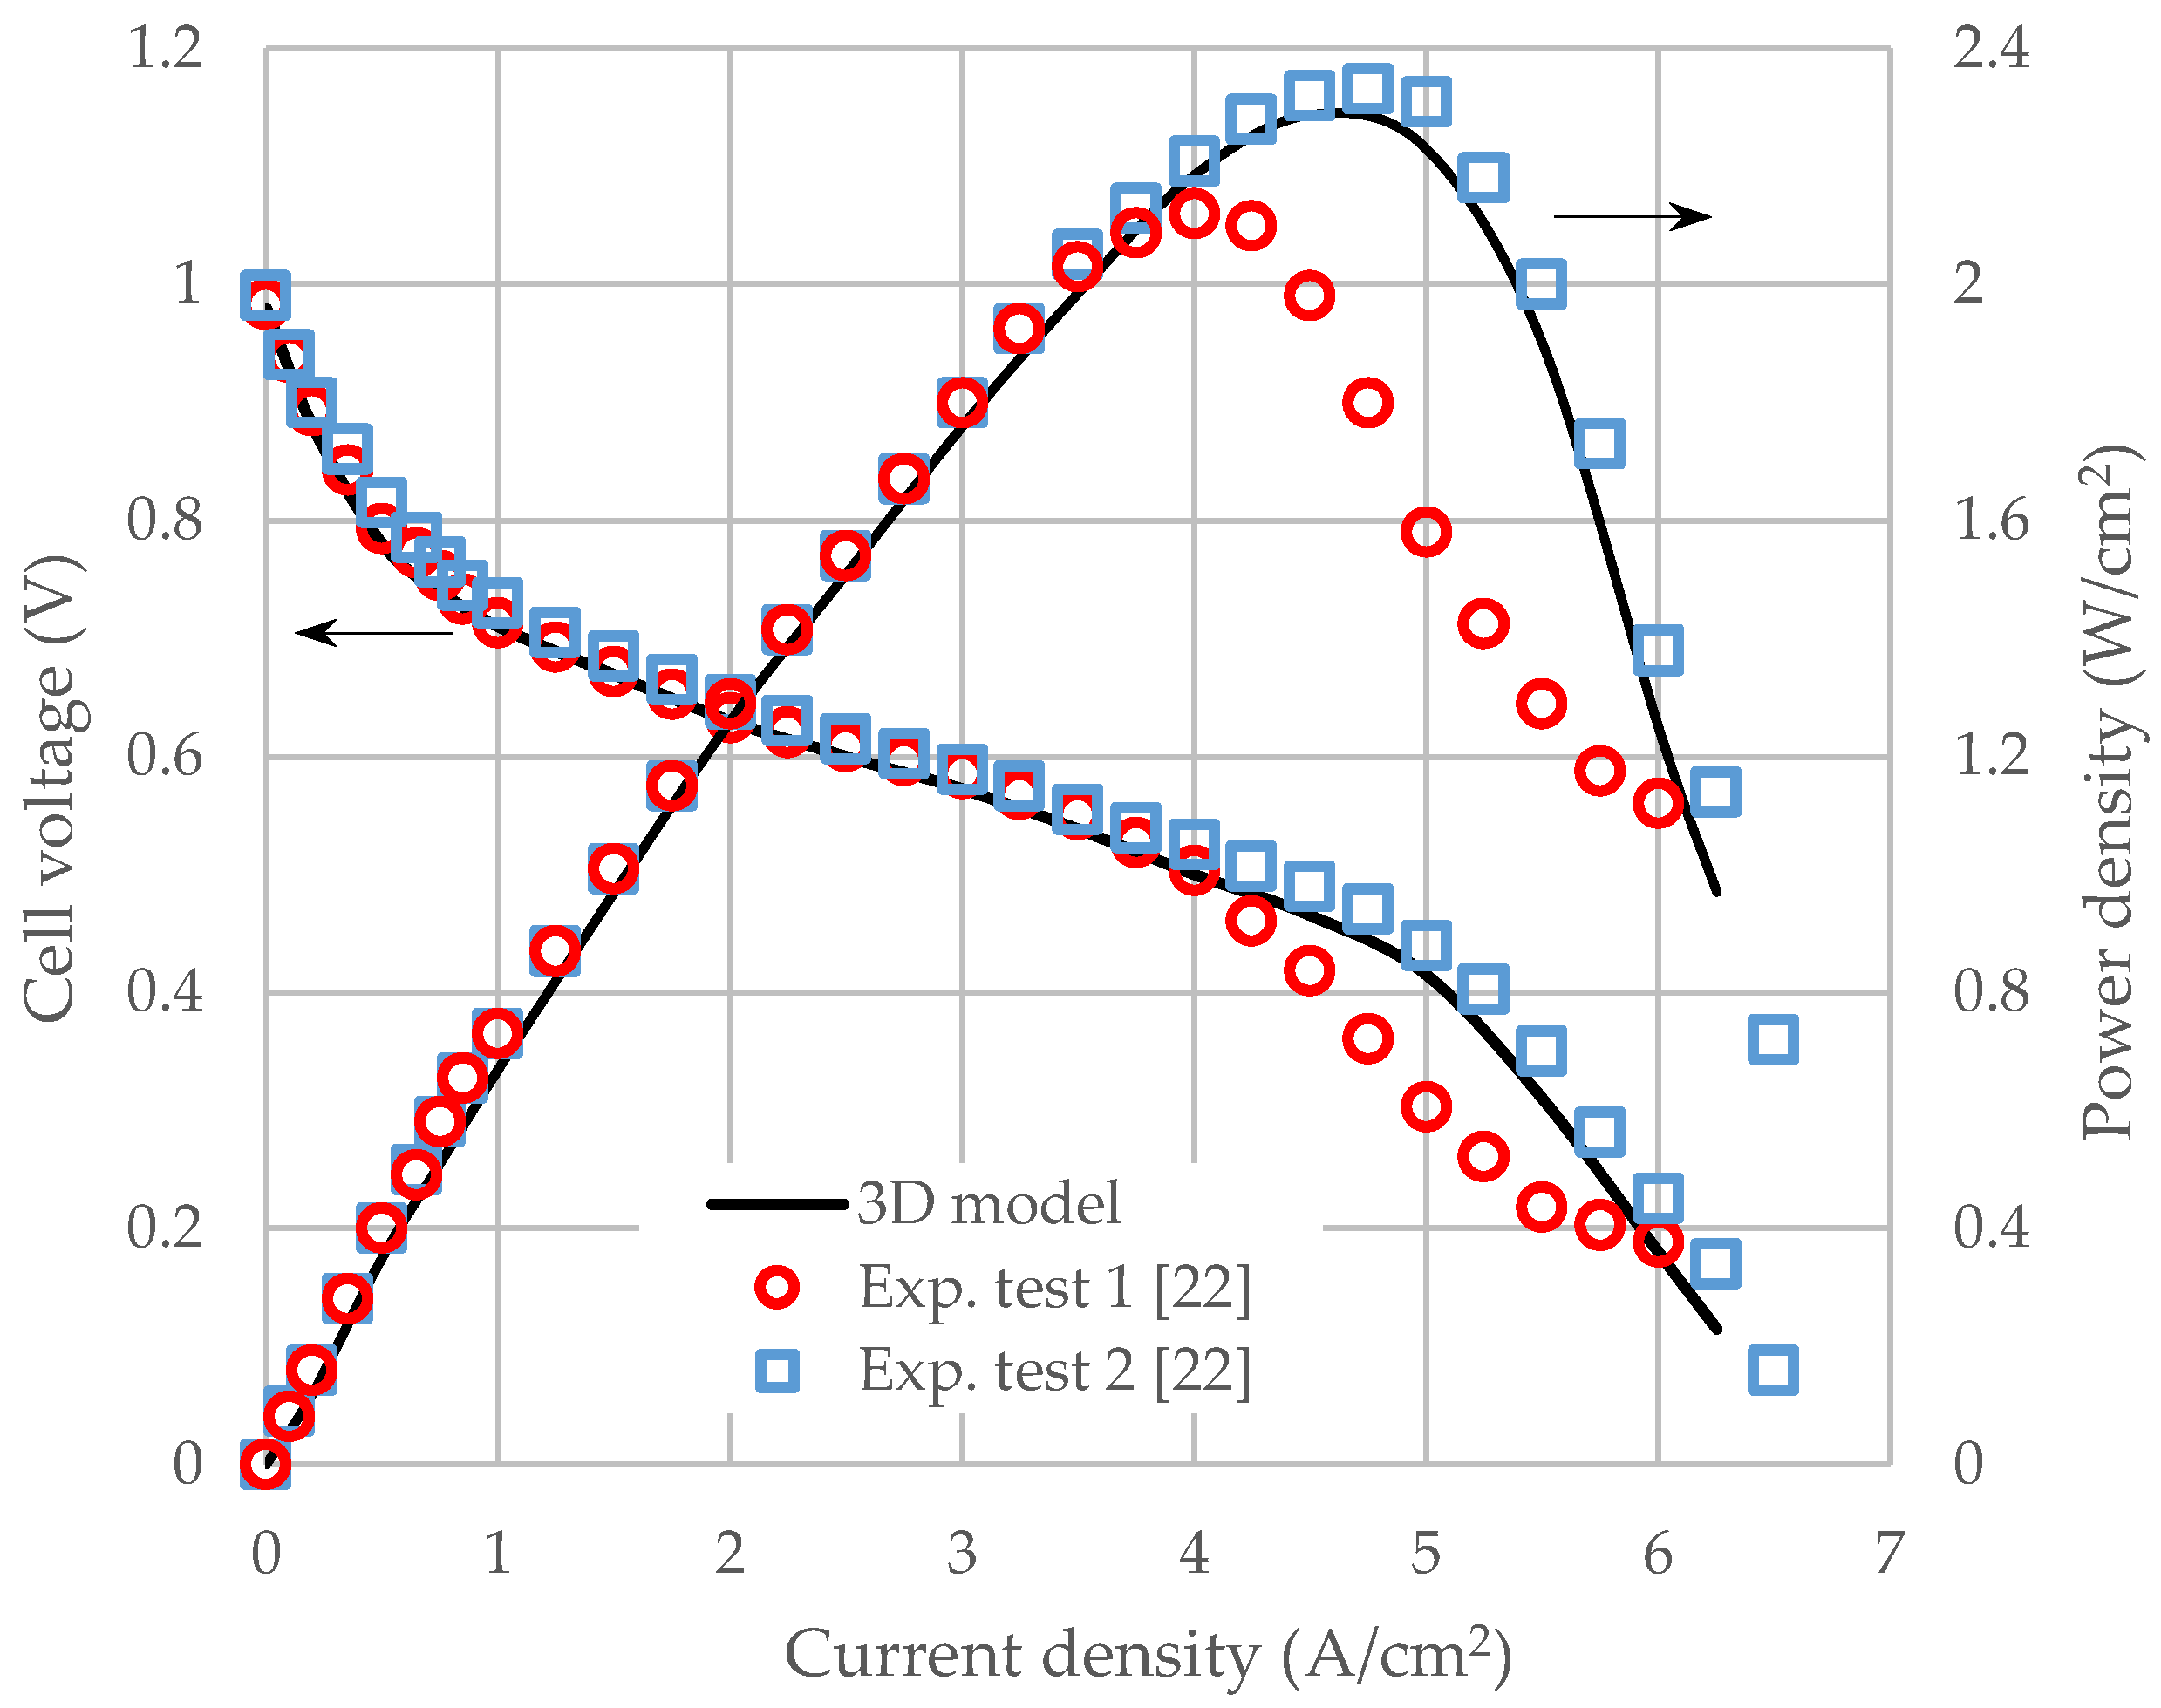
3.1. Model Validation

Simulations are performed for the voltage range of 1 to 0.1 V in 0.05 V increments. The cell voltage is delivered to the cathode current collector as a boundary condition. Polarization curves were generated by gradually lowering the fuel cell voltage and calculating the average current density. The average current density was obtained by integrating the output local current over the entire surface of the CL and dividing it by the total active area of the fuel cell. Figure 4 shows the voltage and power production as a function of current density. The figure demonstrates the potential of operating AEMFCs at high temperatures by predicting a maximum output power of about 2.3 W/cm2 and a limiting current density of around 6.5 A/cm2. As a first step, the results of the simulation are checked against those of the experimental study to validate the model. The polarization and power density curves generated by the model are compared to those given in [22]. The black lines are the resulting curves from the numerical modeling in the present study, while the red circles and blue squares represent the results of the tests performed in the reference experimental study. The polarization curve exhibits a satisfactory adherence of the 3D model to all potential losses present in the actual cell, from activation to ohmic and concentration overpotentials. As seen in the figure, a good agreement is reached with the second test performed in [22], with small disparities specifically at high current densities.

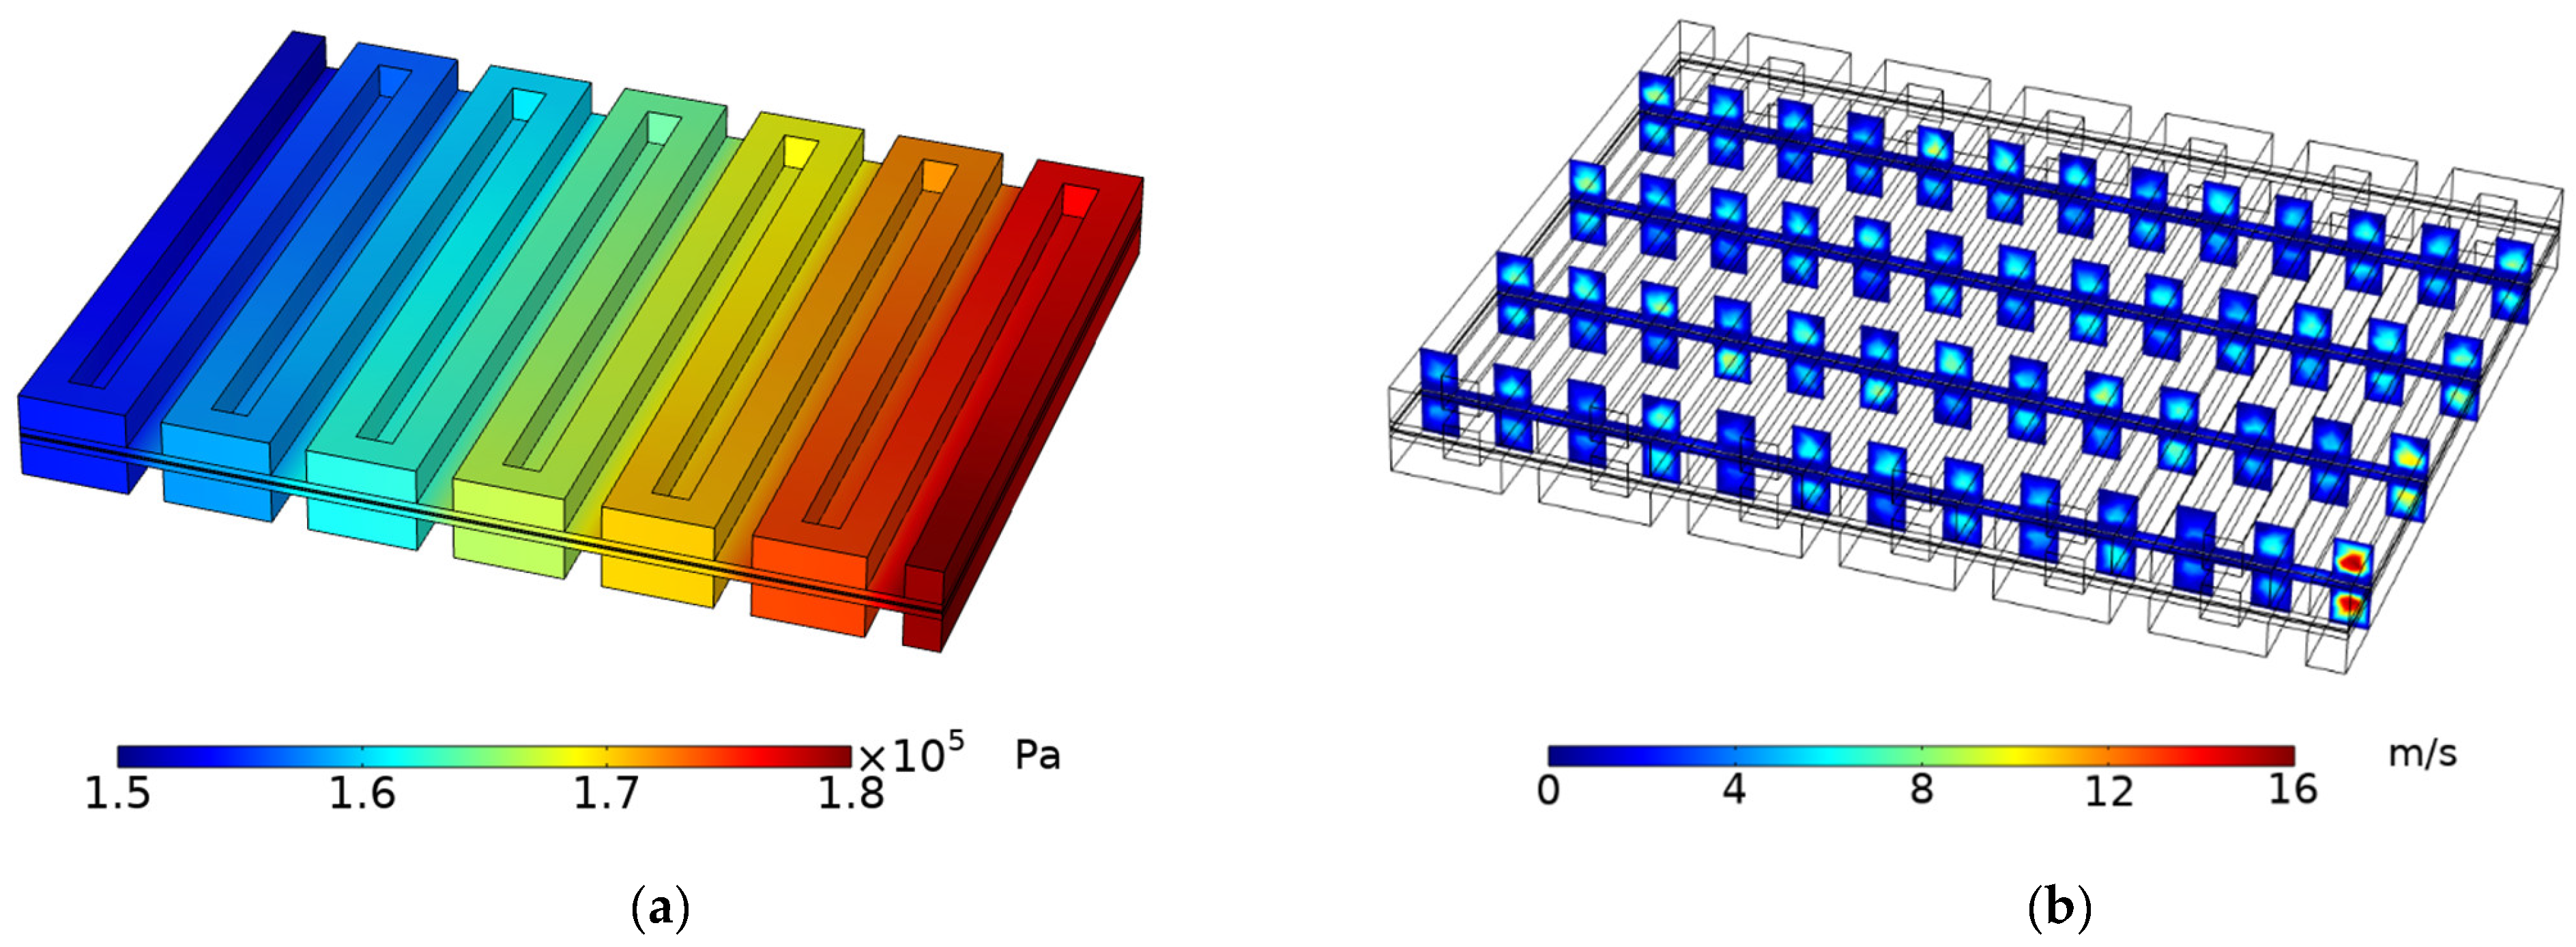
3.2. Pressure and Velocity Distribution

The fluid flow is driven by the pressure difference between the inlet and exit of the channel. This difference is largely determined by the degree of friction that the fluid experiences against the channel walls. The pressure distribution in the fuel cell at 0.6 V is shown in Figure 5a. The maximum pressure is measured at the inlet, and it gradually falls along the channel until it reaches the minimum level at the outlet. This is critical because it implies that the fuel is delivered to the catalyst layers at different pressures across the cell surface area. Since the mass flow rate for both channels is equal, the pressure variation appears identical as well.
The velocity profile is also illustrated in four separate y-z planes throughout the model in Figure 5b. As expected, the magnitude of the velocity is higher in the gas channels compared to porous domains where the transport of species slows down. Due to the no-slip boundary condition, the velocity reaches the maximum values right at the center of the channels.

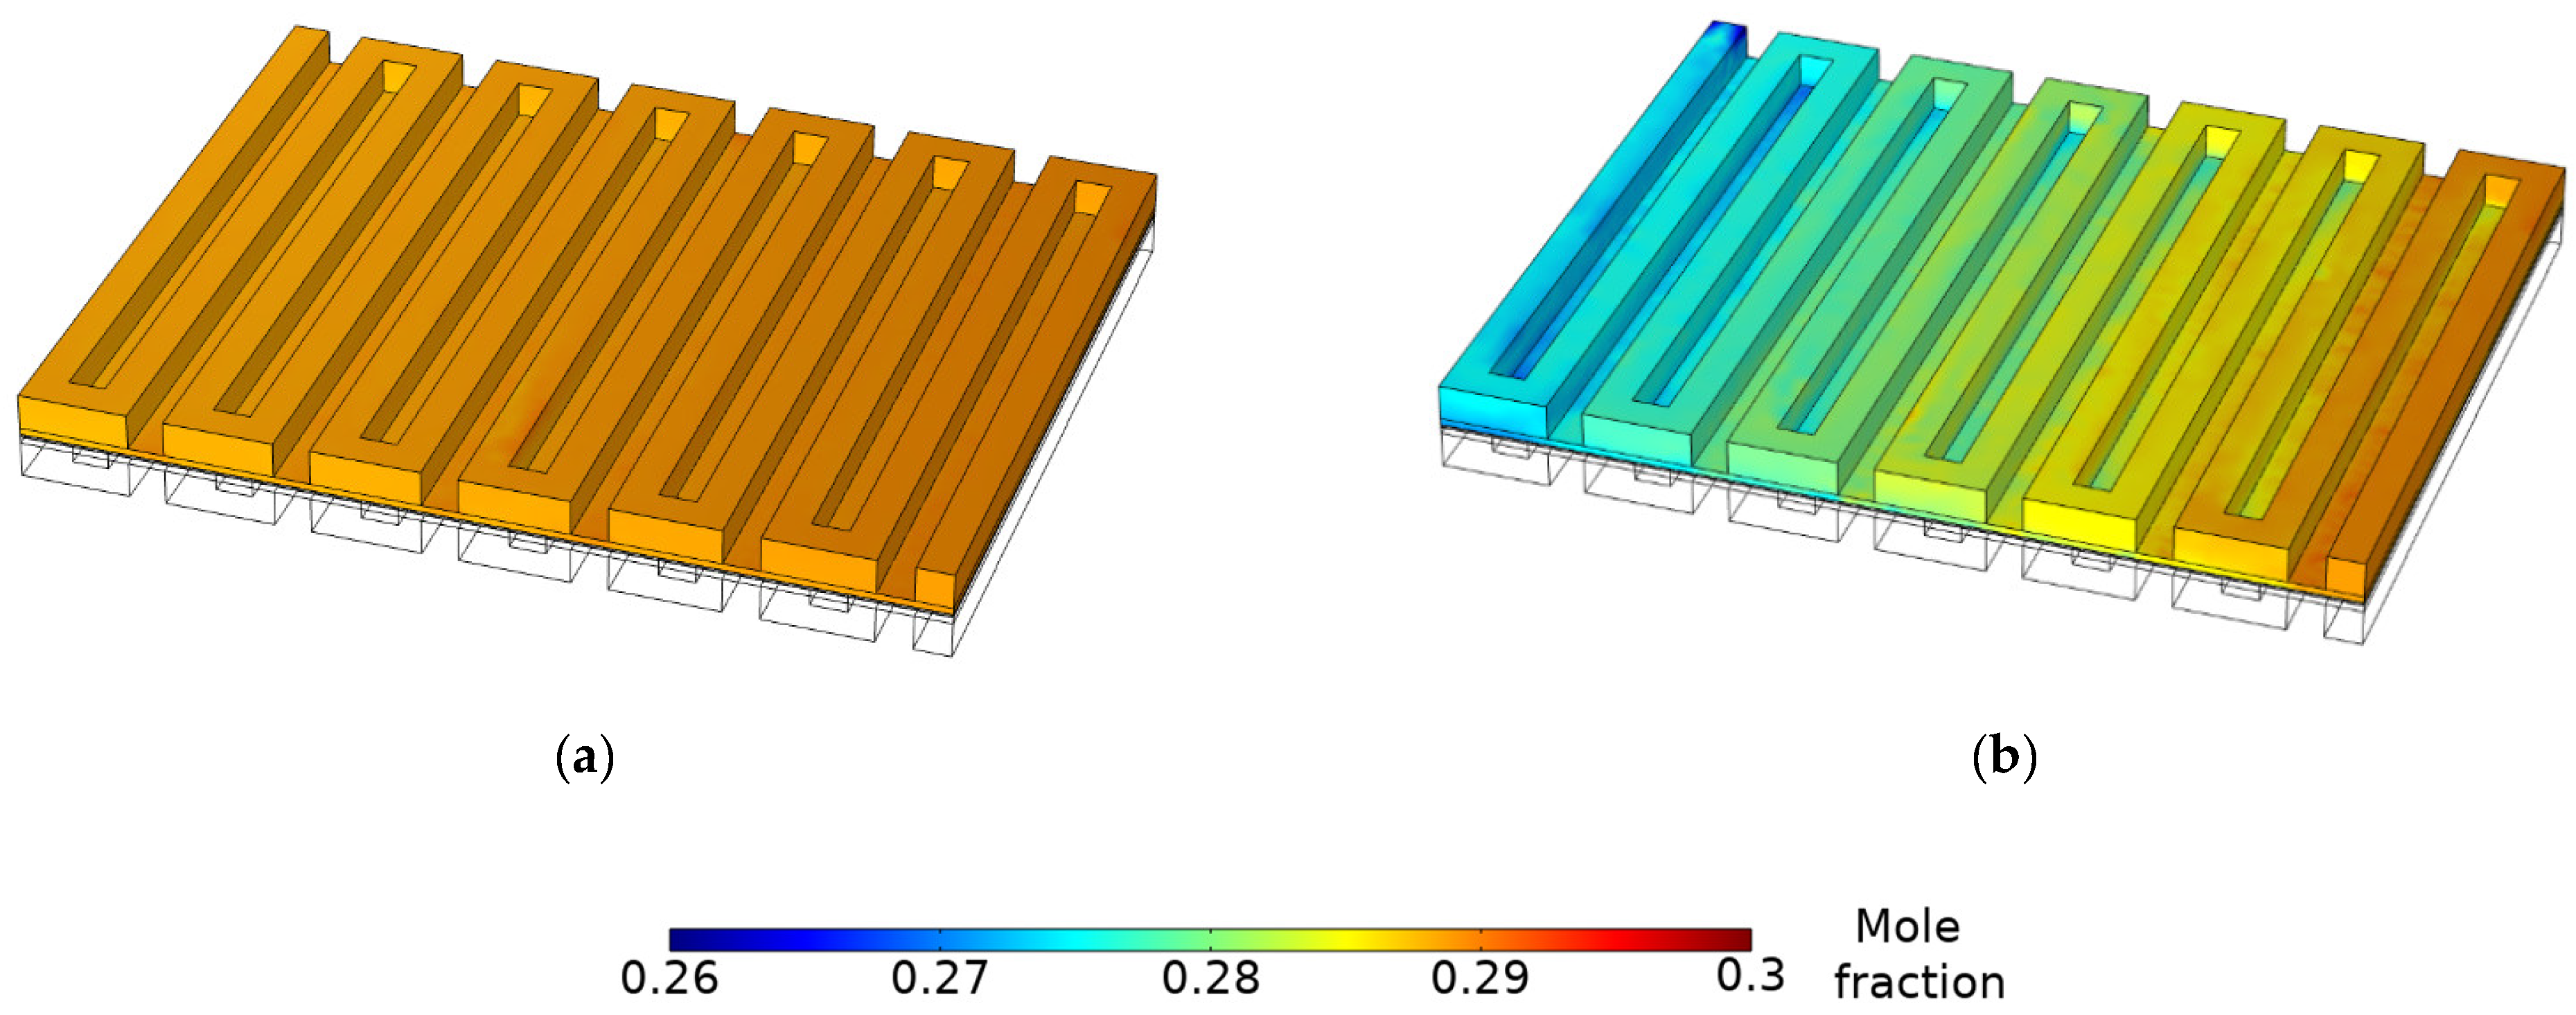
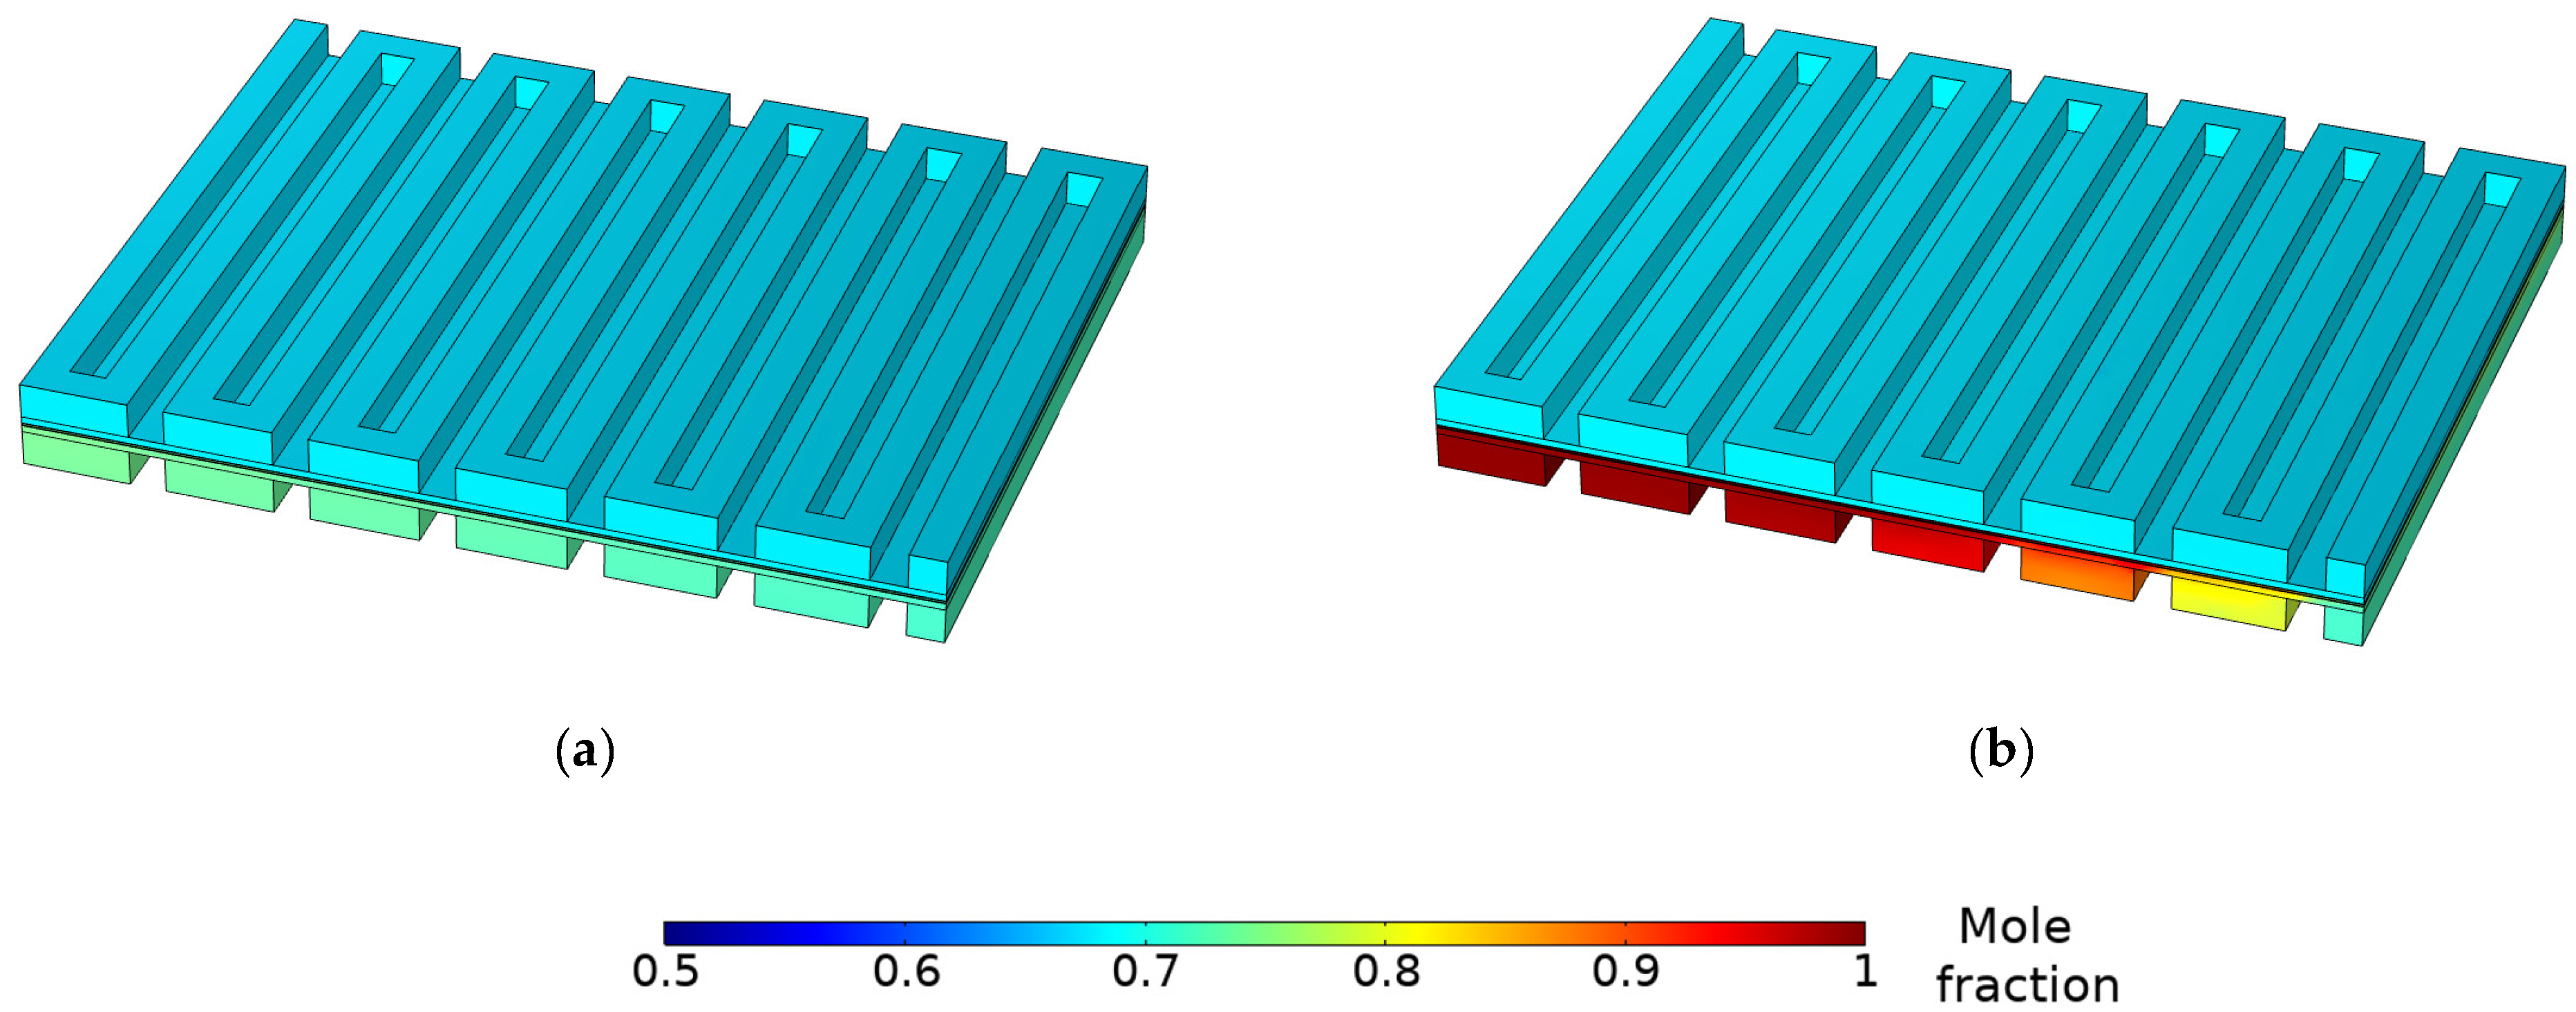
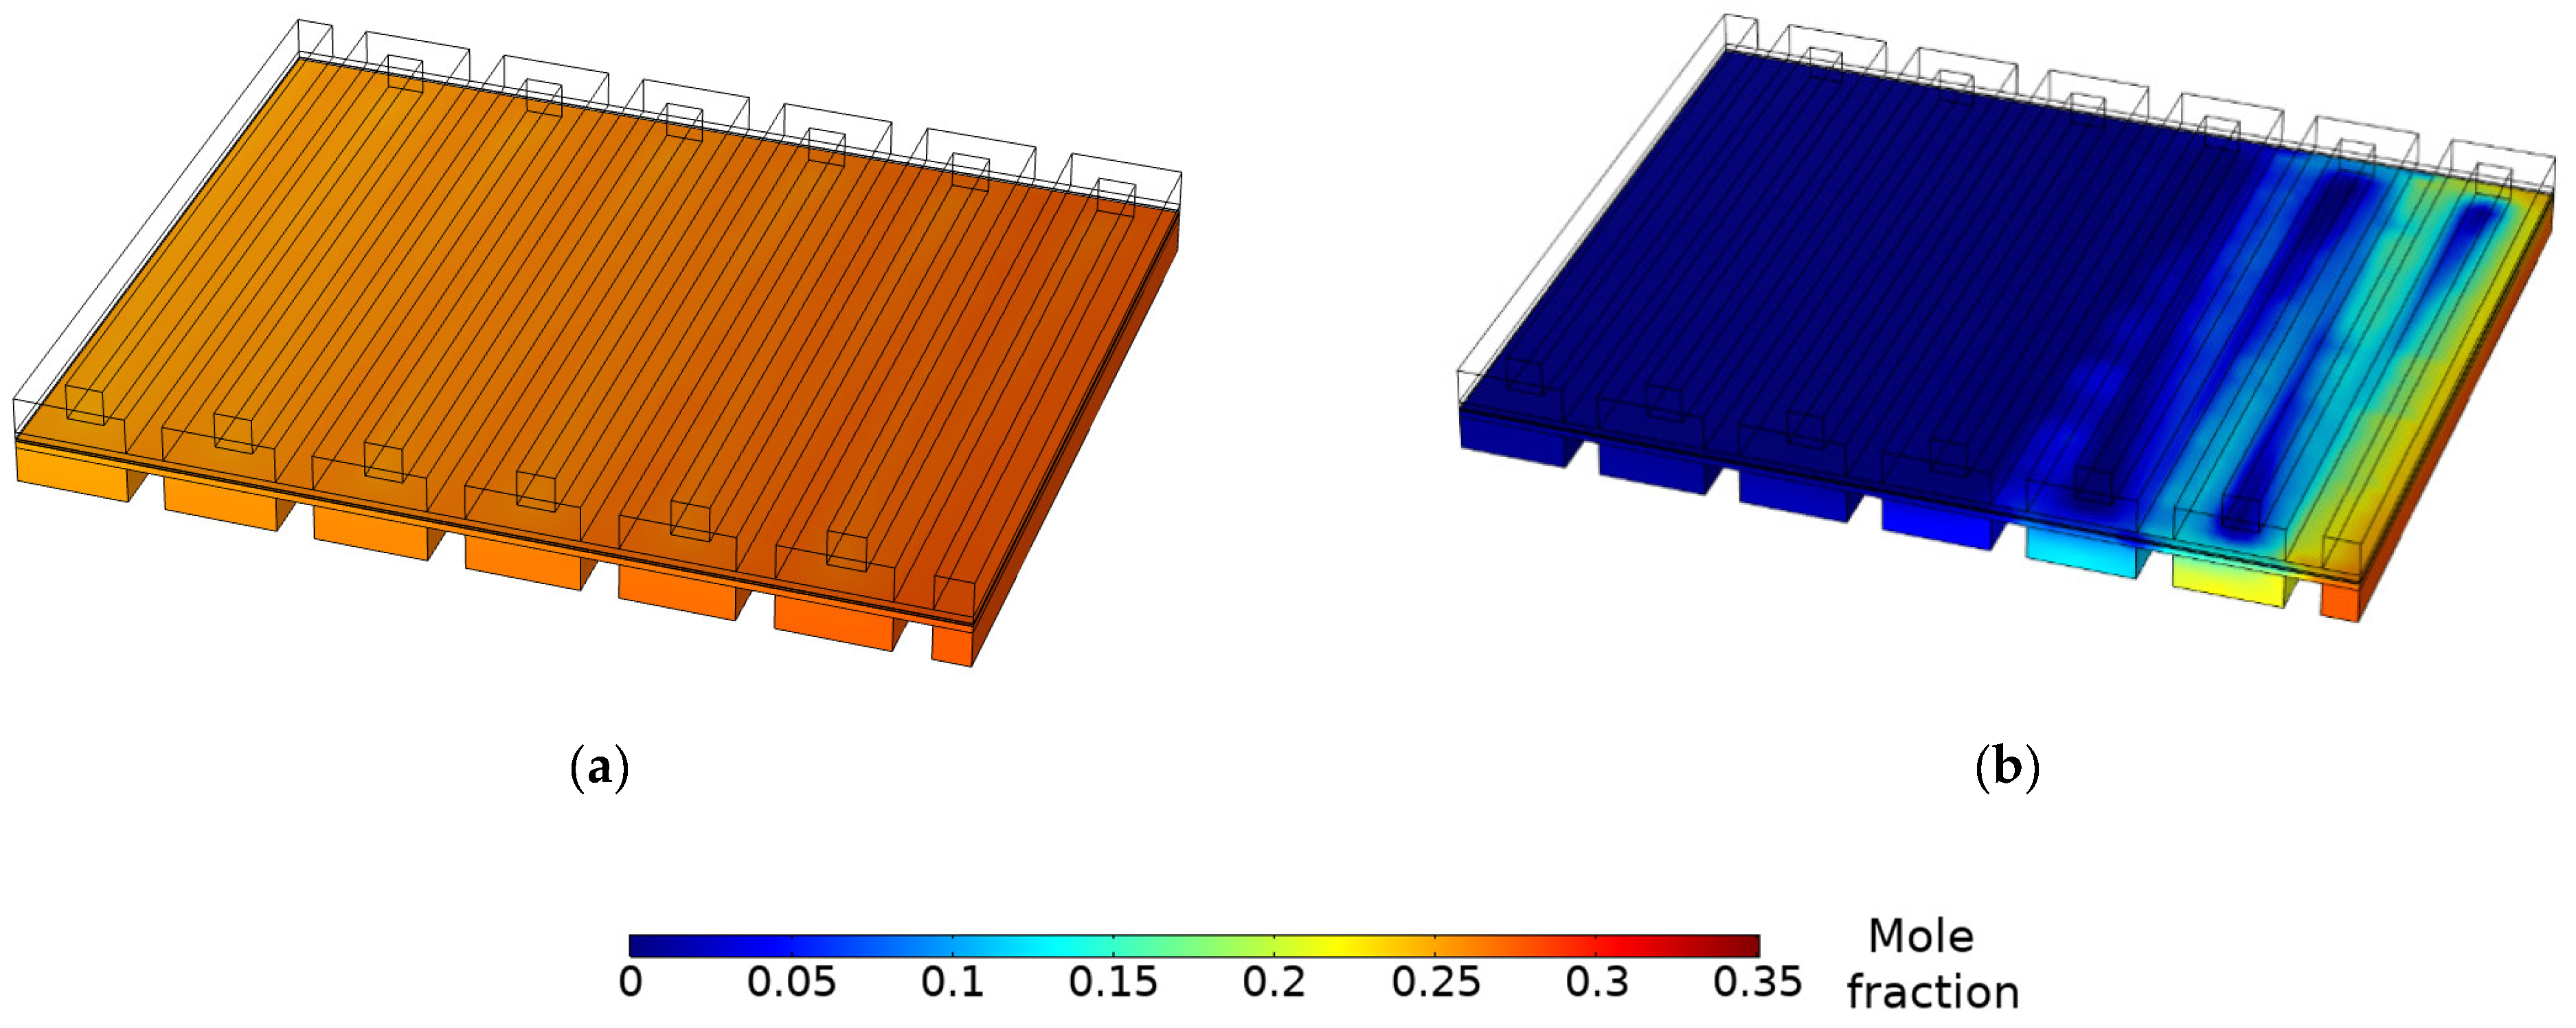
3.3. Species Concentration Distribution

The local distributions of species are important since they directly affect the local current densities for both anode and cathode sides. Figure 6 illustrates the hydrogen concentration distribution from the inlet to the exit along the anode flow field for the cell voltage of 0.75 V (representing high cell voltage) and 0.25 V (representing low cell voltage). According to Equation (24), the hydrogen mole fraction at the inlet is about 0.29. The hydrogen concentration steadily falls along the direction of flow in the channel due to reactant consumption upon electrochemical reactions. This results in low hydrogen concentration at the exit, bringing about local reactant starvation and poor fuel cell performance. The lower the voltage, the higher the rate of electrochemical reactions and the higher the non-uniformity in the distribution of hydrogen. As can be seen in the figure, the hydrogen concentration reaches zero at the exit section of the anode for the cell voltage of 0.25 V.
Figure 7 demonstrates the oxygen mole fractions in the cathode for the same considered voltage levels. According to Equation (25), the oxygen mole fraction at the inlet is about 0.29. The oxygen distribution is more homogeneous than the hydrogen distribution in the anode. In comparison to the inlet, the oxygen mole fraction is lower at the end of the flow channel, reaching 0.26. Based on this figure, even though the cathode requires more oxygen as the cell current density increases, its concentration available in the cell is sufficient for even high current densities.
In AEMFCs, water control is essential. Water is a product of the reaction in the anode, and the rate of this water production is two times that of water consumption in the cathode. This is why the anode is more susceptible to flooding, while the cathode is more prone to drying out, especially at high current density operations [1,32,33]. Water buildup in the cell results in lower hydrogen partial pressures on the anode and reduces the cell performance. Therefore, better knowledge of water transport in AEMFC and how to overcome the practical mass transport limitations of this technology is required.
The spatial distributions of water within the anode and cathode in response to the same voltage levels are depicted in Figure 8. The RH is at its highest in both the anode and the cathode. According to Equations (24) and (25), the water vapor mole fraction at the inlet is about 0.71 for both the anode and the cathode. While a higher operating temperature enhances the kinetics of electrochemical reactions, a higher dew point temperature increases the quantity of water involved in the electrochemical process in the cathode, improving cell performance substantially. The ORR on the cathode side demands additional water consumption electrochemically at high current densities. However, for the two simulated cell voltages, minor differences can be noticed in the water distribution on the cathode side. Thus, it may be inferred that fully humidified oxygen in the cathode inlet is optimal for working even at high current densities, and the back diffusion of water from the anode side is not necessary.
While on the cathode the water distribution is identical for two cell voltage cases, on the anode, the water mole fraction is not uniform and increases along the channel. This result is expected since water is continuously being generated along the flow. The water mole fraction rises owing to an increase in the rate of water production at the anode at high current loads. Excess water will accumulate if the rate of removal is slower than that of generation and drag. This obstructs hydrogen transport to the reaction sites by clogging the gas transport channels and by obstructing the pores of the GDL and CL. Although supplying large flow rates of hydrogen gas to the anode may solve this problem, it is not a practical or cost-effective option [32]. As a result, water must be removed either continuously or at regular intervals. Back diffusion is another way for the anode to lose water. However, back diffusion was shown to move at a very slow pace and to have very little effect on cell performance [1,34]. Therefore, the remaining key parameter is the inlet RH. Since the water consumption and production rates depend on the operating current, the RH should be adjusted accordingly [35]. In an experiment by Truong et al. [34], it is shown that the performance of AEMFC is quite sensitive to inlet gas humidity. It is observed that as the cell temperature increases, the optimum RHa decreases. This value was found to be 1, 0.89, and 0.80, respectively, as the cell operates at 60 °C, 65 °C, and 70 °C. However, on the cathode side, they observed the opposite: the higher the dew point temperature, the higher the water content and the better the cell performance. Therefore, a low RHa is necessary, since water production is very fast at high current densities. This conclusion is consistent with the results of the study conducted by Zhang et al. [35], in which they suggest keeping the RHc at a constant value and reducing the RHa gradually from 1 to 0.2 as the current load increases to prevent flooding in the cell.

3.4. Current Density Distribution

AEMFC should preferably be operated with homogenous local current density distributions over the electrode surface. Non-uniform current distributions can lead to poor reactant and catalyst utilization, as well as a reduction in overall cell performance. Local current densities in porous electrodes are influenced by ionic and electronic potentials, and by local reactant concentrations. Due to changes in gas composition and water, the cell performance varies spatially throughout the channel, requiring a delicate balance of hydration and reactant distribution.
To demonstrate the intensification of non-uniformity in the local current density distribution, four different cell voltage values are selected and the resulting local current density distributions on the anode CL are shown in Figure 9. The reason for selecting these specific voltages is that the variation in the local current density distribution throughout the flow channels starts to appear at 0.5 V. Based on this figure and the polarization curve presented in Figure 4, the average current density on the surface is around 4 A/cm2 at this cell voltage. Owing to the changes in the consumption rates of the reactants, non-uniformities in the local current density distribution grow as the operating voltage drops. At a cell voltage of 0.2 V, the average current density on the surface is around 6 A/cm2, while local current densities reach 14 A/cm2 at flow inlet regions. Current density drops continuously in the gas flow direction. The anodic reaction is confined to a small area near the inlets at high current densities. Sensitivity studies related to local current distribution demonstrate that a large portion of the channel close to the exit is rendered inactive due to water accumulation in that region. This agrees with the conclusions reached by the numerical model developed by Gerhardt et al. [27]. In their study, low inlet RH caused the channels near the inlet to have low current values because of dry-out, and high inlet RH caused a low current to be seen near the outlet due to the flooding effect, indicating that the local current changes according to the humidification of the inlet gas. Therefore, the way reactants are distributed along flow channels is found to be closely linked to the current density profile. Moreover, the current density is higher under the ribs than under the channels because of ohmic losses in the GDLs. The current has been extracted over the ribs and, thus, the current is higher in these regions.

3.5. Effect of Operating Temperature

The ionic conductivity and electrochemical kinetics are the key factors in fuel cell performance. These parameters highly depend on the operating conditions, especially the temperature. Zhegur-Khais et al. [36] have measured the ionic conductivity of LDPE-BTMA AEM for different temperatures. The membrane ionic conductivities are reported approximately as 130, 175, 225, and 290 mScm−1 at 40, 60, 80, and 110 °C, respectively. These operating temperatures and ionic conductivities are taken as the reference values and given as inputs in the model for sensitivity analyses. Figure 10 shows the impact of changing the operating temperature on the fuel cell performance while keeping other parameters the same as the initial conditions. As can be observed from the figure, decreasing the cell temperature shifts the performance curve downwards. This change can be seen in the activation region where the slope of the curve increases as the cell temperature decreases. Activation loss is primarily driven by the activation barrier of the chemical reactions based on the reaction kinetics presented in Section 2.3. Higher cell temperature results in enhanced electrochemical kinetics, which in turn reduces activation loss. Ohmic losses, which constitute the linear portion of the polarization curves, are predominantly caused by membrane resistance. This portion is impacted by the ionic conductivity of the membrane, which improves with higher cell temperature and has a favorable influence on cell performance.
The cell voltage for the current density of 4 Acm−2 is calculated as 0.274, 0.37, 0.448, and 0.505 V for ionic conductivity at 130, 175, 225, and 290 mScm−1, respectively. These ionic conductivities are measured for cell temperatures at 40, 60, 80, and 110 °C, respectively. The voltage rises 35% when the working temperature is raised from 40 °C to 60 °C, but only 13% when the temperature is raised from 80 °C to 110 °C. A similar effect can be seen in the activation polarization region where the cell voltage for the current density of 0.5 Acm−2 is calculated as 0.715, 0.747, 0.77, and 0.782 V for the cell temperatures of 40, 60, 80, and 110 °C, respectively. This demonstrates that the influence of temperature on cell performance is more significant at lower temperatures than it is at higher temperatures.

3.6. Effect of Flow Rate

Increasing the inlet flow rate in both the anode and the cathode generally leads to a modest rise in the average current density throughout the cell due to improved hydrogen and oxygen transport. Gases are typically provided to the electrodes at a much higher rate than what is required in the reaction to guarantee homogeneous distribution throughout the channels and to expel excess water out of the CL. The study by Omasta et al. [32] showed a 60% reduction in cell performance when the hydrogen flow rate was decreased from 1 to 0.75 slpm. Additionally, Oshiba et al. [37] examined the water management and flooding issues with solid-state alkaline fuel cells. They observed that the flooding can be mitigated by raising the anode flow rate. However, very high flow rates are not recommended for the small-sized single serpentine channels because the average gas velocity reaches extremely high values, resulting in a significant pressure gradient between the passes of the serpentine flow field [32].
Given that the AEMFC anode is supplied by a completely saturated hydrogen stream, it is necessary to examine cell performance as a function of anode flow rate. As seen in Figure 6, the hydrogen concentration decreases in the direction of the flow along the gas channel. The low hydrogen concentration on the catalyst active sites near the channel exit is induced by hydrogen consumption in the preceding sections, leaving the final section fully depleted. At the given flow rate, hydrogen depletion is significantly more evident, whereas, at a higher flow rate, the variation is expected to be less noticeable.
Figure 11a depicts the derived polarization curves at four distinct anode inlet flow rates with the cathode flow rate set to 1 slpm. Due to the low hydrogen requirement, all curves behave in the same manner at high potential levels. Since the current densities are low, hydrogen is not used substantially and its concentration is maintained relatively constant along the gas channel. As a result, diffusion effects are not apparent under these conditions. Curves begin to split at about 0.6 V, resulting in different limiting current densities for each test case. The lowest flow rate shows a considerable mass transfer constraint that starts early in the polarization curve. Water vapor gathers in the catalyst layer and GDL due to the reduced flow rate and impeding adequate hydrogen delivery to the reaction site. As a result, the inlet stream is only able to provide a fraction of the required hydrogen, resulting in a distinctive concentration overpotential zone for this flow rate. The differences between the polarization curves are most noticeable under limiting conditions. It is observed that limiting current density changes from 5.5 to 6.5, and to 7.5 Acm−2 when the flow rate changes from 0.75 to 1, and to 1.5 slpm, respectively. In general, when the flow rate rises, the variation in current density along the channel rises as well due to enhanced hydrogen transport. The increased flow rate reduces the water vapor concentration, allowing the cell to achieve larger current densities.
The cell is further tested with four different cathode flow rates while maintaining the anode flow rate constant at 1 slpm. As can be seen in Figure 11b, lowering the cathode flow rate has little impact on the performance and does not have the same drastic consequences as lowering the anode flow rate. Although minor changes may be seen across the four simulated flow rates, they are only around 2% of the produced current density. Then, it is possible to deduce that a 0.5 slpm flow is optimal for operating even at high current densities.

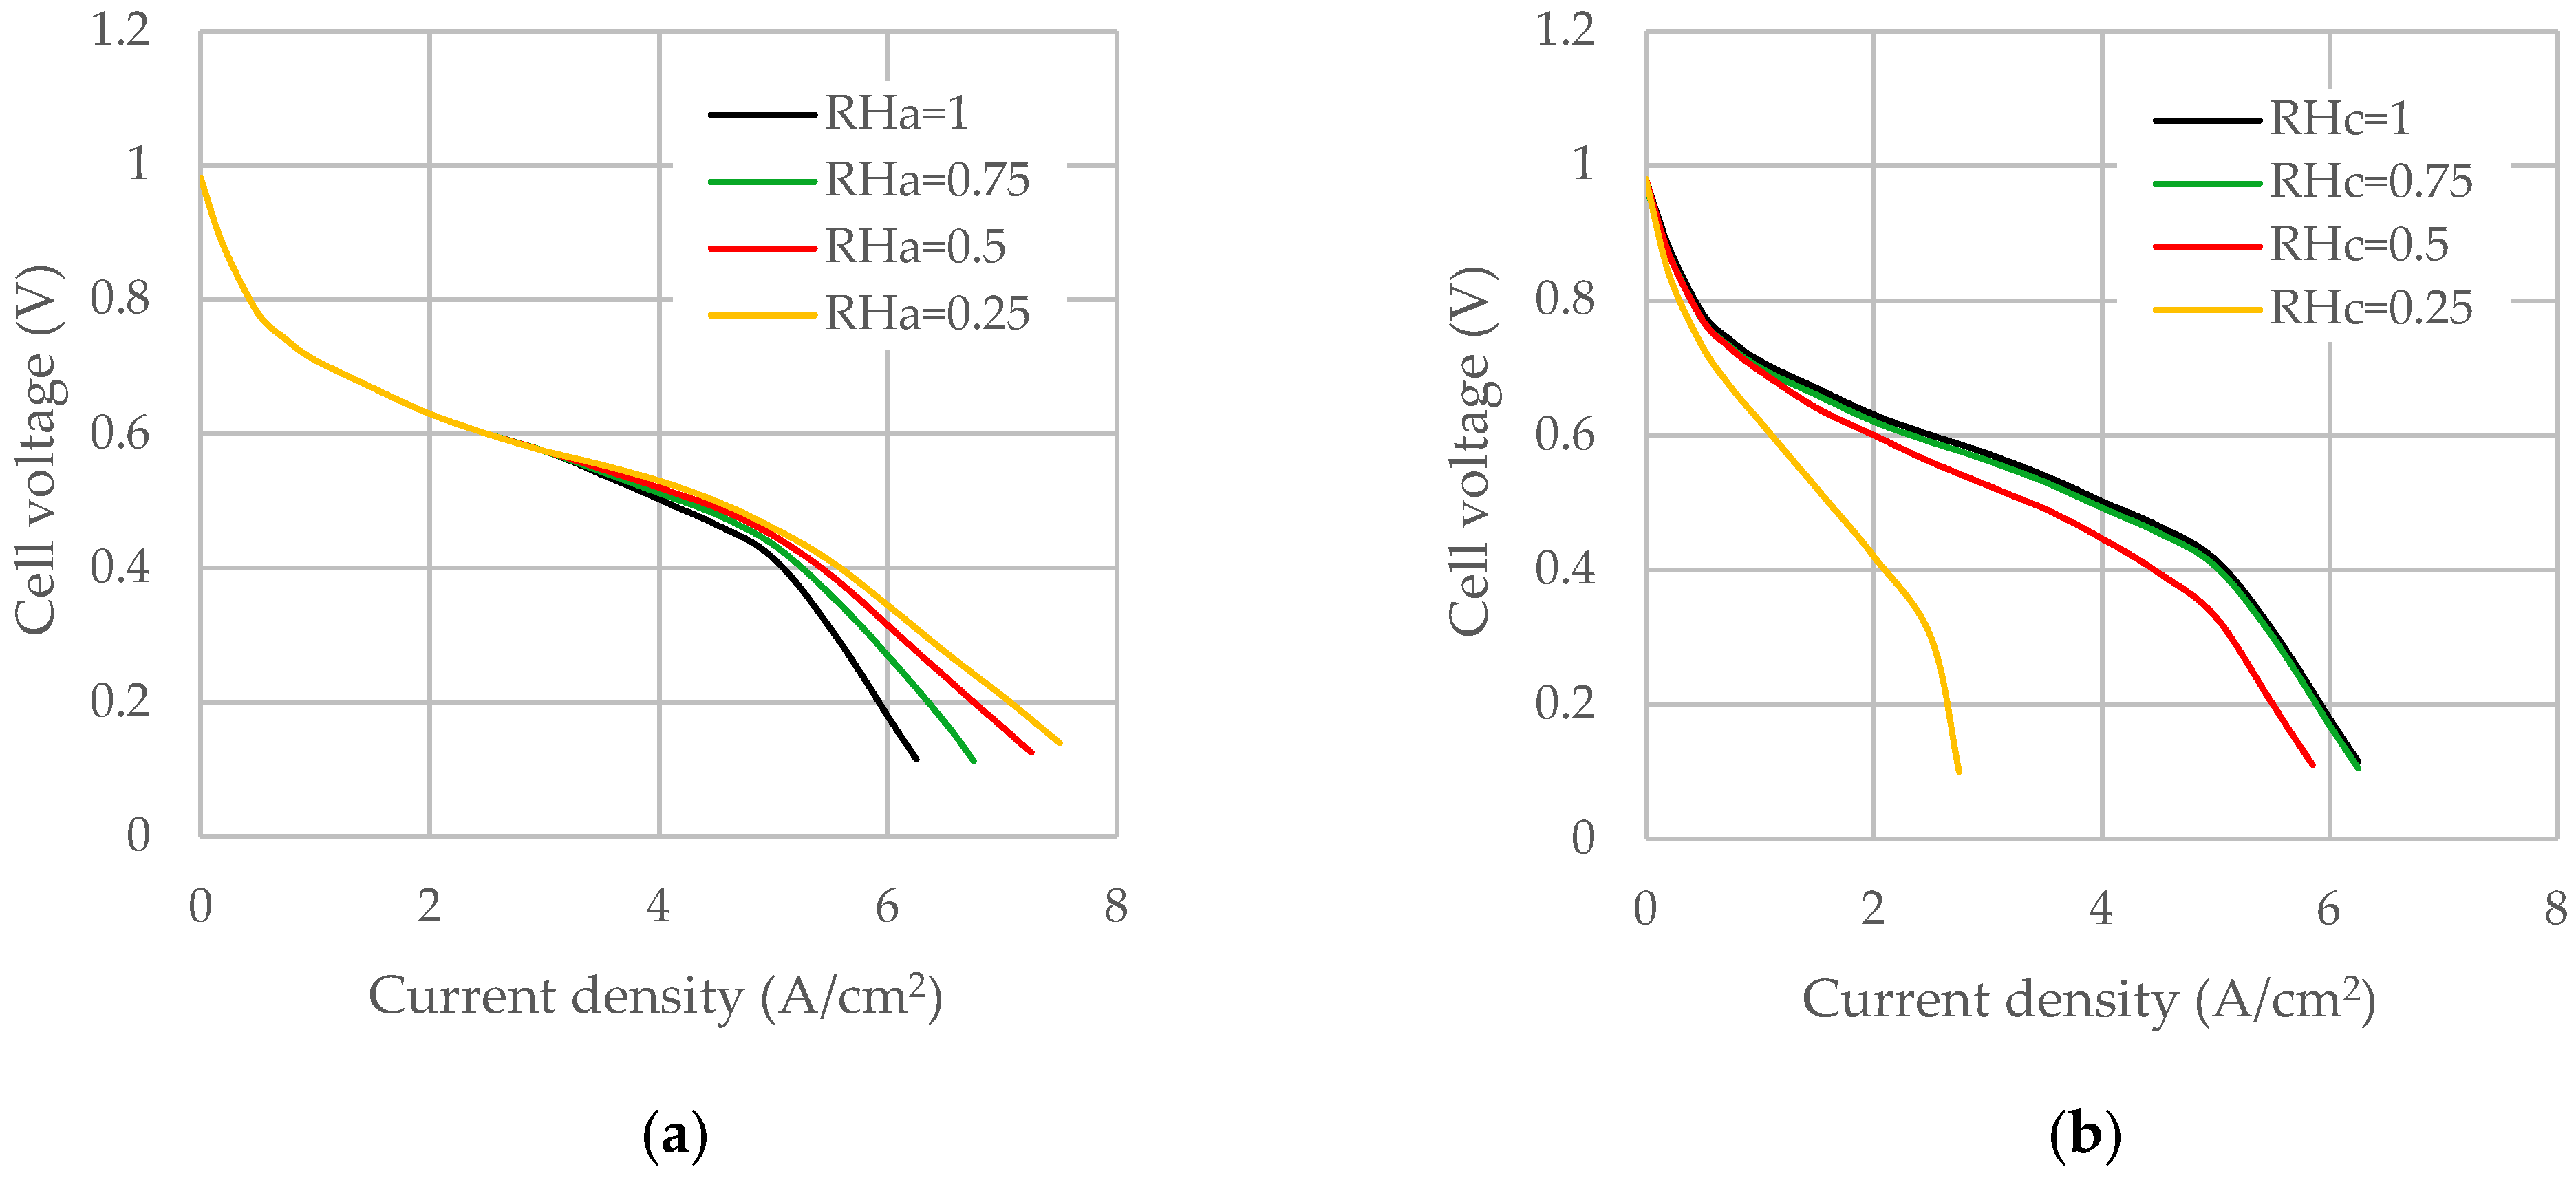
3.7. Effect of Inlet Humidification

The most common technique to control the water balance is to adjust the RH of both electrodes. However, several operational factors, including current density, temperature, dew point temperature, and pressure, influence the optimal gas humidification method. When the cell operates at a high power density, the cell is likely to experience flooding and dry out on the anode and cathode sides, respectively. The solubility of hydrogen in water is quite low, deteriorating further as the temperature rises. Therefore, water buildup in the anode poses a significant mass transfer challenge. It obstructs the porous structure and the CL, resulting in inadequate hydrogen transfer. It has also been proved that too low an RHa may degrade cell performance due to anode dry-out, and this situation would not only dry the catalyst layer but also induce membrane dehydration. In line with this, Omasta et al. [32] demonstrated that partly humidified gases performed better than fully humidified gases in an AEMFC. Figure 12a depicts the polarization curves produced by running the model at various RHa values while keeping the RHc at 1. This sensitivity analysis reveals that the mass transport limited current density increases as the anode inlet relative humidity decreases. Since water is produced at the anode, it is reasonable to suppose that the hydrogen gas does not need to be fully humidified. High RHa levels exacerbate water accumulation in the final sections as seen in Figure 8, but lower RHa mitigates it. Anode water buildup aggravates hydrogen mass transport restrictions, resulting in a sharp drop in the local current density.
Figure 12b illustrates the impact of changing the RHc while keeping RHa at 1. Since the water consumed cannot be replenished quickly enough by the water present in the inflow stream, cell performance drops at low RHc values and high current densities. The higher the humidity level in the cathode, the better the cell performs with a fully humidified cathode, leading to the best results. The cell reaches the limiting current density of 6 Acm−2 at RHc of 0.5, which is almost two times the value reached when the cell operates at an RHc of 0.25. This can be explained by changes in water transport at varying current densities. More water is consumed in the cathode as the current density rises. As a result, larger levels of inlet gas humidification become a key supply of water for cathode humidification. Changing the RHc from 0.5 to 0.75 and even to 1 on the cathode side does not have the same considerable impact on the cell’s performance. The slight difference between the polarization curve for the case with RHc of 0.75 and 1 suggests that the former value provides adequate water for the cell to operate at an optimum condition.

4. Conclusions

AEMFCs have been receiving increasing attention recently, and it is essential to understand the impacts of various operating parameters and geometric variables on their performance to further facilitate the application of these special classes of fuel cells. While computational studies can help in this regard, comprehensive 3D models are still rare in this field. A three-dimensional model enables in-depth examination of potential fuel cell failure reasons or in-depth examination of the consequences of various phenomena taking place over the electrode surface. This marks a major advantage over one- or two-dimensional models. In this study, a steady-state, three-dimensional, single-phase model of HT-AEMFC with serpentine flow fields is developed. Conservation equations including mass, momentum, species, and charge are included in the model for the transport and distributions of the velocity, species, and current density. The model is validated by experimental results for polarization and power density curves published in [22] for the same set of operating conditions. Moreover, the model predictions match well with the conclusions of different experimental and numerical studies in the literature.
The following conclusions are drawn based on the extensive parametric sensitivity analyses:
  • Due to the relatively long reactant flow path created by the single serpentine flow field design, there is a large pressure drop from the inlet to the exit. Moreover, the water generated at the anode is challenging to remove, which results in poor cell performance.
  • Through its impact on species transport, membrane conductivity, and electrochemical kinetics, the temperature is seen to have a substantial impact on the fuel cell performance.
  • The gas and water concentration has a major effect on the magnitude of local current density. Due to reactant depletion and water formation along the channel, the region near the inlet demonstrates the most current, whereas the region near the outlet shows low current values. Limiting current occurs because of mass transport restrictions on the anode side.
  • High inlet flow rates increase oxygen and water consumption in the cathode while reducing water accumulation at the anode, with the latter being more crucial.
  • The inlet RH of gases plays an important role in cell performance. It was found that the increase in the humidity of cathode inlet gas has a favorable effect on fuel cell performance while the increase in the humidity of the anode inlet has a detrimental effect on the cell performance. At high current densities, the sensitivity of cell performance to this parameter increases substantially. Additional humidification of the cathode improves overall performance, although the benefit becomes less pronounced at higher humidification levels. By lowering the RHa while maintaining high RHc, the cell water can be efficiently regulated.
The effects of temperature, flow rate, inlet RH, and species distribution on the cell performance are investigated in this study, and work is currently underway to expand this investigation to include the effects of other parameters, such as geometrical and physical properties of the AEMFC components and the anode/cathode gas stoichiometric ratios on the cell performance by leveraging the efficacy of this model.

Funding

This research received no external funding.

Conflicts of Interest

The author declares no conflict of interest.

Nomenclature

ASurface area, m 2
AEMFCanion exchange membrane fuel cell
CLcatalyst layer
Ddiffusivity, m2 s−1
FFaraday’s constant, C mol−1
GDLgas diffusion layer
hheight, m
ivolumetric reaction rate, A cm−3
Kpermeability, m2
Mmolecular weight, kg mol−1
Ppressure, Pa
PEMFCproton exchange membrane fuel cell
Runiversal gas constant, 8.314 J mol−1 K−1
RHrelative humidity
Ssource term
Ttemperature, K
uvelocity, m s−1
VVoltage, V
wwidth, m
x molar fraction
Greek symbols
αcharge transfer coefficient
δthickness, m
εporosity
σelectric conductivity, S m−1
μdynamic viscosity, kg m−1 s−1
ηactivation overpotential, V
ϕ electric potential, V
ϑ molar volume of species, m3 mol−1
ω mass fraction
ρdensity, kg m−3
Subscripts and superscripts
aanode
ccathode
chchannel
dpdew point
ispecies index
ininlet
jspecies index
mmembrane phase
mixmixture
refreference value
revreversible
ssolid phase
satsaturation
0standard value

References

  1. Dekel, D.R.; Rasin, I.G.; Page, M.; Brandon, S. Steady State and Transient Simulation of Anion Exchange Membrane Fuel Cells. J. Power Sources 2018, 375, 191–204. [Google Scholar] [CrossRef]
  2. Lee, K.S.; Maurya, S.; Kim, Y.S.; Kreller, C.R.; Wilson, M.S.; Larsen, D.; Elangovan, S.E.; Mukundan, R. Intermediate Temperature Fuel Cells: Via an Ion-Pair Coordinated Polymer Electrolyte. Energy Environ. Sci. 2018, 11, 979–987. [Google Scholar] [CrossRef]
  3. Mehrtash, M.; Tari, I.; Yesilyurt, S. Impacts of Inhomogeneous Clamping Force on Local Performance and Liquid Water Formation in Polymer Electrolyte Fuel Cells. Int. J. Hydrogen Energy 2017, 42, 19227–19245. [Google Scholar] [CrossRef]
  4. Zhou, Z.; Zholobko, O.; Wu, X.F.; Aulich, T.; Thakare, J.; Hurley, J. Polybenzimidazole-Based Polymer Electrolyte Membranes for High-Temperature Fuel Cells: Current Status and Prospects. Energies 2021, 14, 135. [Google Scholar] [CrossRef]
  5. Varcoe, J.R.; Atanassov, P.; Dekel, D.R.; Herring, A.M.; Hickner, M.A.; Kohl, P.A.; Kucernak, A.R.; Mustain, W.E.; Nijmeijer, K.; Scott, K.; et al. Anion-Exchange Membranes in Electrochemical Energy Systems. Energy Environ. Sci. 2014, 7, 3135–3191. [Google Scholar] [CrossRef] [Green Version]
  6. Tang, D.P.; Pan, J.; Lu, S.F.; Zhuang, L.; Lu, J.T. Alkaline Polymer Electrolyte Fuel Cells: Principle, Challenges, and Recent Progress. Sci. China Chem. 2010, 53, 357–364. [Google Scholar] [CrossRef]
  7. Truong, V.M.; Tolchard, J.R.; Svendby, J.; Manikandan, M.; Miller, H.A.; Sunde, S.; Yang, H.; Dekel, D.R.; Barnett, A.O. Platinum and Platinum Group Metal-Free Catalysts for Anion Exchange Membrane Fuel Cells. Energies 2020, 13, 582. [Google Scholar] [CrossRef] [Green Version]
  8. Miller, H.A.; Lavacchi, A.; Vizza, F.; Marelli, M.; di Benedetto, F.; D’Acapito, F.; Paska, Y.; Page, M.; Dekel, D.R. A Pd/C-CeO2Anode Catalyst for High-Performance Platinum-Free Anion Exchange Membrane Fuel Cells. Angew. Chem. Int. Ed. 2016, 55, 6004–6007. [Google Scholar] [CrossRef]
  9. Dekel, D.R. Review of Cell Performance in Anion Exchange Membrane Fuel Cells. J. Power Sources 2018, 375, 158–169. [Google Scholar] [CrossRef]
  10. Gottesfeld, S.; Dekel, D.R.; Page, M.; Bae, C.; Yan, Y.; Zelenay, P.; Kim, Y.S. Anion Exchange Membrane Fuel Cells: Current Status and Remaining Challenges. J. Power Sources 2018, 375, 170–184. [Google Scholar] [CrossRef]
  11. Yu, S.; Ma, X.; Liu, H.; Hao, J. Highly Stable Double Crosslinked Membrane Based on Poly(Vinylbenzyl Chloride) for Anion Exchange Membrane Fuel Cell. Polym. Bull. 2018, 75, 5163–5177. [Google Scholar] [CrossRef]
  12. Peng, H.; Li, Q.; Hu, M.; Xiao, L.; Lu, J.; Zhuang, L. Alkaline Polymer Electrolyte Fuel Cells Stably Working at 80 °C. J. Power Sources 2018, 390, 165–167. [Google Scholar] [CrossRef]
  13. Wang, L.; Bellini, M.; Miller, H.A.; Varcoe, J.R. A High Conductivity Ultrathin Anion-Exchange Membrane with 500+ h Alkali Stability for Use in Alkaline Membrane Fuel Cells That Can Achieve 2 W Cm-2 at 80 °c. J. Mater. Chem. A 2018, 6, 15404–15412. [Google Scholar] [CrossRef] [Green Version]
  14. Huang, G.; Mandal, M.; Peng, X.; Yang-Neyerlin, A.C.; Pivovar, B.S.; Mustain, W.E.; Kohl, P.A. Composite Poly(Norbornene) Anion Conducting Membranes for Achieving Durability, Water Management and High Power (3.4 W/Cm 2) in Hydrogen/Oxygen Alkaline Fuel Cells. J. Electrochem. Soc. 2019, 166, F637–F644. [Google Scholar] [CrossRef] [Green Version]
  15. Wang, L.; Peng, X.; Mustain, W.E.; Varcoe, J.R. Radiation-Grafted Anion-Exchange Membranes: The Switch from Low-to High-Density Polyethylene Leads to Remarkably Enhanced Fuel Cell Performance. Energy Environ. Sci 2019, 12, 1575–1579. [Google Scholar] [CrossRef] [Green Version]
  16. Wu, H.Y.; Yang, Q.; Gao, X.L.; Zhu, Z.Y.; Sun, Q.H.; Zhang, Q.G.; Zhu, A.M.; Liu, Q.L. Novel Crosslinked Aliphatic Anion Exchange Membranes with Pendant Pentafluorophenyl Groups. Electrochim. Acta 2019, 321, 134634. [Google Scholar] [CrossRef]
  17. Ouadah, A.; Xu, H.; Luo, T.; Gao, S.; Zhang, Z.; Li, Z.; Zhu, C. Synthesis of Novel Copolymers Based on: P -Methylstyrene, N, N -Butylvinylimidazolium and Polybenzimidazole as Highly Conductive Anion Exchange Membranes for Fuel Cell Application. RSC Adv. 2017, 7, 47806–47817. [Google Scholar] [CrossRef] [Green Version]
  18. Wang, J.; Zhao, Y.; Setzler, B.P.; Rojas-Carbonell, S.; ben Yehuda, C.; Amel, A.; Page, M.; Wang, L.; Hu, K.; Shi, L.; et al. Poly (Aryl Piperidinium) Membranes and Ionomers for Hydroxide Exchange Membrane Fuel Cells. Nat. Energy 2019, 4, 392–398. [Google Scholar] [CrossRef]
  19. Yang, Y.; Jiang, T.; Li, L.; Zhou, S.; Fang, H.; Li, X.; Wei, H.; Ding, Y. Chemo-Stable Poly (Quinquephenylene-Co-Diphenylene Piperidinium) Ionomers for Anion Exchange Membrane Fuel Cells. J. Power Sources 2021, 506, 230184. [Google Scholar] [CrossRef]
  20. Lu, C.; Long, C.; Li, Y.; Li, Z.; Zhu, H. Chemically Stable Poly (Meta-Terphenyl Piperidinium) with Highly Conductive Side Chain for Alkaline Fuel Cell Membranes. J. Membr. Sci. 2020, 598, 117797. [Google Scholar] [CrossRef]
  21. Wang, L.; Brink, J.J.; Liu, Y.; Herring, A.M.; Ponce-González, J.; Whelligan, D.K.; Varcoe, J.R. Non-Fluorinated Pre-Irradiation-Grafted (Peroxidated) LDPE-Based Anion-Exchange Membranes with High Performance and Stability. Energy Environ. Sci. 2017, 10, 2154–2167. [Google Scholar] [CrossRef] [Green Version]
  22. Douglin, J.C.; Varcoe, J.R.; Dekel, D.R. A High-Temperature Anion-Exchange Membrane Fuel Cell. J. Power Sources Adv. 2020, 5, 100023. [Google Scholar] [CrossRef]
  23. Huo, S.; Deng, H.; Chang, Y.; Jiao, K. Water Management in Alkaline Anion Exchange Membrane Fuel Cell Anode. Int. J. Hydrogen Energy 2012, 37, 18389–18402. [Google Scholar] [CrossRef]
  24. Deng, H.; Huo, S.; Chang, Y.; Zhou, Y.; Jiao, K. Transient Analysis of Alkaline Anion Exchange Membrane Fuel Cell Anode. Int. J. Hydrogen Energy 2013, 38, 6509–6525. [Google Scholar] [CrossRef]
  25. Jiao, K.; He, P.; Du, Q.; Yin, Y. Three-Dimensional Multiphase Modeling of Alkaline Anion Exchange Membrane Fuel Cell. Int. J. Hydrogen Energy 2014, 39, 5981–5995. [Google Scholar] [CrossRef]
  26. Machado, B.S.; Chakraborty, N.; Das, P.K. Influences of Flow Direction, Temperature and Relative Humidity on the Performance of a Representative Anion Exchange Membrane Fuel Cell: A Computational Analysis. Int. J. Hydrogen Energy 2017, 42, 6310–6323. [Google Scholar] [CrossRef] [Green Version]
  27. Gerhardt, M.R.; Pant, L.M.; Weber, A.Z. Along-the-Channel Impacts of Water Management and Carbon-Dioxide Contamination in Hydroxide-Exchange-Membrane Fuel Cells: A Modeling Study. J. Electrochem. Soc. 2019, 166, F3180–F3192. [Google Scholar] [CrossRef] [Green Version]
  28. Eriksson, B.; Grimler, H.; Carlson, A.; Ekström, H.; Wreland Lindström, R.; Lindbergh, G.; Lagergren, C. Quantifying Water Transport in Anion Exchange Membrane Fuel Cells. Int. J. Hydrogen Energy 2019, 44, 4930–4939. [Google Scholar] [CrossRef]
  29. Adachi, M.; Navessin, T.; Xie, Z.; Frisken, B.; Holdcroft, S. Correlation of In Situ and Ex Situ Measurements of Water Permeation Through Nafion NRE211 Proton Exchange Membranes. J. Electrochem. Soc. 2009, 156, B782. [Google Scholar] [CrossRef] [Green Version]
  30. Brinkman, H.C. A Calculation of the Viscous Force Exerted by a Flowing Fluid on a Dense Swarm of Particles. Flow Turbul. Combust. 1949, 1, 27–34. [Google Scholar] [CrossRef]
  31. Bird, R.; Stewart, W.; Lightfoot, E. Transport Phenomena; Wiley: New York, NY, USA, 2002. [Google Scholar]
  32. Omasta, T.J.; Wang, L.; Peng, X.; Lewis, C.A.; Varcoe, J.R.; Mustain, W.E. Importance of Balancing Membrane and Electrode Water in Anion Exchange Membrane Fuel Cells. J. Power Sources 2018, 375, 205–213. [Google Scholar] [CrossRef] [Green Version]
  33. Omasta, T.J.; Park, A.M.; Lamanna, J.M.; Zhang, Y.; Peng, X.; Wang, L.; Jacobson, D.L.; Varcoe, J.R.; Hussey, D.S.; Pivovar, B.S.; et al. Beyond Catalysis and Membranes: Visualizing and Solving the Challenge of Electrode Water Accumulation and Flooding in AEMFCs. Energy Env. Sci. 2018, 11, 551–558. [Google Scholar] [CrossRef] [Green Version]
  34. van Truong, M.; Duong, N.B.; Wang, C.L.; Yang, H. Effects of Cell Temperature and Reactant Humidification on Anion Exchange Membrane Fuel Cells. Materials 2019, 12, 2048. [Google Scholar] [CrossRef] [Green Version]
  35. Zhang, H.; Ohashi, H.; Tamaki, T.; Yamaguchi, T. Direction and Management of Water Movement in Solid-State Alkaline Fuel Cells. J. Phys. Chem. C 2012, 116, 7650–7657. [Google Scholar] [CrossRef]
  36. Zhegur-Khais, A.; Kubannek, F.; Krewer, U.; Dekel, D.R. Measuring the True Hydroxide Conductivity of Anion Exchange Membranes. J. Membr. Sci. 2020, 612, 118461. [Google Scholar] [CrossRef]
  37. Oshiba, Y.; Hiura, J.; Suzuki, Y.; Yamaguchi, T. Improvement in the Solid-State Alkaline Fuel Cell Performance through Efficient Water Management Strategies. J. Power Sources 2017, 345, 221–226. [Google Scholar] [CrossRef]
Figure 1. The computational domain with the 5-cm2 active area, constructed based on the experimental study [22], consists of flow channels, GDLs, CLs, and the membrane.
Processes 10 01315 g001
Figure 2. Schematic representation of the AEMFC working principles. The humidified reactants are fed through the channels, passed through the gas diffusion layers, and dissociated at the catalyst layers. The generated hydroxyl ions move through the membrane while the electrons pass through the external circuit and load, reaching the cathode where they recombine with oxygen and water. The blue patches represent water, whereas the red line is hydrogen and the green line is oxygen.
Processes 10 01315 g002
Figure 3. Mesh distribution for the entire 3D model along with the enlarged view near the inlet section. Fine structured hexahedral mesh elements are employed in the membrane and catalyst layers, while coarse unstructured tetrahedral mesh elements are used in the other sections.
Processes 10 01315 g003
Figure 4. Comparison of the polarization and power density curves obtained from the current model and the ones reported in [22]. The black lines are the resulting curves from the numerical modeling in the present study, while the red circles and blue squares are the results of the experimental tests in the reference study.
Processes 10 01315 g004
Figure 5. (a) Pressure distribution throughout the cell; (b) velocity distribution in four different sections of the cell.
Processes 10 01315 g005
Figure 6. Hydrogen mole fraction distribution at the anode for cell voltage of (a) 0.75 V and (b) 0.25 V.
Processes 10 01315 g006
Figure 7. Oxygen mole fraction distribution at the cathode for cell voltage of (a) 0.75 V and (b) 0.25 V.
Processes 10 01315 g007
Figure 8. Water mole fraction distribution in both anode and cathode sides for cell voltage of (a) 0.75 V and (b) 0.25 V.
Processes 10 01315 g008
Figure 9. Current density distribution on the anode CL for cell voltages of (a) 0.5 V, (b) 0.4 V, (c) 0.3 V, and (d) 0.2 V.
Processes 10 01315 g009
Figure 10. The effect of operating temperature on cell performance.
Processes 10 01315 g010
Figure 11. The effect of different inlet flow rates in (a) anode and (b) cathode on cell performance.
Processes 10 01315 g011
Figure 12. The effect of different inlet RHs in (a) anode and (b) cathode on cell performance.
Processes 10 01315 g012
Table 1. Source terms of the conservation equations.
Volumetric Source TermsUnits
S m a s s = S O 2 + S H 2 + S H 2 O Kg m−3 s−1
S i = S H 2 = i a 2 F M H 2           CL a S O 2 = i c 4 F M O 2                       CL c S H 2 O = i a F M H 2 O                   CL a i c 2 F M H 2 O                 CL c 0                           e l s e w h e r e Kg m−3 s−1
S Φ e = i a                 CL a     + i c                 CL c       A m−3
S Φ m = + i a                 CL a     i c                 CL c       A m−3
Table 2. Physical properties and base operating conditions in the model.
Property, SymbolValue, Unit
Exchange   current   density   in   anode   and   cathode ,   i 0 , a ,   i 0 , c 102, 10−3
Charge   transfer   coefficients ,   α a , a ,   α c , a ,   α a , c ,   α c , c 0.5, 1.5, 3.5, 0.5
Active   area ,   A a c t i v e 5 × 10⁻⁴ m2
Channel height, hch1 × 10−3 m
Channel width, wch1 × 10−3 m
GDL   thickness ,   δ G D L 190 × 10−6 m
CL   thickness ,   δ C L 10 × 10−6 m
Membrane   thickness ,   δ m 50 × 10−6 m
Faraday’s constant, F96,487 C mol−1
Universal gas constant, R8.31 J mol−1 K−1
Molar   volume   of   oxygen ,   ϑ O 2 16.6 × 10⁻⁶ m3 mol−1
Molar   volume   of   hydrogen ,   ϑ H 2 6 × 10⁻⁶ m3 mol−1
Molar   volume   of   water   vapor ,   ϑ H 2 O 12.7 × 10⁻⁶ m3 mol−1
Molar   mass   of   oxygen ,   M O 2 0.032 kg mol−1
Molar   mass   of   hydrogen ,   M H 2 0.002 kg mol−1
Molar   mass   of   water   vapor ,   M H 2 O 0.018 kg mol−1
Porosity   of   GDL ,   ε G D L 0.78
Porosity   of   CL ,   ε C L 0.3
GDL   electrical   conductivity ,   σ G D L 1000 S m−1
CL   electrical   conductivity ,   σ C L 290 S m−1
Membrane   electrical   conductivity ,   σ m 290 S m−1
GDL   permeability ,   K G D L 1 × 10⁻¹¹ m2
CL   permeability ,   K C L 1 × 10⁻¹² m2
Operating temperature, T383.15 K
Dew point temperature, Tdp383.15 K
Reference   pressure ,   P r e f 2 atm
Saturation   pressure ,   P s a t 1.42 atm
Relative humidity for anode and cathode, RHa, RHc1, 1
Publisher’s Note: MDPI stays neutral with regard to jurisdictional claims in published maps and institutional affiliations.

