Article

Valorization of Spent Sugarcane Fermentation Broth as a Source of Phenolic Compounds

CBQF—Centro de Biotecnologia e Química Fina—Laboratório Associado, Escola Superior de Biotecnologia, Universidade Católica Portuguesa, Rua Diogo Botelho, 1327, 4169-005 Porto, Portugal
*
Authors to whom correspondence should be addressed.
Processes 2022, 10(7), 1339; https://doi.org/10.3390/pr10071339
Submission received: 17 May 2022 / Revised: 5 July 2022 / Accepted: 6 July 2022 / Published: 8 July 2022
(This article belongs to the Special Issue Value-Added Utilization Processes of Industrial Wastes)

Abstract

:
A methodology based on a solid phase extraction (SPE) was optimized for the recovery of phenolic compounds from the spent fermentation broth generated from Biofene® (trans-β-farnesene) production. For this purpose, two resins (XAD-2 and HP-20) and three desorption solutions (water, 50/50 ethanol/water, and ethanol) were tested. The most efficient resin revealed to be the HP-20, using ethanol as desorption solution, reaching an overall total phenolic compound recovery of ca. 80% when 6 BV (bed volume) of both feed and ethanol were applied. The optimization of the resin’s process cycle pointed to 15 BV feed to be treated per cycle and using the same volume of ethanol in the desorption step, with no need for an extra resin regeneration step, stably yielding 48% total phenolic compound recovery from the spent broth for at least 4 cycles, translating into 60 BV of feed being treated per BV of resin, and with the resin being still perfectly active. The extract was characterized using LC−ESI−UHR−QqTOF−MS, and a total of 82 and 15 compounds were identified, in negative and positive ionization modes, respectively. Organic acids were the main class of compounds identified in the phenolic-rich extract, followed by phenolic compounds, saccharides, peptides or amino acids and vitamins. Additionally, the extract revealed a significant antioxidant capacity (914.1 ± 51.6 and 2764.5 ± 142.8 µmol Trolox equivalents/g-dw, respectively, with ABTS and ORAC methodologies), which might be interesting for a wide variety of applications.

1. Introduction

Polyphenolic substances are usually subdivided into two groups: flavonoids and nonflavonoid compounds. The flavonoids have a common core, the flavane nucleus, consisting of two benzene rings linked by an oxygen-containing pyran ring, and they can exist as glycosides or aglycones. Differences in the degree of oxidation of the heterocyclic pyran ring and hydroxylation/methoxylation of the three rings results in a large family of structures with essential differences in physicochemical properties and stability [1]. Flavonoids are classified into the following six subclasses: flavonols such as kaempferol, quercetin, and myricetin; flavan-3-ols such as catechin, epicatechin, and tannins; anthocyanins including cyanidin-3-glucoside, peonidin-3-glucoside, delphinidin-3-glucoside, petunidin-3-glucoside, and malvidin-3-glucoside [1]; flavones, isoflavones and flavanones [2]. The main flavones found in plants are apigenin, luteolin, and tricetin in the aglycone forms; however, flavones are mainly present in their glycoside forms [3]. The main flavanones found in plants are the aglycone forms, hesperidin, naringenin, isosakuratenin, and heridictyol; however, the flavanones are also present as the glycosides rutinoside and neohesperidoside [2]. Non-flavonoid compounds are mainly phenolic acids, derivatives of benzoic acid (benzoic acid, p-hydroxybenzoic acid, protocatechuic acid, vanillic acid, gallic acid, and syringic acid), and derivatives of cinnamic acid (cinnamic acid, p-coumaric acid, caffeic acid, ferulic acid, and sinapic acid). Non-flavonoid compounds also include stilbenes and stilbene glycosides [1].
Phenolic compounds exhibit potential physiological properties that may be used in food, cosmetics, and pharmaceutical applications [4]. These compounds, either individually or combined, are responsible for various health benefits, such as prevention of inflammation disorders, cardiovascular diseases, or protective effects to lower the risk of various cancers [3,5].
The recovery of phenolic compounds from plant materials includes conventional and unconventional methods. Conventional extraction methods include solid–liquid extraction (SLE) or Soxhlet extraction, liquid–liquid extraction (LLE) and maceration [6]. The unconventional methods include pressurized liquid extraction (PLE), subcritical water extraction (SWE), supercritical fluid extraction (SFE), microwave-assisted extraction (MAE), solid phase extraction (SPE), ultrasound-assisted extraction (UAE), high hydrostatic pressure extraction (HHPE), solid-supported liquid–liquid extraction (SSLLE), matrix solid-phase dispersion (MSPD), and counter-current chromatography (CCC) [7]. These last techniques, besides decreasing the consumption of solvents, also have higher extraction efficiencies and higher selectivity and allow automation [8,9].
Sugarcane is widely used as fermentation feedstock for production of biomass, biofuels, and bioproducts [10]. Several works have been conducted in order to quantify phenolic compounds in sugarcane juice and sugarcane waste fermentation [11,12,13,14]. In these studies, HPLC-DAD was used for the identification and quantification of the main phenolic compounds, revealing a predominance of flavones (apigenin, luteolin and tricin derivatives), among flavonoids, and of p-coumaric acid, caffeic and sinapic acids among phenolic acid derivatives, representing a total content of around 160 mg/L (catechin equivalents) [11,13]. Moreover, the phenolic concentration in the sugarcane juice extracted from 10 sugarcane varieties during the harvest season could reach 250 mg/L (gallic acid equivalents) [12]. Likewise, in the analysis of fresh sugar cane juice, among 32 phenolic compounds identified by mass spectrometry (MS), a total of 17 were quantified by HPLC-DAD, comprising, in decreasing order of abundance, flavones (38–49 mg/L), dilignols (22–29 mg/L), and phenolic acid derivatives (17–30 mg/L) [15].
Amyris, Inc. (Nasdaq: AMRS) is a leading synthetic biotechnology company aiming for the valorization of high-value ingredients through sugarcane yeast fermentation. A particular fermentation process was developed by Amyris for the production of Biofene®, trans-β-farnesene [16]. This fermentation process generates a high volume of spent broth, an aqueous side stream, rich in nutrients and minerals with high potential for valorization. In view of the circular economy, the recovery of phenolic compounds from sugarcane fermentation waste streams is very promising. Indeed, phenolic compound concentration has been shown to increase during sugarcane fermentation processes. For instance, sugarcane vinasse, an acidic brownish liquid generated after fermentation and distillation of sugarcane juice for production of ethanol, was found to have a total concentration of phenolic compounds of 450 mg/L [17,18], 469 mg/L [19] and 667 mg/L [20].
Thus, this work aimed to recover phenolic compounds from the spent fermentation broth from the Biofene® production. In this context, the aim of the present study was to optimize a phenolic compound recovery process based on solid phase extraction (SPE). The resultant phenolic-rich extract was exhaustively characterized using a method based on LC−ESI−UHR−QqTOF−MS.

2. Materials and Methods

2.1. Chemicals

The following chemicals were purchased from Sigma-Aldrich (Sintra, Portugal): gallic acid monohydrate (PNr.-398225, ≥98.0%); protocatechuic acid (3,4-dihydroxybenzoic acid; 37580, ≥97.0%); xanthurenic acid (PNr.-D120804, 96.0%); kynurenic acid (PNr.-K3375, ≥98.0%); gentisic acid (2,5-dihydroxybenzoic acid; PNr.-149357, 98%); chlorogenic acid (PNr.-C3878, ≥95.0%); dihydrocaffeic acid (3,4-dihydroxyhydrocinnamic acid; PNr.-102601, 98%); cryptochlorogenic acid (4-O-caffeoylquinic acid; PN-65969, ≥98.0%); vanillic acid (PNr.-94770, ≥97.0%); caffeic acid (PNr.-C0625, ≥98.0%); syringic acid (PNr.-S6881, ≥95.0%); p-coumaric acid (PNr.-C9008, ≥98.0%); trans-ferulic acid (PNr.-128708, 99.0%); isoorientin (luteolin 6-C-glucoside; PNr.-I1536, ≥98.0%); naringenin (naringenin-7-neohesperidoside; PNr.-52186, ≥95.0%); apigenin (4′,5,7-trihydroxyflavone; PNr.-10798, ≥95.0%); 2,2′-Azino-bis(3-ethylbenzothiazoline-6-sulfonic acid) diammonium salt (ABTS, PNr.-A1888); 2,2′-Azobis(2-methylpropionamidine) dihydrochloride (AAPH, PNr.-440914); 6-hydroxy-2,5,7,8-tetramethylchroman-2-carboxylic acid (Trolox, PNr.-238813); fluorescein disodium salt (PNr.-F6377); sodium carbonate (PNr.-S2127); potassium persulphate (PNr.-216224); and sodium dihydrogen phosphate (PNr.-S3139).
The following chemicals were purchased from Extrasynthese: neochlorogenic acid (5-O-caffeoylquinic acid; PNr.-4961 S, ≥99.0%); vanillin (PNr.-6110 S, ≥99.0%); schaftoside (apigenin-6-C-beta-D-glucoside-8-C-alpha-L-arabinoside; PNr.-1369, 90%); isoschaftoside (apigenin-6-C-arabinoside-8-C-glucoside; PNr.-1354, ≥95.0%); orientin (luteolin-8-C-glucoside; PNr.-1054 S, ≥99.0%); vitexin (apigenin-8-C-glucoside; PNr.-1232 S, ≥99.0%); vitexin-2″-O-rhamnoside (apigenin-8-C-glucoside-2″-O-rhamnoside; PNr.-1006 S, ≥98.0%); isoferulic acid (PNr.-6114, ≥90.0%); luteolin-4′-O-glucoside (juncein; PNr.-1412 S, ≥98.0%); prunin (naringenin-7-O-glucoside; PNr.-1160 S, ≥99.0%); luteolin (3′,4′,5,7-tetrahydroxyflavone; PNr.-1125 S, ≥99.0%); and diosmetin (3′,5,7-trihydroxy-4′-methoxyflavone; PNr.-1108 S; ≥99.0%).
Methanol, acetonitrile, formic acid and Folin–Ciocalteu reagent were purchased from Sigma-Aldrich (Madrid, Spain).
The following chemicals were purchased from Supelco: Amberlite® XAD®-2 (PNr.-SU853005) and Diaion® HP-20 (PNr.-13606).

2.2. Recovery of Phenolic Compounds

2.2.1. Sample Preparation

The raw clarified spent fermentation broth was supplied by Amyris, Inc. (Brotas, Brazil). The samples were pretreated for major mineral removal through an ion exchange process and further clarified through microfiltration, resulting in the so denominated spent broth used throughout the experiment.

2.2.2. Solid Phase Extraction (SPE)

For this experiment two commercial food-grade polymeric resins (Table 1), Amberlite® XAD®-2 (XAD-2) and Diaion® HP-20 (HP-20), were assessed based on their adsorption and further desorption with ethanolic solutions with the aim of selecting the most suitable resin for the practical recovery of phenolic compounds from the spent broth.
A Visiprep™ SPE Vacuum Manifold was used to perform solid phase extraction with 4 SPE tubes, applying 1 g of resin in each tube. The resin activation consisted of eluting 5 BV (bed volume) of methanol followed by 5 BV of deionized water at a constant flow of 1 BV/min. The absorption step was performed eluting 6 BV of sample (spent broth) with ca. 50 mg/L (LC-MS) or approx. 1 g/L of total phenolic compounds (TPC). Each 1 BV (1 mL) of eluate was collected for further analysis. At the end of the absorption experiment, i.e., after the elution of 6 BV of sample, the resins were washed with 1 BV of deionized water (1 mL), and further used in the desorption experiment, in which three solutions were tested: (1) water at pH 2, (2) ethanol/water 50/50 at pH 2, and (3) ethanol at pH 2. Nine BV (9 mL) of desorption solution were eluted at 1 BV/min, and samples of eluate were collected for further analysis. All conditions were assessed in duplicate.

2.3. Analytical Methods

2.3.1. Total Phenolic Compounds (TPC) Content

The TPC content was evaluated through the Folin–Ciocalteu spectrophotometric methodology using an automated plate reader according to the protocol described by Coelho et al. [21]. Briefly, to 20 µL of sample/standard (diluted when needed), 80 µL of Folin–Ciocalteu reagent (10 vol.%) and 100 µL of sodium carbonate (7.5 wt./vol.%) were added. The mixture was incubated for 1 h at room temperature, and then, the absorbance at 750 nm was measured. A calibration curve was plotted with the absorbance of gallic acid solutions from 0.100 to 0.125 g/L, ranging in absorbance from 0.1 to 1, versus the respective concentrations. The TPC content was expressed as grams of gallic acid equivalent per liter (g-gae/L). The analyses were performed in triplicate.

2.3.2. LC−ESI−UHR−QqTOF−MS Analysis

A UHPLC from Bruker Elute series, coupled to an UHR-QqTOF mass spectrometer (Impact II, Bruker), was used. Separation of metabolites was performed using a BRHSC18022100 intensity Solo 2 C18 column (100 × 2.1 mm, 2.2 μm, Bruker) with a gradient flow of 0.250 mL/min (Table 2).
Parameters for MS analysis were set using negative ionization mode, for mainly phenolic compounds and organic acids, over a mass to charge ratio (m/z) range from 20 to 1000; and positive ionization mode, for mainly sugars, polysaccharides, peptides, and vitamins, over an m/z range from 150 to 2200. The selected parameters were those presented in Table 3, and the analyses were performed in an Auto MS (MS/MS) mode. Post-acquisition internal mass calibration used a sodium formate solution (negative ionization mode), or a tuning calibration solution mix ESI-TOF mass spectrometry (positive ionization mode) delivered by a syringe pump, at the start of each chromatographic analysis.

2.3.3. Phenolic Compound Quantification

Phenolic compounds were quantified by LC-MS in negative ionization mode, as described in the previous section. Table 4 lists the analytical parameters of the working method for 28 selected phenolic compounds, with the retention times, m/z, slope, intercept, and linear range of the standard calibration curves. The methodology applied was adapted from Oliveira et al. [22]. A linear regression was adjusted to the chromatographic area versus the compound’s concentration data.

2.3.4. Antioxidant Activity

Radical Scavenging Activity (ABTS Assay)

The radical scavenging activity was determined with the ABTS spectrophotometric methodology using an automated plate reader, according to the protocol described by Gião et al. [23]. A solution with 7 mM of ABTS and 2.45 mM of potassium persulphate were mixed in water to trigger the ABTS radical cation (ABTS•+). The prepared solution was stored in the dark before use. The initial optical density of the ABTS•+ solution, measured at 734 nm, was firstly adjusted with ethanol to an absorbance of 0.700 ±0.020. Then, to 15 µL of sample (diluted when needed)/standard/ethanol (control), 200 µL of ABTS•+ solution was added, and the mixture was incubated for 6 min at 30 °C. After this time, the absorbance at 734 nm was measured, and the reduction in absorbance represented the sample ABTS•+ scavenging capacity. The percentage of inhibition was calculated using the following formula:% Inhibition = [(AC(0) − AA(t))/AC(0) × 100], where AC(0) is the initial optical density of the ABTS•+ solution plus ethanol (control), and AA(t) is the optical density of the ABTS•+ solution plus sample or standard after 6 min. A calibration curve was plotted with the percentage of inhibition of Trolox from 0.01 to 0.15 g/L, ranging in percentage of inhibition from 5 to 85 versus the respective concentration. The results were expressed as micromoles of Trolox equivalent per gram of sample’s dry weight (µmol Trolox equivalents/g). The analyses were performed in triplicate.

Oxygen Radical Absorbance Capacity (ORAC Assay)

Oxygen radical absorbance capacity (ORAC) assay was performed according a protocol adapted from that of Coscueta et al. [24] in black polystyrene 96-well microplates (Nunc, Denmark). Sample or standard (20 µL) and fluorescein solutions (120 µL; 119 nM, final concentration per well) were placed in the well of the microplate at 200 µL final volume. A blank using 75 mM phosphate buffer (pH 7.4) instead of sample and eight calibration solutions using Trolox (10 to 80 µmol/L, final concentration per well) as antioxidant standard were also used in each assay. The mixture was preincubated for 10 min at 37 °C. Afterward, an AAPH solution (60 µL; 48 mM, final concentration per well) was added. The microplate was immediately placed in the reader, and the fluorescence was recorded at intervals of 1 min for 120 min with an excitation wavelength at 485 nm and the emission wavelength at 528 nm. The microplate was automatically shaken before each reading. This assay was performed with a multidetector plate reader (Synergy H1, VT, Santa Clara, CA, USA) controlled by the Gen5 Biotek software. Both AAPH and Trolox solutions were freshly prepared, and fluorescein was diluted from a stock solution (1.19 mM) in the same phosphate buffer. Antioxidant curves (fluorescence versus time) were first normalized to the curve of the blank corresponding to the same assay by multiplying original data by the factor [(fluorescence blank at t = 0)/(fluorescence control at t = 0)]. A calibration curve was plotted with the normalized fluorescence of Trolox from 10.0 to 80.0 µmolg/L, ranging from a normalized fluorescence of 1 × 10⁷ to 1 × 10⁸, versus the respective concentration. The results were expressed as micromoles of Trolox equivalent per gram of dry weight (µmol Trolox equivalents/g). The analyses were performed in triplicate.

3. Results and Discussion

3.1. Spent Broth’s Phenolic Compound Characterization

The TPC content in the spent broth was determined to be 1.12 ± 0.02 g-gae/L.
Results obtained by LC-MS showed that the higher concentrations of phenolic compounds in the spent broth corresponded to the class of phenolic acids and hydroxybenzoic acids (ca. 17.29 mg/L), followed by flavone glycosides (ca. 2.45 mg/L), hydroxycinnamic acids (ca. 1.88 mg/L), chlorogenic acids (ca. 1.35 mg/L), flavones (ca. 0.03 mg/L), and flavanones (0.01 mg/L) (Table 5). These results agree with the reported analysis of fresh sugar cane juice, although in a lower concentration, where the higher concentrations of phenolics comprised flavones (38–49 mg/L) and phenolic acid derivatives (17–30 mg/L), along with lignin derivatives [15].
Due to the high amount of a specific class of compounds, the quinoxalines, which comprise xanthurenic and kynurenic acids, these were also counted. A total of 23.01 ± 0.57 mg/L of phenolic compounds were quantified along with 28.37 ± 0.19 mg/L of quinoxalines, together adding 52.1 ± 0.8 mg/L. This quantification was considered in the recovery of phenolic compounds.

3.2. Recovery of Phenolic Compounds

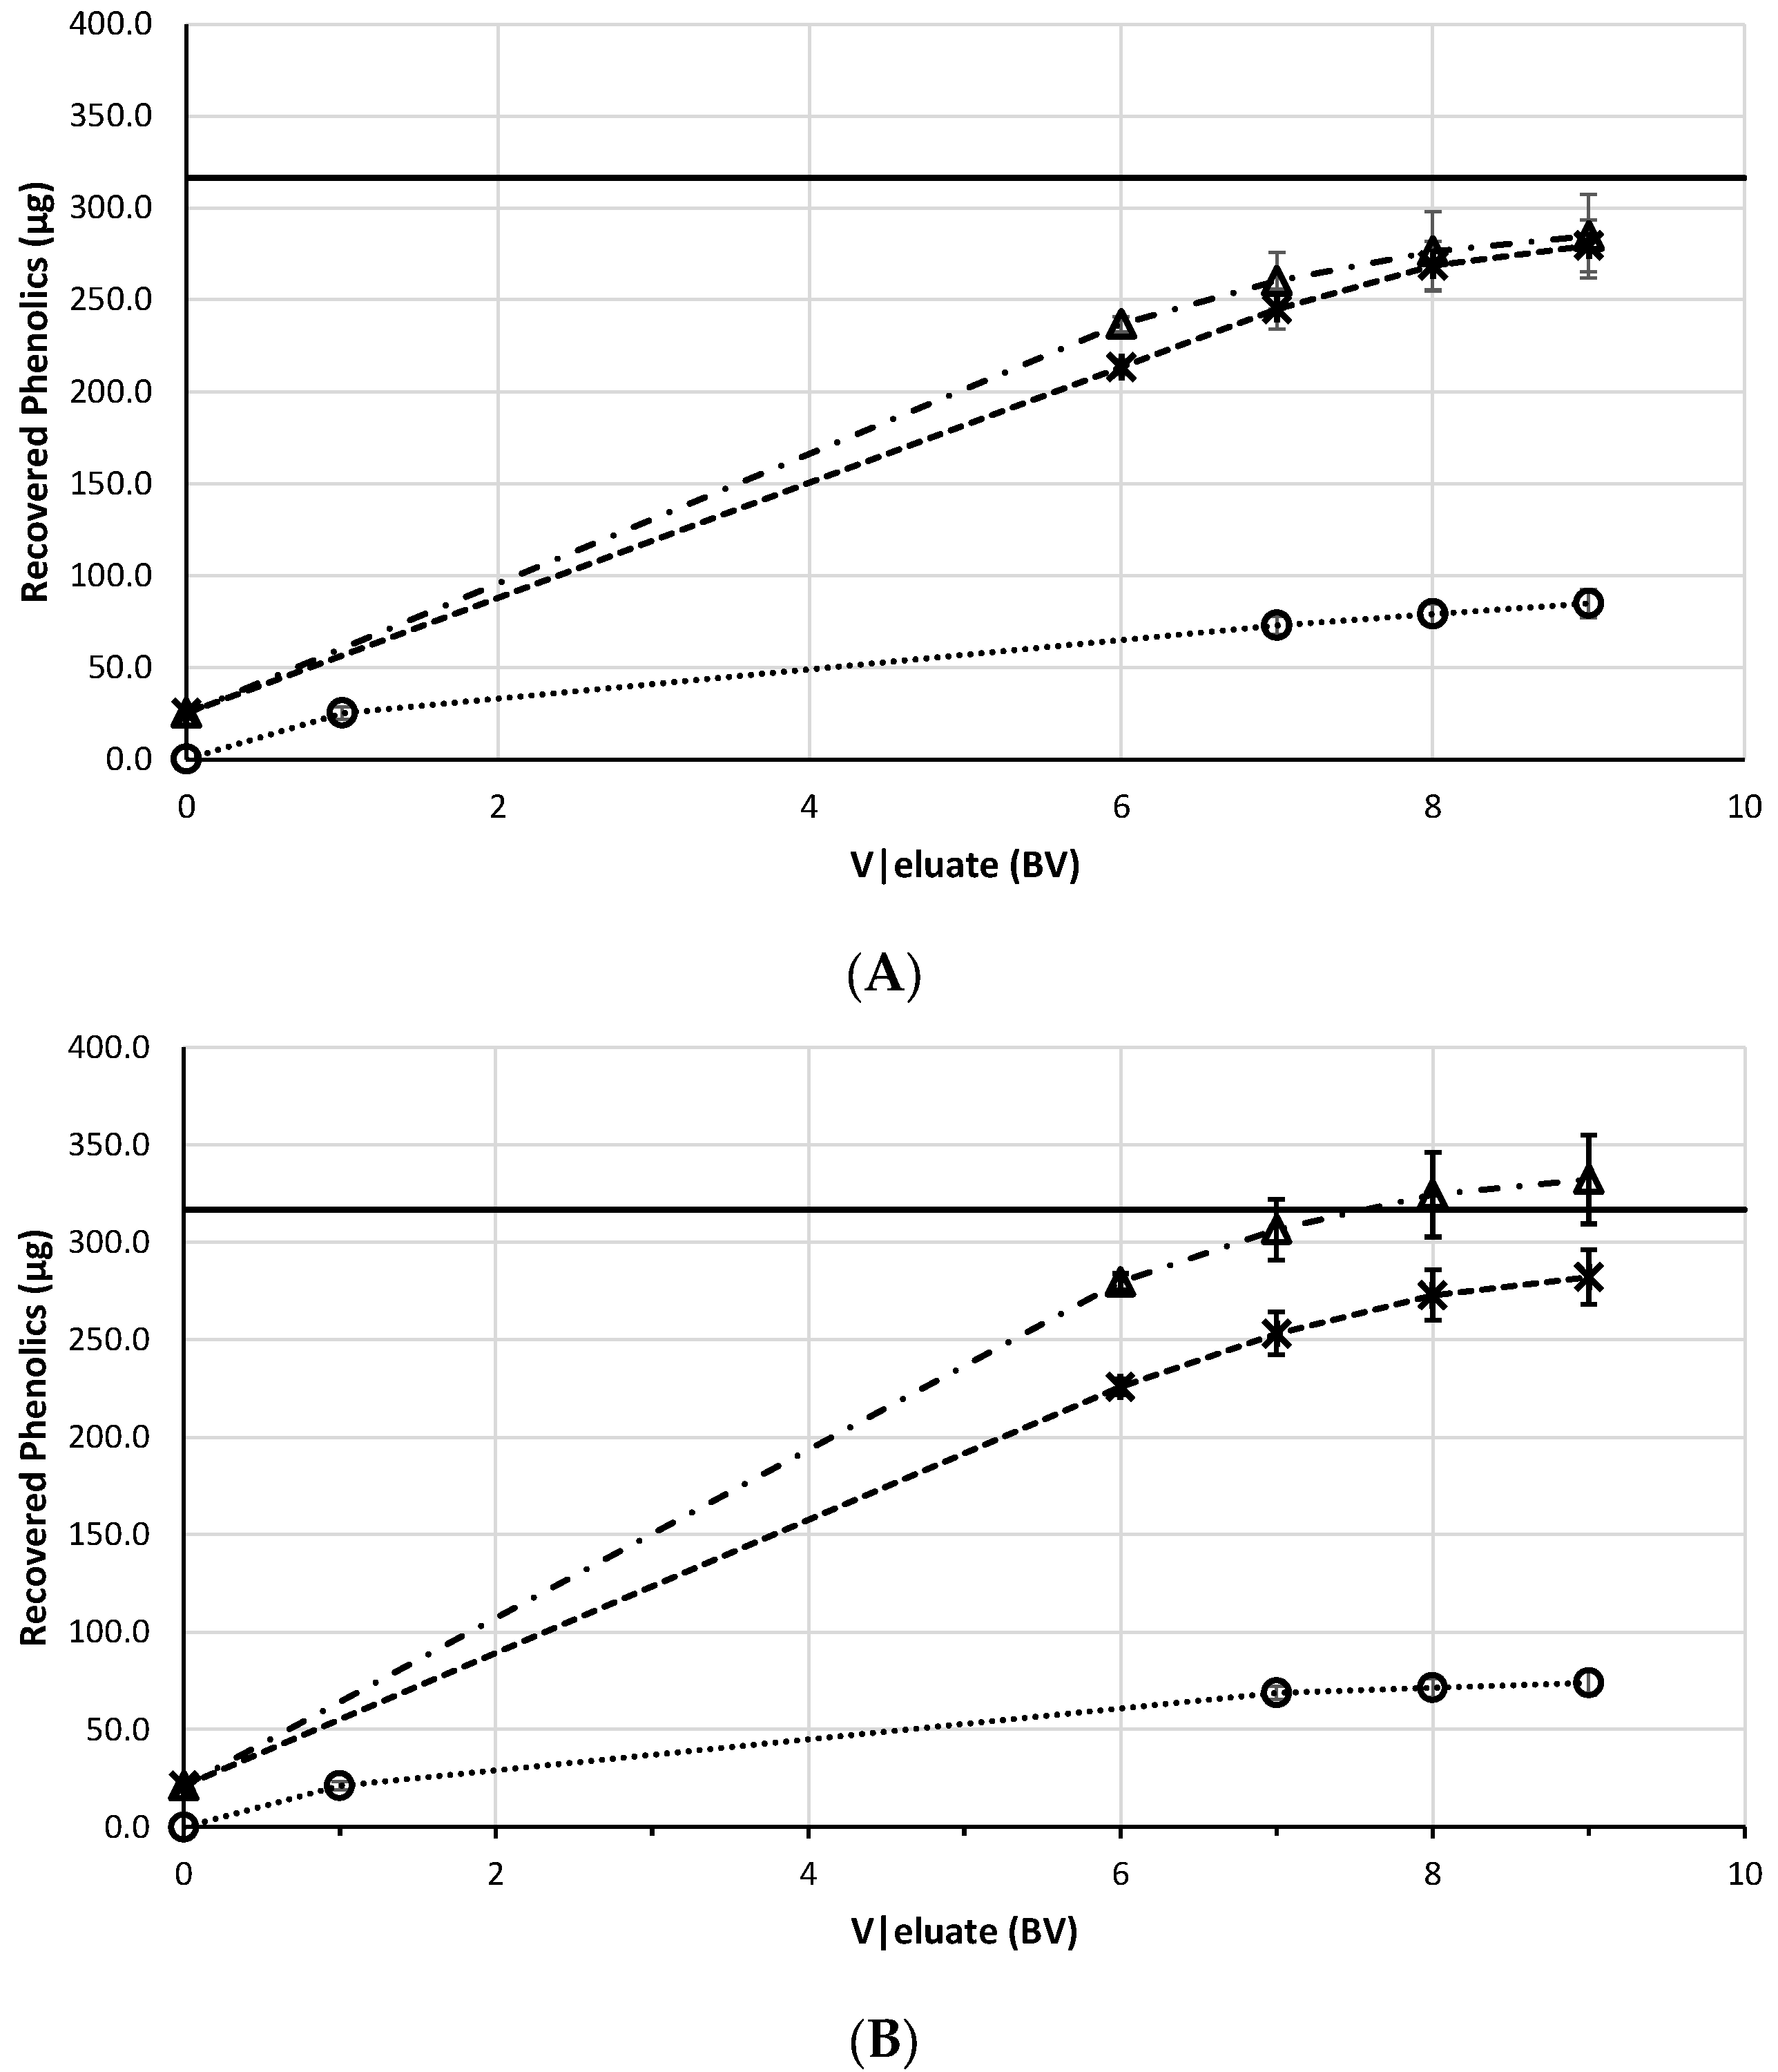
3.2.1. Selection of the Resin and Desorption Agent

A preliminary experiment was conducted, in which phenolic compound adsorption with the two resins, XAD-2 and HP-20, and different desorption solutions were assessed. For this experiment, the phenolic compounds were monitored by LC-MS quantification.
Both resins XAD-2 and HP-20 were efficient in absorbing phenolic compounds, with approximately 80% retention in the resins, 79.4 ± 4.0% and 82.4 ± 5.8% in XAD-2 and HP-20, respectively (with no significant differences between them, p-value = 0.349) when 6 BV of spent broth was eluted (Figure 1).
Regarding the desorption of the phenolic compounds from the resins, water showed very low efficiency, allowing the recovery of only 27.2 ± 2.5% and 28.8 ± 3.1% of the spent broth phenolic compounds from XAD-2 and HP-20 resins, respectively (Figure 2), with no significant differences between them (p-value = 0.228). On the other hand, both ethanol-water 50/50 solution and ethanol were shown to be efficient, allowing the overall recovery of over 80% of the phenolics initially present in the spent broth by applying an eluent volume of at least 7 BV. Nevertheless, ethanol allowed the recovery of more phenolic compounds from both resins, reaching, respectively in the XAD-2 and HP-20, 76.1 ± 1.8% and 89.8 ± 3.9% recovery when 6 BV was applied (same feed eluted volume) (p-value = 0.032), and 83.7 ± 5.4% and 98.4 ± 4.3% when an eluent volume of 7 BV was applied (p-value = 0.048) (Figure 2).
Regarding previous studies with honey, XAD-2 resin extraction with methanol yielded recoveries ranging up to 65.2% [25], and close to 95% [26]. Considering winery wastes, the adsorption yields ranged from 69.2% to 75.2%, with XAD-2 and HP-20 resins, respectively, and the range of recovery using the HP-20 resin was 67% [27]. Considering sugarcane wastewater from bioethanol production, HP-20 resin recovered 74.5% of the wastewater colorants with antioxidant activity [28].
From the results of the absorption and desorption experiments, it was clear that the process with HP-20 resin desorbed with ethanol allowed higher phenolic compound recovery yields; 89.8 ± 2.5% of the identified phenolic acids in the spent broth were recovered (corresponding to 83.4 ± 4.2% of TPC recovery) applying similarly eluted volumes of feed (spent broth) and desorption (ethanol) solution. Thus, the phenolic compound recovery process was further assessed using this combination of resin and desorption solution and settings.

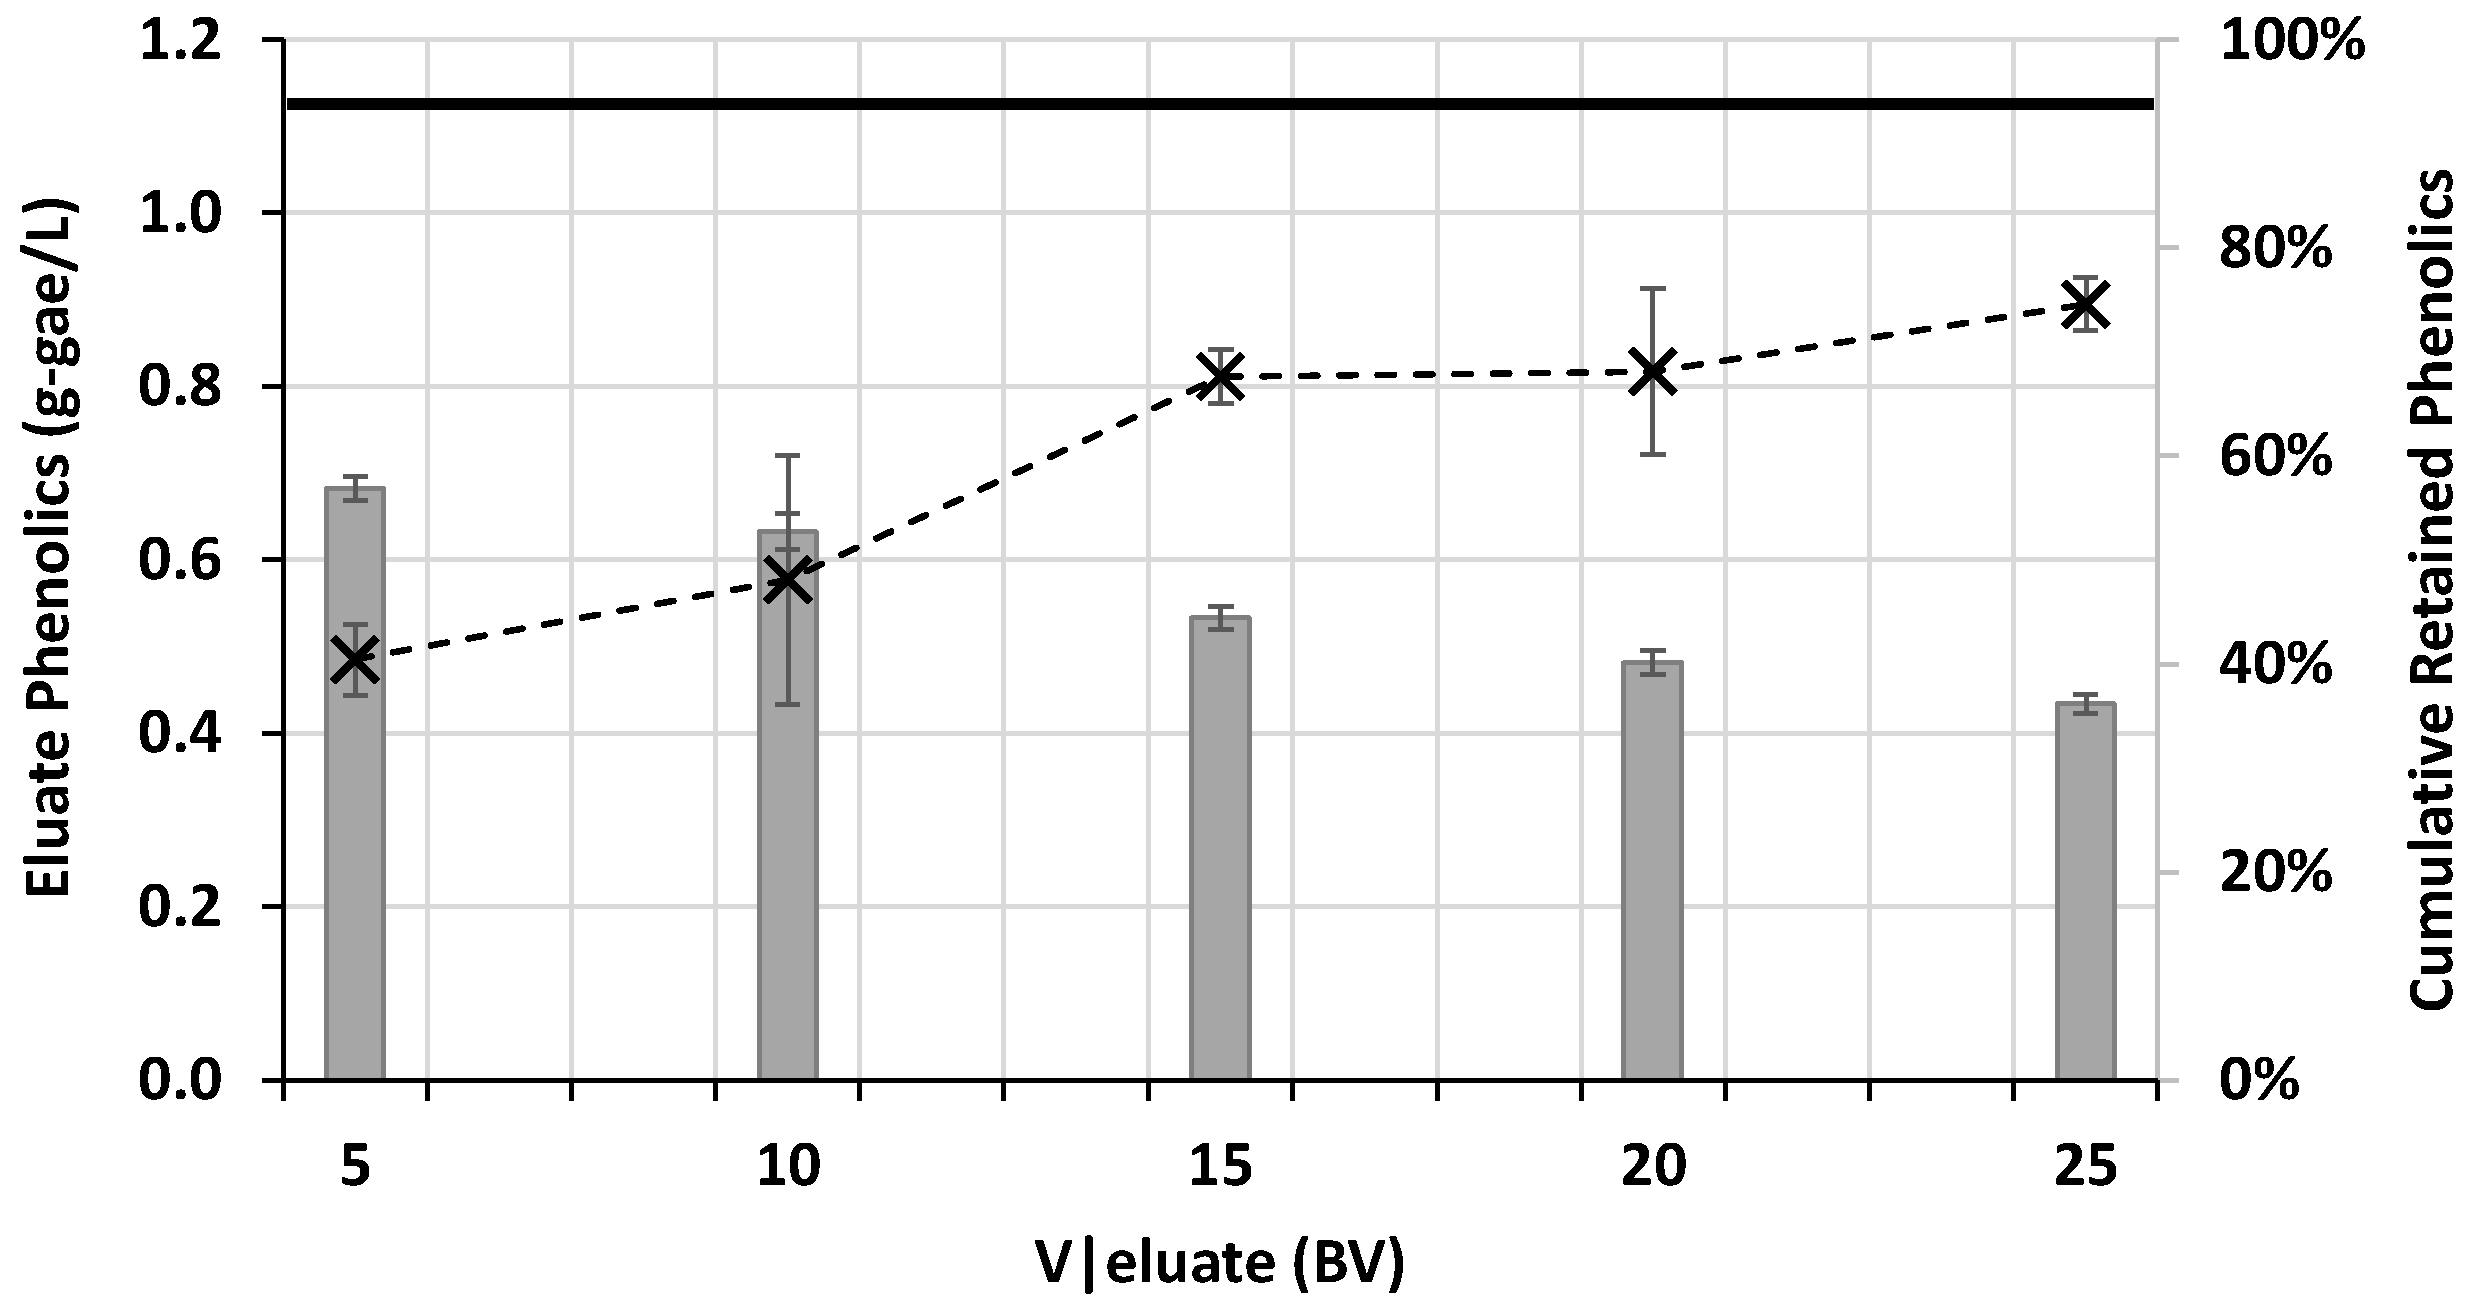
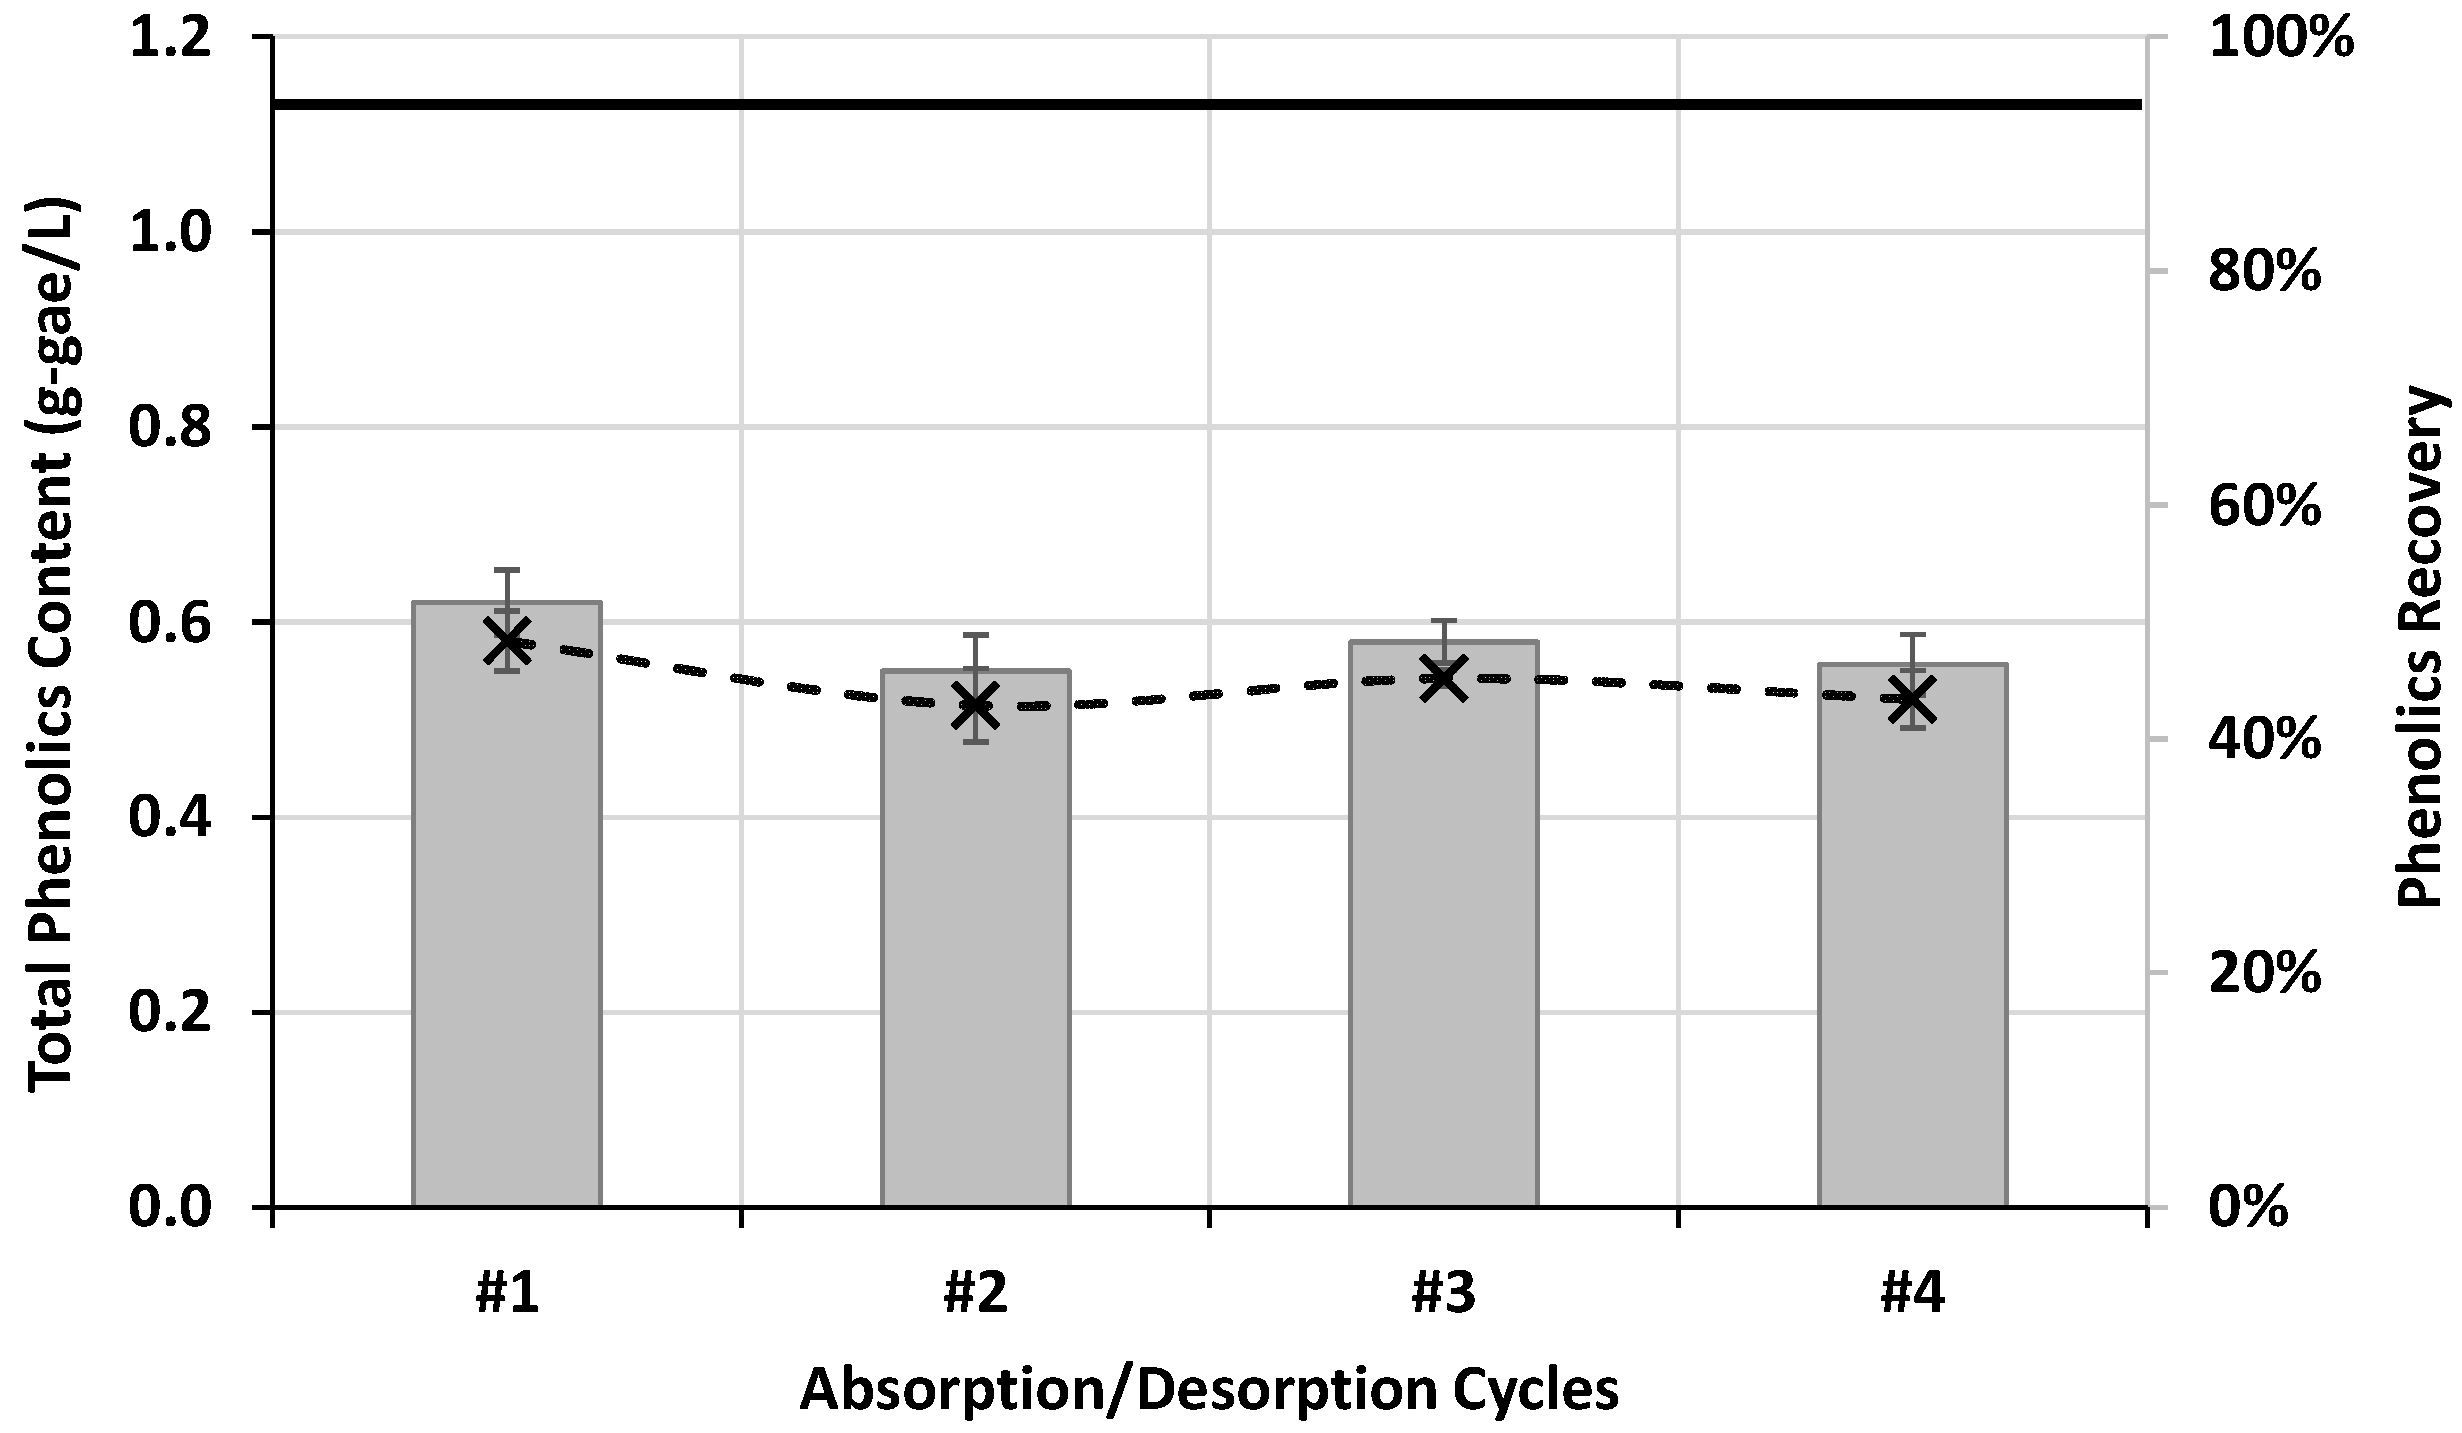
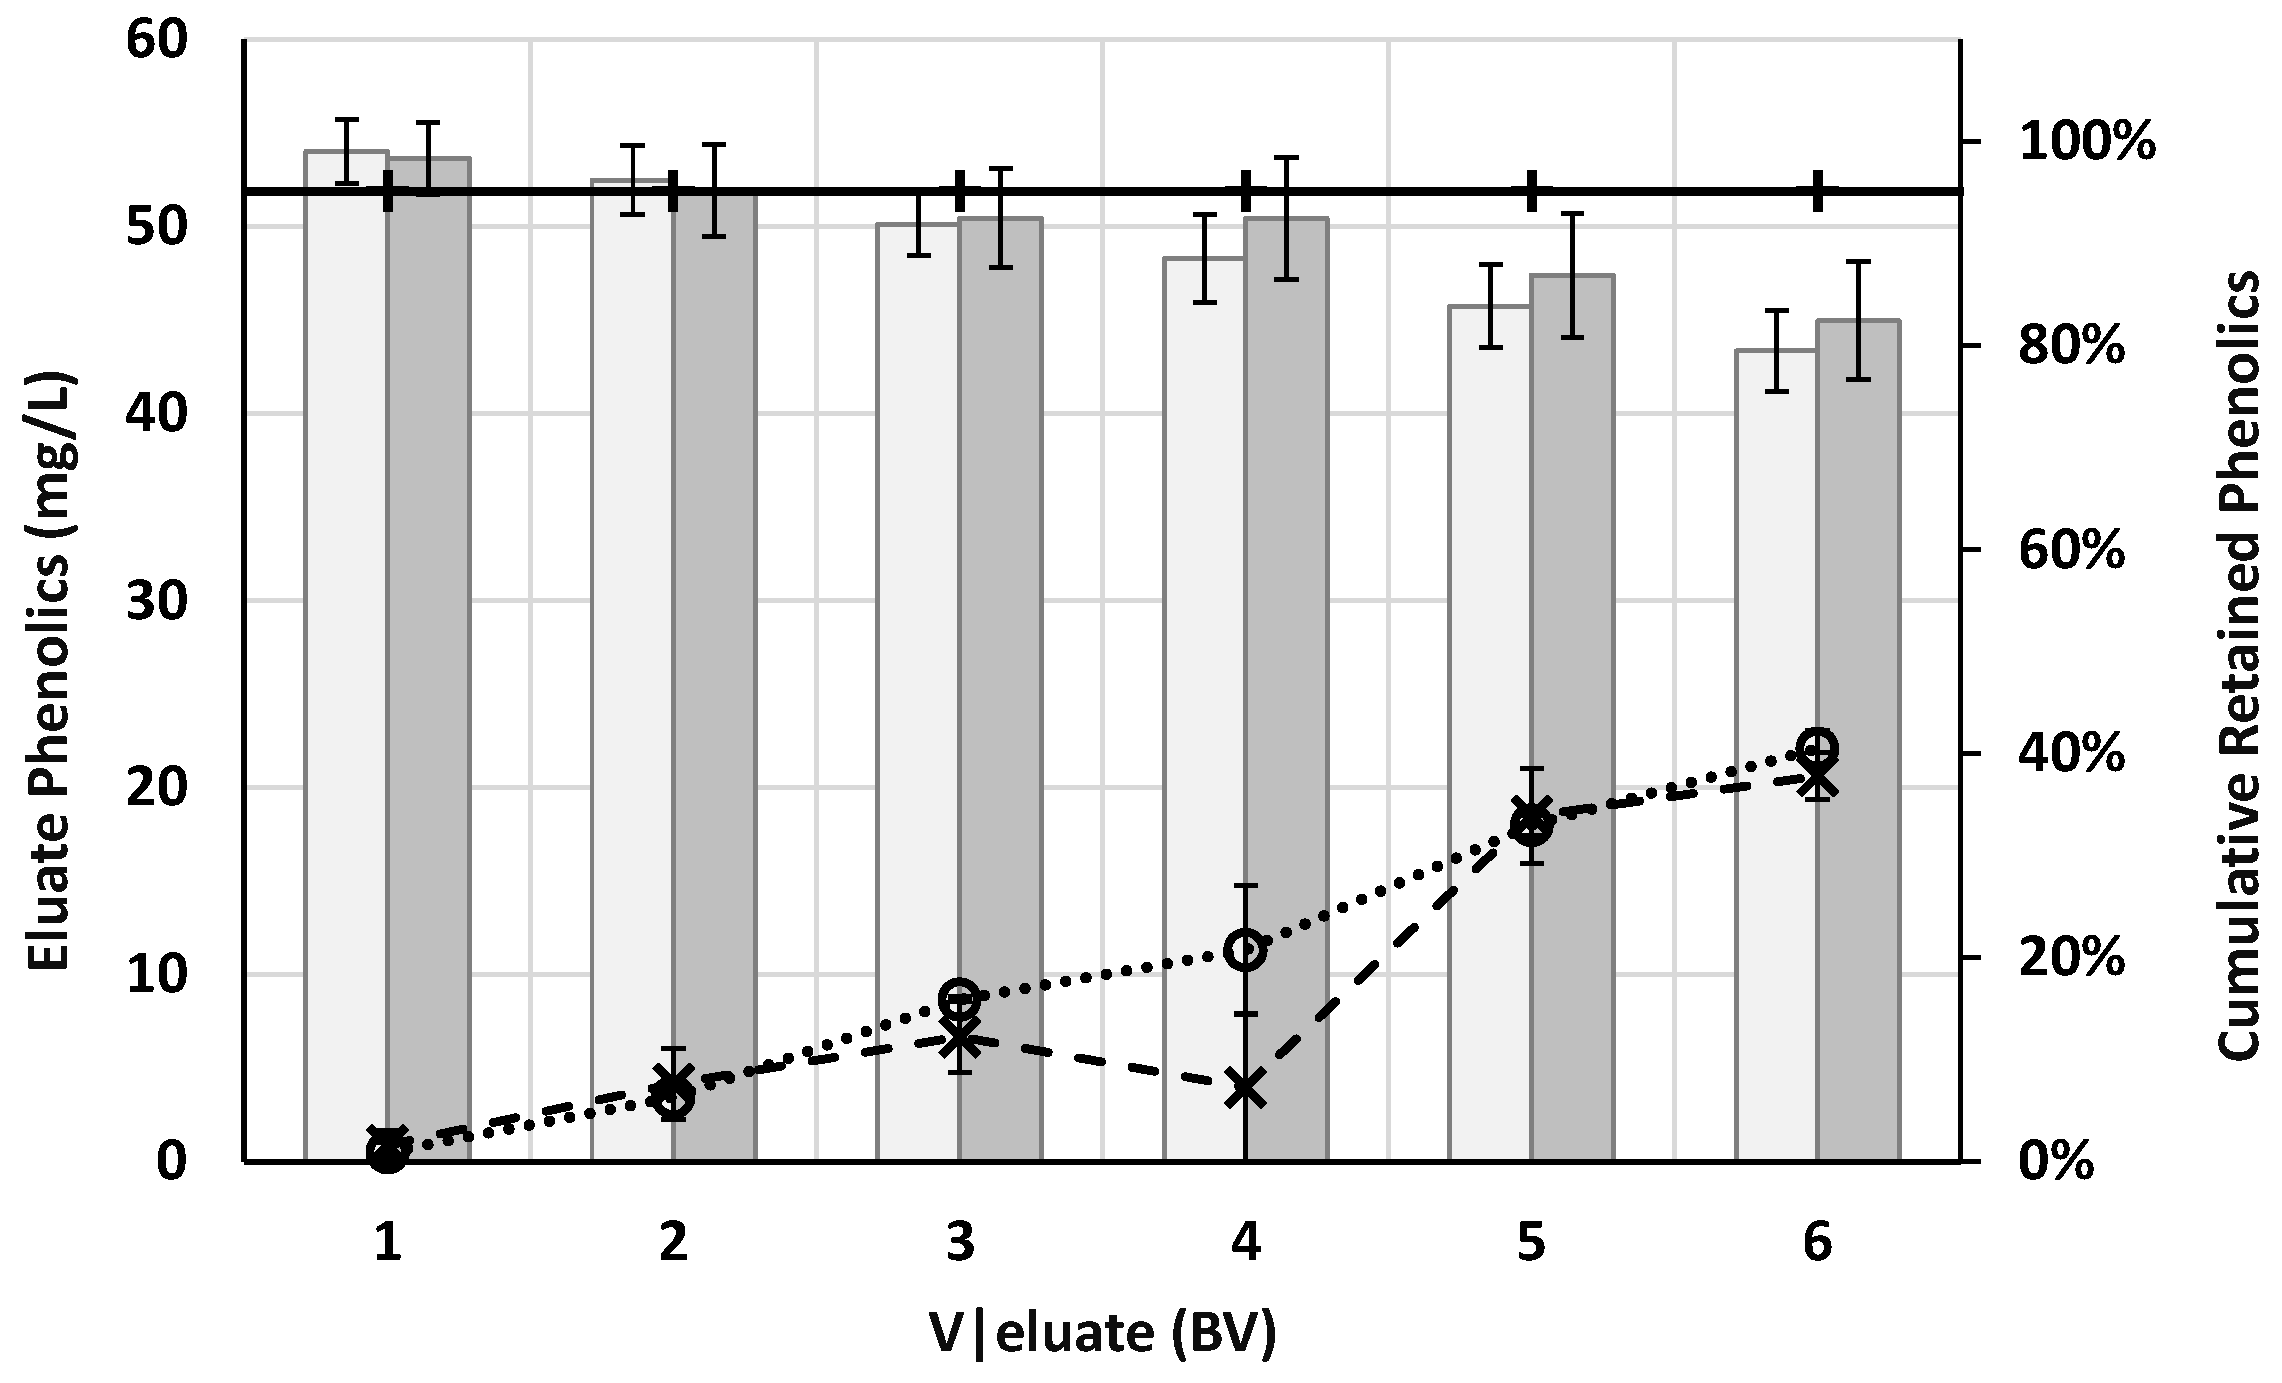
3.2.2. Process Assessment

The process was further assessed to determine the resin’s process cycle. The TPC content was used for monitoring this experiment. The optimum amount of spent broth to be treated in the absorption step was determined by sequentially step-eluting 5 BV (5 mL in 1 g of resin) up to 25 BV (25 mL) of spent broth and thus estimating the quantity of phenolic compounds retained in the resin through the difference in these compounds’ concentrations in the feed and in the eluate (Figure 3). The breakthrough point, set for when the eluate’s TPC content reached 70% of that of the feed, was reached after the elution of 15 BV of spent broth (Figure 3), which was set as the eluent volume for the absorption step. Since the desorption solution used ethanol, one of the possible regenerant solutions applicable for the resin, a regeneration step was not required in the developed process.
The optimization of the number of absorption/desorption cycles was then attempted, applying a set of four absorption/desorption cycles (15 BV each). Indeed, the minimum phenolic compound recovery setpoint was not reached, with the recovery remaining constant at ca. 48% (Figure 4). The obtained ethanolic extracts were dried through ethanol evaporation. The solvent might be recovered and reused in the process; however, this approach was not assessed in this study. The low percentage of phenolics recovery (about 48%) given by the Folin–Ciocalteu methodology might be due to possible interference from proteins in the used analytical methodology. In fact, HP-20 resins recovered about 30% of proteins from the spent broth (results not shown), which might have significantly decreased the final phenolic compounds recovery results. Nevertheless, the optimization of the eluted feed in each resin’s process cycle, 15 BV, as well as the number of absorption/desorption cycles, at least four cycles, was successfully achieved.
The proposed process for the recovery of a phenolic compound-rich extract from spent fermentation broth uses the SPE technique, which is widely used in analytical chemistry for sample preparation [29,30]. SPE industrial applications have been limited to small scale production of particularly high-purity products or to extraordinarily difficult separations [31], despite this being a potentially cost-effective system, since the solid adsorbents tend to be highly reusable, maintaining their function over multiple adsorption/desorption cycles [32]. Previously, SPE was intended for industrial-scale applications under batch mode in a mixed container [33], but column adsorption, as proposed in the present work, has been shown to be more feasible [34]. Additionally, the proposed process uses ethanol, a food-compatible solvent with lower environmental risk than methanol or acetone [35], commonly used as solvents in SPE. Thus, this work contributes to a further, sustainable application of SPE, and ethanol was demonstrated to be efficient and could be recovered in the overall process, suggesting lower operational costs.

3.3. Phenolic-Rich Extract Characterization

3.3.1. Phenolic-Rich Extract Characterization using LC−ESI−UHR−QqTOF−MS

Full characterization of the phenolic-rich extract was tentatively achieved by LC−ESI−UHR−QqTOF−MS in both negative and positive ionization modes. Table 6 and Table 7 present, respectively, the annotated metabolites in negative and positive ionization modes. These annotations were generated using MetaboScape® version 4.0 from Bruker or by comparison with pure standards. The compounds present in the Bruker Metabolite Library exploiting accurate mass match were less than 2 ppm, therefore, less than 0.002 Da (2 mDa), and the isotopic pattern fit (mSigma value) was less than 20. A total of 82 compounds were identified in negative ionization mode, and 15 compounds in positive ionization mode. All compounds are listed in decreasing order of signal intensity. The highest compounds identified in negative ionization mode were the quinoxalines xanthurenic acid and kynurenic acid, along with the phenyllactic and leucinic acids (Table 6), two important antimicrobial compounds [36,37]. The highest compounds identified in positive ionization mode were tricin 7-rhamnosyl-(1->2)-galacturonide, a tricin derivative, two isomers of 6-hydroxyluteolin 6,4′-dimethyl ether 7-rutinoside, and the vitamin riboflavin (Table 7). Organic acids were the main class of compounds identified in the phenolic-rich extract, follow by phenolic compounds, saccharides, peptides and amino acids, and vitamins (Table 6 and Table 7).

3.3.2. Antioxidant Capacity

The resultant phenolic-rich extract’s antioxidant capacity was 914.1 ± 51.6 µmol Trolox equivalents/g-dw (dried weight) and 2764.5 ± 142.8 µmol Trolox equivalents/g-dw for the ABTS and ORAC methodologies, respectively. These values are very high compared to references ORAC USDA-ARS [38] only compared with high-tannin sorghum bran (2400 µmol Trolox equivalents/g), ground cloves (2902.83 µmol Trolox equivalents/g), or sumac raw bran (3124 µmol Trolox equivalents/g).
Besides the high antioxidant activity of the final extract, antimicrobial activity could have also possibly been attained by the presence of specific organic acids such as phenyllactic and leucinic acids [36,37]. In the same way, the amino acids and peptides present play important roles in action as antimicrobial, antithrombotic, antihypertensive, opioid, immunomodulatory, antioxidant, and mineral binding agents [39]. Thus, the attained phenolic-rich extract has bioactive properties that may be interesting in food, cosmetics, and pharmaceutical applications [4,40].

4. Conclusions

The HP-20 resin using ethanol as the desorption solution was selected as the most appropriate process for the recovery of phenolic compounds from the spent broth.
The process consisted of absorption/desorption cycles, comprising: (1) an absorption step, in which 15 BV of spent broth were eluted thought the resin, followed by (2) a desorption/regeneration step, in which 15 BV of ethanol were eluted to recover the phenolic compounds and simultaneously regenerate the resin, and finally (3) a rinse step, in which 1 BV of water was eluted.
The total phenolic compound recovery yield was stable at about 48% during at least 4 cycles, in which 1 BV of resin allowed the treatment of 60 BV of spent broth without decreasing efficiency.
Organic acids were the main class of compounds identified in the phenolic-rich extract, follow by phenolic compounds, saccharides, and peptides, and the extract presented high antioxidant capacity.
This work demonstrated a potential practical valorization for developing bio-derived products of increased value from the spent Biofene® fermentation broth stream. The product characterization revealed interesting nutrients and bioactivities, suggesting potential for use in food, cosmetics, and pharmaceutical applications.

Author Contributions

Conceptualization, C.M.O. and C.S.S.O.; methodology, C.M.O. and C.S.S.O.; validation, C.M.O. and C.S.S.O.; formal analysis, C.M.O.; investigation, C.M.O., B.H. and T.L.; data curation, C.M.O. and B.H.; writing—original draft preparation, C.M.O. and C.S.S.O.; writing—review and editing, C.M.O. and C.S.S.O.; visualization, C.M.O. and C.S.S.O.; supervision, C.S.S.O.; project administration, C.S.S.O. and M.P.; funding acquisition, M.P. All authors have read and agreed to the published version of the manuscript.

Funding

This work was supported by Amyris Bio Products Portugal Unipessoal Lda. and Escola Superior de Biotecnologia–Universidade Católica Portuguesa through the Alchemy project—Capturing high value from industrial fermentation bio products (POCI-01−0247-FEDER-027578).

Conflicts of Interest

The authors declare no conflict of interest.

References

  1. Marques de Oliveira, C.M.D. Pathways of Oxidative Degradation of Wine. Ph.D. Thesis, Universidade de Aveiro, Aveiro, Portugal, 2014. [Google Scholar]
  2. Kumar, S.; Pandey, A.K. Chemistry and Biological Activities of Flavonoids: An Overview. Sci. World J. 2013, 2013, 162750. [Google Scholar] [CrossRef] [PubMed] [Green Version]
  3. Durazzo, A.; Lucarini, M.; Souto, E.B.; Cicala, C.; Caiazzo, E.; Izzo, A.A.; Novellino, E.; Santini, A. Polyphenols: A concise overview on the chemistry occurrence and human health. Phytother. Res. 2019, 33, 2221–2243. [Google Scholar] [CrossRef] [PubMed] [Green Version]
  4. Albuquerque, B.R.; Heleno, S.A.; Oliveira, M.B.P.P.; Barros, L.; Ferreira, I.C.F.R. Phenolic compounds: Current industrial applications. limitations and future challenges. Food Funct. 2021, 12, 14–29. [Google Scholar] [CrossRef] [PubMed]
  5. Caleja, C.; Ribeiro, A.; Barreiro, M.F.; Ferreira, I.C.F.R. Phenolic compounds as nutraceuticals or functional food ingredients. Curr. Pharm. Des. 2017, 23, 2787–2806. [Google Scholar] [CrossRef] [PubMed]
  6. Alara, O.R.; Abdurahman, N.H.; Ukaegbu, C.I. Extraction of phenolic compounds: A review. Curr. Res. Nutr. Food Sci. 2021, 4, 200–214. [Google Scholar] [CrossRef]
  7. Shams, K.A.; Abdel-Azim, N.S.; Saleh, I.A.; Hegazy, M.-E.F.; El-Missiry, M.M.; Hammouda, F.M. Green technology: Economically and environmentally innovative methods for extraction of medicinal & aromatic plants (MAP) in Egypt. J. Chem. Pharm. Res. 2015, 7, 1050–1074. [Google Scholar]
  8. Alara, O.R.; Abdurahman, N.H.; Ukaegbu, C.I. Soxhlet extraction of phenolic compounds from Vernonia cinerea leaves and its antioxidant activity. J. Appl. Res. Med. Aromat. Plants 2018, 11, 12–17. [Google Scholar] [CrossRef]
  9. Alara, O.R.; Abdurahman, N.H.; Ukaegbu, C.I.; Azhari, N.H. Vernonia cinerea leaves as the source of phenolic compounds. antioxidants and anti-diabetic activity using microwave-assisted extraction technique. Ind. Crops Prod. 2018, 122, 533–544. [Google Scholar] [CrossRef]
  10. O’Hara, I.M. The Sugarcane Industry, Biofuel, and Bioproduct Perspectives. In Sugarcane-Based Biofuels and Bioproducts, 1st ed.; O’Hara, I., Sagadevan, M., Eds.; John Wiley & Sons: Hoboken, NJ, USA, 2016; p. 4. [Google Scholar]
  11. Duarte-Almeida, J.M.; Novoa, A.V.; Linares, A.F.; Lajolo, F.M.; Genovese, M.I. Antioxidant Activity of Phenolics Compounds from Sugar Cane (Saccharum officinarum L.). Juice. Plant Foods Hum. Nutr. 2006, 61, 187–192. [Google Scholar] [CrossRef]
  12. Martini, C.; Verruma-Bernardi, M.R.; Borges, M.T.M.R.; Margarido, L.A.C.; Ceccato-Antonini, S.R. Yeast Composition of Sugar Cane Juice in Relation to Plant Varieties and Seasonality. Biosci, J. Uberlândia 2011, 27, 710–717. [Google Scholar]
  13. Thao, N.T.; Tuan, H.Q. Recovering Bioactive Compounds from Cane Sugar Wastes, 1st ed.; Nguyen, V.T., Ed.; John Wiley & Sons Ltd.: Hoboken, NJ, USA, 2017. [Google Scholar]
  14. Luz, D.A.; Gomes, A.C.C.; Simas, N.K.; Heringer, O.A.; Romão, W.; Lovatti, B.P.O.; Scherer, R.; Filgueiras, P.R.; Kuster, R.M. Sugarcane waste products as source of phytotoxic compounds for agriculture. Int. J. Recycl. Org. Waste Agric. 2020, 9, 385–397. [Google Scholar] [CrossRef]
  15. Rodrigues, N.P.; Brochier, B.; de Medeiros, J.K.; Marczak, L.D.F.; Mercali, G.D. Phenolic profile of sugarcane juice: Effects of harvest season and processing by ohmic heating and ultrasound. Food Chem. 2021, 347, 129058. [Google Scholar] [CrossRef] [PubMed]
  16. Da Gama, R.; Petrides, D. Production of Farnesene (a Terpene) via Fermentation-Process Modeling and Techno-Economic Assessment (TEA) using SuperPro Designe; Intelligen Inc.: Scotch Plains, NJ, USA, 2020. [Google Scholar]
  17. Jimenez, A.M.; Borja, R.; Martín, A.; Raposo, F. Kinetic analysis of the anaerobic digestion of untreated vinasses and vinasses previously treated with Penicillium decumbens. J. Environ. Manage. 2006, 80, 303–310. [Google Scholar] [CrossRef] [PubMed]
  18. Siles, J.A.; García-García, I.; Martín, A.; Martín, M.A. Integrated ozonation and biomethanization treatments of vinasse derived from ethanol manufacturing. J. Hazard. Mater. 2011, 188, 247–253. [Google Scholar] [CrossRef]
  19. García-García, I.; Bonilla-Venceslada, J.L.; Jiménez-Peña, P.R.; Ramos-Gómez, E. Biodegradation of phenol compounds in vinasse using Aspergillus terreus and Geotrichum candidum. Water Res. 1997, 31, 2005–2011. [Google Scholar] [CrossRef]
  20. Bhattacharyya, A.; Pramanik, A.; Maji, S.K.; Haldar, S.; Mukhopadhyay, U.K.; Mukherjee, J. Utilization of vinasse for production of poly-3-(hydroxybutyrate-co-hydroxyvalerate) by Haloferax mediterranei. AMB Express 2012, 2, 24–34. [Google Scholar] [CrossRef] [Green Version]
  21. Coelho, M.; Pereira, R.; Rodrigues, A.S.; Teixeira, J.A.; Pintado, M.E. Extraction of tomato by-products’ bioactive compounds using ohmic technology. Food Bioprod. Process. 2019, 117, 329–339. [Google Scholar] [CrossRef] [Green Version]
  22. Oliveira, C.M.; Barros, A.S.; Silva Ferreira, A.C.; Silva, A.M.S. Influence of the temperature and oxygen exposure in red Port wine: A kinetic approach. Food Res. Int. 2015, 75, 337–347. [Google Scholar] [CrossRef]
  23. Gião, M.S.; González-Sanjosé, M.L.; Rivero-Pérez, M.D.; Pereira, C.I.; Pintado, M.E.; Malcata, F.X. Infusions of Portuguese medicinal plants: Dependence of final antioxidant capacity and phenol content on extraction features. J. Sci. Food Agric. 2007, 87, 2638–2647. [Google Scholar] [CrossRef]
  24. Coscueta, E.R.; Campos, D.A.; Osório, H.; Nerli, B.B.; Pintado, M. Enzymatic soy protein hydrolysis: A tool for biofunctional food ingredient production. Food Chem. X 2019, 1, 100006. [Google Scholar] [CrossRef]
  25. An, C.Y.; Hossain, M.; Alam, F.; Islam, A.; Khalil, I.; Alam, N.; Gan, S.H. Efficiency of Polyphenol Extraction from Artificial Honey Using C18 Cartridges and Amberlite® XAD-2 Resin: A Comparative Study. J. Chem. 2016, 2016, 8356739. [Google Scholar] [CrossRef] [Green Version]
  26. Weston, R.J.; Brocklebank, L.K.; Lu, Y. Identification and quantitative levels of antibacterial components of some New Zealand honeys. Food Chem. 2000, 70, 427–435. [Google Scholar] [CrossRef]
  27. Soto, M.L.; Conde, E.; González-López, N.; Conde, M.J.; Moure, A.; Sineiro, J.; Falqué, E.; Domínguez, H.; Núñez, M.J.; Parajó, J.C. Recovery and Concentration of Antioxidants from Winery Wastes. Molecules 2012, 17, 3008–3024. [Google Scholar] [CrossRef]
  28. Sakaki, K.; Habe, H.; Ikegami, T.; Yanagishita, T. Separation and Functional Evaluation of Dark Brown Colorants in Distillery Wastewater from a Sugarcane-Molasses-Derived Bioethanol Production Process. J. Water Environ. Technol. 2014, 12, 407–420. [Google Scholar] [CrossRef] [Green Version]
  29. Câmara, J.S.; Perestrelo, R.; Berenguer, C.V.; Andrade, C.F.; Gomes, T.M.; Olayanju, B.; Kabir, A.; Rocha, C.M.R.; Teixeira, J.A.; Pereira, J.A. Green Extraction Techniques as Advanced Sample Preparation Approaches in Biological, Food, and Environmental Matrices: A Review. Molecules 2022, 27, 2953. [Google Scholar] [CrossRef] [PubMed]
  30. Keçili, R.; Büyüktiryaki, S.; Dolak, İ.; Hussain, C.M. The Use of Magnetic Nanoparticles in Sample Preparation Devices and Tools. In Handbook of Nanomaterials in Analytical Chemistry: Modern Trends in Analysis; Hussain, C.M., Ed.; Elsevier: Amsterdam, The Netherlands, 2020; pp. 75–95. [Google Scholar] [CrossRef]
  31. Brewer, A.; Flokrek, J.; Kleitz, F. A perspective on developing solid-phase extraction technologies for industrial-scale critical materials recovery. Green Chem. 2022, 24, 2753–2765. [Google Scholar] [CrossRef]
  32. Sunder, G.S.S.; Adhikari, S.; Rohanifar, A.; Poudel, A.; Kirchhoff, J.R. Evolution of environmentally friendly strategies for metal extraction. Separations 2020, 7, 4. [Google Scholar] [CrossRef] [Green Version]
  33. Scoma, A.; Pintucci, C.; Bertin, L.; Carlozzi, P.; Fava, F. Increasing the large-scale feasibility of a solid phase extraction procedure for the recovery of natural antioxidants from olive mill wastewaters. Chem. Eng. J. 2012, 198–199, 103–109. [Google Scholar] [CrossRef]
  34. Pavel, H. Comparison of batch and fixed bed column adsorption: A critical review. Int. J. Environ. Sci. Technol. 2021, 2021, 1–18. [Google Scholar] [CrossRef]
  35. Yilmaz, E.; Soylak, M. Type of Green Solvents Used in Separation and Preconcentration Methods. In New Generation Green Solvents for Separation and Preconcentration of Organic and Inorganic Species; Soylak, M., Yilmaz, E., Eds.; Elsevier: Amsterdam, The Netherlands, 2020; pp. 207–266. [Google Scholar] [CrossRef]
  36. Rajanikar, R.V.; Nataraj, B.H.; Naithani, H.; Ali, S.A.; Panjagari, N.R.; Behare, P.V. Phenyllactic Acid: A green compound for food. Food Control 2021, 128, 108184. [Google Scholar] [CrossRef]
  37. Pahalagedara, A.S.N.W.; Flint, S.; Palmer, J.; Brightwell, G.; Gupta, T.B. Antibacterial efficacy and possible mechanism of action of 2-hydroxyisocaproic acid (HICA). PLoS ONE 2022, 17, e0266406. [Google Scholar] [CrossRef] [PubMed]
  38. Haytowitz, D.B.; Bhagwat, S. USDA Database for the Oxygen Radical Absorbance Capacity (ORAC) of Selected Foods, Release 2; US Department of Agriculture: Washington, DC, USA, 2010; pp. 10–41. [Google Scholar]
  39. Sánchez, A.; Vázquez, A. Bioactive peptides: A review. Food Qual. Saf. 2017, 1, 29–46. [Google Scholar] [CrossRef]
  40. Kalasariya, H.S.; Patel, N.B.; Yadav, A.; Perveen, K.; Yadav, V.K.; Munshi, F.M.; Yadav, K.K.; Alam, S.; Jung, Y.-K.; Jeon, B.-H. Characterization of Fatty Acids, Polysaccharides, Amino Acids, and Minerals in Marine Macroalga Chaetomorpha crassa and Evaluation of Their Potentials in Skin Cosmetics. Molecules 2021, 26, 7515. [Google Scholar] [CrossRef] [PubMed]
Figure 1. Phenolic compound concentrations (mg/L) in the eluates (lines) and corresponding percentages of phenolics cumulative retention (columns) in resin XAD-2 (○, lighter grey) and HP-20 (x, darker grey) for the different eluted volumes (V|eluate). Solid line marks the phenolic compounds concentration in the spent broth.
Processes 10 01339 g001
Figure 2. Amount of recovered phenolic compounds (µg) using different desorption solutions: water (○), 50/50 ethanol-water mixture (x), and ethanol (Δ), in resins XAD-2 (A) and HP-20 (B). Solid line marks the maximum amount of phenolic compounds, considering the eluted feed (6 BV of spent broth).
Processes 10 01339 g002
Figure 3. Total phenolic compounds (TPC) in the eluate (x, dashed line) and corresponding percentage of phenolics cumulative retention (column) in the HP-20 resin for the different eluted volumes (V|eluate). Solid line marks the maximum amount of phenolic compounds, considering the eluted feed.
Processes 10 01339 g003
Figure 4. Phenolic compounds (TPC) in the recovered extracts (x, dashed line) and corresponding percentage of phenolics recovery (columns) in four absorption/desorption cycles of 15 BV in the HP-20 resin. Solid line marks the maximum amount of phenolic compounds, considering the eluted feed.
Processes 10 01339 g004
Table 1. Physicochemical characteristics of the commercial resins used for the recovery of phenolic compounds.
Resin IDXAD-2HP-20
Brand (Grade name)Amberlite® XAD®-2Diaion® HP-20
MatrixStyrene-divinylbenzenePolystyrene/divinylbenzene
Surface area (m2/g)330600
Pore radius (Å)90260
Particle size (mm)0.25–0.840.25–0.60
Density (g/mL)1.021.01
Table 2. Mobile phase gradient program.
Time (min)Phase A 1 (%)
Ionization Mode
NegativePositive
0.010095
10.079-
14.0735
18.3425
20.005
22.0095
24.0095
24.110095
26.010095
1 Phase A (Water 0.1% formic acid); Phase B (Acetonitrile 0.1% formic acid).
Table 3. Source and tune parameters.
Ionization Mode
NegativePositive
End plate offset voltage (V)500500
Capillary voltage (V)30004500
Drying gas temperature (°C)200220
Drying gas flow (L/min)8.09.0
Nebulizing gas pressure (bar)2.00.6
Table 4. Retention times (RT), m/z ([M-H]), slope, intercept, and linear range of phenolic compound standards.
Phenolic CompoundRT (min)[M-H]SlopeInterceptLinear Range
(mg/L)
Gallic acid4.40169.01325634381112330.02–1.00
Protocatechuic acid6.03153.0172665367909880.02–1.00
Neochlorogenic acid6.73353.08830569521013950.02–1.00
Xanthurenic acid7.04204.02927283921413300.02–1.00
Kynurenic acid7.67188.03424676551677250.02–1.00
Gentisic acid7.78153.01728188741762640.02–1.00
Chlorogenic acid8.21353.0843299726441990.02–1.00
Dihydrocaffeic acid8.42181.04932249831781430.02–1.00
Cryptochlorogenic acid8.46353.0842951195454910.02–1.00
Vanillic acid8.81167.033226048106860.02–1.00
Caffeic acid8.95179.03344759632010120.02–1.00
Syringic acid9.28197.043412367237150.02–1.00
Vanillin10.52151.03833246212810.02–1.00
Schaftoside10.56563.1403318783579860.02–1.00
Isoorientin10.77447.09316645751892450.02–1.00
Isoschaftoside10.80563.1413141630576870.02–1.00
p-Coumaric acid10.85163.03838842671799520.02–1.00
Orientin10.86447.09329541711377520.02–1.00
Vitexin11.68431.0983187049556120.02–1.00
Vitexin-2″-O-rhamnoside11.71577.1561836598236190.02–1.00
Ferulic acid11.73193.04917693451192850.02–1.00
Isoferulic acid12.10193.049916475632470.02–1.00
Luteolin-4′-O-glucoside13.65447.0934435319290970.02–1.00
Prunin14.20433.1142131750260770.02–1.00
Luteolin16.74285.040130115251585180.02–1.00
Naringenin17.82271.07065062561628530.02–1.00
Apigenin17.91269.04586554942359130.02–1.00
Diosmetin18.13299.05593904461243750.02–1.00
Table 5. Phenolic compound classes and content in the spent broth.
Phenolic Compound ClassesConcentration
(mg/L)
Phenolic Compounds
Hydroxybenzoic acids17.29 ± 0.38Gallic acid; Protocatechuic acid; Syringic acid; Gentisic acid; Dihydrobenzoic acid derivative; and Vanillic acid
Flavone glycosides2.45 ± 0.10Schaftoside; Isoschaftoside; Orientin; Isoorientin; Vitexin; and Vitexin-2″-O-rhamnoside
Hydroxycinnamic acids1.88 ± 0.06Caffeic acid; Caffeic acid derivative; p-Coumaric acid; p-Coumaroylmalic acid isomer I; p-Coumaroylmalic acid isomer II; Ferulic acid; Isoferulic acid; Feruloylquinic acid isomer I;ewº+’« Feruloylquinic acid isomer I; and Dihydrocaffeic acid
Chlorogenic acids1.35 ± 0.02Feruloylquinic acid isomer I; Feruloylquinic acid isomer II; cis-5-O-p-Coumaroylquinic acid; Neochlorogenic acid; Criptochlorogenic acid; and Chlorogenic acid
Flavones0.03 ± 0.00Luteolin; Apigenin; Tricin; and Diosmetin
Flavanones0.01 ± 0.00Naringenin
Table 6. Phenolic-rich extract characterization in negative ionization mode (From MetaboScape®, ordered by decrease order of signal intensity).
Rt
(min)
m/zNegative Mode
Ions
NameMolecular
Formula
mSigmaMS/MS
Score
Class
7.04204.029[M-H]Xanthurenic acidC10H7NO44.5986.2Organic acid
7.67188.034[M-H]Kynurenic acidC10H7NO34.1992.8Organic acid
11.13165.054[M-H]. [M+Cl]Phenyllactic acidC9H10O30.5984.6Organic acid
9.75131.070[M-H]Leucinic acidC6H12O30.6908.6Organic acid
6.33117.054[M-H]2-Hydroxy-2-methylbutyric acidC5H10O31.0982.5Organic acid
11.14195.065[M-H]Homoveratric acidC10H12O40.7920.1Organic acid
10.56563.140[M-H]. [M-H-H2O]SchaftosideC26H28O143.7910.2Phenolic
8.42181.049[M-H]3,4-Dihydroxyhydrocinnamic acid (Dihydrocaffeic acid)C9H10O40.7937.1Phenolic
7.76137.022[M-H]4-Hydroxibenzoic acidC7H6O30.2999.7Phenolic
7.82175.060[M-H]2-Isopropylmalic acidC7H12O50.8901.6Organic acid
6.96181.049[M-H]Hydroxyphenyllactic acid isomer IC9H10O40.6857.1Organic acid
11.56206.081[M-H]N-Acetyl-D-phenylalanineC11H13NO33.1842.9AA
12.40245.092[M-H]N-Acetyl-DL-tryptophanC13H14N2O32.5920.0AA
1.94117.018[M-H]Succinic acidC4H6O44.1942.3Organic acid
9.01153.018[M-H]Dihydroxybenzoic acid derivativeC7H6O40.5737.5Phenolic
1.7489.023[M-H]Lactic acidC3H6O36.3979.4Organic acid
7.18109.028[M-H]PyrocatecholC6H6O27.0939.6Phenolic
9.28197.043[M-H]Syringic acidC9H10O54.7972.6Phenolic
1.57191.054[M-H]Quinic acid isomer IC7H12O68.7884.2Organic acid
4.68195.065[M-H]AcetosyringoneC10H12O42.2636.8Phenolic
1.53179.054[M-H]β-D-GalactopyranoseC6H12O68.5913.4Saccharide
8.53179.034[M-H]Acetylsalicylic acidC9H8O47.6870.5Organic acid
3.84147.065[M-H]Mevalonic acid isomer IC6H12O42.4992.8Organic acid
7.78153.017[M-H]Gentisic acidC7H6O41.0996.8Phenolic
8.81167.033[M-H]Vanillic acidC8H8O46.8963.9Phenolic
9.15137.023[M-H]p-Salicylic acid isomer IC7H6O37.3982.6Organic acid
13.76137.023[M-H]Salicylic acidC7H6O34.8998.6Organic acid
1.78179.052[M-H]D-TagatoseC6H12O613.3727.3Saccharide
7.30222.076[M-H]Acetyl-L-tyrosine isomer IC11H13NO42.0793.5AA
6.03153.017[M-H]Protocatechuic acidC7H6O40.4979.6Phenolic
11.80613.214[M-H]Galα1-4Galβ1-4GlcNacβ-SpC22H38N4O1616.5673.0Saccharide
11.71577.156[M-H]Vitexin-2″-O-rhamnosideC27H30O143.4980.2Phenolic
8.78159.065[M-H]Pimelic acidC7H12O48.4842.0Organic acid
13.90187.096[M-H]Nonanedioic acidC9H16O41.0818.5Organic acid
12.14204.065[M-H]Indolelactic acidC11H11NO37.8793.8Organic acid
11.68431.098[M-H]VitexinC21H20O1015.1947.4Phenolic
7.62194.045[M-H]N-Acetyl-5-aminosalicylic acidC9H9NO47.9875.2Organic acid
10.43172.097[M-H]Acetyl-DL-Leucine isomer IC8H15NO34.4922.8AA
8.75177.018[M-H]. [M+Cl]EsculetinC9H6O47.3802.5Phenolic
17.82271.060[M-H]NaringeninC15H12O56.4899.8Phenolic
17.94357.133[M-H]MatairesinolC20H22O610.0934.9Lignan
1.82103.002[M-H]. [M+Cl]β-Hydroxypyruvic acidC3H4O45.0901.5Organic acid
8.95179.033[M-H]Caffeic acidC9H8O42.0964.2Phenolic
18.13299.055[M-H]DiosmetinC16H12O619.2923.2Phenolic
5.66212.001[M-H]Indoxylsulfuric acidC8H7NO4S1.6938.0Organic acid
3.95161.044[M-H]3-Hydroxymethylglutaric acidC6H10O59.2964.1Organic acid
5.74218.102[M-H]Pantothenic acidC9H17NO51.5880.1Vitamin
1.69341.106[M-H]. [M-H-H2O]SucroseC12H22O115.4981.6Saccharide
9.30121.028[M-H]-4-hydroxybenzaldehydeC7H6O214.5968.9Phenolic
7.47137.023[M-H]-3,4-DihydrobenzaldehydeC7H6O30.3676.8Phenolic
1.77133.012[M-H]-L-Malic acidC4H6O56.4948.6Organic acid
10.31367.103[M-H]-Feruloylquinic acid isomer IIC17H20O915.4956.4Phenolic
10.86447.093[M-H]-. [M+Cl]-OrientinC21H20O119.4970.2Phenolic
9.67375.130[M-H]-RiboflavinC17H20N4O69.7748.7Vitamin
9.90172.097[M-H]-Acetyl-DL-Leucine isomer IIC8H15NO35.8852.0AA
1.71177.039[M-H]-L-Gulonic γ-lactoneC6H10O69.8727.0Lactone
8.10223.061[M-H]-Sinapic acidC11H12O59.9615.6Phenolic
8.94181.050[M-H]-Hydroxyphenyllactic acid isomer IIC9H10O47.6718.0Organic acid
10.77447.093[M-H]-IsoorientinC21H20O1110.2981.2Phenolic
16.74285.040[M-H]-LuteolinC15H10O610.3831.0Phenolic
10.85163.038[M-H]-. [M+Cl]-p-Coumaric acidC9H8O36.1994.5Phenolic
8.52367.103[M-H]-. [M-H-H2O]-Feruloylquinic acid isomer IC17H20O93.3850.5Phenolic
16.71201.111[M-H]-Sebacic acidC10H18O48.0709.0Organic acid
11.73193.049[M-H]-Ferulic acidC10H10O48.0946.7Phenolic
5.54167.034[M-H]-Homogentisic acidC8H8O47.2734.7Phenolic
19.30211.133[M-H]-. [M+Cl]-Dihydrojasmonic acidC12H20O312.4961.9Lipid
5.19129.018[M-H]-Citraconic acidC5H6O45.8625.4Organic acid
17.91269.045[M-H]-ApigeninC15H10O513.3751.6Phenolic
13.98174.055[M-H]3-Indoleacetic acidC10H9NO217.6888.6Organic acid
1.75503.159[M-H]1-KestoseC18H32O1610.0627.8Saccharide
12.82144.044[M-H]Indole-4-carboxaldehydeC9H7NO22.2648.8Alkaloid
7.56152.034[M-H]3-Hydroxyanthranilic acidC7H7NO312.0839.1Organic acid
9.65337.093[M-H]cis-5-O-p-Coumaroylquinic acidC16H18O811.5845.2Phenolic
8.46353.088[M-H]Cryptochlorogenic acidC16H18O97.2860.4Phenolic
1.80191.017[M-H]Isocitric acidC6H8O710.6987.8Organic acid
16.88359.149[M-H]LariciresinolC20H24O619.7638.8Lignan
4.40169.013[M-H]Gallic acidC7H6O514.0982.1Phenolic
6.73353.088[M-H]NeochlorogenicC16H18O930.7768.5Phenolic
5.58222.076[M-H]Acetyl-L-tyrosine isomer IIC11H13NO412.2734.2AA
2.39173.007[M-H]Trans-Aconitic acidC6H6O60.9997.1Organic acid
16.16181.069[M-H]Sorbitol isomer IC6H14O618.4847.7Saccharide
3.22147.028[M-H]. [M+Cl]2-Hydroxy-2-methylbutanedioic acidC5H8O57.9613.6Organic acid
16.47181.069[M-H]Sorbitol isomer IIC6H14O613.0837.1Saccharide
8.21191.054[M-H]Quinic acid isomer IIC7H12O66.6601.6Organic acid
Table 7. Phenolic-rich extract characterization in positive ionization mode (From MetaboScape®, ordered by decrease order of signal intensity).
Rt
(min)
m/zNegative Mode
Ions
NameMolecular
Formula
mSigmaMS/MS
Score
Class
5.25653.164[M+H]+Tricin 7-rhamnosyl-(1->2)-galacturonideC29H32O178.8733.3Phenolic
3.97377.142[M+H]+, [M+Na]+RiboflavinC17H20N4O66.9976.6Vitamin
5.37639.184[M+H]+6-Hydroxyluteolin 6,4′-dimethyl ether 7-rutinoside isomer IIC29H34O169.8891.3Phenolic
5.24639.185[M+H]+6-Hydroxyluteolin 6,4′-dimethyl ether 7-rutinoside isomer IC29H34O1619.9931.2Phenolic
14.42282.277[M+H]+ElaidamideC18H35NO2.5909.4Lipid
7.15331.077[M+H]+MalvidinC17H14O715.2695.3Phenolic
1.22527.152[M+Na]+, [M+K]+LevanC18H32O1618.3725.4Saccharide
5.31403.098[M+H]+4-O-Demethyl-13-dihydroadriamycinoneC20H18O919.7878.0Phenolic
5.22376.219[M+H]+Ile Pro PheC20H29N3O417.2693.9Peptide
1.21365.101[M+Na]+, [M+K]+LactuloseC12H22O1113.9838.6Saccharide
4.22355.113[M+H]+Asp-Leu-OHC15H18N2O819.7890.8Peptide
3.60371.130[M+H]+Perilloside EC17H22O920.6635.2Phenolic
6.54309.084[M+H]+FlazineC17H12N2O415.0632.0Alkaloid
Publisher’s Note: MDPI stays neutral with regard to jurisdictional claims in published maps and institutional affiliations.

