Article

Coal Mine Personnel Safety Monitoring Technology Based on Uncooled Infrared Focal Plane Technology

1
School of Mechanical and Electrical Engineering, Huainan Normal University, Huainan 232038, China
2
State Key Laboratory of Mining Response and Disaster Prevention and Control in Deep Coal Mines, Huainan 232001, China
*
Author to whom correspondence should be addressed.
Processes 2022, 10(6), 1142; https://doi.org/10.3390/pr10061142
Submission received: 2 April 2022 / Revised: 20 May 2022 / Accepted: 21 May 2022 / Published: 7 June 2022

Abstract

:
In an effort to overcome the difficulty of real-time early warning via traditional infrared imaging technology caused by the complex working environment in coal mines, this paper proposes a mine early warning method based on uncooled infrared focal plane technology. The infrared thermal spectrogram of the detected object was visually displayed in a pseudo-color image with high resolution and high sensitivity, which can realize the real-time detection and early warning of personnel safety in modern mines. The multipoint compression correction algorithm based on human visual characteristics divided the response units of all acquisition units into gray intervals according to a threshold value, then the corresponding parameters were set in different intervals, and finally, each interval was compressed using a two-point correction algorithm. The volume of stored data was the sum of the calibration curve and the data from an encode table corrected by a MATLAB simulation, and the number of CPU cycles was run by a CCS 3.3 clock calculation algorithm. The results showed that when the temperature of the blackbody reached 115 °C, the nonuniformity before correction was 6.32%, and the nonuniformity after the multipoint correction of human eyes was 2.99%, which implied that the algorithm proposed in this paper had good denoising ability. The number of CPU cycles occupied by this algorithm was 18,257,363 cycles/frame with a frequency of 29.97 Hz. The sharpness of the compressed infrared images was obviously improved, and the uniformity was better. The method proposed in this paper can meet the need for modern mine personnel search and rescue, equipment supervision and dangerous area detection and other early warning requirements so as to achieve the goal of developing smart mines and ensuring safety in coal mine production.

1. Introduction

With increasing national requirements for workplace safety, coal mine enterprises have successively installed safety monitoring systems. However, traditional workplace safety monitoring systems can only issue a failure alarm when one or several indicators within the monitoring scope exceed the established standards rather than predict the incoming danger and issue a warning in advance [1,2,3]. Therefore, to realize the goal of developing smart mines and ensuring the safety of coal mine production, it is becoming more and more important to find a portable and automatic way to monitor the dangerous areas and equipment status in a coal mine in real time. Zhu et al. [4] proposed a mine equipment monitoring and early warning scheme based on wireless sensing, but this method did not integrate multiple signal types, leading to a low utilization rate of the information and the system. Xie et al. [5] used optical fiber sensing and infrared image technology to predict accidents in a mine, however, it could not meet the early warning requirements inside the complex and changeable working environment of a mine. Xu et al. [6] devised a mine disaster early warning model with the help of big data. The system architecture of most domestic enterprises has many defects such as poor scalability, low resource utilization, low environmental adaptability, high cost and poor energy-saving efficiency when processing a large amount of data. Sun et al. [7] put forward an early warning method in mines by combining visible light and infrared image. However, it was difficult to obtain a real-time and effective early warning in practice because the alarm would only be sent out after a real-time comparison between the visible light detection results and the infrared image detection results [8,9,10].
Infrared imaging technology has good anti-interference ability and allows target detection in complex weather without contact. At present, the most effective way to improve the system sensitivity and image resolution is the application of uncooled infrared imaging system and image processing technology, because the system can improve the sensitivity by shortening the detector response time, while reducing the interference of nonuniformity in the infrared images with the image preprocessing technology. At present, mainstream nonuniformity correction algorithms [11] are scaling-based and scene-based nonuniformity correction algorithms. The former is widely used in practice because its low algorithm complexity makes it possible to run on a hardware platform, while the latter cannot due to its high algorithm complexity. At present, such algorithms mainly include neural network algorithm [12,13,14,15], time-domain high-pass filtering method [16,17], Kalman filtering method [18] and other algorithms. Qian et al. [19] proposed a pseudo-color fusion algorithm of infrared and visible light image based on improved color delivery strategy and nonsubsampled contourlet transform (NSCT) and obtained a gray scale fusion image using NSCT and a Canny edge detection algorithm. Then, the fusion grayscale image was inserted into the Y channel, and the residual image between the source image and the fusion grayscale image was inserted into the Cb and Cr channels, respectively, to generate the YCbCr source color image [20,21,22,23]. Li et al. proposed a new method of image coloring fusion in the oRGB color space to enhance infrared thermal and visible light night vision images [24]. To sum up, in the development of infrared imaging technologies, in addition to the continuous research and performance improvement in infrared focal plane arrays, the infrared image processing technology is constantly developing. In particular, algorithms for the nonuniformity correction algorithm of uncooled infrared images and pseudo-color mapping have a great significance and application value [25,26,27,28].
In this paper, the proposed technology of monitoring coal mine personnel safety based on uncooled infrared focal plane technology visually displays the infrared thermal spectrum of the detected object in the form of pseudo-color images with high resolution and high sensitivity. Thus, the real-time detection and early warning of personnel safety in modern mines can be achieved. A multipoint compression correction algorithm based on human visual characteristics divides the response units of all acquisition units into gray intervals according to a threshold value, then the corresponding parameters are set in different intervals, and finally the compression of each interval is obtained by using a two-point correction algorithm. Through infrared images, the specific location of personnel can be accurately detected, and a real-time alarm can be issued if the personnel enter the dangerous area. Infrared images can clearly detect the real-time status of the personnel. If the operation and working status of the personnel are abnormal, a quick alarm can be triggered. This method can meet the need for modern mine personnel search and rescue, equipment supervision and dangerous area detection, and other early warning requirements, so as to achieve the goal of developing smart mines and ensuring safety in coal mine production.

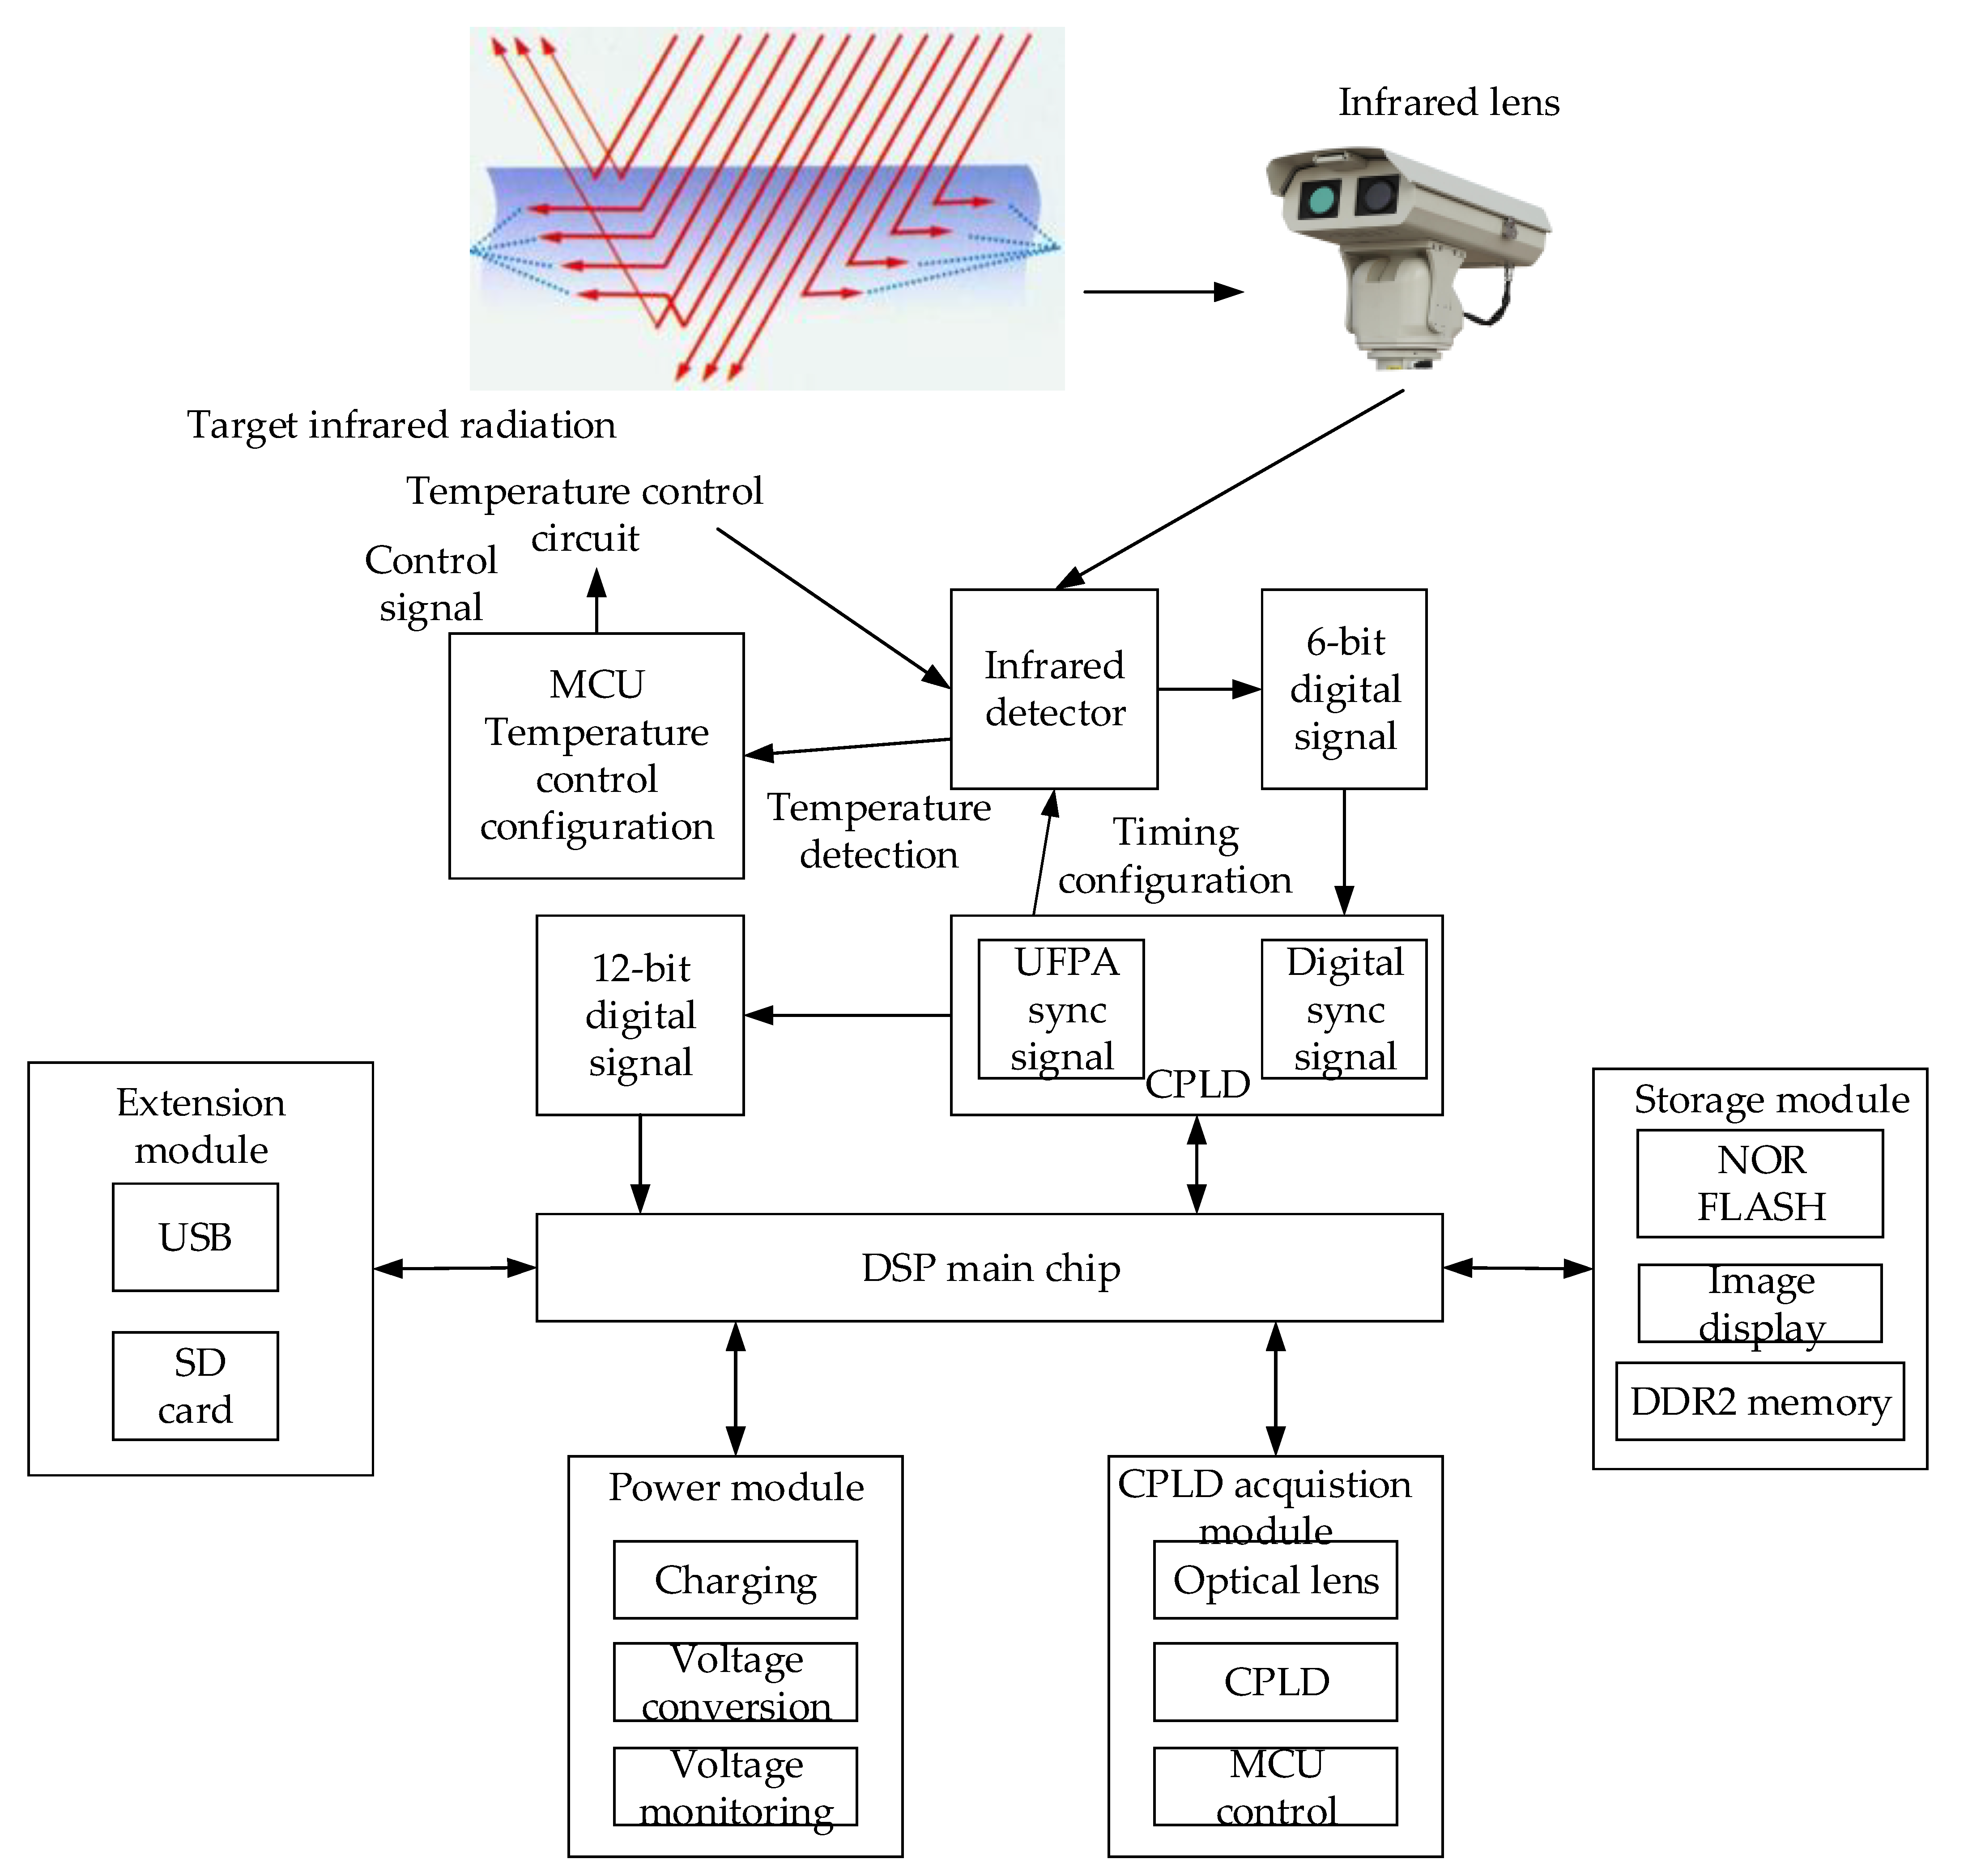
2. Uncooled Infrared Imaging System

When the target enters the detection range of the optical lens, the optical lens projects the thermal radiation released by the target to the entire infrared focal plane array through the lens. The detection unit of the infrared focal plane induces the radiation energy to realize the conversion between the photoelectric signals.
The algorithm finally generates a thermal image from the detected grayscale image through digital signal processing. The wavelength of infrared radiation is higher than that of visible light, so the radiation intensity depends mainly on the actual temperature of the object. At the beginning of the twentieth century, Planck, based on quantum theory, studied the change law of the blackbody radiation spectrum and discovered the following relationship among the radiosity, wavelength λ and absolute temperature T [29]:
M b ( γ , T ) = c 1 γ 5 [ e c 2 / ( γ T ) 1 ] 1
where c 1 = 3.743 × 10 8   ( W μ m 2 / m ) and c 2 = 1.439 × 10 4   ( μ m K ) are the Planck first and second constant, respectively, and γ is the radiation rate. The Planck radiation spectrum is shown in Figure 1. From Figure 1 we can see that the radiance of the blackbody increases with the increasing temperature; the radiance at the same temperature is continuous and reaches a peak. As the wavelength increases, the radiance increases first and then decreases [30,31].
The target infrared radiation needs air as medium to transmit energy to the optical lens, so it is necessary to consider the characteristics of radiation transmission in the atmosphere. The absorption of the radiation in the atmosphere is concentrated in the infrared and thermal infrared regions, and carbon dioxide and water vapor are the main factors affecting their atmospheric permeability. Based on the transmittance curves of the atmosphere in Figure 2, two atmospheric windows [32] are found in the atmosphere, namely the 3.0~5.0 μm and 8.0~14.0 μm bands. The transmittance of the 3.0~5.0 μm band is due to electric resonance and the high transmittance of the 8.0~14.0 μm band is due to the joint electric resonance with magnetic resonance. Through both windows, the thermal images of the target can be clearly observed at lightless nights or in cloudy weather [33,34,35,36].
The infrared imaging process can be briefly described as the energy signal of the object entering the infrared detector after going through the medium and optical system. Therefore, it is shown that the infrared detector output is affected by the combination of the object’s radiation characteristics, radiation transmission characteristics, optical system, array output characteristics and other factors. Based on the above study of infrared radiation characteristics, the factors leading to the reduced image quality are summarized into three categories: the output nonuniformity, blind pixels, and the contrast of the image.

3. Architecture Design of the Early Warning System

An uncooled infrared detector, not equipped with a cooling device, directly reduces the system power consumption and the system volume. However, the uncooled focal plane array greatly increases the data volume and indirectly increases the running time of the algorithm, thus reducing the system resolution and real-time performance. In view of these deficiencies, we improved the platform architecture and DSP (digital signal processor) processing algorithm and adopted the hardware architecture of CPLD (complex programmable logic device) + DSP + MCU (microcontroller unit) to improve the sensitivity and real-time performance of the system. CPLD mainly provides driving timing and register configuration information for the uncooled focal plane array, completes the preparation of the image acquisition and transmits the image data. An uncooled focal plane array detection pixel will always be at a uniform and constant temperature through the MCU module. Finally, the DSP processes the algorithm, connects and controls the units.
After the imaging system is turned on, the power supply circuit allocates three different voltages to each circuit, so that each chip can complete the startup. When the CPLD program is running, the drive timing configuration and register configuration information are transmitted to the infrared detector, and the infrared detector completes the startup. At the same time, the infrared radiation light of the object is transmitted through the air, and the optical system allows the radiation of 8.0~14.0 μm bands to pass through and absorbs or reflects the radiation from other bands [37,38]. When the infrared light is transmitted to the entire infrared focal plane and reaches the integration time, the array-induced radiation energy is converted to a 6-bit electrical signal by using a readout circuit and transmitted back to the 12-bit electrical signal synthesized by the CPLD. The front-end interface VPFE (video processing front end) of the VPSS (video processing submodule) of the DSP master chip receives the integrated 12-bit digital signal. The DSP processes the video signal with nonuniformity correction and pseudo-color mapping, stores the processed signal loop in memory, and finally the output thermal images are shown on the LCD (liquid crystal display) display or a PC (personal computer). The overall diagram of the uncooled imaging system is shown in Figure 2.
The core of the uncooled system consists of the front-end CPLD acquisition module, DSP main chip module, power supply module, expansion module and memory module. The schematic diagram is shown in Figure 2. The front-end CPLD acquisition module includes the optical lens, the CPLD and the MCU temperature control circuit, in which the optical lens is responsible for the collection of the infrared radiation energy; the CPLD for the transmission of the drive timing of the detector configuration and the register configuration information; and the temperature control circuit for the control of the infrared detector temperature at 30 °C. The power supply module has three major functions: charging, conversion voltage and monitoring voltage. The charging function is to recharge the lithium battery, making the infrared imaging system portable. The conversion voltage function is to provide power to the entire imaging system. Voltage monitoring is mainly for real-time monitoring of the power supply module to prevent voltage failure. The extension module reserves various interfaces for a USB port and an SD card, to provide a function for different user needs, and these interfaces facilitate the subsequent development of other needs. The memory module includes LCD displays, NORFLASH, and DDR2 memory, where the NORFLASH is primarily used to store the DSP boot master and nonuniform correction factor tables. The raw data, the intermediate calculation results and the final operation results are stored in the DDR2 memory. The operation results are presented on the LCD display. The VPBE (video processing backend end) converts the processed video signal into a hot image and then outputs it.

4. Infrared Image Preprocessing

The detector’s output could vary greatly due to the differences in production process and the materials used, and this phenomenon results in the nonuniformity of the infrared focal plane array, which causes a fixed mode noise on the infrared image, seriously affecting the temperature resolution ability of the system [39]. Therefore, it is required to have a correction algorithm to overcome the nonuniformity effect of the infrared focal panel arrays.

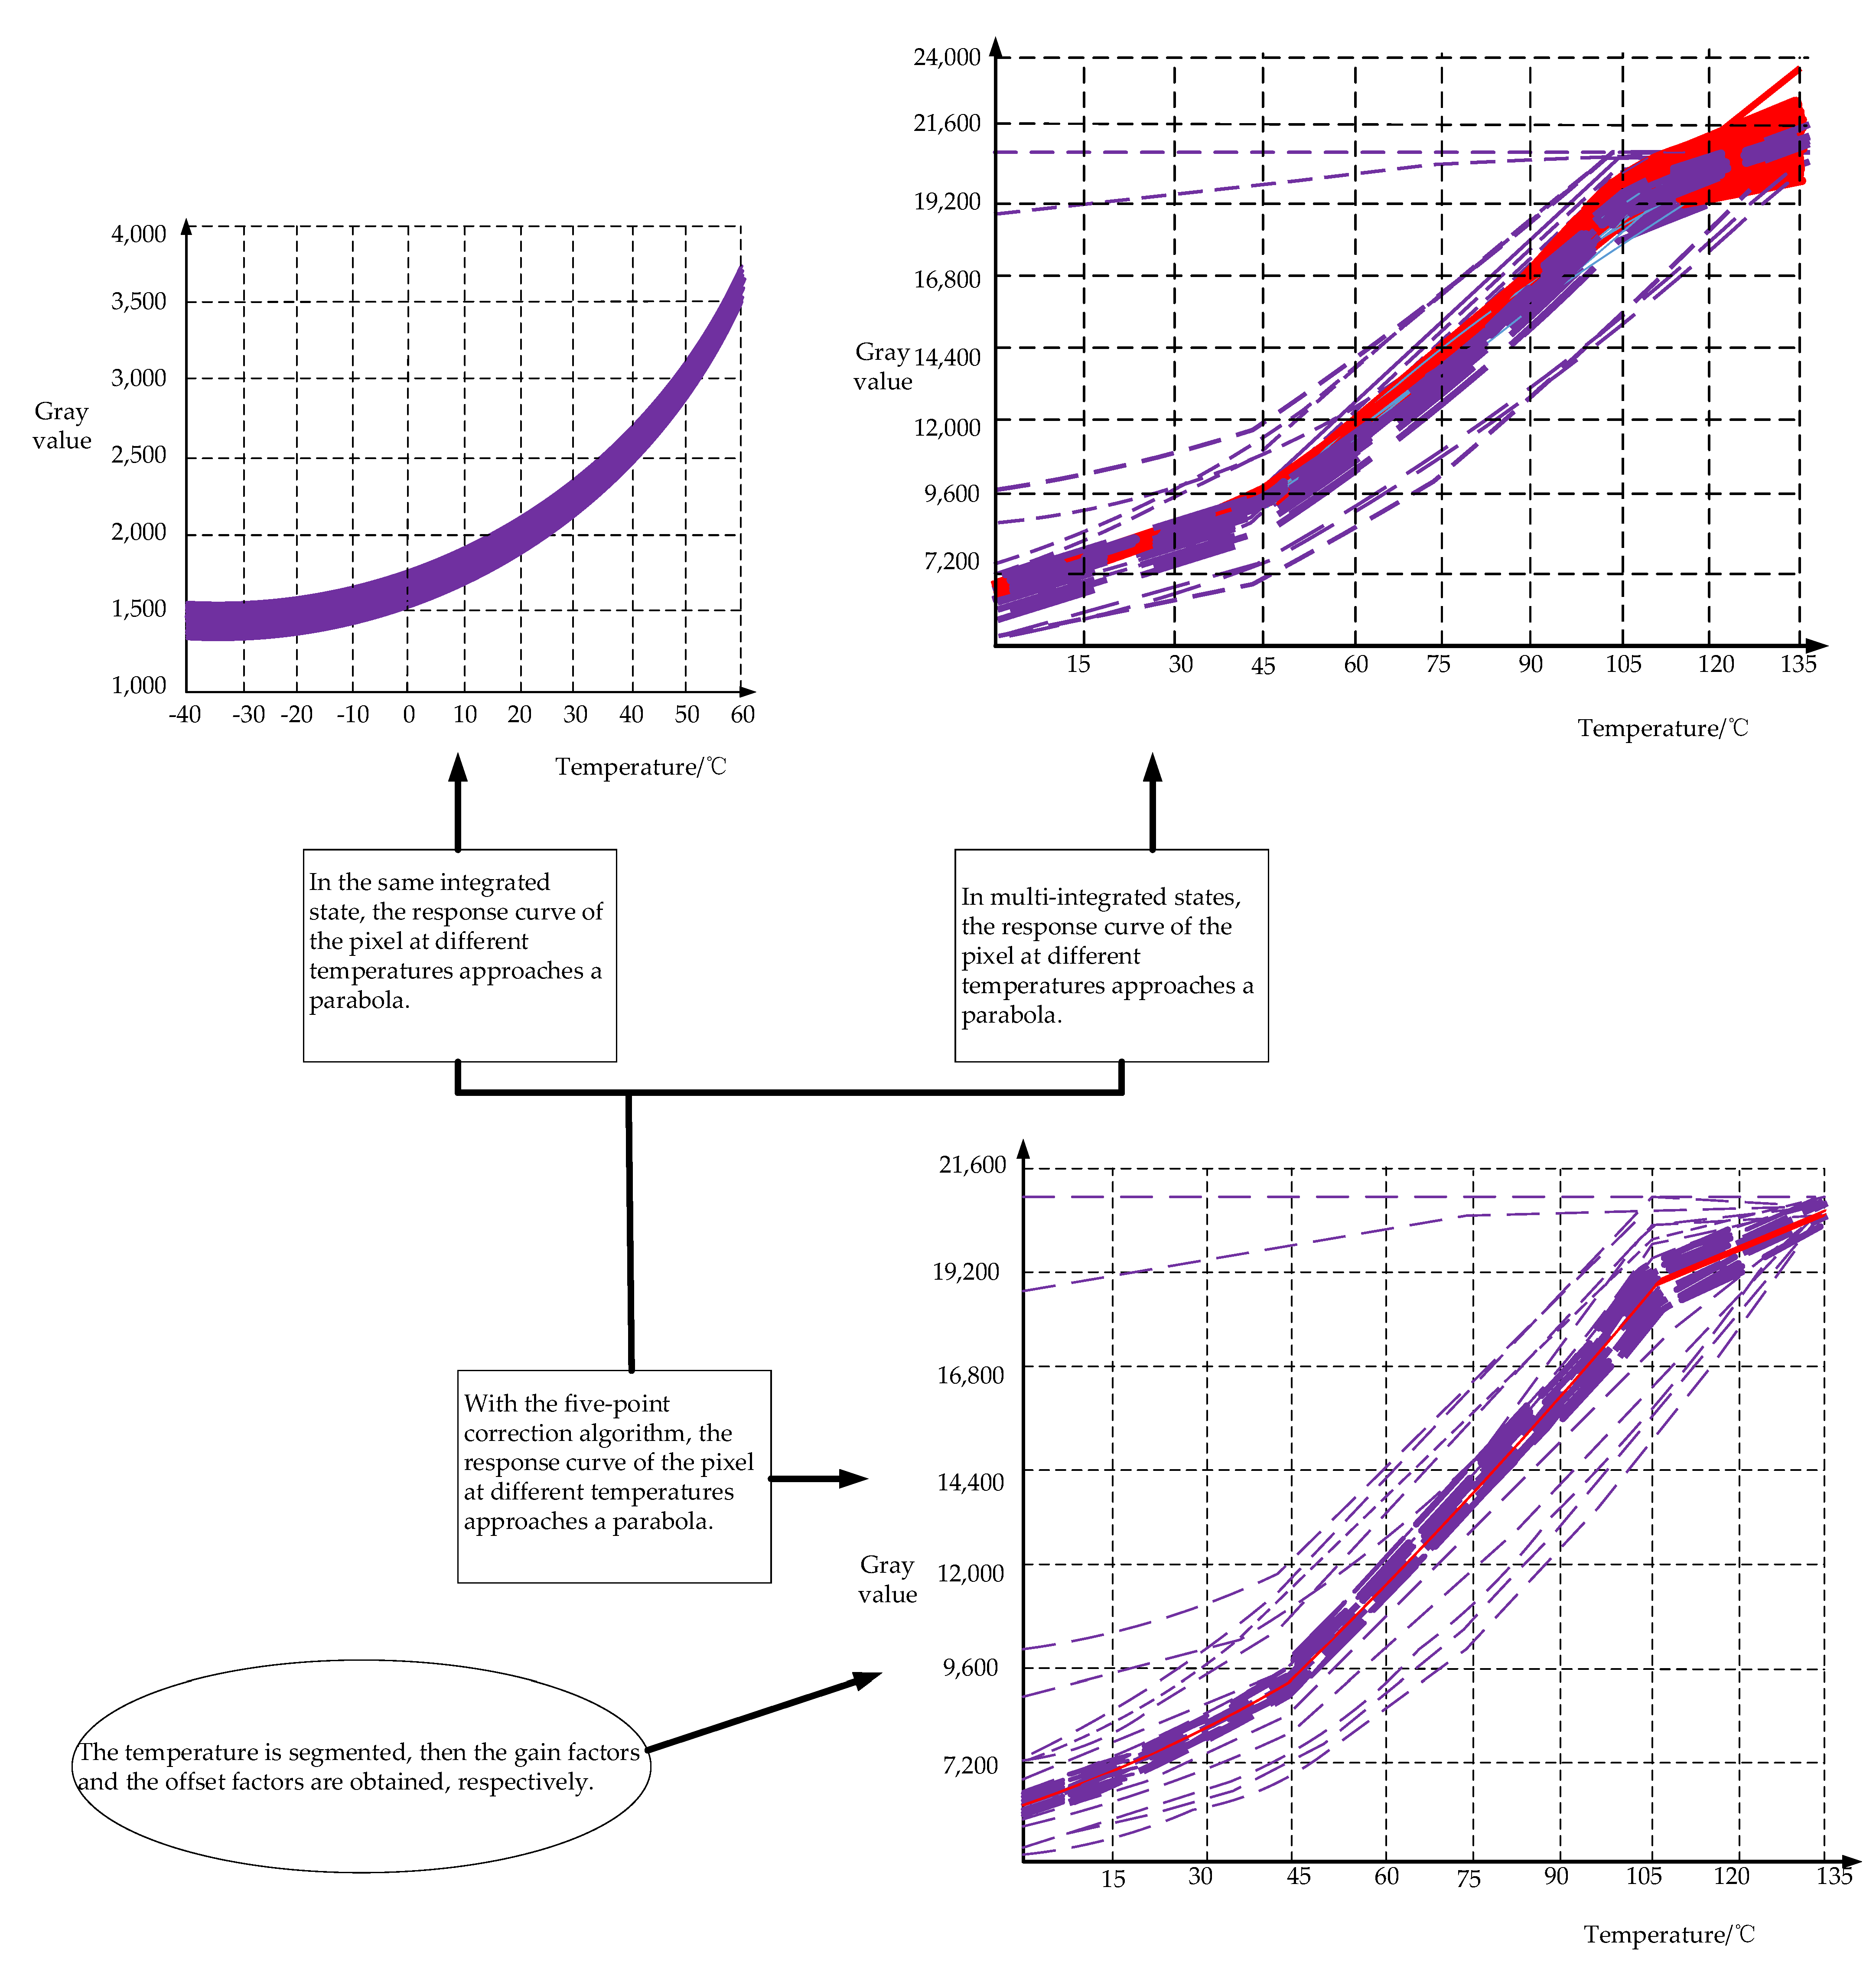
4.1. Two-Point Correction Algorithm

The two-point correction algorithm is based on two assumptions: (1) The error at both ends is ignored and a linear mathematical relationship is established between the output and the amplitude. (2) The output of each detection unit is time-invariant, so the gain and offset coefficients of the detection unit are calculated directly through the blackbody radiation source calibration before the system application. Thus, the general equation for the two-point nonuniformity correction can be expressed as:
Y i , j = G i , j Y i , j + O i , j
where: Y i , j is the gray value before the correction, Y i , j is the corrected gray value, G i , j is the gain coefficient and O i , j is the offset coefficient. When adjusting the blackbody temperature to T L , we fix the position of the blackbody and infrared imaging systems and align the blackbody and infrared optical lenses to ensure that the radiation shines in the infrared focal plane [40]. When the blackbody temperature is stable, we collect and save the gray value output from each detection unit of the infrared focal plane array Y i , j ( T L ) , and the average Y ¯ ( T L ) is calculated by Equation (3).
Y ¯ ( T L ) = 1 M × N Y i , j ( T L )
When the blackbody temperature is adjusted to T H , the position of the blackbody and infrared imaging system is fixed and the blackbody and infrared optical lens are aligned, the infrared focal plane is fully subject to radiation, and the output gray value Y i , j ( T H ) of the detection unit is collected and stored when the blackbody temperature change tends to be stable, and the average Y ¯ ( T H ) is calculated by Equation (4). M and N are the number of elements in the flat array.
Y ¯ ( T H ) = 1 M × N Y i , j ( T H )
Thus, the gain and offset coefficients are obtained:
G i , j = Y ¯ ( T H ) Y ¯ ( T L ) Y i , j ( T H ) Y i , j ( T L )
O i , j = Y ¯ ( T H ) Y i , j ( T L ) Y ¯ ( T L ) Y i , j ( T H ) Y i , j ( T L ) Y i , j ( T H )
The two-point correction algorithm is simple to realize, occupies less hardware resources and the algorithm running time is short, which is suitable to real-time hardware processing. However, the two-point correction algorithm is based on the two hypothetical conditions mentioned above, while the response curve of each probe unit does not satisfy the linear model relationship and the time-invariant characteristic of actual processing [41]. Therefore, the two-point correction algorithm is suitable for applications when correction accuracy is low and the working environment does not change a lot.

4.2. Five-Point Correction Algorithm

We selected appropriate points on the response curve generated from data acquisition from the probe unit. The curves were then segmented and processed with the two-point correction algorithm. The response is represented by V , the radiation flux by ϕ , and the calibration points by ϕ 1 , ϕ 2 , ϕ 3 , ϕ 4 , ϕ 5 .
The correction formula of the correction algorithm is:
V i , j ( ϕ ) = K i , j ( ϕ l ) V i , j ( ϕ ) + O i , j ( ϕ l )
where: ϕ = [ ϕ l , ϕ l + 1 ] and l [ 1 , n ] ; K i , j ( ϕ l ) is a gain coefficient; O i , j ( ϕ l ) is an offset coefficient; V i , j ( ϕ ) is the precorrection response; and V i , j ( ϕ ) is the postcorrection response. The embedded platform can realize the operation of the multipoint correction algorithm. The calculation of the gain and offset coefficients from all the data collected in the infrared focal plane array is large. The occupation of hardware resources by the algorithm results in an increase in running time, affecting the real-time performance of the system, and the range of application is also greatly limited.
The trend of change of the infrared focal plane detector is affected by the integrated state. In the same integrated state, the response curve of the pixel is close to the parabola at different temperatures. If the infrared focal plane detector works in the multi-integrated state, the image quality is greatly affected by nonuniformity. Thus, the problem of how to reduce the image nonuniformity must be considered. The detector pixel response curve is shown in Figure 3.

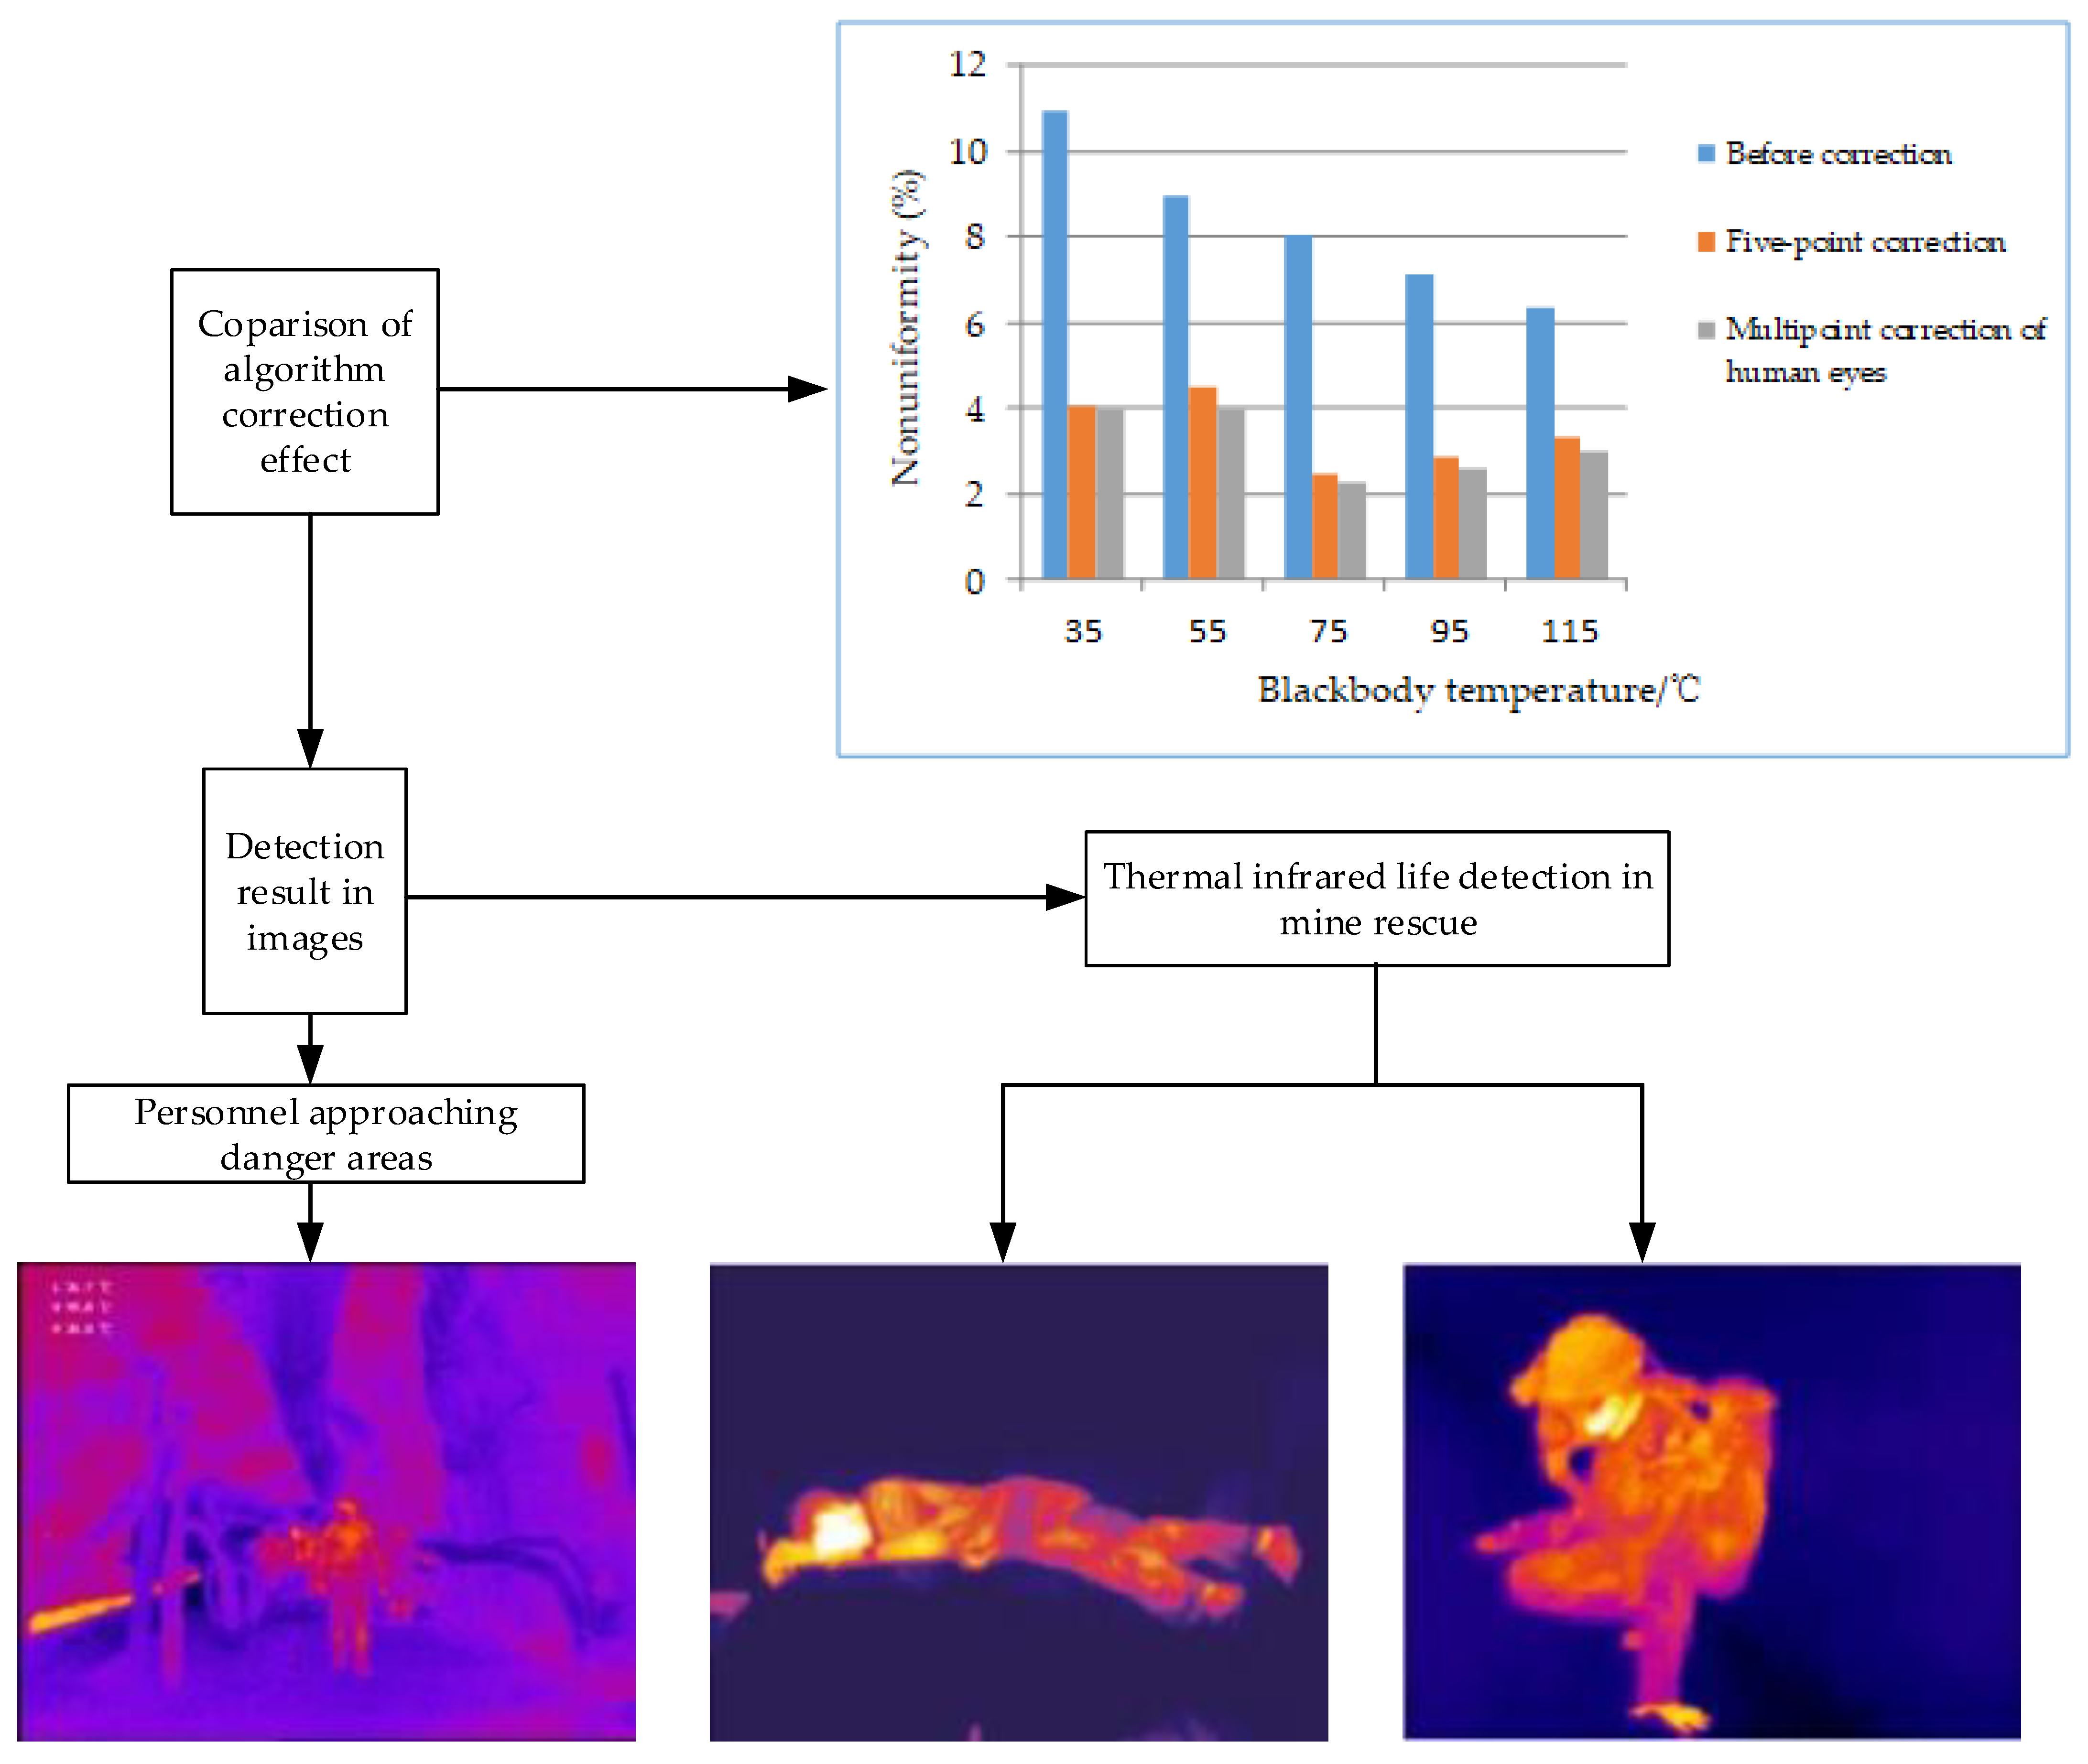
4.3. Multipoint Correction Algorithm Based on Human Eyes

The human visual system is the main channel for receiving external information, and the human eye is only related to the brightness of the contrast between the target and the background and has nothing to do with the overall image. When the gray level is higher or lower, the human eye’s ability to distinguish gray levels decreases, and when the image gray level is medium, the human eye’s ability to distinguish gray levels is stronger. The human eye can only distinguish six gray levels near the gray level of 0, that is, the human eye cannot distinguish between the 0-level gray and the 5-level gray, and it is considered to be the same gray color. When the gray level is 191, the distinguishing ability is strong, and two gray levels can be distinguished; when the gray level is around 255, three gray levels can be distinguished. It can be concluded that the ability of the visual system to discriminate images has a threshold limit.
The traditional multipoint correction algorithm directly calculates the 0–255 gray values and needs to know the coefficients of all detector units (110,592 × 10 bit = 1080 kbit) and the data of five calibration points (110,592 × 5 bit = 540 kbit); the total volume of data to be stored is 1080 + 540 kbit = 1620 kbit. At the same time, the correction coefficient needs to be calculated and selected, and a multiplication and addition calculation can be performed to complete the correction. A large amount of storage and complex calculation processes occupy storage space and reduce the running speed of the algorithm.
The idea of the multipoint correction algorithm based on the human eye was, on the basis of the multipoint correction algorithm and according to the characteristics of the human eye’s ability to distinguish gray levels, to first set an appropriate threshold to divide the entire gray level and divide the same or similar gray levels into intervals. Degree-valued pixels were grouped together. According to the grayscale resolution capability curve of the human eye, the threshold was set to 6, and the 0–255 grayscale values were divided into 43 intervals, each interval corresponding to six grayscale ranges. The corresponding correction coefficient was determined according to the divided 43 intervals. During the operation, the DSP only needs to find the corresponding correction coefficient according to the interval in which the gray scale falls. The traditional multipoint correction algorithm changes the search for the entire gray value and the complex operation of recalculating the correction coefficient every time. This way, the computational complexity of the algorithm is reduced, thereby improving the computational speed of the algorithm.
The range of the image gray scale was divided into 43 different intervals according to the gray resolution threshold, and each interval was numbered for the convenience of subsequent operations. The same interval numbering consisted of pixels with similar gray values, each interval having six gray scale values. The DSP was responsible for loading the data in the coefficient table, realizing fast alignment and search according to the gray scale interval of the pixel, so as to determine the corresponding coefficient in real time. Each determined cell segment was considered linear and a two-point correction was performed separately for each interval to achieve compression of the infrared focal plane array.
At the same temperature, 384 × 288 response values can be obtained at any calibration point ϕ 1 . The maximum can be obtained by Equation (8):
V ( ϕ n ) = max { V 1 , 1 ( ϕ n ) , V 1 , 2 ( ϕ n ) , V M , N ( ϕ n ) }
The maximum obtained in Equation (8) served as the correction value of this interval; based on the two-point correction principle, the gain and offset lineage arrays were generated at calibration point ϕ 1 , and the latter four points were processed in the same way, so that 384 × 288 × 5 sets of gain and offset coefficients were obtained. As shown in Equations (9) and (10)
K i , j ( ϕ l ) = V ( ϕ l + 1 ) V ( ϕ l ) V i , j ( ϕ l + 1 ) V i , j ( ϕ l )
O i , j ( ϕ 1 ) = V i , j ( ϕ l + 1 ) V ( ϕ l ) V i , j ( ϕ l ) V ( ϕ l + 1 ) V i , j ( ϕ l + 1 ) V i , j ( ϕ l )
when the image is compressed, the gray value V i , j of the calibration point ( i , j ) is encoded with number H i , j in the corresponding interval. The encode number could effectively help avoid repeated operations. The coefficients generated by these five calibration points were calculated by Equations (11) and (12):
K i , j ( H i , j ) = V ( ϕ l + 1 ) V ( ϕ l ) ( H i , j ( ϕ l + 1 ) H i , j ( ϕ l )
O i , j ( H i , j ) = H i , j ( ϕ l + 1 ) V ( ϕ l ) H i , j ( ϕ l ) V ( ϕ l + 1 ) H i , j ( ϕ l + 1 ) H i , j ( ϕ l )
The resolution of the nonuniformity in measuring methods for the parameters of infrared focal plane arrays (GB/T17444-2013) is shown in Equation (13):
U R = 1 R ¯ 1 M × N ( d + h ) i = 1 M j = 1 N ( R ( i , j ) R ¯ ) 2 × 100 %
where R ( i , j ) is the response value of the detection unit and R ¯ is the response average of the infrared focal plane. The infrared image can clearly detect the real-time status of the staff and compare the movement trajectory and activity status of the staff with the real-time detected image results under normal conditions. If the operation and working status of the staff are abnormal, a quick alarm can be triggered. The nonuniformity (NU) is used to measure the correction ability of the algorithm proposed in this paper. If the value of NU is small, it means that it has a better correction ability. The nonuniformity by the two algorithms is shown in Table 1.
It can be easily found that the compression of the image can improve the image quality and obtain better correction from the data in Table 1. The encoding table was corrected by a MATLAB simulation, and the volume of data stored was the sum of the correction curve and the encoded table data. Thus, the traditional algorithm can 1620 kbit. The correction algorithm proposed in this paper fundamentally reduces the amount of data, performs compression well and yields high quality image data. The result in Table 2 is the number of CPU cycles run by the two algorithms, calculated by the clock from CCS (Code Composer Studio) 3.3.

5. Field Test

The experimental results of sending a warning when the personnel approached dangerous areas via noncontact detection in coal mines and sending an emergency rescue are shown in Figure 4. We can see that the nonuniformity of the image is effectively corrected, reducing the influence of the interference noise, and the target can be clearly seen. After collecting and comparing the nonuniformity values conducted at different blackbody temperature intervals using the five-point correction algorithm and the multipoint correction algorithm of human eyes, respectively, it shows that when the blackbody temperature reaches 115 °C, the nonuniformity is 6.32% before the multipoint correction of human eyes, and 2.99% after it. It is not difficult to see that the multipoint correction algorithm based on human eyes proposed in this paper has good denoising ability, improves the detection accuracy of the algorithm, and reduces the data processing amount, calculation and workload of the processor CPU, so as to effectively improve the detection speed of the algorithm.
This specific result shows that the proposed algorithm can well improve the contrast between target and background, boost the system’s resolution ability, effectively enhance the image resolution and accuracy, and provide a solid basis for the reliable early warning of the system. Thermal image technology is used to search and identify the exact location of the victims for prompt rescue in dark, smoky and foggy environments. The thermal image instrument can not only measure the surface temperature of the object, but also show the temperature distribution of the object, forming a “heat map” to provide the rescuers with more information about the object status and to improve rescue efficiency.

6. Conclusions

  • This paper studied the advantages and disadvantages of both traditional nonuniformity correction algorithms and nonuniformity correction algorithms based on human visual characteristics and proposed a multipoint compression correction algorithm based on human visual properties to improve the image resolution.
  • In view of the disadvantages, such as poor contrast and low resolution, of infrared images, this paper adopted a pseudo-color mapping algorithm with fixed thresholds to improve the contrast and visual effect of images.
  • Preliminary modeling, simulation and field tests showed that the proposed algorithm could satisfy the need for the analysis of the surface temperature of an object and noncontact temperature measurement in modern mines.

Author Contributions

Conceptualization, K.H. and R.Z.; methodology, K.H.; software, R.Z.; validation, Y.L., L.D. and X.Z.; formal analysis, J.F.; investigation, Y.L.; resources, L.D.; data curation, K.H.; writing—original draft preparation, R.Z.; writing—review and editing, X.Z.; visualization, J.F.; supervision, K.H.; project administration, K.H.; funding acquisition, K.H. All authors have read and agreed to the published version of the manuscript.

Funding

This research was funded by State Key Laboratory Open Fund of Mining Response and Disaster Prevention and Control in Deep Coal Mines grant number SKLMRDPC21KF23, Training Programme Foundation for the Talents by Universities of Anhui Province and Natural Science Foundation of Education Department of Anhui province, grant number KJ2019A0692.

Informed Consent Statement

Not applicable.

Conflicts of Interest

The authors declare no conflict of interest.

References

  1. Gao, X.S.; Ji, Y.L.; Xin, H.H.; Kang, Y.L. Spontaneous combustion characteristics and infrared analysis of Zhundong II coal. China Saf. Sci. J. 2012, 22, 101–106. [Google Scholar]
  2. Lv, Z.; Yu, Z.; Xie, S.; Alamri, A. Deep learning-based smart predictive evaluation for interactive multimedia-enabled smart healthcare. ACM Trans. Multimed. Comput. Commun. Appl. 2022, 18, 1–20. [Google Scholar] [CrossRef]
  3. Liu, R.; Wang, X.; Lu, H.; Wu, Z.; Fan, Q.; Li, S.; Jin, X. SCCGAN: Style and characters inpainting based on CGAN. Mob. Netw. Appl. 2021, 26, 3–12. [Google Scholar] [CrossRef]
  4. Zhu, J.F. Development and Application of Mine Roof Monitoring and Early Warning System Based on Wireless Sensors; Taiyuan University of Technology: Taiyuan, China, 2020. [Google Scholar]
  5. Xie, X.C.; Liang, Y.Q.; Lin, C.; Li, L.L. Early warning system for mine fire accidents. Saf. Coal Mines 2017, 48, 69–72. [Google Scholar]
  6. Xu, L.; Li, X.J. Mine disaster warning model based on big data. Saf. Coal Mines 2018, 49, 98–101. [Google Scholar]
  7. Sun, J.P.; Sun, Y.Y.; Fan, W.Q. Mine exogenous fire identification method based on visible light and infrared image. Ind. Mine Autom. 2019, 45, 1–5+21. [Google Scholar]
  8. Dong, J.; Deng, R.; Quanying, Z.; Cai, J.; Ding, Y.; Li, M. Research on recognition of gas saturation in sandstone reservoir based on capture mode. Appl. Radiat. Isot. 2021, 178, 109939. [Google Scholar] [CrossRef]
  9. Fan, C.; Li, H.; Qin, Q.; He, S.; Zhong, C. Geological conditions and exploration potential of shale gas reservoir in Wufeng and Longmaxi Formation of southeastern Sichuan Basin, China. J. Pet. Sci. Eng. 2020, 191, 107138. [Google Scholar] [CrossRef]
  10. Li, B.; Yang, J.; Yang, Y.; Li, C.; Zhang, Y. Sign language/gesture recognition based on cumulative distribution density features using UWB radar. IEEE Trans. Instrum. Meas. 2021, 70, 1–13. [Google Scholar] [CrossRef]
  11. Li, Y.T.; Liu, N.; Xu, J. Infrared scene-based non-uniformity correction based on deep learning model. Optik 2021, 227, 165899. [Google Scholar] [CrossRef]
  12. Yang, J.J.; Ou, B.; Li, H. Spatial resolution downscaling of uav thermal infrared images in mechanical manufacturing environment. Manuf. Autom. 2021, 43, 30–34. [Google Scholar]
  13. Hu, L.; Wang, Z.G.; Chen, T.; Zhang, Y.M. An improved SRGAN infrared image super-resolution reconstruction algorithm. J. Syst. Simul. 2021, 33, 2109–2118. [Google Scholar]
  14. Liu, H.; Shi, Z.; Li, J.; Liu, C.; Meng, X.; Du, Y.; Chen, J. Detection of road cavities in urban cities by 3D ground-penetrating radar. Geophysics 2021, 86, A25–A33. [Google Scholar] [CrossRef]
  15. Sui, T.; Marelli, D.; Sun, X.; Fu, M. Multi-sensor state estimation over lossy channels using coded measurements. Automatica 2020, 111, 108561. [Google Scholar] [CrossRef]
  16. Qian, R.D.; Zhao, D.; Zhou, H.X.; Yu, J.N.; Wang, S.C.; Rong, S.H. Non-uniformity correction algorithm based on weighted guided filter and temporal high-pass filter. Infrared Laser Eng. 2018, 47, 147–152. [Google Scholar]
  17. Zhang, S.; Zhou, H.X.; Niu, X.X.; Qin, H.L.; Qian, K. Temporal high-pass filter nonuniformity correction algorithm based on non-local means filter for infrared focal plane array. Acta Photonica Sin. 2014, 43, 153–156. [Google Scholar]
  18. Yu, Y.T.; Zheng, J.G.; Zhang, J.W.; Huang, X.; Xu, W.T. Prediction of settlement based on fusion model of Kalman filter and exponential smoothing algorithm. Chin. J. Geotech. Eng. 2021, 43, 127–131. [Google Scholar]
  19. Qian, W.; Chang, X.; Hu, L. Infrared and visible image pseudo color fusion algorithm based on improved color transfer strategy and NSCT. Infrared Technol. 2019, 41, 555–560. [Google Scholar]
  20. Liu, Y.; Zhang, Z.; Liu, X.; Wang, L.; Xia, X. Efficient image segmentation based on deep learning for mineral image classification. Adv. Powder Technol. 2021, 32, 3885–3903. [Google Scholar] [CrossRef]
  21. Liu, Y.; Zhang, Z.; Liu, X.; Wang, L.; Xia, X. Ore image classification based on small deep learning model: Evaluation and optimization of model depth, model structure and data size. Miner. Eng. 2021, 172, 107020. [Google Scholar] [CrossRef]
  22. Zheng, W.; Liu, X.; Yin, L. Research on image classification method based on improved multi-scale relational network. PeerJ Comput. Sci. 2021, 7, e613. [Google Scholar] [CrossRef] [PubMed]
  23. Liu, S.; Yang, B.; Wang, Y.; Tian, J.W.; Yin, L.R.; Zheng, W. 2D/3D Multimode medical image registration based on normalized cross-correlation. Appl. Sci. 2022, 12, 2828. [Google Scholar] [CrossRef]
  24. Li, Y.F.; Jiang, Y.; Chen, N.N.; Wu, L.; Fan, Y. Night-vision image coloration fusion in oRGB color space. Opt. Precis. Eng. 2018, 26, 2795–2804. [Google Scholar]
  25. Gong, X.; Wang, L.; Mou, Y.; Wang, H.; Wei, X.; Zheng, W.; Yin, L. Improved Four-channel PBTDPA control strategy using force feedback bilateral teleoperation system. Int. J. Control Autom. Syst. 2022, 20, 1002–1017. [Google Scholar] [CrossRef]
  26. Li, J.; Xu, K.; Chaudhuri, S.; Yumer, E.; Zhang, H.; Guibas, L. GRASS: Generative recursive autoencoders for shape structures. ACM Trans. Graph. 2017, 36, 1–14. [Google Scholar] [CrossRef]
  27. Chen, J.; Du, L.; Guo, Y. Label constrained convolutional factor analysis for classification with limited training samples. Inf. Sci. 2021, 544, 372–394. [Google Scholar] [CrossRef]
  28. Zhang, J.; Zhu, C.; Zheng, L.; Xu, K. ROSEFusion: Random optimization for online dense reconstruction under fast camera motion. ACM Trans. Graph. 2021, 40, 1–17. [Google Scholar]
  29. Fu, J.Q.; Chen, C.; Guo, B.Y.; Chu, Y.L.; Zheng, H. A split-window method to retrieving sea surface temperature from landsat & thermal infrared remote sensing data in offshore waters. Estuar. Coast. Shelf Sci. 2020, 236, 106626. [Google Scholar]
  30. Liu, H.; Liu, J.; Hou, S.; Tao, T.; Han, J. Perception consistency ultrasound image super-resolution via self-supervised CycleGAN. Neural Comput. Appl. 2021, 1–11. [Google Scholar] [CrossRef]
  31. Fan, S.Y.; Wang, Y.; Cao, S.X.; Sun, T.Y.; Liu, P. A novel method for analyzing the effect of dust accumulation on energy efficiency loss in photovoltaic (PV) system. Energy 2021, 234, 121112. [Google Scholar] [CrossRef]
  32. Xu, C.L.; Qu, S.B.; Wang, J.F.; Yan, M.B.; Pang, Y.Q.; Wang, W.J.; Wang, A.; Fan, Q. Dual atmospheric windows infrared stealth research based on frequency selective surface. J. Infrared Millim. Waves 2019, 38, 315–319+370. [Google Scholar]
  33. Dai, S.S.; Zhang, T.Q. Improvement on multi-point correction method of IRFPA. Infrared Technol. 2007, 468–471. [Google Scholar]
  34. Li, X.Y.; Yang, W.; Liu, B.; Fan, W.Q.; Zhang, X.Y. Segmentation method for mine personnel images based on superpixel granulation and homogenous image granules. J. China Coal Soc. 2021, 46, 1341–1354. [Google Scholar]
  35. Cai, T.T.; Dong, M.Y.; Liu, H.N.; Nojavan, S. Integration of hydrogen storage system and wind generation in power systems under demand response program: A novel p-robust stochastic programming. Int. J. Hydrogen Energy 2022, 47, 443–458. [Google Scholar] [CrossRef]
  36. Fan, S.Y.; Wang, Y.; Cao, S.X.; Zhao, B.; Sun, T.Y.; Liu, P. A deep residual neural network identification method for uneven dust accumulation on photovoltaic (PV) panels. Energy 2022, 239, 122302. [Google Scholar] [CrossRef]
  37. Zhang, F.; Xu, Z.C. A mine image reconstruction method based on residual neural network. J. China Coal Soc. 2019, 44, 3614–3624. [Google Scholar]
  38. Wang, M.L.; Tian, Z.J. Mine image enhancement algorithm based on nonsubsampled contourlet transform. J. China Coal Soc. 2020, 45, 3351–3362. [Google Scholar]
  39. Sun, J.P.; Cao, Y.C. Coal-mine flood perception method based on image texture features. J. China Coal Soc. 2019, 44, 2936–2944. [Google Scholar]
  40. Tian, Z.J.; Wang, M.L.; Wu, J.; Gui, W.F.; Wang, W.Q. Mine image enhancement algorithm based on dual domain decomposition. Acta Photonica Sin. 2019, 48, 107–119. [Google Scholar]
  41. Zhi, N.; Mao, S.J.; Li, M. Enhancement algorithm based on illumination adjustment for non-uniform illuminance video images in coal mine. J. China Coal Soc. 2017, 42, 2190–2197. [Google Scholar]
Figure 1. Curve of radiation spectrum and visible light transmittance in the atmosphere.
Processes 10 01142 g001
Figure 2. Overall diagram of an uncooled infrared imaging system.
Processes 10 01142 g002
Figure 3. Detector pixel response curve.
Processes 10 01142 g003
Figure 4. Test results.
Processes 10 01142 g004
Table 1. Nonuniformity by the two algorithms.
Blackbody temperature/°C35557595115
After correction10.968.958.027.126.32
After five-point correction (%)4.014.522.492.893.31
After multipoint correction (%)3.983.962.272.632.99
Table 2. The number of CPU cycles occupied by the two algorithms.
Five-Point CorrectionMultipoint Correction of Human Eyes
Cycle/frame52 462 24818 257 363
Frequency (Hz)12.1629.97
Publisher’s Note: MDPI stays neutral with regard to jurisdictional claims in published maps and institutional affiliations.

