
The Effect of pH Solution in the Sol–Gel Process on the Structure and Properties of Thin SnO2 Films

 ,
,
Abstract
:
1. Introduction
2. Methods
2.1. Materials and Synthesis
2.2. Characterization Methods
3. Results and Discussion
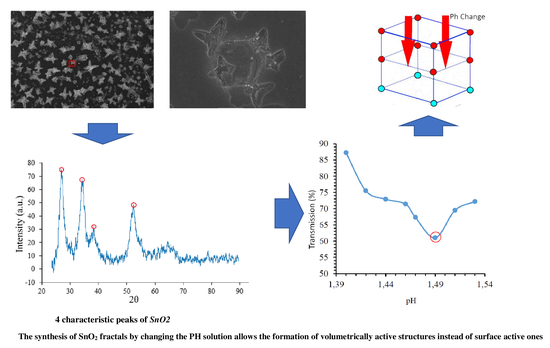
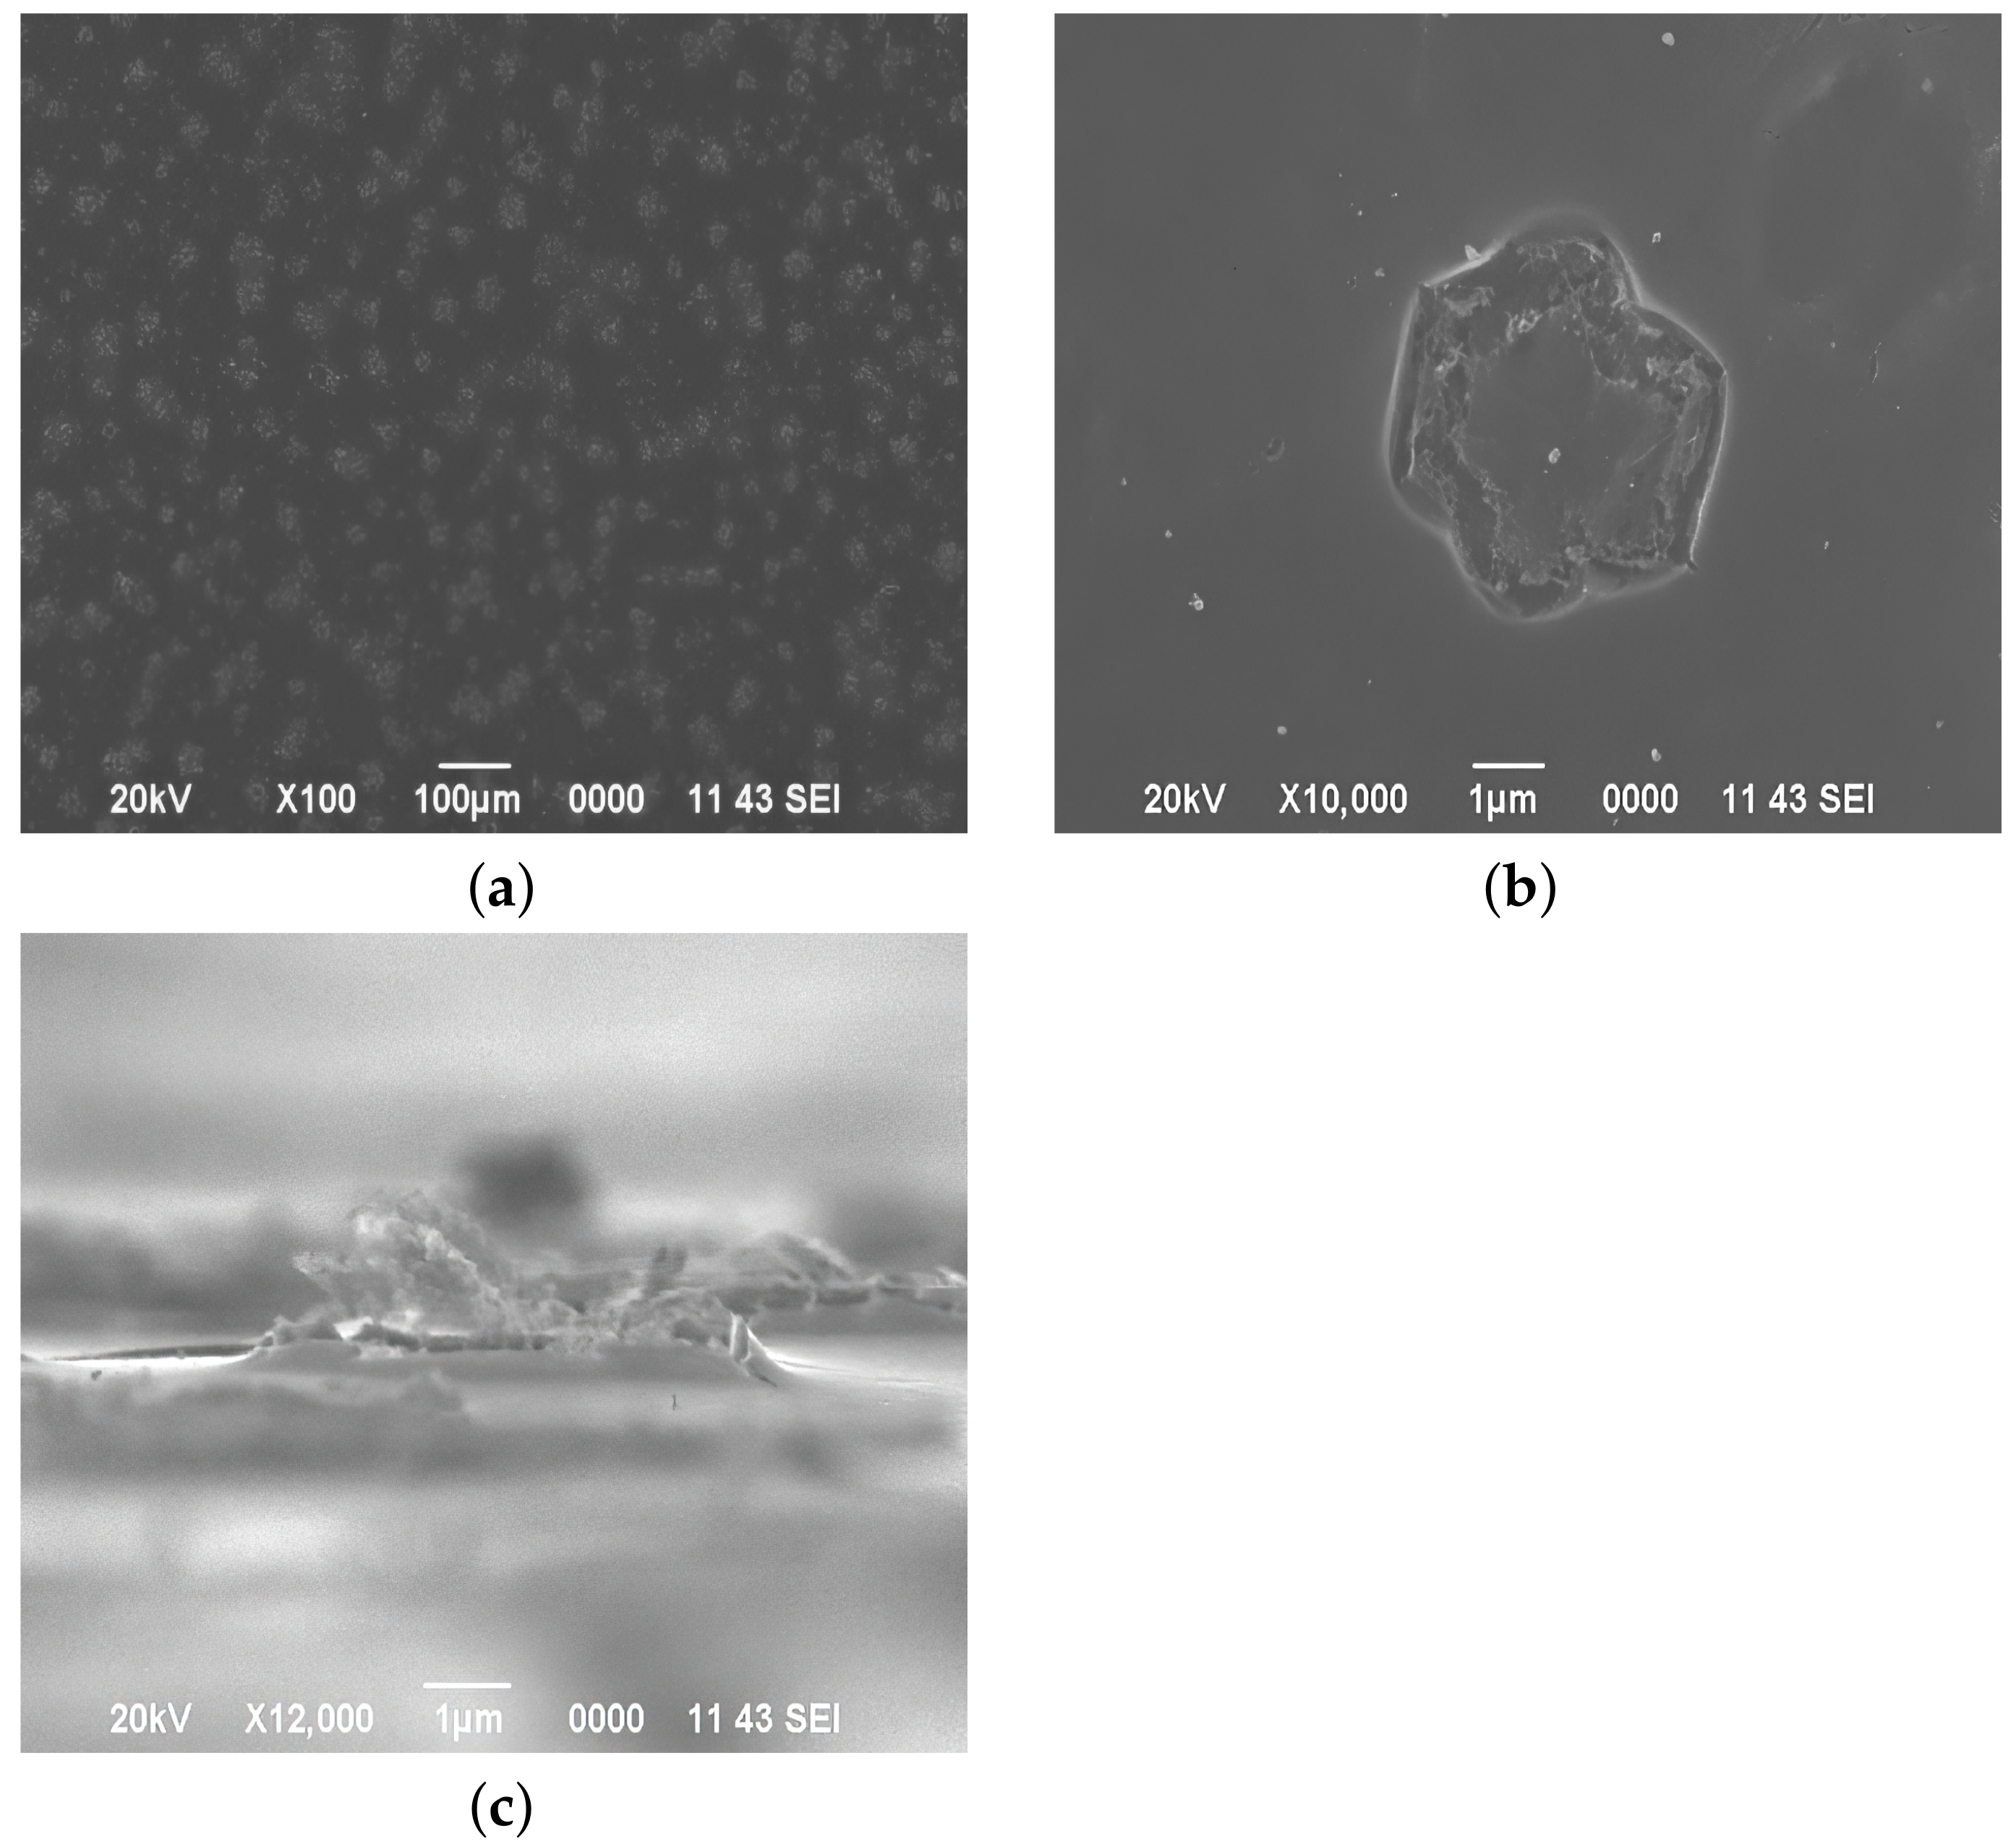
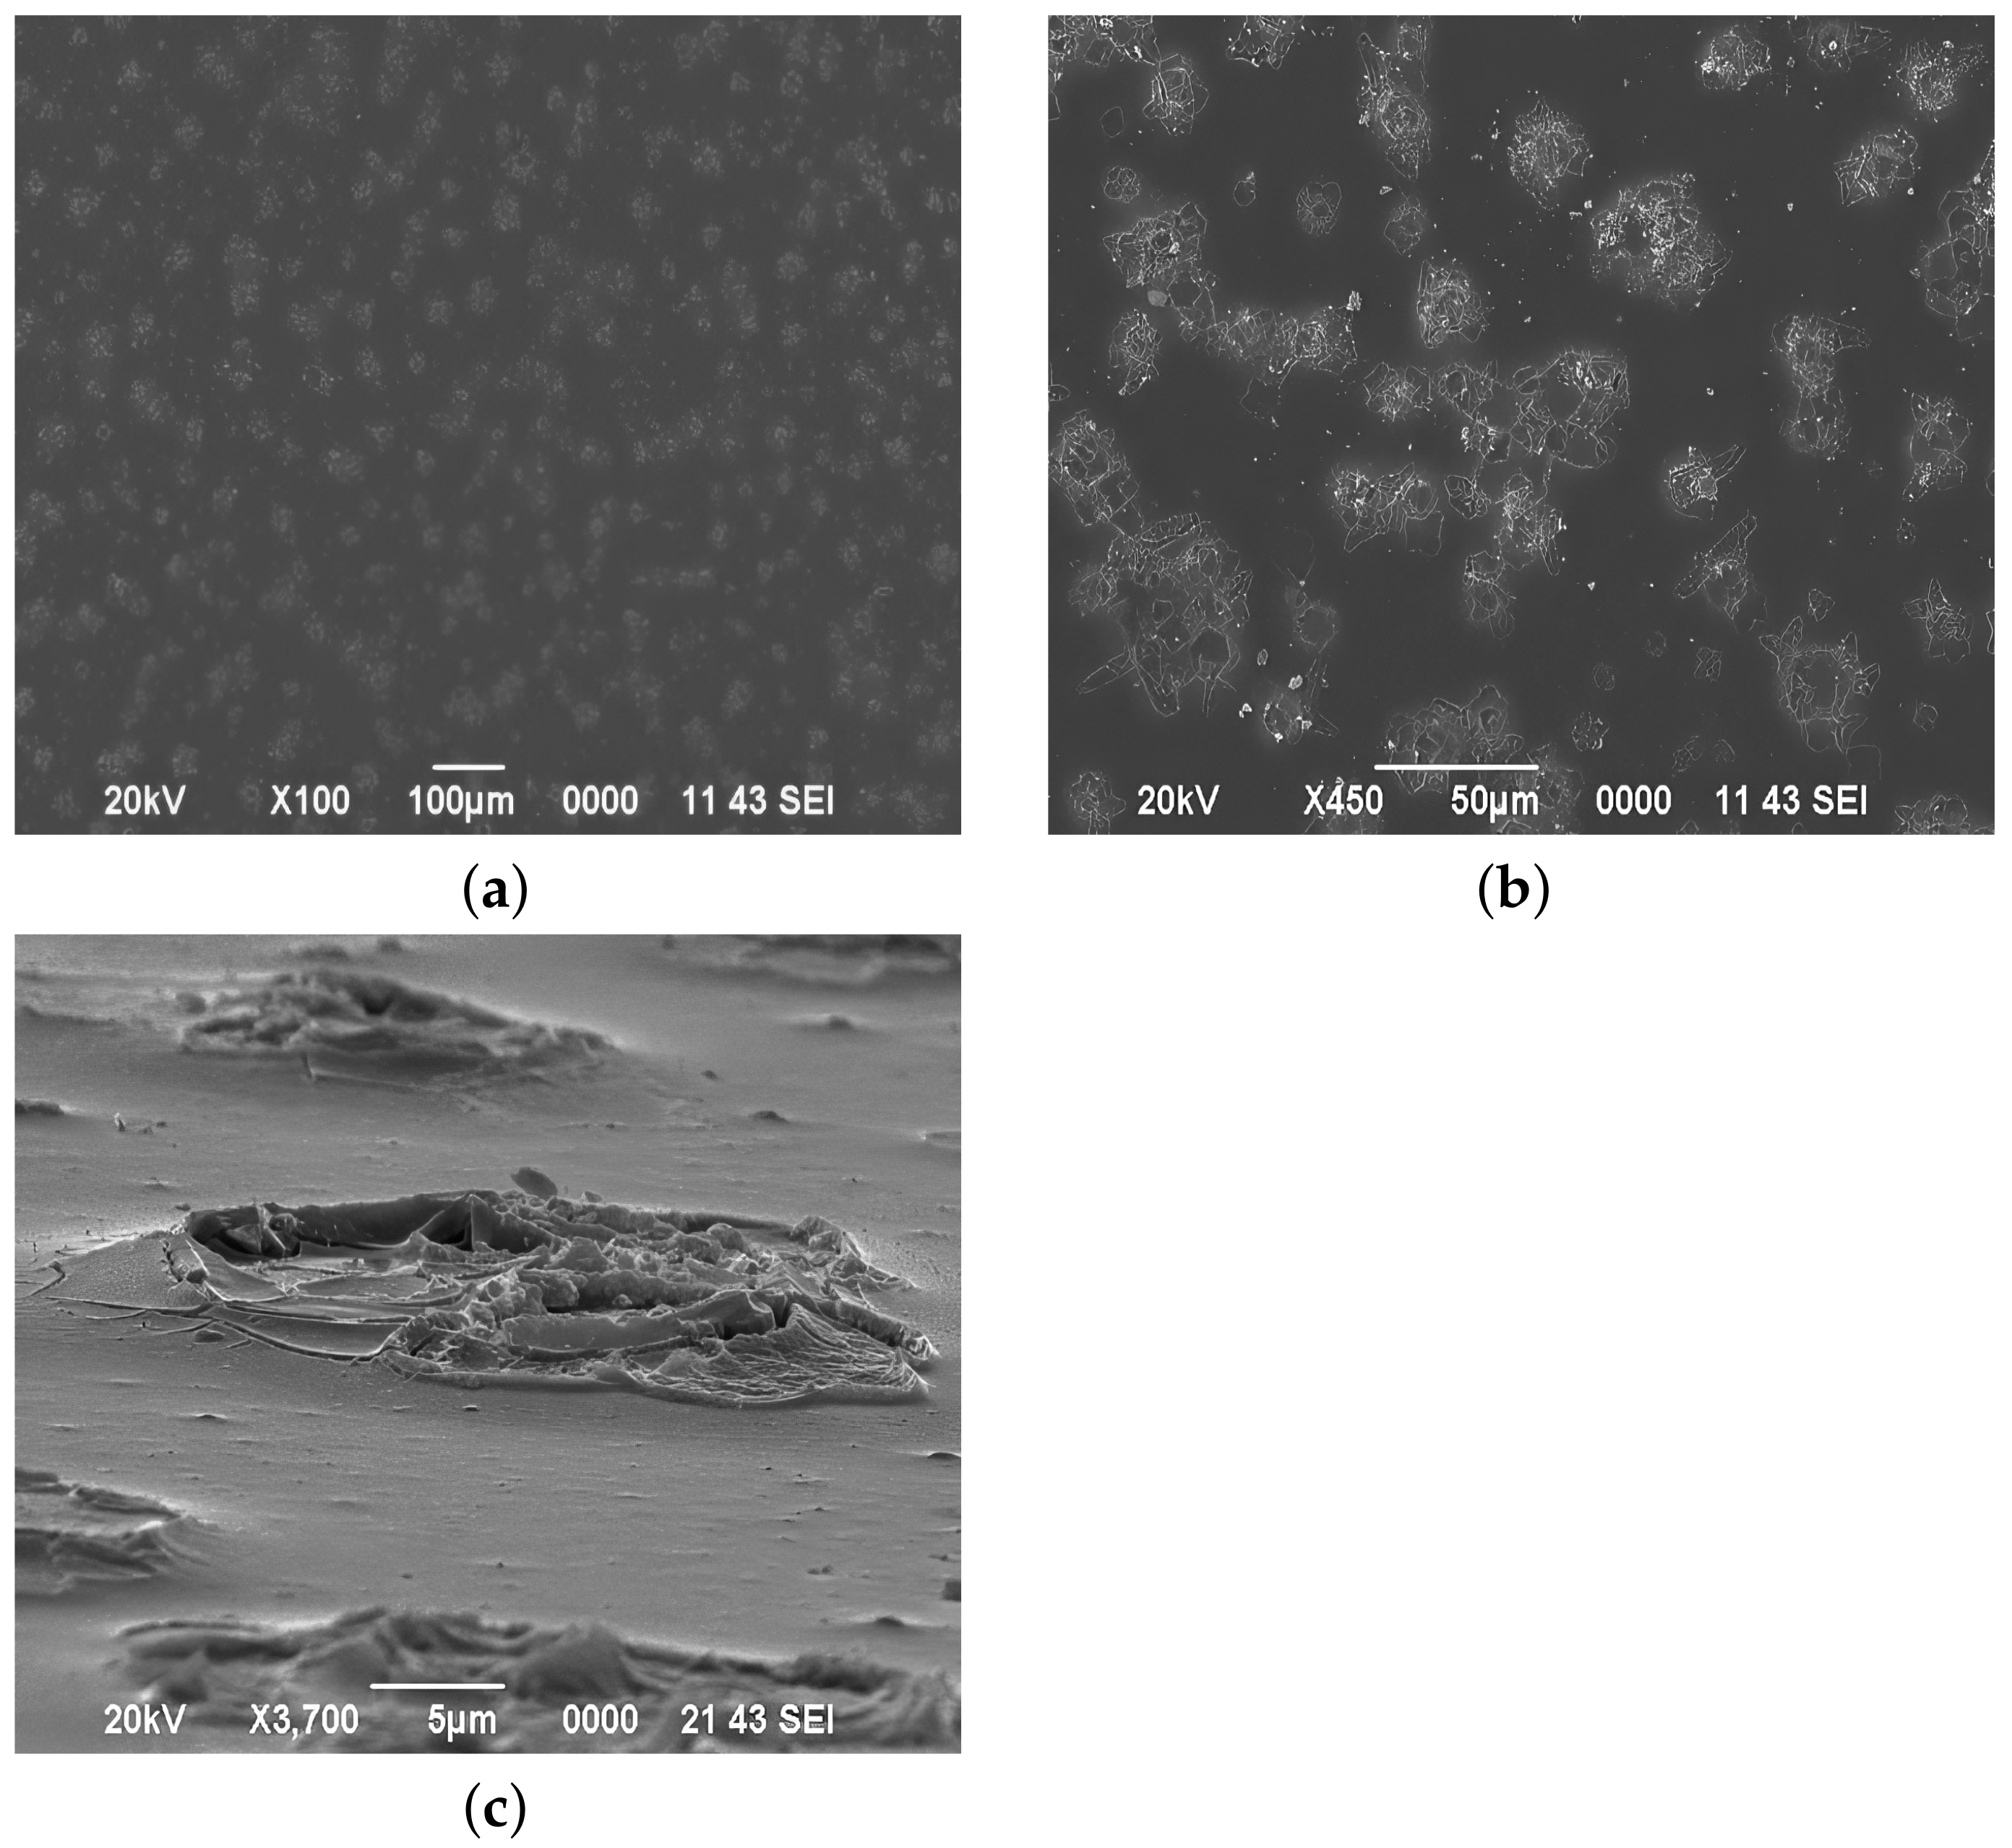
3.1. Influence of Chemical Parameters of Film-Forming Systems on the Structure of Films
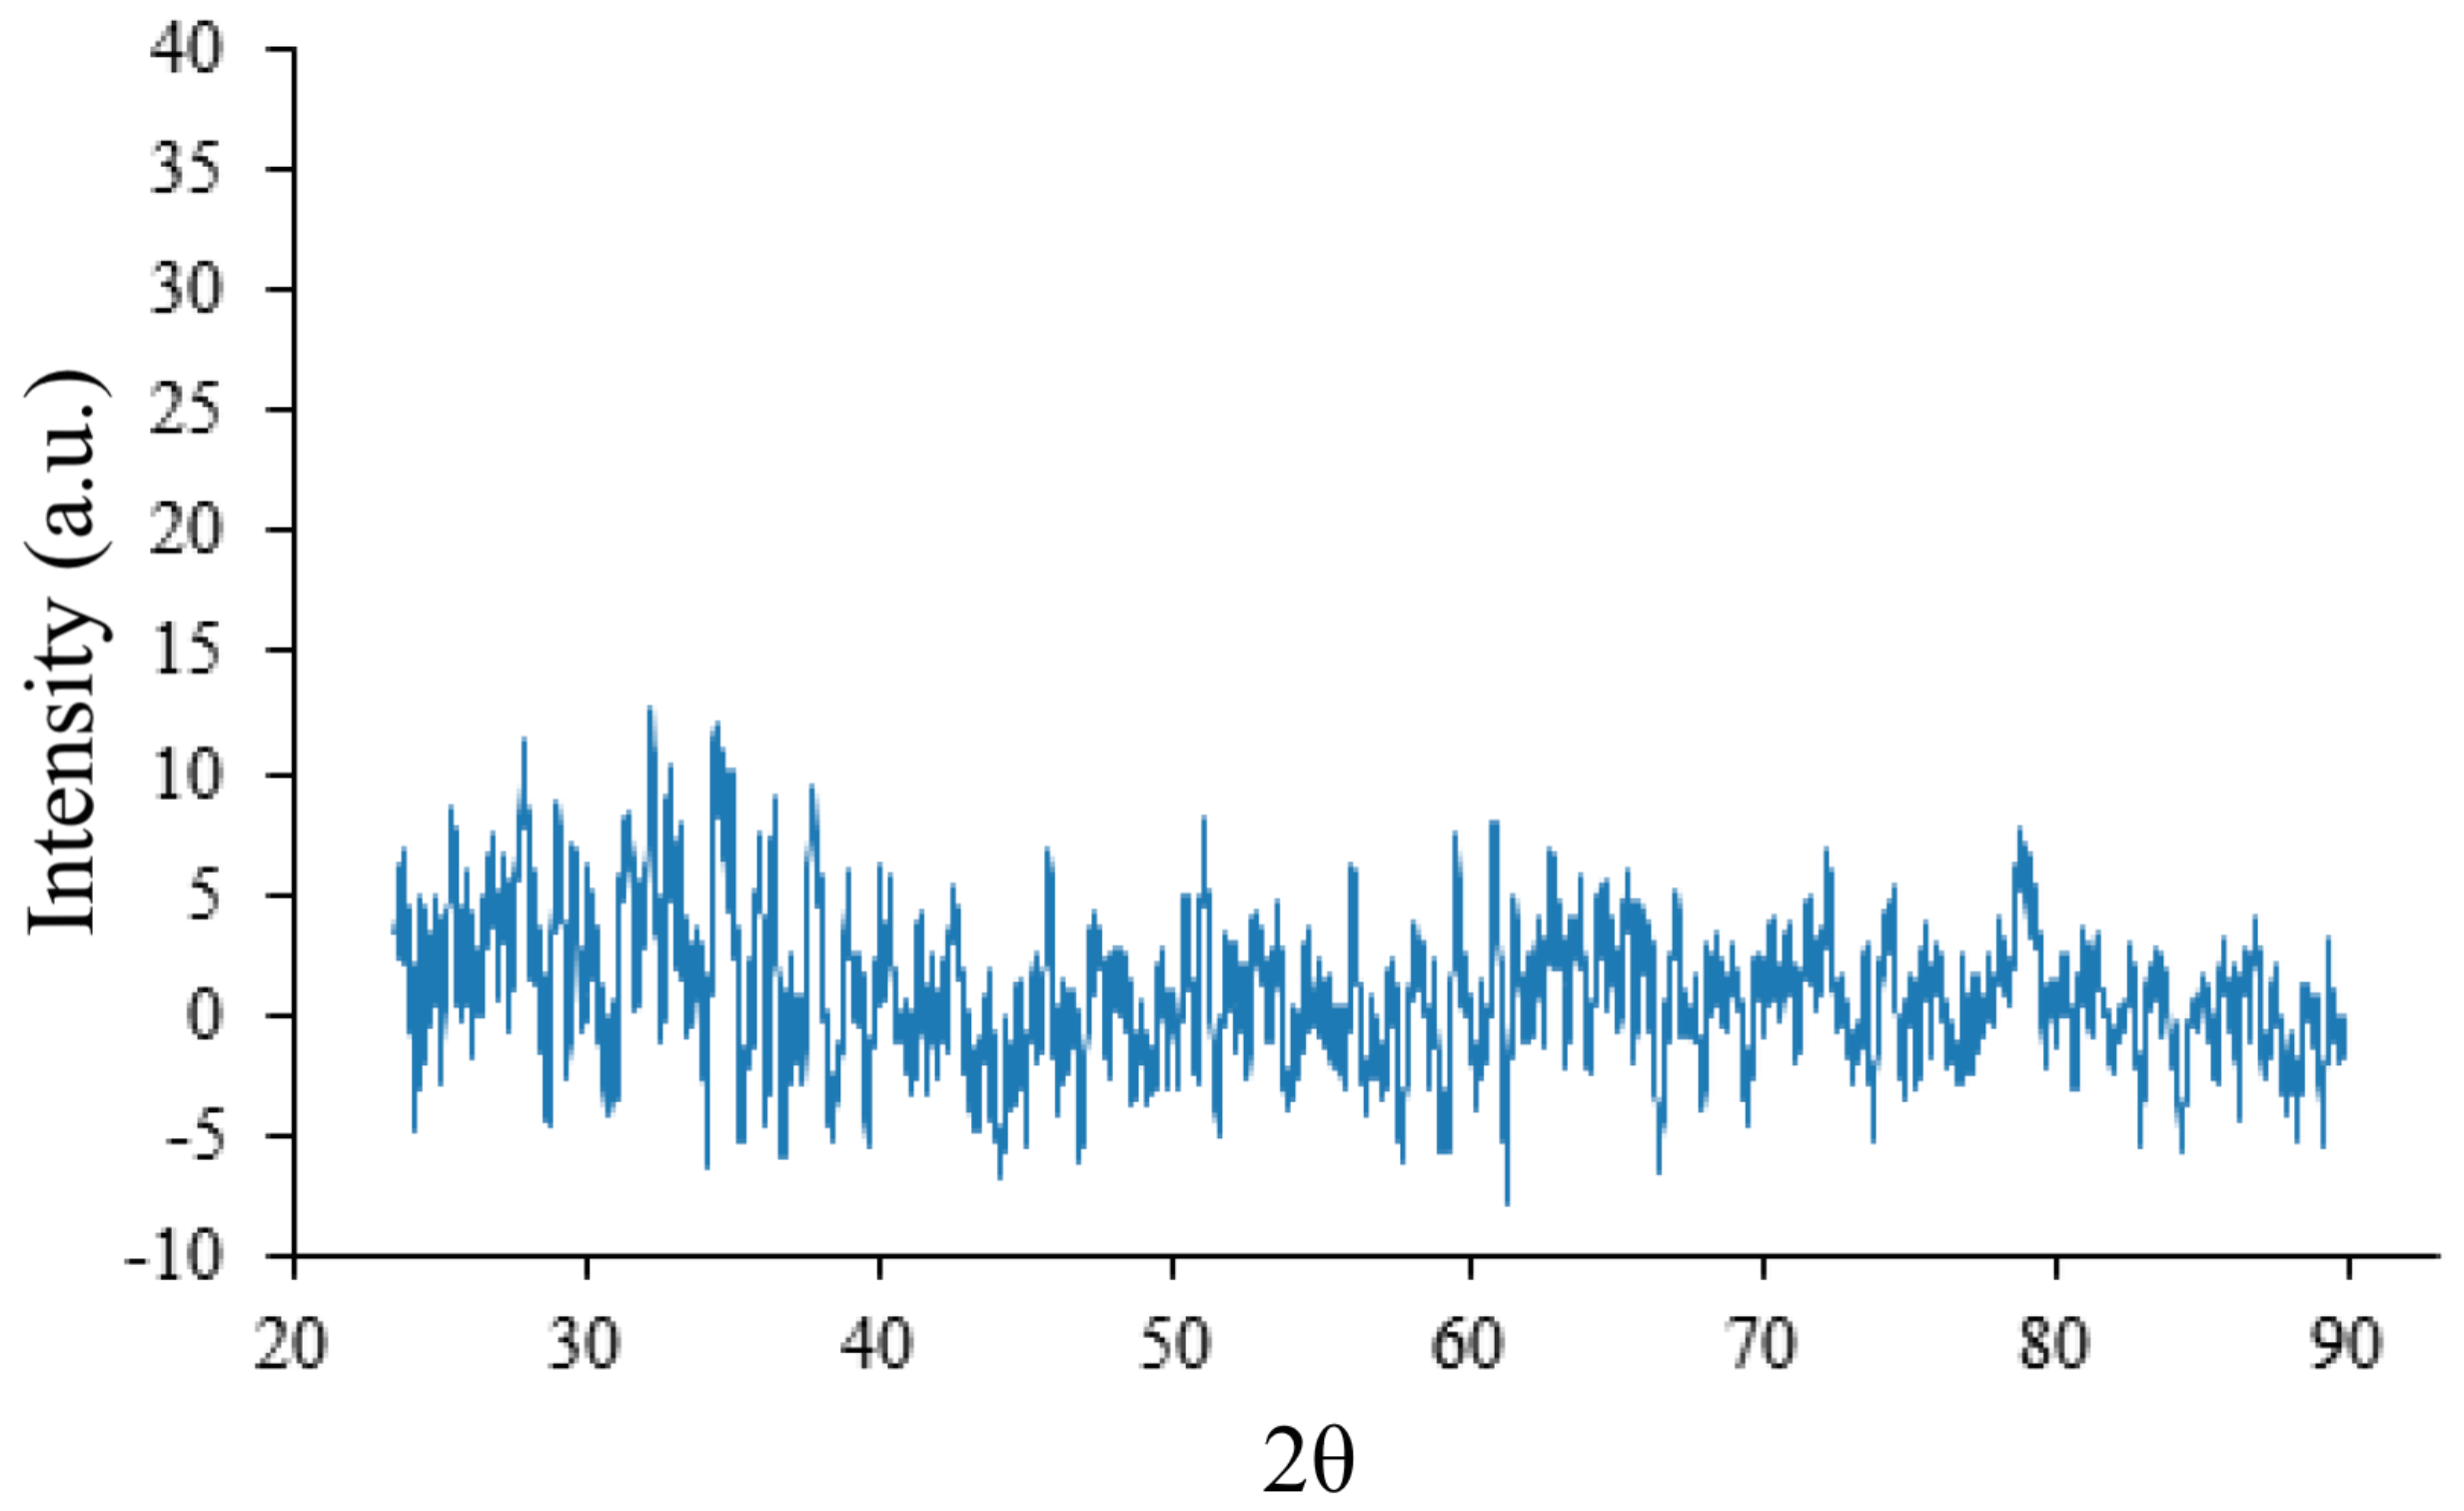
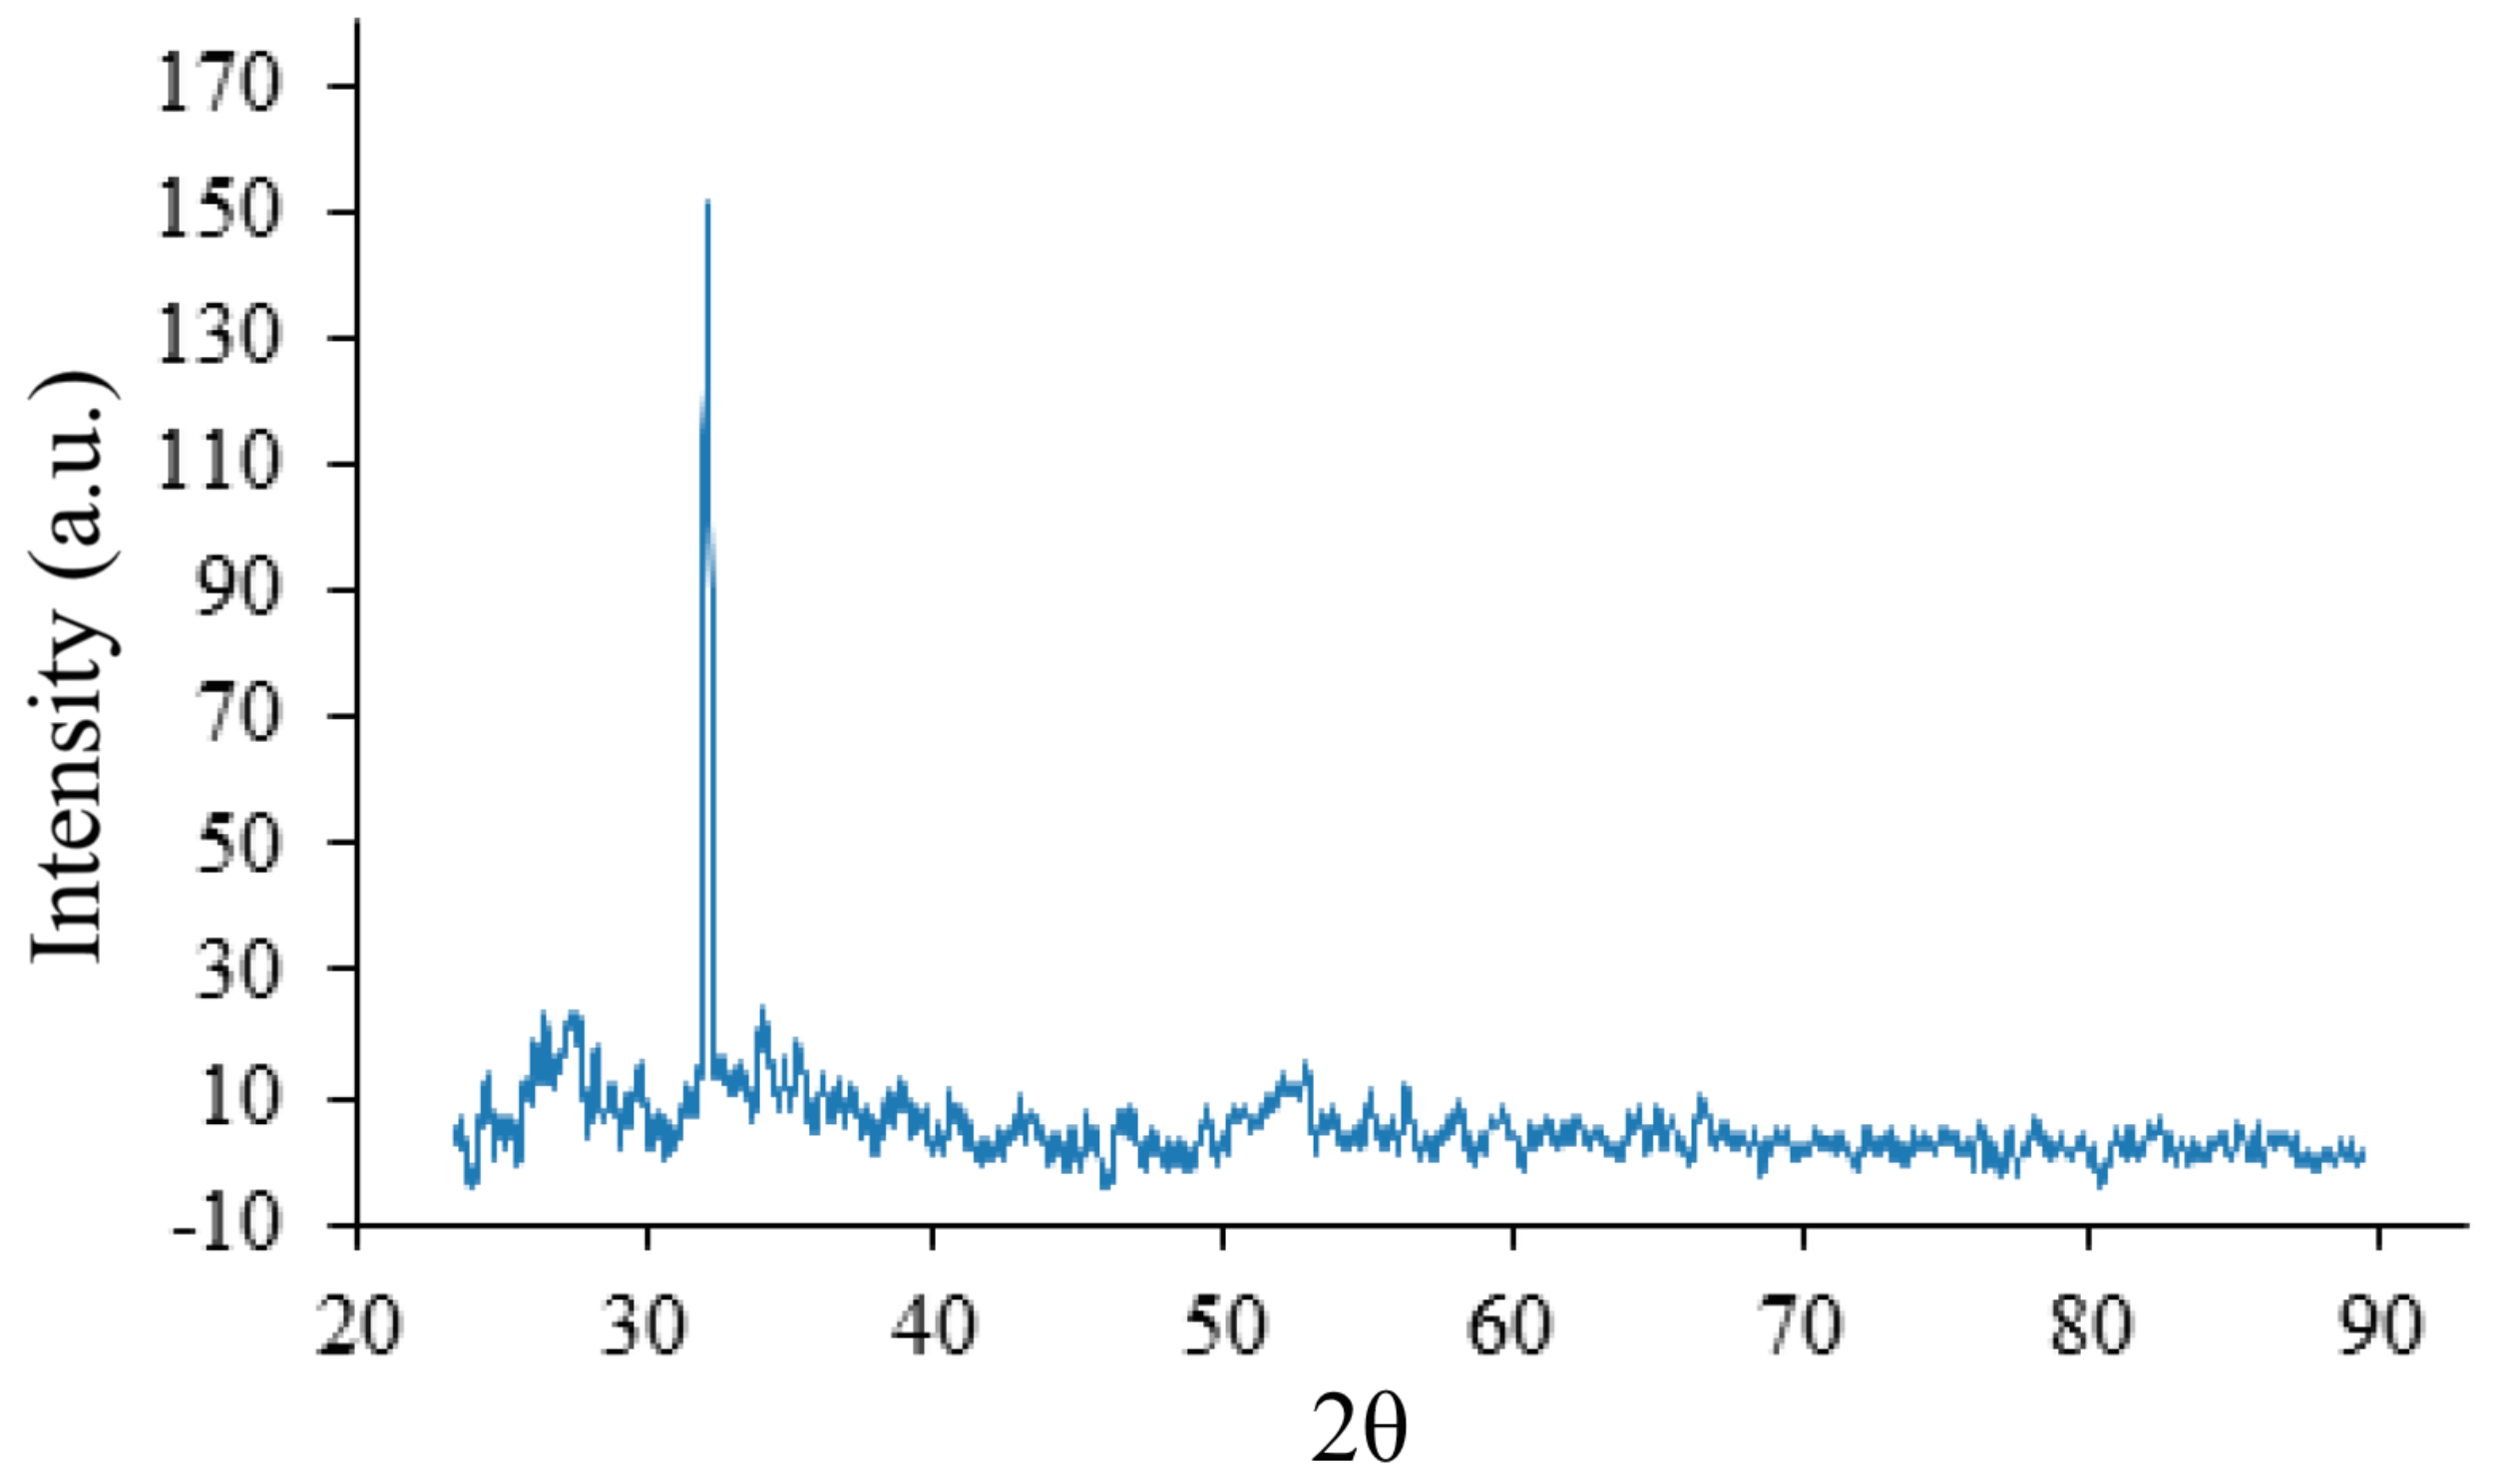
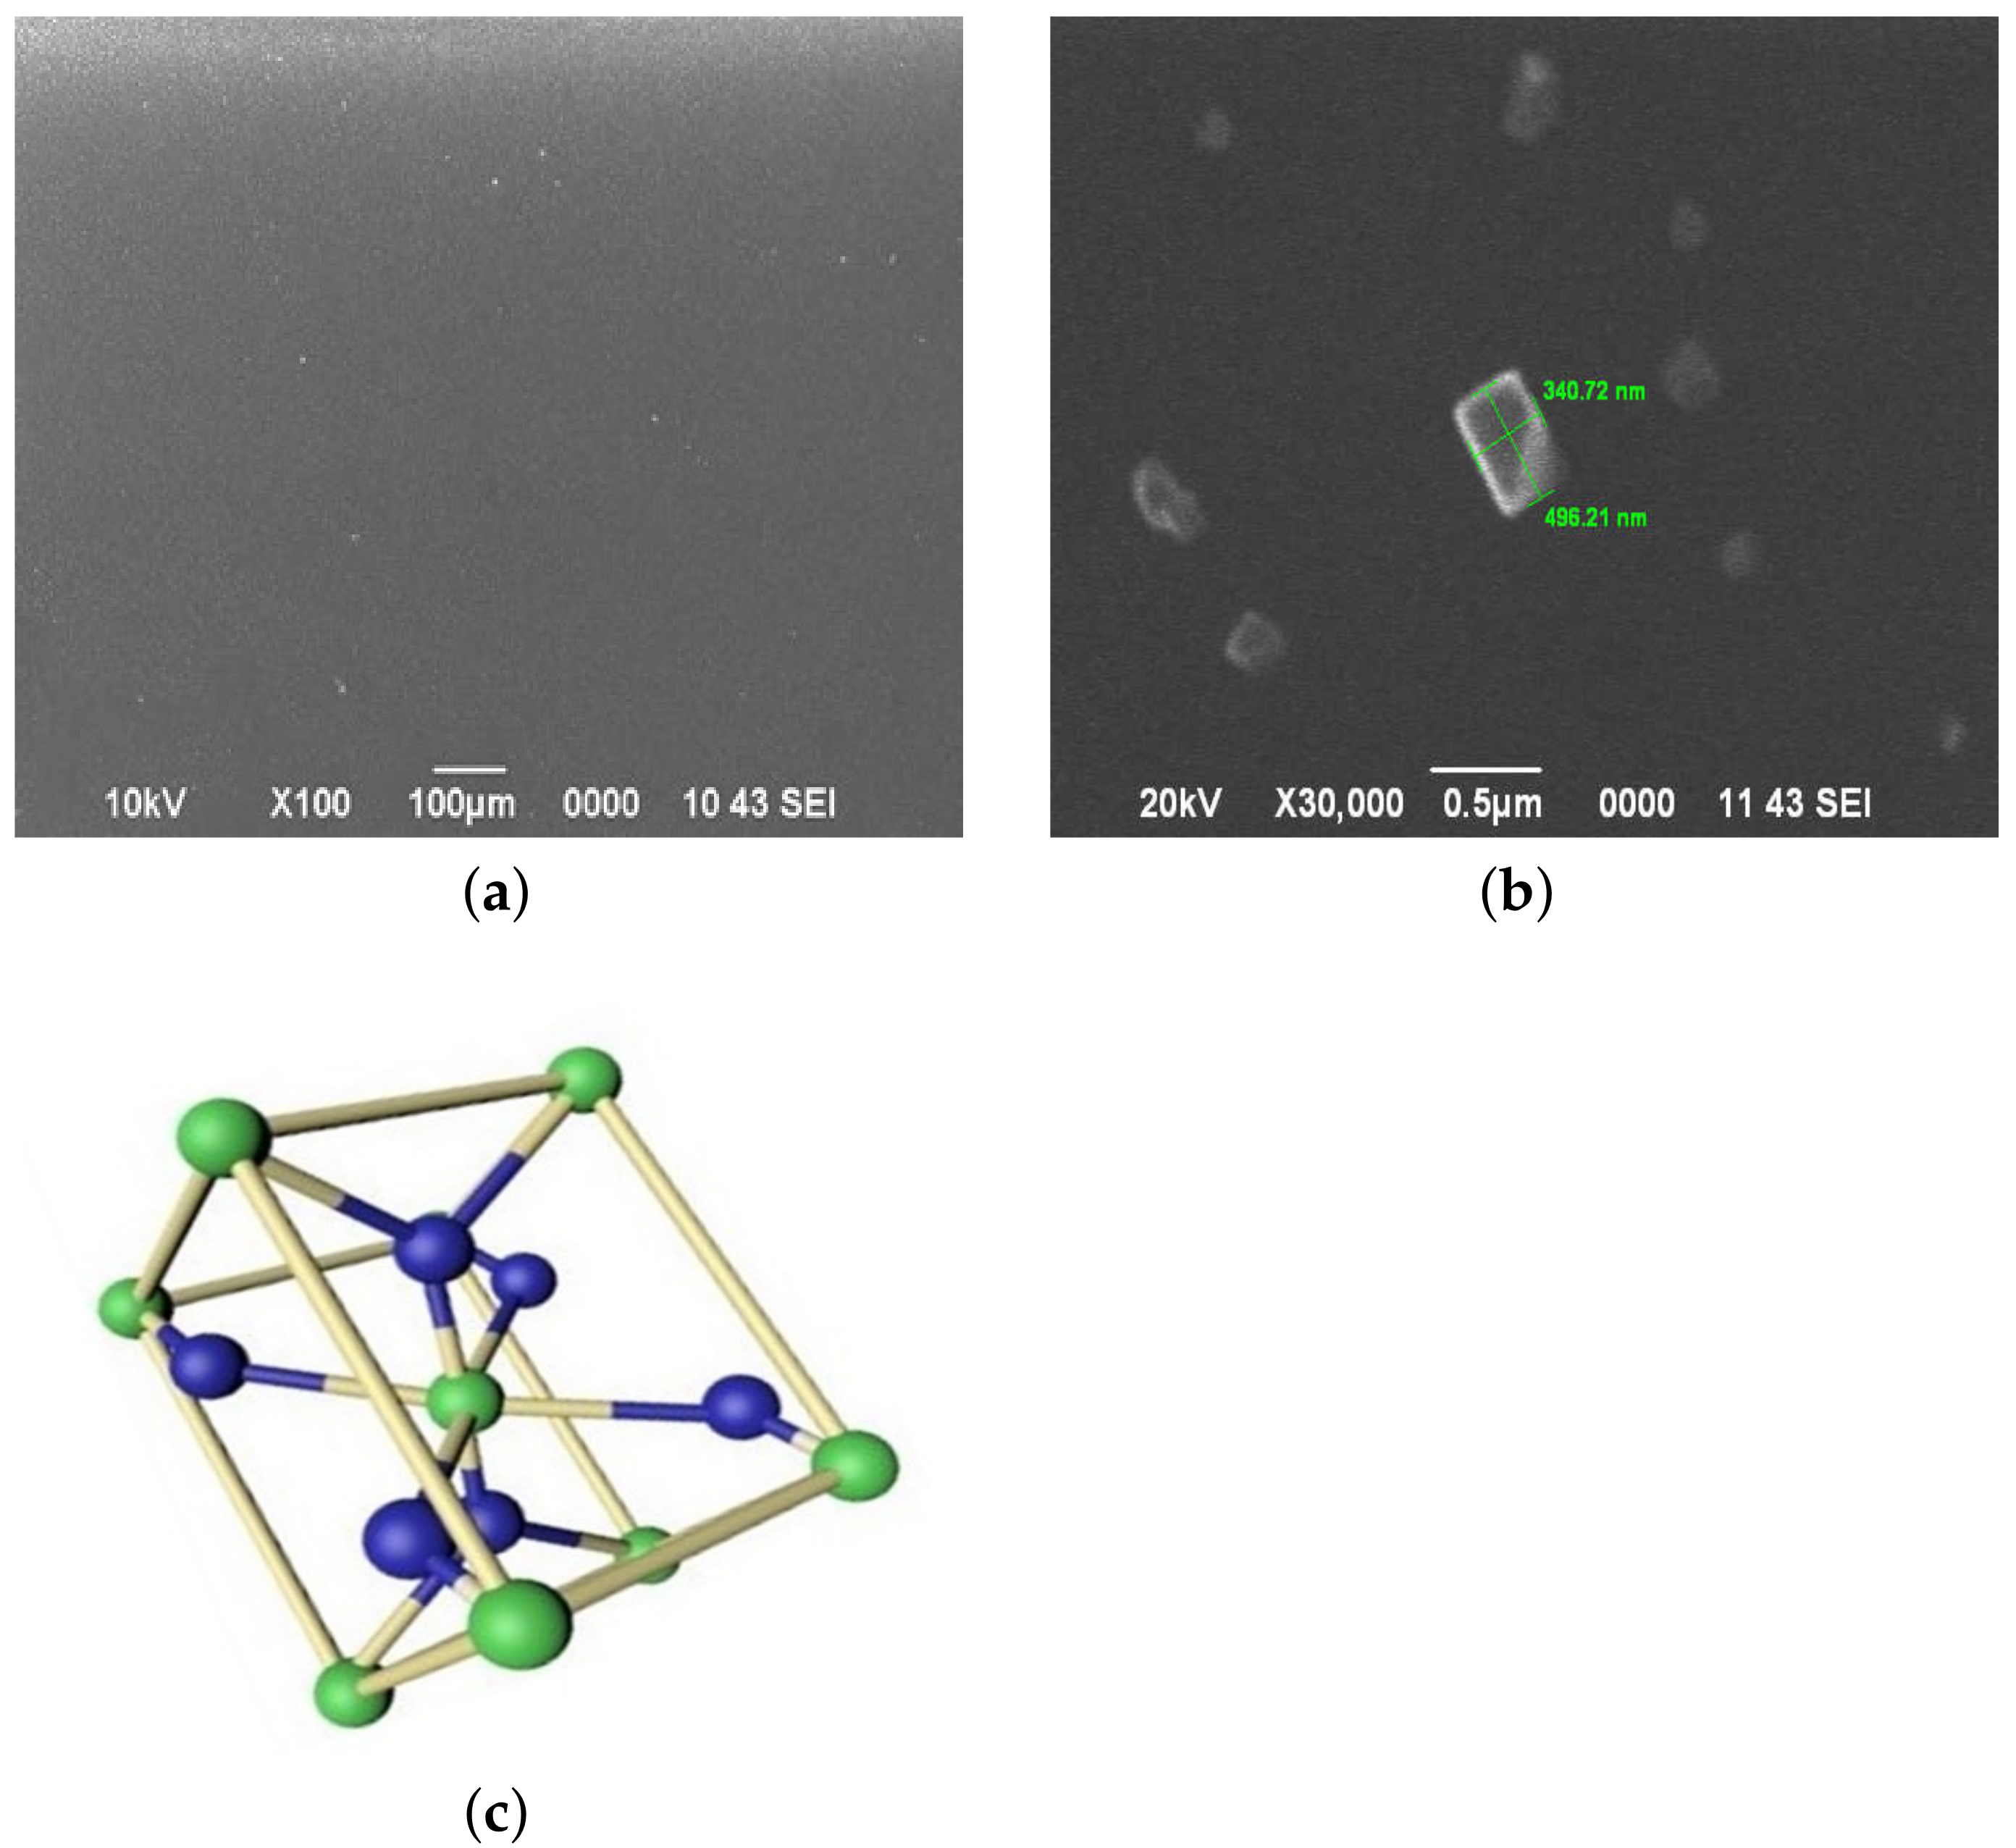
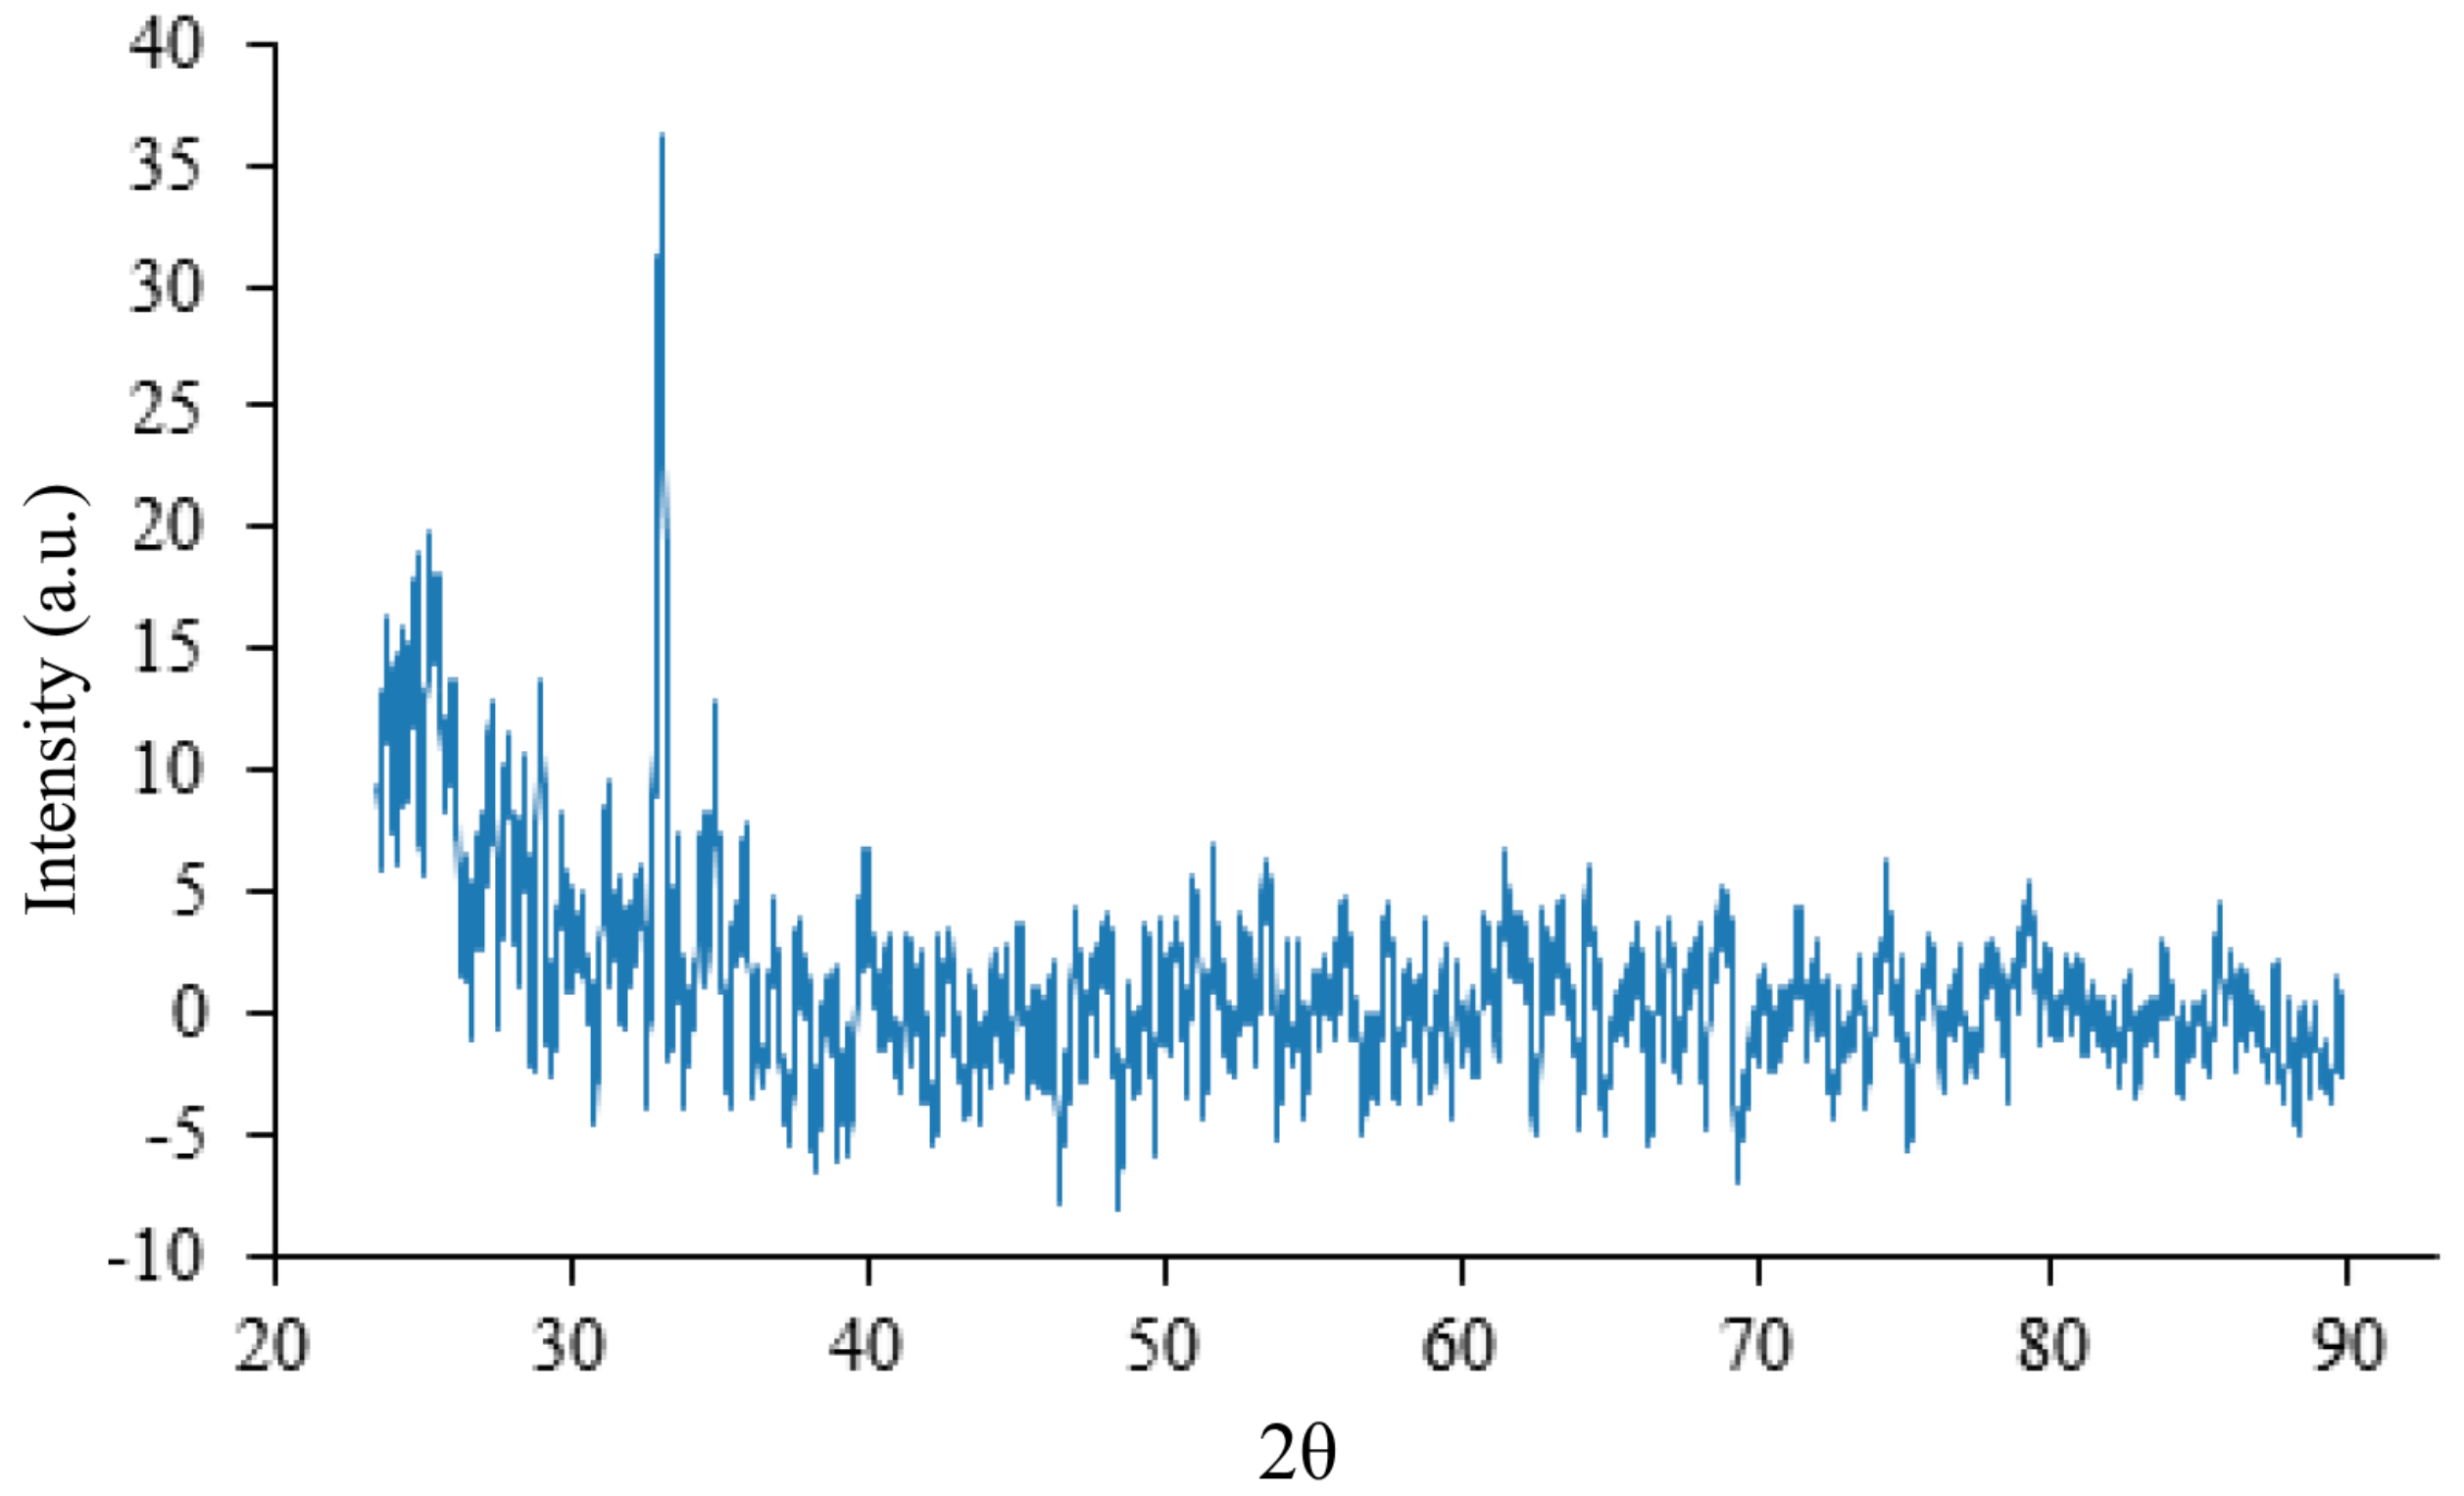
3.2. Study of the Structure of Films
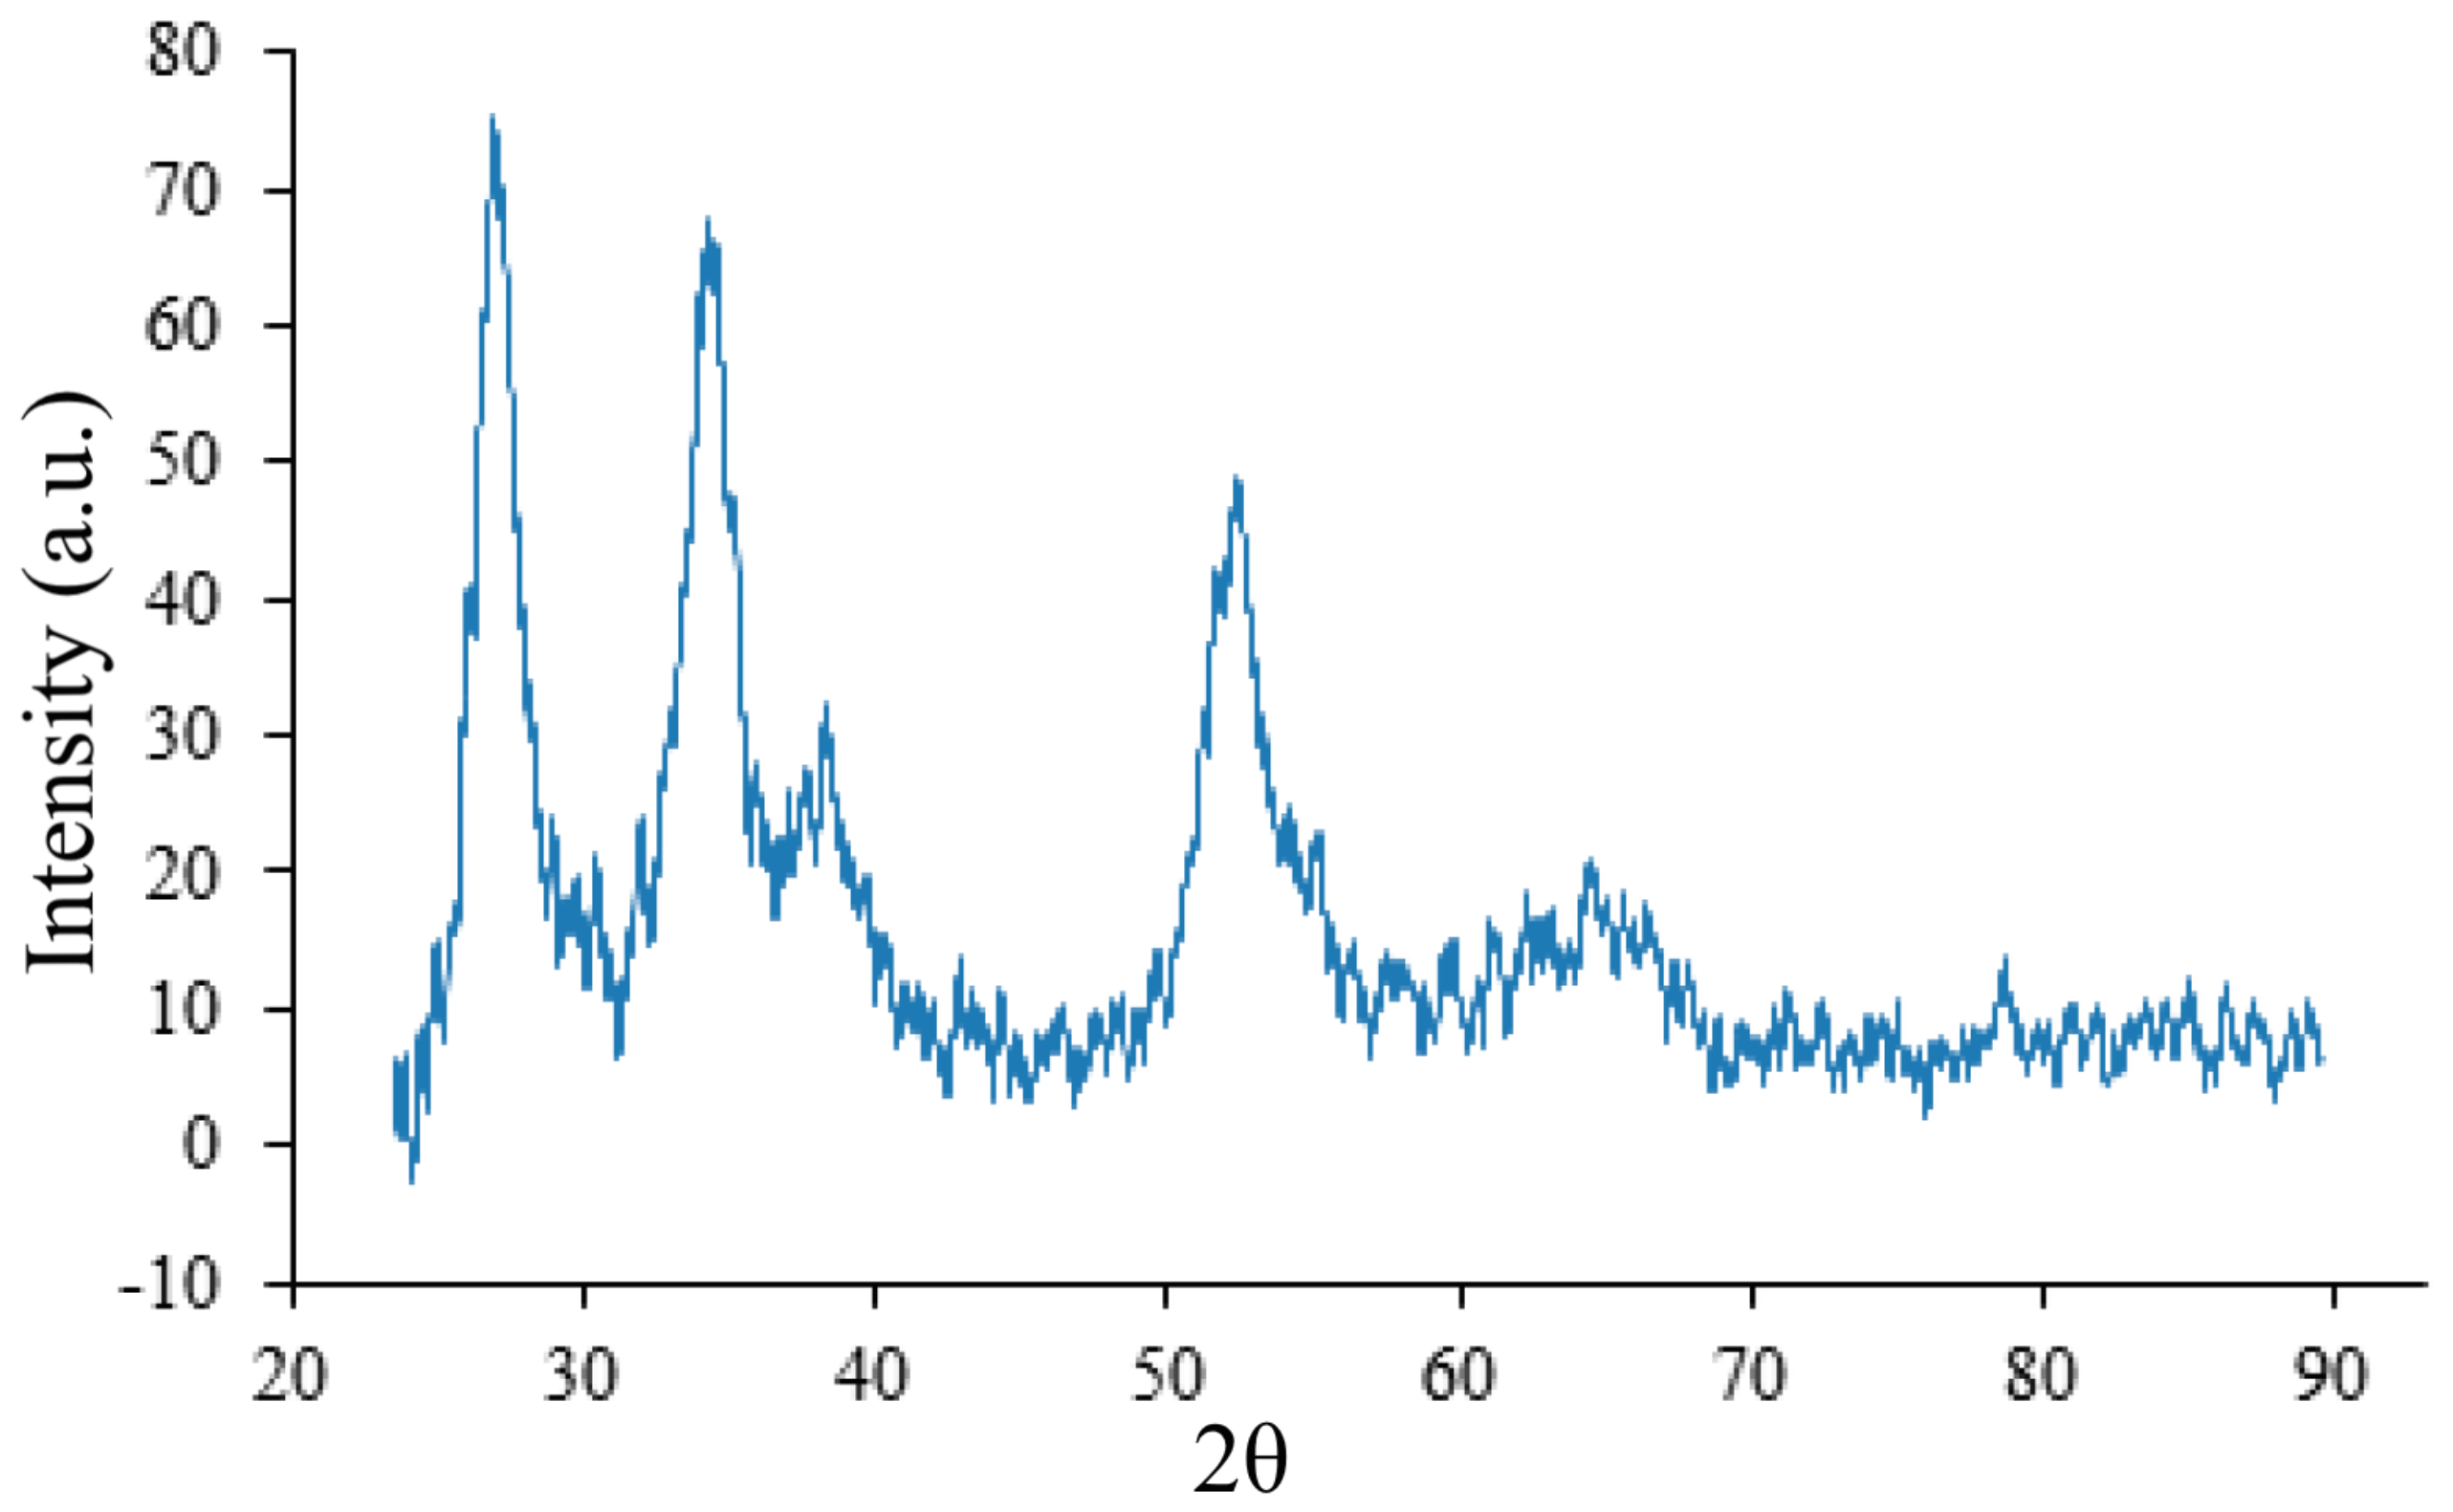
3.3. The Structure of the Films as a Function of the Annealing Temperature
3.4. Influence of the Chemical Parameters of Film-Forming Solutions on the Optical Properties of Films
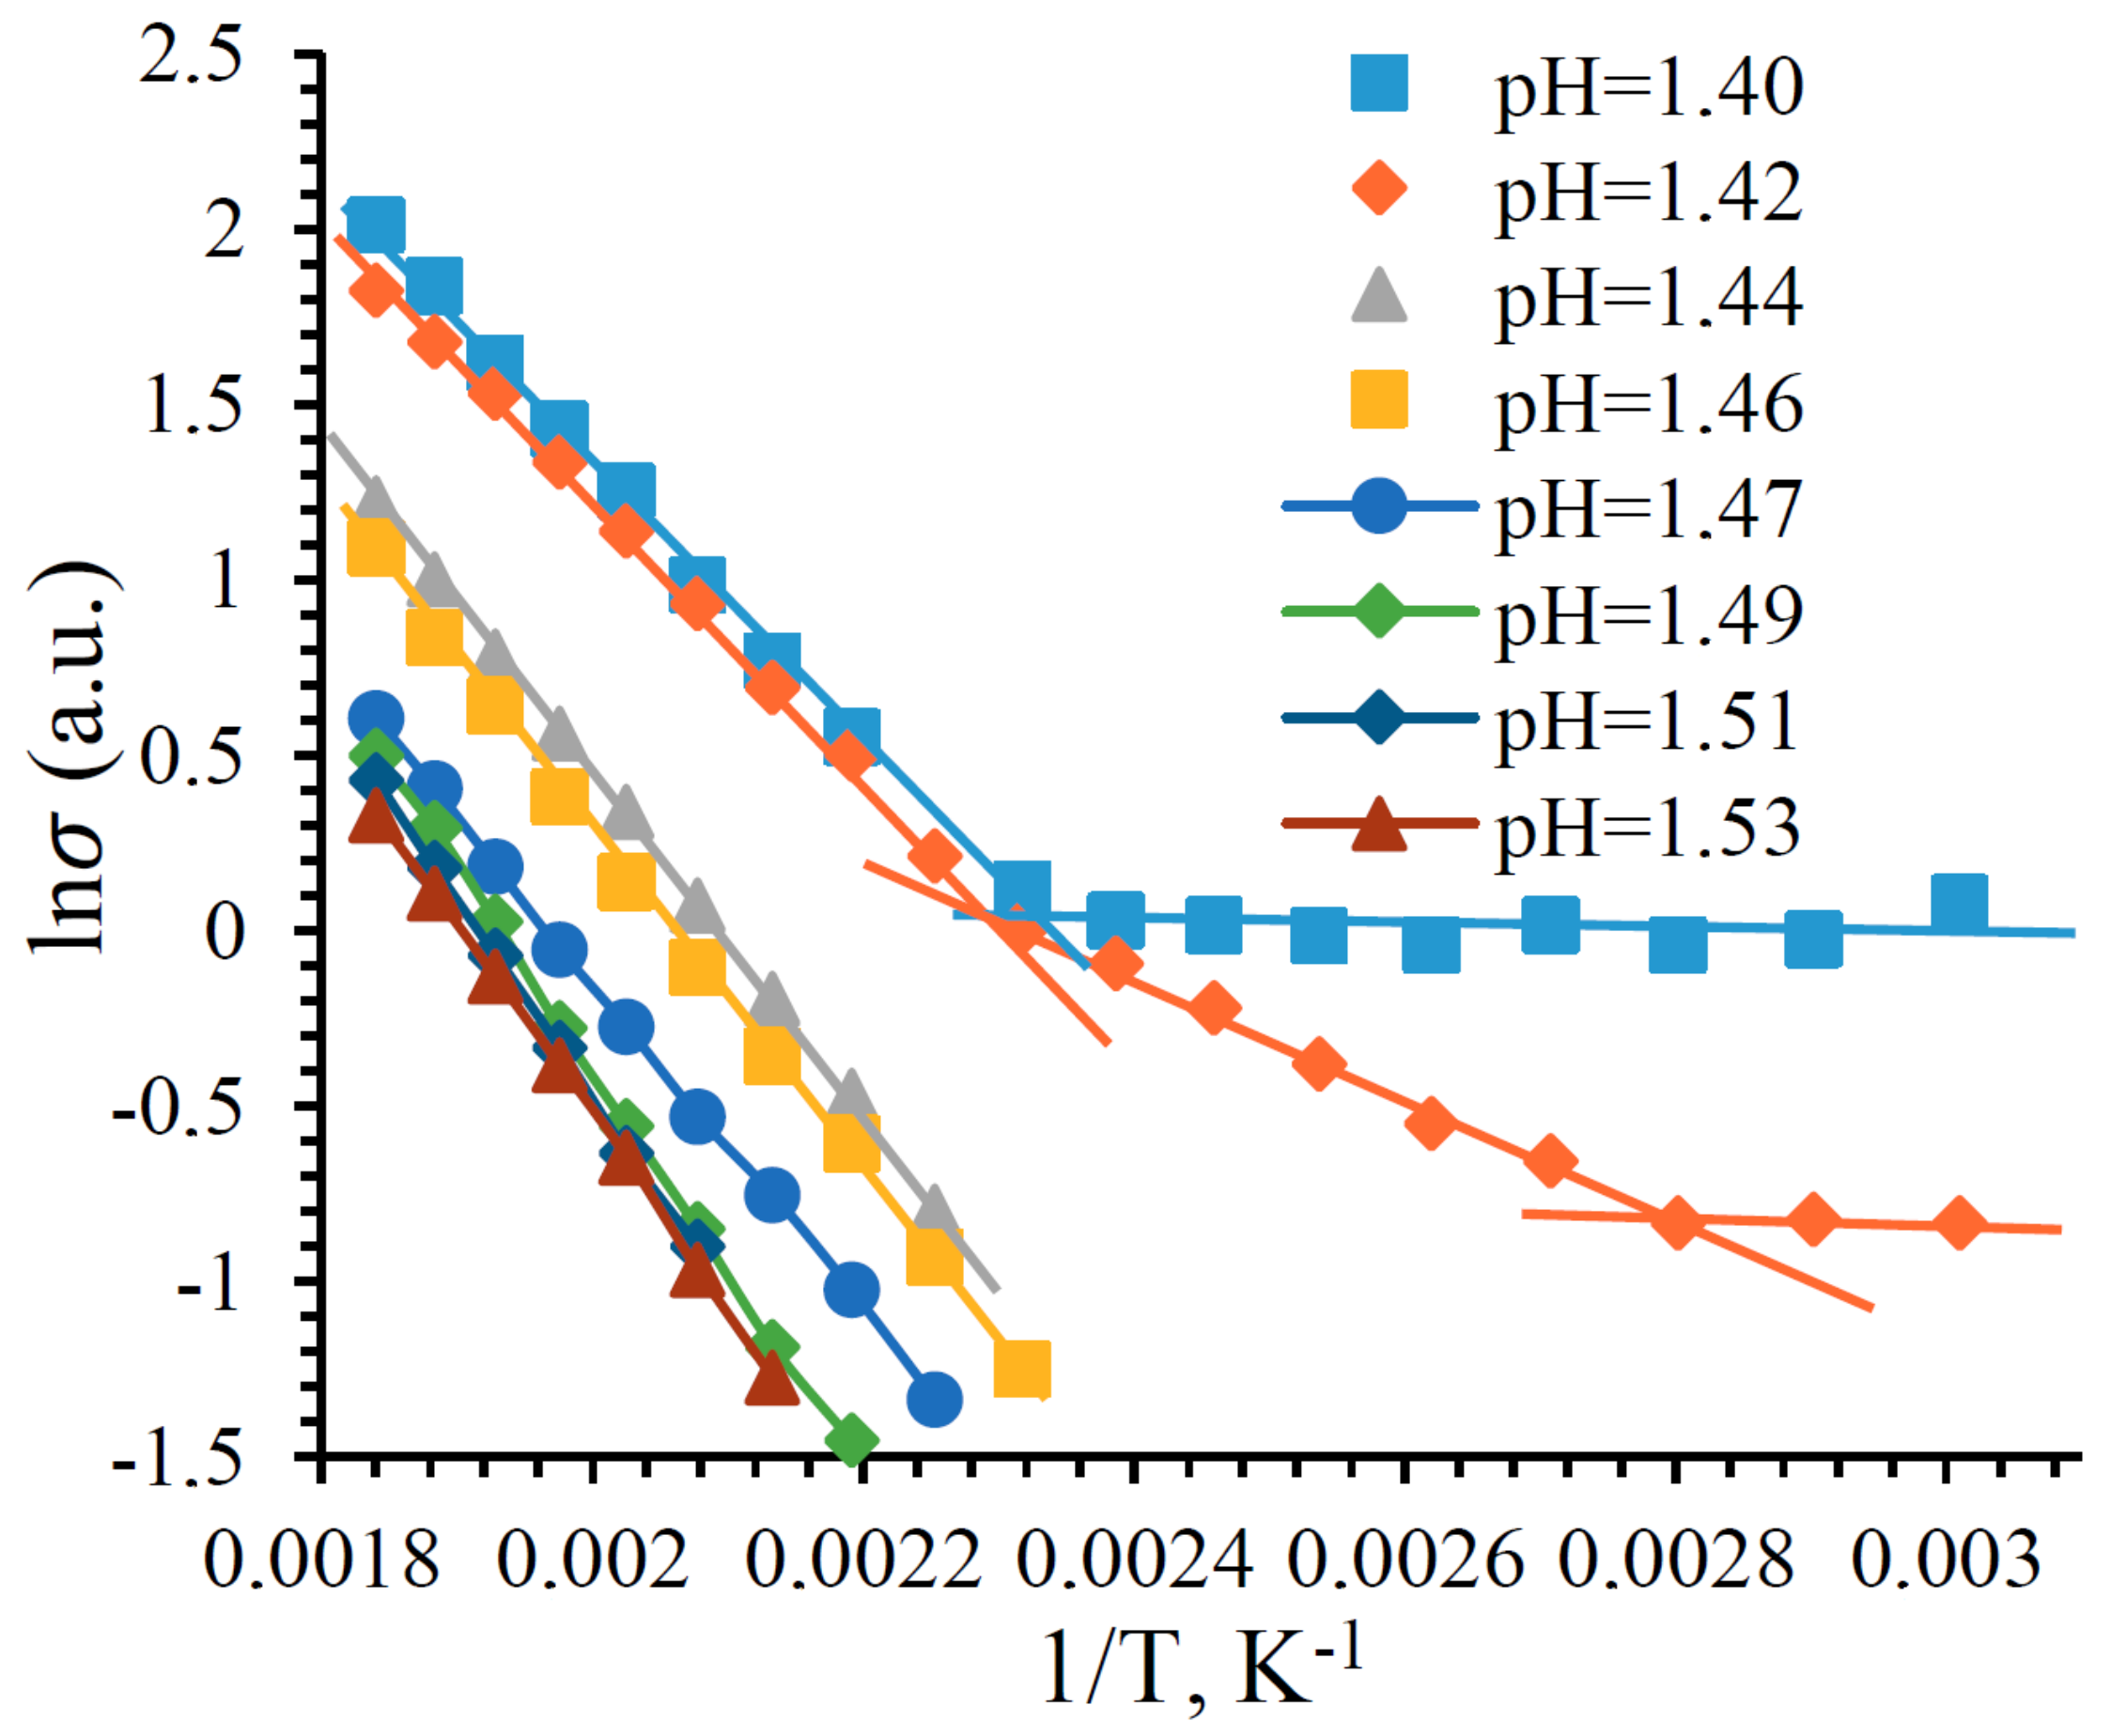
3.5. Investigation of the Electrophysical Properties of the Deposited Films
4. Conclusions
Author Contributions
Funding
Institutional Review Board Statement
Informed Consent Statement
Data Availability Statement
Conflicts of Interest
References
- Masalovich, M.; Ivanova, A.; Zagrebelnyy, O.; Nikolaev, A.; Galushko, A.; Baranchikov, A.; Loginov, V.; Shilova, O.; Kruchinina, I. Fabrication of composite electrodes based on cobalt (II) hydroxide for microbiological fuel cells. J. Sol–gel Sci. Technol. 2019, 92, 506–514. [Google Scholar] [CrossRef]
- Ganbavle, V.V.; Kalekar, A.S.; Harale, N.S.; Patil, S.S.; Dhere, S.L. Rapid synthesis of ambient pressure dried tetraethoxysilane based silica aerogels. J. Sol–gel Sci. Technol. 2021, 97, 5–10. [Google Scholar] [CrossRef]
- Gubanova, N.N.; Matveev, V.A.; Shilova, O.A. Bimetallic Pt/Pd nanoparticles in sol–gel-derived silica films and xerogels. J. Sol–Gel Sci. Technol. 2019, 92, 367–375. [Google Scholar] [CrossRef]
- Shilova, O.A.; Gubanova, N.N.; Matveev, V.A.; Ivanova, A.G.; Arsentiev, M.Y.; Pugachev, K.E.; Ivankova, E.M.; Kruchinina, I.Y. Processes of film-formation and crystallization in catalytically active “spin-on glass” silica films containing Pt and Pd nanoparticles. J. Mol. Liq. 2019, 288, 110996. [Google Scholar] [CrossRef]
- Lodh, S.; Ghosh, R.; Chakraborty, R. Studies on high refractive index amorphous TiO2 thin film for possible improvement of light extraction efficiency in organic light emitting diodes. Opt. Eng. 2020, 59, 1107104. [Google Scholar] [CrossRef]
- Yan, M.; Wu, Y.; Liu, X. Photocatalytic nanocomposite membranes for high-efficiency degradation of tetracycline under visible light: An imitated core-shell Au-TiO2-based design. J. Alloys Compd. 2021, 855, 157548. [Google Scholar] [CrossRef]
- Gordillo, M.A.; Panda, D.K.; Saha, S. Efficient MOF-Sensitized Solar Cells Featuring Solvothermally Grown [100]-Oriented Pillared Porphyrin Framework-11 Films on ZnO/FTO Surfaces. ACS Appl. Mater. Interfaces 2019, 11, 3196–3206. [Google Scholar] [CrossRef] [PubMed]
- Ren, S.Q.; Li, H.Y.; Lei, C.; Li, C.Q.; Yin, X.H.; Wu, L.L.; Li, W.; Zhang, J.Q.; Wang, W.W.; Feng, L.H. Interface modification to enhance electron extraction by deposition of a ZnMgO buffer on SnO2-coated FTO in CdTe solar cells. Sol. Energy 2019, 177, 545–552. [Google Scholar] [CrossRef]
- Hossain, M.S.; Rahman, K.S.; Islam, M.A.; Akhtaruzzaman, M.; Misran, H.; Alghoul, M.A.; Amin, N. Growth optimization of ZnxCd1-xS films on ITO and FTO coated glass for alternative buffer application in CdTe thin film solar cells. Opt. Mater. 2018, 86, 270–277. [Google Scholar] [CrossRef]
- Cirocka, A.; Zarzeczanska, D.; Wcislo, A.; Ryl, J.; Bogdanowicz, R.; Finke, B.; Ossowski, T. Tuning of the electrochemical properties of transparent fluorine-doped tin oxide electrodes by microwave pulsed-plasma polymerized allylamine. Electrochim. Acta 2019, 313, 432–440. [Google Scholar] [CrossRef]
- Dong, Y.; Komarneni, S.; Wang, N.; Hu, W.C.; Huang, W.Y. An in situ anion exchange induced high-performance oxygen evolution reaction catalyst for the pH-near-neutral potassium borate electrolyte. J. Mater. Chem. A 2019, 7, 6995–7005. [Google Scholar] [CrossRef]
- Kiliç, C.; Zunger, A. Origins of coexistence of conductivity and transparency in SnO2. Phys. Rev. Lett. 2002, 88, 095501. [Google Scholar] [CrossRef] [PubMed] [Green Version]
- Pronin, I.A.; Yakushova, N.D.; Karmanov, A.A.; Averin, I.A.; Moshnikov, V.A. Forms and concentration of adsorbed oxygen on the modified surface of SnO2. IOP Conf. Ser. J. Phys. Conf. Ser. 2019, 1313, 012044. [Google Scholar] [CrossRef]
- Nomura, K. Magnetic properties and oxygen defects of dilute metal doped tin oxide based semiconductor. Croat. Chem. Acta 2015, 88, 579–590. [Google Scholar] [CrossRef]
- Ponomareva, A.A.; Moshnikov, V.A.; Suchaneck, G. Mesoporous sol–gel deposited SiO2-SnO2 nanocomposite thin films. IOP Conf. Ser. Mater. Sci. Eng. 2012, 30, 012003. [Google Scholar] [CrossRef]
- Subramaniam, M.P.; Arunachalam, G.; Kandasamy, R.; Veluswamy, P.; Hiroya, I. Effect of pH and annealing temperature on the properties of tin oxide nanoparticles prepared by sol–gel method. J. Mater. Sci. Mater. Electron. 2018, 29, 658–666. [Google Scholar] [CrossRef]
- Dmitrieva, E.A.; Mukhamedshina, D.M.; Mit’, K.A.; Beisenkhanov, N.B. The effect of NH4F and NH4OH on the structure and physical properties of thin SnO2 films synthesized by the sol–gel method. Glass Phys. Chem. 2014, 40, 31–36. [Google Scholar] [CrossRef]
- Chen, H.; Wang, X.; Guan, L.; Chen, L.; Tao, J. Surface engineering of layered SnO micro-plates for impressive high supercapacitor performance. Mater. Chem. Phys. 2019, 238, 121889. [Google Scholar] [CrossRef]
- Maho, A.; Cabezas, C.A.S.; Meyertons, K.A.; Reimnitz, L.C.; Sahu, S.; Helms, B.A.; Milliron, D.J. Aqueous Processing and Spray Deposition of Polymer-Wrapped Tin-Doped Indium Oxide Nanocrystals as Electrochromic Thin Films. Chem. Mater. 2020, 32, 8401–8411. [Google Scholar] [CrossRef]
- Karthik, T.V.K.; Maldonado, A.; de la L. Olvera, M. Synthesis of Tin Oxide Powders by Homogeneous Precipitation. Structural and Morphological Characterization. In Proceedings of the 9th International Conference on Electrical Engineering, Computing Science and Automatic Control, Mexico City, Mexico, 26–28 September 2012. [Google Scholar]
- Suikovskaya, N.V. Chemical Methods for Producing Thin Transparent Films; Lenizdat: St. Petersburg, Russia, 1971; p. 200. [Google Scholar]
- Dmitriyeva, E.A.; Mukhamedshina, D.M.; Mit, K.A.; Lebedev, I.A.; Girina, I.I.; Fedosimova, A.I.; Grushevskya, E.A. Ammonia sensors on the base of gadolinium doped tin oxide thin films and its characterization: Effect of doping concentration. News Natl. Acad. Sci. Repub. Kazakhstan (Ser. Geol. Tech. Sci.) 2019, 433, 73–79. Available online: www.geolog-technical.kz/images/pdf/g20191/231-241.pdf (accessed on 27 April 2022). [CrossRef]
- Maheswari, S.; Karunakaran, M.; Chandrasekar, L.B.; Kasirajan, K. Ammonia sensors on the base of gadolinium doped tin oxide thin films and its characterization: Effect of doping concentration. Phys. B Condens. Matter 2021, 602, 412477. [Google Scholar] [CrossRef]
- Temiraliev, A.; Tompakova, N.; Fedosimova, A.; Dmitriyeva, E.; Lebedev, I.; Grushevskaya, E.; Mukashev, B.; Serikkanov, A. Birth and fusion in a sol–gel process with low diffusion. Eurasian Phys. Tech. J. 2020, 17, 132–137. [Google Scholar] [CrossRef]
- Fedosimova, A.I.; Dmitrieva, E.A.; Lebedev, I.A.; Temiraliev, T.; Abishev, M.E.; Baitimbetova, B.A.; Ryabikinand, Y.A.; Serikkanov, A.S. Modeling the process of formation of fractal structures in thin films. IOP Conf. Ser. J. Phys. Conf. Ser. 2018, 1141, 012004. [Google Scholar] [CrossRef]
- Shilova, O.A. Fractals morphogenesis and triply periodic minimal surfaces in sol–gel-derived thin films. J. Sol–Gel Sci. Technol. 2020, 95, 599–608. [Google Scholar] [CrossRef]
- Pajarito, B.B.; Llorens, C.; Tsuzuki, T. Effects of ammonium chloride on the yield of carbon nanofiber aerogels derived from cellulose nanofibrils. Cellulose 2019, 26, 7727–7740. [Google Scholar] [CrossRef]
- Lee, S.G.; Han, S.B.; Lee, W.J.; Park, K.W. Effect of Sb-Doped SnO2 Nanostructures on Electrocatalytic Performance of a Pt Catalyst for Methanol Oxidation Reaction. Catalysts 2020, 10, 866. [Google Scholar] [CrossRef]
- Fernandes, P.A.; Shongalova, A.; da Cunha, A.F.; Teixeira, J.P.; Leitao, J.P.; Cunha, J.M.V.; Bose, S.; Salome, P.M.P.; Correia, M.R. Phase selective growth of Cu12Sb4S13 and Cu3SbS4 thin films by chalcogenization of simultaneous sputtered metal precursors. J. Alloys Compd. 2019, 797, 1359–1366. [Google Scholar] [CrossRef]
- Mukhamedshina, D.M.; Mit’, K.A.; Beisenkhanov, N.B.; Dmitriyeva, E.A.; Valitova, I.V. Influence of plasma treatments on the microstructure and electrophysical properties of SnOx thin films synthesized by magnetron sputtering and sol–gel technique. J. Mater. Sci.-Mater. Electron. 2008, 19, S382–S387. [Google Scholar] [CrossRef]
- Mukhamedshina, D.M.; Beisenkhanov, N.B.; Mit, K.A.; Dmitrieva, E.A.; Medetov, N.A. Application of thermal and plasma treatments for modification of SnO2 thin films properties. Perspekt. Mater. 2012, 1, 35–42. [Google Scholar]
- Vilca-Huayhua, C.A.; Paz-Corrales, K.J.; Aragon, F.F.H.; Mathpal, M.C.; Villegas-Lelovsky, L.; Coaquira, J.A.H.; Pacheco-Salazar, D.G. Growth and vacuum post-annealing effect on the structural, electrical and optical properties of Sn-doped In2O3 thin films. Thin Solid Films 2020, 709, 138207. [Google Scholar] [CrossRef]
- Batzill, M.; Diebold, U. The surface and materials science of tin oxide. Prog. Surf. Sci. 2005, 79, 47–154. [Google Scholar] [CrossRef]
- Baron, E.; Feneberg, M.; Goldhahn, R.; Deppe, M.; Tacken, F.; As, D.J. Optical evidence of many-body effects in the zincblende AlxGa1-xN alloy system. J. Phys. D Appl. Phys. 2021, 54, 025101. [Google Scholar] [CrossRef]
- Zhu, G.Y.; Fang, M.; He, S.Q.; Qin, F.F.; Yang, X.L.; Wang, Y.J.; Xu, C.X. Floating GaN whispering gallery mode micro-ring lasing with Burstein-Moss effect. AIP Adv. 2020, 10, 105023. [Google Scholar] [CrossRef]
- Li, K.F.; Gao, Q.; Zhao, L.; Liu, Q.Z. Electrical and Optical Properties of Nb-doped SrSnO3 Epitaxial Films Deposited by Pulsed Laser Deposition. Nanoscale Res. Lett. 2020, 15, 164. [Google Scholar] [CrossRef]
- Liu, C.; Yuan, Y.; Zhang, X.; Su, J.; Song, X.; Ling, H.; Liao, Y.; Zhang, H.; Zheng, Y.; Ta, J.L. Doping Effect on Structural and Optical Properties of InTe Thin Films. Nanomaterials 2020, 10, 1887. [Google Scholar] [CrossRef] [PubMed]
- Ch, L.; Fa, W.; He, J.; Ch, Y. Effects of different annealing temperatures on the physical, optical, and electrical characteristics and chemical bonds of Ga and FCo-doped ZnO films. J. Mater. Res. Technol. 2020, 9, 6331–6342. [Google Scholar] [CrossRef]
- Kwoka, M.; Lyson-Sypien, B.; Kulis, A.; Zappa, D.; Comini, E. Surface Properties of SnO2 Nanowires Deposited on Si Substrate Covered by Au Catalyst Studies by XPS, TDS and SEM. Nanomaterials 2018, 8, 738. [Google Scholar] [CrossRef] [Green Version]


| Acidity of the Film-Forming System | Optical Bandgap, eV | Δ, eV |
|---|---|---|
| 1.40 | 4.09 ± 0.005 | 0.49 ± 0.005 |
| 1.42 | 4.09 ± 0.005 | 0.49 ± 0.005 |
| 1.44 | 4.09 ± 0.005 | 0.49 ± 0.005 |
| 1.46 | 4.09 ± 0.005 | 0.49 ± 0.005 |
| 1.47 | 4.09 ± 0.005 | 0.49 ± 0.005 |
| 1.49 | 4.08 ± 0.005 | 0.48 ± 0.005 |
| 1.51 | 4.09 ± 0.005 | 0.49 ± 0.005 |
| 1.53 | 4.09 ± 0.005 | 0.49 ± 0.005 |
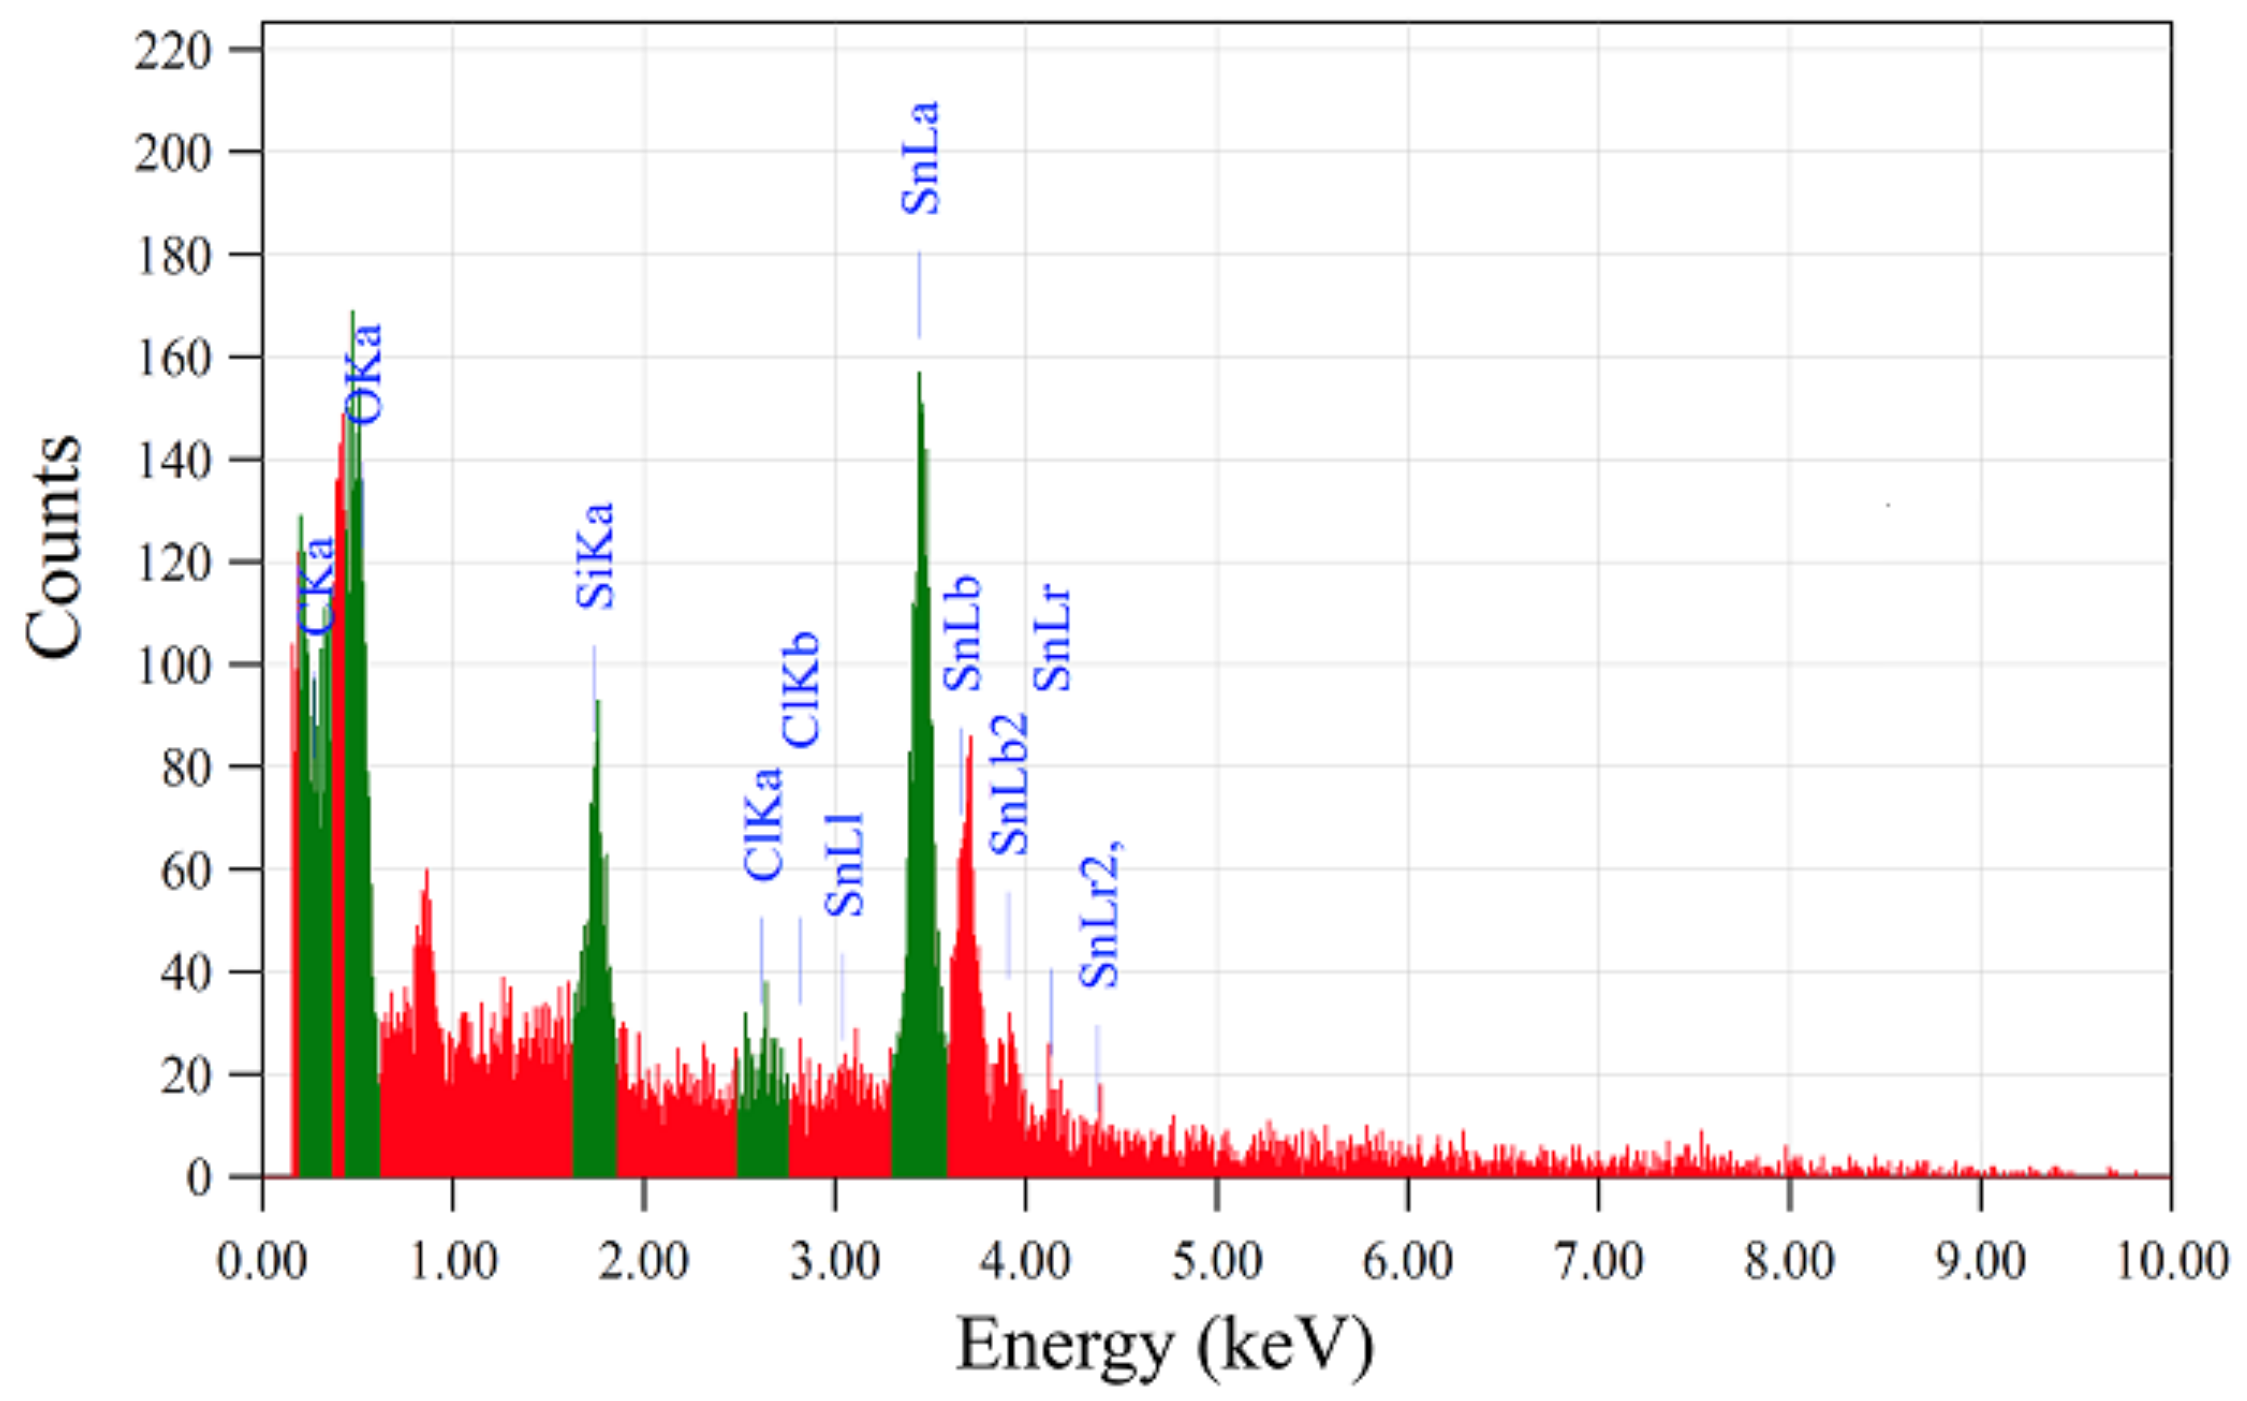
| Element | keV | Mass, % | Counts | Error, % |
|---|---|---|---|---|
| C | - | 0 | - | |
| O | 0.525 | 3.97 | 352.09 | 0.03 |
| Si | 1.739 | 4.66 | 462.55 | 0.06 |
| Cl | 2.621 | 1.03 | 70.40 | 0.33 |
| Sn | 3.443 | 90.33 | 1585.18 | 0.02 |
| Total | - | 100 | - | - |
| pH | , J | , eV | |
|---|---|---|---|
| 1.4 | 4040 ± 33 | 1.1151 ± 0.0091 | 0.697 ± 0.006 |
| 1.42 | 4040 ± 33 | 1.1151 ± 0.0091 | 0.697 ± 0.006 |
| 1.44 | 4918 ± 57 | 1.3576 ± 0.0158 | 0.848 ± 0.010 |
| 1.46 | 4918 ± 57 | 1.3576 ± 0.0158 | 0.848 ± 0.010 |
| 1.47 | 4827 ± 57 | 1.3323 ± 0.0156 | 0.833 ± 0.010 |
| 1.49 | 5883 ± 70 | 1.6237 ± 0.0195 | 1.015 ± 0.012 |
| 1.51 | 5634 ± 64 | 1.5552 ± 0.0178 | 0.972 ± 0.011 |
| 1.53 | 5480 ± 61 | 1.5125 ± 0.0170 | 0.945 ± 0.010 |
Publisher’s Note: MDPI stays neutral with regard to jurisdictional claims in published maps and institutional affiliations. |
© 2022 by the authors. Licensee MDPI, Basel, Switzerland. This article is an open access article distributed under the terms and conditions of the Creative Commons Attribution (CC BY) license (https://creativecommons.org/licenses/by/4.0/).
Share and Cite
Murzalinov, D.; Dmitriyeva, E.; Lebedev, I.; Bondar, E.A.; Fedosimova, A.I.; Kemelbekova, A. The Effect of pH Solution in the Sol–Gel Process on the Structure and Properties of Thin SnO2 Films. Processes 2022, 10, 1116. https://doi.org/10.3390/pr10061116
Murzalinov D, Dmitriyeva E, Lebedev I, Bondar EA, Fedosimova AI, Kemelbekova A. The Effect of pH Solution in the Sol–Gel Process on the Structure and Properties of Thin SnO2 Films. Processes. 2022; 10(6):1116. https://doi.org/10.3390/pr10061116
Chicago/Turabian StyleMurzalinov, Danatbek, Elena Dmitriyeva, Igor Lebedev, Ekaterina A. Bondar, Anastasiya I. Fedosimova, and Ainagul Kemelbekova. 2022. "The Effect of pH Solution in the Sol–Gel Process on the Structure and Properties of Thin SnO2 Films" Processes 10, no. 6: 1116. https://doi.org/10.3390/pr10061116
APA StyleMurzalinov, D., Dmitriyeva, E., Lebedev, I., Bondar, E. A., Fedosimova, A. I., & Kemelbekova, A. (2022). The Effect of pH Solution in the Sol–Gel Process on the Structure and Properties of Thin SnO2 Films. Processes, 10(6), 1116. https://doi.org/10.3390/pr10061116